Embed Size (px)
Citation preview

GOVERNMENT SECURITIES
MANAGEMENT January 8, 2016
Directorate of Government Debt Securities
Directorate General of Budget Financing and Risk Management
Ministry of Finance of The Republic of Indonesia

OUTLINE
1. Government Securities Management and
Financing Strategy 2016
2. Government Securities Performance
3. Crisis Management Protocol & Bond Stabilization
Framework
4. Debt Outstanding & Risk Profile
DISCLAIMER: This presentation does not constitute or form part of and should not be construed as an offer to sell or issue or the solicitation of an offer to buy or acquire securities of the Republic in any jurisdiction or as an inducement to enter into investment activity. No part of this presentation, nor the fact of its distribution, should form the basis of, or be relied on in connection with, any contract or commitment or investment decision whatsoever. This presentation is not and should not be construed as financial, legal, tax, investment or other product advice.
2

Divider title GOVERNMENT SECURITIES FINANCING
STRATEGY 2016

FINANCING TREND, 2004 – 2015
(trillion IDR)
Notes: * Revised Budget 2015 4
2004 2005 2006 2007 2008 2009 2010 2011 2012 2013 2014 2015*
Govt Securities - net 6.9 22.6 36.0 57.2 85.9 99.5 91.1 119.9 159.7 224.7 226.7 297.7
Domestic Loan - - - - - 0.4 0.6 0.8 0.5 1.0 1.7
External Loan - net (28.1) (10.3) (26.6) (26.6) (18.4) (12.4) (4.6) (17.8) (23.5) (5.8) (12.4) (20.0)
Others/Non-Debt - net 42.0 (1.2) 20.0 9.1 16.6 25.5 4.6 28.3 38.1 18.1 (4.3) (56.9)
Budget Defisit, % to GDP 1.1 0.5 0.9 1.3 0.1 1.6 0.7 1.1 1.8 2.3 2.3 1.9
1.1
0.5
0.9
1.3
0.1
1.6
0.7
1.1
1.8
2.3 2.3
1.9
(0.5)
-
0.5
1.0
1.5
2.0
2.5
-50
0
50
100
150
200
250

GENERAL DEBT FINANCING STRATEGY 2016
DEBT POLICY IN 2016 BUDGET
1. Manageable Debt-to-GDP
ratio 2. Financial inclusion &
market deepening
3. Debt issuance for productive
activity 4. Selective external loan
(infrastructure and energy
sector)
5. Loan as an alternative
instrument for financing
6. Active debt management
and ALM
5

Description 2016 BudgetA. Total Revenue 1,822.5
I. Domestic Revenue 1,820.5
1. Taxation 1,546.7
2. Non-Taxation 273.8
II. Grant 2.0
B. Government Spending 2,095.7
I. Central Government Spending 1,325.6
1. Ministerial Spending 784.1
2. Non-Ministerial Spending 541.4
II. Fund Transfer and Village Fund 770.2
C. Primary Balance (88.2)
D. Deficit (273.2)
Deficit to GDP (2.1%)
E. Financing 273.2
I. Domestic 272.8
a. Domestic Banks 5.5
b. Domestic Non-Banks 267.3
1. Government Securities (net) 327.2
2. Capital Injection (48.4)
II. Foreign 0.4
Surplus (Deficit) Funding
GOVERNMENT BUDGET FOR 2016
In IDR Trillion, where applicable
6

GOVERNMENT SECURITIES – INDICATIVE FINANCING
PLAN FOR 2016
Domestic Bonds
International Bonds Issuance (USD, EUR, JPY-denominated)
Weekly Auction:
Conventional securities:
23 x
Islamic securities: 23 x
Non-Auction:
Retail bonds: SR (Q1), SBR (Q2), Sukuk Tabungan
(Q3), and ORI (Q4)
Private Placement Based on request
Issuance of International Bonds as complement to avoid crowding out in domestic market and provide benchmark for corporate issuance, consists of USD, YEN or EURO global bonds
Maximum issuance international bond 30% from target gross
Issuance targets for GDS, Sukuk and ATM target
• Government Debt Securities (SUN): 76 %; • Sukuk: 24% • ATM for Goverrnment Securities (SBN) by auction: 10-12
years.
Instruments Indicative Target (IDR tn)
Preliminary Budget
Government Securities (Net) 327,224
Redemption 187,202
Cash Management 15,000
Buyback 3,000
Government Securities (Gross) 532,426
Composition
Domestic 76%
Auction 66%
Non-Auction 10%
International Bond 24%
7

*(Million IDR)
Budget 2016Realization
(a.o. Jan. 8, 2016)
% Realization to
Revised Budget
2016
Government Securities Net 327,224,357 66,735,500 20.39%
Government Securities Maturing in 2016 and Buyback 215,351,999 8,750,000 4.06%
Issuance Need for 2016 542,576,356 75,485,500 13.91%
Government Debt Securities (GDS) 74,485,500
Domestic GDS 26,000,000
-Coupon GDS 9,250,000
-Conventional T-Bills 2,750,000
-Private Placement 14,000,000
-Retail Bonds -
International Bonds 48,485,500
-USD GMTN 48,485,500
-Euro GMTN -
-Samurai Bonds -
-Domestic GDS -
Government Islamic Debt Securities 1,000,000
Domestic Government Islamic Debt Securities 1,000,000
- IFR/PBS/T-Bills Sukuk (Islamic Fixed Rated Bond/Project Based
Sukuk)
- Retail Sukuk
- Private Placement 1,000,000
Global Sukuk
2016 SECURITIES FINANCING REALIZATION
8

Divider title GOVERNMENT SECURITIES
PERFORMANCE

-10%
0%
10%
20%
30%
40%
50%
60%
-
10,000
20,000
30,000
40,000
50,000
60,000
70,000
80,000
90,000
Jan-15 Feb-15 Mar-15 Apr-15 May-15 Jun-15 Jul-15 Aug-15 Sep-15 Oct-15 Nov-15 Dec-15 5-Jan-16
Incoming Bids Awarded Bids Foreign Incoming Bids
Foreign Awarded Bids % Foreign Incoming Bids (RHS)
10
• In the first auction in 2016, foreign incoming bids is Rp6.01T. While during 2015, the average foreign incoming bids
reached 6.87T.
• In the first auction in 2016, total incoming bid = Rp26.20T. During 2015, average incoming bid = Rp20.84T
• In the first auction in 2016, total bid awarded = Rp12.00T. During 2015 average awarded bid = Rp10.59T.
Average incoming bid
2015 = Rp20.84T/auction
Average awarded bid
2015 = Rp10.59T/auction
GDS PRIMARY MARKET PERFORMANCE
as of Jan 5, 2016
10

0%
10%
20%
30%
40%
50%
60%
-
20,000
40,000
60,000
80,000
100,000
120,000
Jan-15 Feb-15 Mar-15 Apr-15 May-15 Jun-15 Jul-15 Aug-15 Sep-15 Oct-15 Nov-15 Dec-15 5-Jan-16
Incoming Bids Awarded Bids Foreign Incoming Bids Foreign Awarded Bids % Foreign Incoming Bids (RHS)
11
• Average bid to cover ratio 2015 = 2.08
• In the first auction in 2016, total incoming bid = Rp26.20T. During 2015, average incoming bid = Rp14.05T
• In the first auction in 2016, total bid awarded = Rp12.00T. During 2015 average awarded bid = Rp6.75T.
Average Awarded Bid
2015 = Rp6.75T
Average Incoming Bid
2015= Rp14.05T
Average Foreign Incoming
Bid 2015= Rp4.65T
GS PRIMARY MARKET PERFORMANCE
as of Jan 5, 2016
11

PRIMARY MARKET PERFORMANCE
GLOBAL BONDS 2016
12
RI0126 RI0146
Issuer
Issuer Ratings BB+ positive (S&P), Baa3 stable (Moody's), BBB- stable (Fitch) BB+ positive (S&P), Baa3 stable (Moody's), BBB- stable (Fitch)
Issue Ratings BB+ (S&P), Baa3 (Moody's), BBB- (Fitch) BB+ (S&P), Baa3 (Moody's), BBB- (Fitch)
Issue USD fixed rate USD fixed rate
Size USD 2,250,000,000.00 USD 1,250,000,000.00
Pricing / Settlement Date December 1 / December 8, 2015 December 1 / December 8, 2015
Maturity January 8, 2026 January 8, 2026
Coupon 4.75% payable semi annually 5.95% payable semi annually
Reoffer Yield / Price 4.800% / 99.599% 6.000% / 99.299%
Format Rule 144A/Reg S Rule 144A/Reg S
Listing SGX-ST SGX-ST
Total Book Order USD 5,500,000,000 USD 2,600,000,000
Distribution Indonesia 14%, Asia 10%, Europe 14%, USA 62% Indonesia 2%, Asia 22%, Europe 26%, USA 50%
Investor TypeFund/Asset Managers 75%, Banks 18%, Private Banks 1%,
Insurance/Pension Funds 4%, Central Banks/Sovereigen Funds 2%
Fund/Asset Managers 71%, Banks 6%, Private Banks 1%,
Insurance/Pension Funds 21%, Central Banks/Sovereigen Funds 1%
Republic of Indonesia
Summary Terms of Offering

2468
10121416182022
Jan'0
9
Apr'0
9
Jul'0
9
Oct'0
9
Jan'1
0
Apr'1
0
Jul'1
0
Oct'1
0
Jan'1
1
Apr'1
1
Jul'1
1
Oct'1
1
Jan'1
2
Apr'1
2
Jul'1
2
Oct'1
2
Jan'1
3
Apr'1
3
Jul'1
3
Oct'1
3
Jan'1
4
Apr'1
4
Jul'1
4
Oct'1
4
Jan'1
5
Apr'1
5
Jul'1
5
Oct'1
5
Jan'1
6
5Y 10Y 15Y 20Y
8.80 (5Y), 8.75 (10Y), 8.90 (15Y), 8.94 (20Y)
4.39 5.88 5.73 5.31
7.91 9.38
5.58
0.22
0.16 0.38 0.41
0.76 0.72
0.63
0.34
1.54 3.07
6.30
8.80
10.15
20.98
-
10.00
20.00
30.00
40.00
2010 2011 2012 2013 2014 2015 7-Jan-16
OUTRIGHT REPO BANK REPO BI
0
5
10
15
20
25
30
35
40
Spread (bid-ask)
As of January 8, 2016 [In Percentage]
Activities of the domestic bonds are growing Yields of Benchmark Series steadily decrease
Bid Ask Spread 10 Y Government Bond Turn Over 10 Y Government Bond
As of January 8, 2016
As of January 7, 2016
SECONDARY MARKET PERFORMANCE
Spread 8.752 bps (ask 8.707 bid
8.797)
13
5.12
7.04
5.15
14.12 12.88
10.75 10.53
3.29
-
3.00
6.00
9.00
12.00
15.00
2008 2009 2010 2011 2012 2013 2014 2015
-
2.0
4.0
6.0
8.0
10.0
12.0
14.0
16.0
18.0
20.0
22.0
1Y 2Y 3Y 4Y 5Y 6Y 7Y 8Y 9Y 10Y 15Y 20Y 30Y
11 Jan '16 4 Jan '16
8 Dec '15 9 Feb '12
23 Sep '11 27 Oct '08
13 Sep'05
[in percentage]
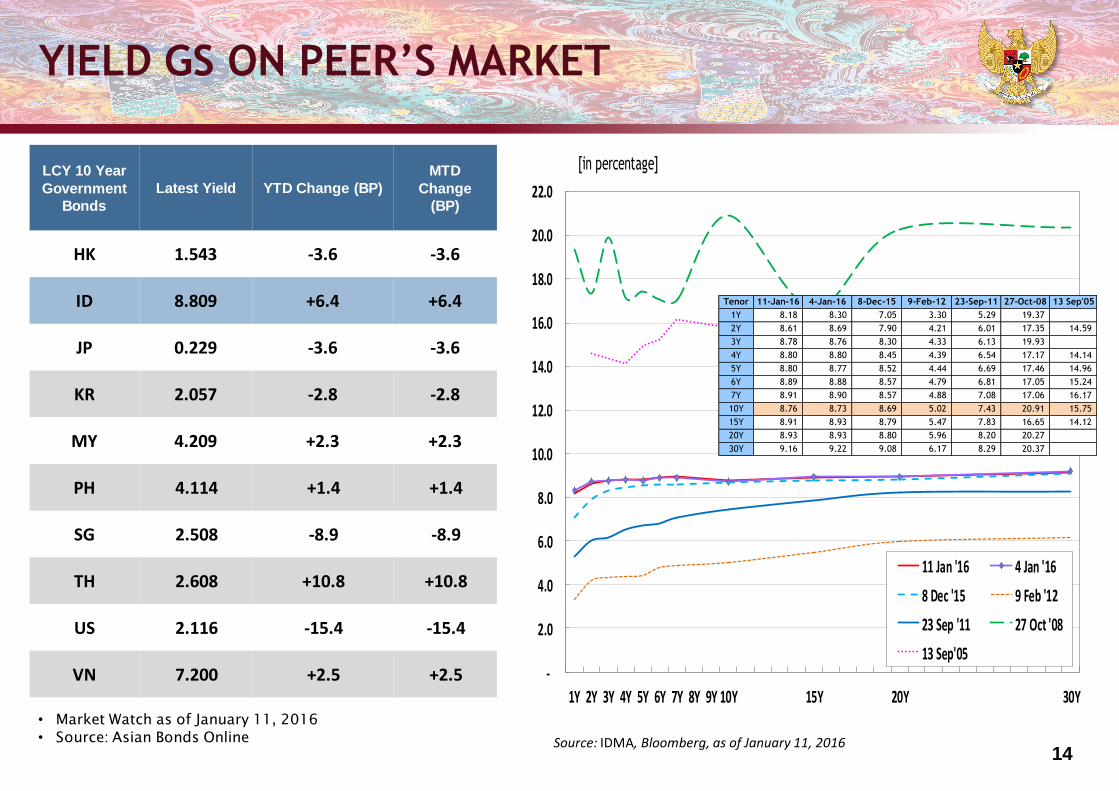
• Market Watch as of January 11, 2016
• Source: Asian Bonds Online
YIELD GS ON PEER’S MARKET
Source: IDMA, Bloomberg, as of January 11, 2016
LCY 10 Year
Government
Bonds
Latest Yield YTD Change (BP)
MTD
Change
(BP)
HK 1.543 -3.6 -3.6
ID 8.809 +6.4 +6.4
JP 0.229 -3.6 -3.6
KR 2.057 -2.8 -2.8
MY 4.209 +2.3 +2.3
PH 4.114 +1.4 +1.4
SG 2.508 -8.9 -8.9
TH 2.608 +10.8 +10.8
US 2.116 -15.4 -15.4
VN 7.200 +2.5 +2.5
Tenor 11-Jan-16 4-Jan-16 8-Dec-15 9-Feb-12 23-Sep-11 27-Oct-08 13 Sep'05
1Y 8.18 8.30 7.05 3.30 5.29 19.37
2Y 8.61 8.69 7.90 4.21 6.01 17.35 14.59
3Y 8.78 8.76 8.30 4.33 6.13 19.93
4Y 8.80 8.80 8.45 4.39 6.54 17.17 14.14
5Y 8.80 8.77 8.52 4.44 6.69 17.46 14.96
6Y 8.89 8.88 8.57 4.79 6.81 17.05 15.24
7Y 8.91 8.90 8.57 4.88 7.08 17.06 16.17
10Y 8.76 8.73 8.69 5.02 7.43 20.91 15.75
15Y 8.91 8.93 8.79 5.47 7.83 16.65 14.12
20Y 8.93 8.93 8.80 5.96 8.20 20.27
30Y 9.16 9.22 9.08 6.17 8.29 20.37
14

OWNERSHIP OF TRADABLE DOMESTIC
GOVERNMENT SECURITIES (in trillion Rp)
`
Banks 217,27 33,88% 265,03 36,63% 299,66 36,73% 335,43 33,70% 375,55 31,04% 372,66 29,95% 369,11 27,21% 413,99 28,79% 350,07 23,95% 435,84 29,75%
Govt Institutions (Bank Indonesia*) 17,42 2,72% 7,84 1,08% 3,07 0,37% 44,44 4,47% 41,63 3,44% 38,37 3,08% 80,58 5,94% 67,09 4,67% 148,91 10,19% 64,81 4,42%
Non-Banks 406,53 63,40% 450,75 62,29% 517,53 63,09% 615,38 61,83% 792,78 65,52% 833,42 66,97% 906,74 66,85% 956,85 66,54% 962,86 65,87% 964,44 65,83%
Mutual Funds 51,16 7,98% 47,22 6,53% 43,19 5,27% 42,50 4,27% 45,79 3,78% 47,16 3,79% 56,28 4,15% 59,47 4,14% 61,60 4,21% 61,82 4,22%
Insurance Company 79,30 12,37% 93,09 12,86% 83,42 10,17% 129,55 13,02% 150,60 12,45% 149,95 12,05% 161,81 11,93% 170,86 11,88% 171,62 11,74% 172,80 11,79%
Foreign Holders 195,76 30,53% 222,86 30,80% 270,52 32,98% 323,83 32,54% 461,35 38,13% 500,83 40,25% 537,53 39,63% 548,52 38,15% 558,52 38,21% 558,49 38,12%
Foreign Govt's&Central Banks** 50,06 6,10% 78,39 7,88% 103,42 8,55% 104,66 8,41% 102,34 7,54% 109,49 7,61% 110,32 7,55% 109,58 7,48%
Pension Fund 36,75 5,73% 34,39 4,75% 56,46 6,88% 39,47 3,97% 43,30 3,58% 43,00 3,46% 46,32 3,42% 48,69 3,39% 49,83 3,41% 50,27 3,43%
Securities Company 0,13 0,02% 0,14 0,02% 0,30 0,04% 0,88 0,09% 0,81 0,07% 0,65 0,05% 0,74 0,05% 0,15 0,01% 0,26 0,02% 0,19 0,01%
Individual 32,48 3,26% 30,41 2,51% 28,35 2,28% 32,23 2,38% 52,40 3,64% 42,53 2,91% 42,46 2,90%
Others 43,43 6,77% 53,05 7,33% 63,64 7,76% 46,68 4,69% 60,51 5,00% 63,49 5,10% 71,82 5,29% 76,76 5,34% 78,50 5,37% 78,42 5,35%
Total 641,21 100% 723,61 100% 820,27 100% 995,25 100% 1.209,96 100% 1.244,45 100% 1.356,43 100% 1.437,93 100% 1.461,85 100% 1.465,10 100%
1) Including ownership of SBSN (government sukuk).
2) Foreign are consisted of Private Banking, Fund/Asset Management, Securities, Insurance, Pension Fund.
3) Others are consisted of Corporation, Individual, Foundation.
*) Since February 8th, 2008, repo transaction of Government Securities to Bank Indonesia was included.
**) Since November 21, 2014, foreign government(s) was included to the same category as foreign central bank(s).
Dec-13Dec-12Dec-11Dec-10 Dec-14 Jan-15 Jun-15 Nov-15 Dec-15 Jan-7-2016
15

FOREIGN INVESTOR ACTIVITY (YEARLY)
Foreign Net Buy/Sell up to September (YTD) & yearly total (IDR) trillion)
Investors Net Buy/Sell (IDR trillion)
Source: Bank Indonesia
• Foreign investors (Asing) recorded a net buy of IDR0.13 trillion (year to date).
Note: as of November 25, 2015
2011 2012 2013 2014 2015 2016
Domestic 55.29 49.00 121.68 77.19 154.71 (0.13)
Foreign 27.10 47.67 53.31 137.52 97.17 0.13
Total 82.39 96.66 174.99 214.71 251.88 0.00
27.10
47.67
53.31
137.52
97.17
0.13
13.11
2.68
4.82
39.48
0.13
0 20 40 60 80 100 120 140 160
2011
2012
2013
2014
2015
2016
Januari YTD
16

90.1
108.4
141.5 136.5
156.4 169.5
180.4 185.1 190.6 191.3
27.9%
27.4%
21.9%22.6% 19.7% 18.4% 16.9%
16.7% 16.5% 17.9%
0%
5%
10%
15%
20%
25%
30%
35%
40%
45%
50%
0
20
40
60
80
100
120
140
160
180
200
2008 2009 2010 2011 2012 2013 Dec-14 Feb-15 Jun-15 Oct-15
Govt. Securities (GS) Bond Deposit Stock Mutual Funds Others Total Investment (in Trillion) % GS to Total Investment (RHS)
241.7
326.2356.5 361.4
497.0 505.5
552.3
610.1650.2 647.2
27.09%
24.01%
21.77%
24.11%
19.74%20.71%
12.79%
22.79% 22.86% 23.57%
0.00%
10.00%
20.00%
30.00%
0
100
200
300
400
500
600
700
2008 2009 2010 2011 2012 2013 Mar-14 Dec-14 May-15 Oct-15
Govt. Securities (GS) Bond Deposit Stock Mutual Funds Others Total Investment (in Trillion) % GS to Total Investment (RHS)
DOMESTIC INSTITUTIONAL INVESTORS
Insurance Company
Source: Financial Service Authority (OJK), data processsed
Pension Fund
17

FOREIGN INVESTOR ACTIVITY
Net Buyer (Seller) - Non Resident Foreign Ownership - Proportion by Tenor [In IDR Trillion]
Foreign investors mostly dominated by high quality long term investors
As of January 8, 2015
5,20% 4,65% 5,38% 4,45% 3,33% 3,31% 3,85% 3,23% 2,66%
5,41%3,73% 2,89%
2,34%1,54% 1,51% 1,54% 1,28% 1,25%
12,88% 15,23% 12,92%12,46%
11,43% 11,02% 12,30% 11,82% 12,00%
32,04% 33,58%34,88%
36,18%39,69% 39,50%
36,98%38,98% 39,16%
44,46% 42,81% 43,94% 44,56% 44,00% 44,67% 45,33% 44,68% 44,93%
32,54%
38,13% 38,61% 39,63%37,59% 37,10% 38,15% 38,21% 38,17%
0%
20%
40%
60%
80%
100%
Dec 13 Dec 14 Mar-15 Jun-15 Sep-15 Oct-15 Nov-15 Dec-15 Jan-8'15
0-1 ≥1-2 ≥2-5 ≥5-10 ≥10 %Foreign Ownership of Total
2,68
8,44
(0,88)
17,97
4,22
(19,98)
2,81
(1,76)
10,13
23,98
6,08
(0,37)
4,82
16,49 15,77 16,10
20,15
6,43
14,67 15,95
13,17 12,49
21,34
(19,84)
39,48
6,84
(3,59)
4,10 6,31
23,04
(3,90)
(7,96)
(2,30)
5,39
8,38
21,37
-0,08
-0,06
-0,04
-0,02
0
0,02
0,04
0,06
0,08
0,1
(30,00)
(20,00)
(10,00)
0,00
10,00
20,00
30,00
40,00
50,00
Jan
-13
Ma
r-1
3
Ma
y-1
3
Jul-
13
Se
p-1
3
No
v-1
3
Jan
-14
Ma
r-1
4
Ma
y-1
4
Jul-
14
Se
p-1
4
No
v-1
4
Jan
-15
Ma
r-1
5
Ma
y-1
5
Jul-
15
Se
p-1
5
No
v-1
5
Jan
-16
Capital Inflows [LHS] capital inflows over foreign [RHS]
18

Divider title CRISIS MANAGEMENT PROTOCOL&
BOND STABILIZATION FRAMEWORK

Pre-emptive Measures
Implementing Crisis Management Protocol
(CMP)
Implementing Bond Stabilization Framework
(BSF)
Enhancing coordination between government
institutions and continuous dialogue with market
participants
Specific policies in place to address crises
enacted in 2016 budget law
Swap facility arrangements based on international cooperation
Crisis Management Protocol
Indicators to determine crisis level of
Government Securities Market condition (normal,
aware, alert, crisis)
Several market indicators that are monitored
daily:
- Yield of benchmark series;
- Exchange rate;
- Jakarta Composite Index;
- Foreign ownership in government securities
Policies to address the crisis at every level :
- Repurchase the government securities at
secondary market
- Postpone or stop the issuance
First Line of Defense
State’s Budget
Buyback fund at DG of Budget Financing
and Risk Management
Investment fund at Public Service Agency
(BLU) (min. level Aware)
State Owned Enterprises
(BUMN)’s Budget Related BUMNs (min. level Aware)
Social Security Organizing
Agency (BPJS)’s Budget BPJS (min. level Aware)
Second Line of Defense
State’s Budget
State General Treasury Account
(Rekening KUN) (min. level Alert)
Accumulated cash surplus (SAL) (min.
Level Crisis)
State Owned Enterprises
(BUMN)’s Budget Related BUMNs (min. level Alert)
Social Security Organizing
Agency (BPJS)’s Budget BPJS (min. level Alert)
Bond Stabilization Framework
Implement Measures to Manage External Volatility …to mitigate sudden reversals
20

Divider title DEBT OUTSTANDING &
RISK PROFILE

- 20 40 60 80
100 120 140 160 180 200 220 240
2015
2016
2017
2018
2019
2020
2021
2022
2023
2024
2025
2026
2027
2028
2029
2030
2031
2032
2033
2034
2035
2036
2037
2038
2039
2040
2041
2042
2043
2044
2045
2046
-206
0
Loan Gov't Sec
020406080
100120140160180200220240
2015
2016
2017
2018
2019
2020
2021
2022
2023
2024
2025
2026
2027
2028
2029
2030
2031
2032
2033
2034
2035
2036
2037
2038
2039
2040
2041
2042
2043
2044
2045
2046
-206
0
Domestic Foreign
TOTAL DEBT MATURITY PROFILE AS OF
END OF NOVEMBER, 2015
Maturity Profile of Central Government by Instruments (in trillion IDR)
Maturity Profile of Central Government by Currencies (in trillion IDR)
44%56%
Foreign Domestic
76%
24%
Gov't Sec Loan
22

Notes: • * Preliminary Figures
OUTSTANDING CENTRAL GOVERNMENT DEBT
BY INSTRUMENT
Nominal %
a. Foreign Loan (in billion USD) 68,6 68,4 63,6 58,4 53,9 53,6 24,1%
Bilateral 42,3 42,1 37,2 31,5 26,7 24,6 11,1%
Multilateral 23,2 23,5 23,8 23,7 23,5 25,5 11,5%
Commercial 3,0 2,8 2,5 3,3 3,7 3,5 1,6%
Suppliers 0,1 0,1 0,0 0,0 0,0 0,0 0,0%
b Domestic Loan (in billion USD) 0,0 0,1 0,19 0,2 0,2 0,3 0,1%
c. Government Securities (in billion USD) 118,4 131,0 140,8 136,3 155,2 168,3 75,7%
Foreign Currency Denominated 18,0 21,6 27,4 32,8 36,7 44,1 19,9%
Rupiah Denominated 100,4 109,4 113,4 103,5 118,5 124,1 55,9%
Total Central Government Debt
(in billion USD)187,0 199,5 194,9 209,4 222,2
Total Central Government Debt
(in trilion IDR)1.681,7 1.808,9 2.375,5 2.604,9 3.074,8
Exchange Rate Assumption (IDR/USD1) 8.991,0 9.068,0 12.189,0 12.440,0 13.840,0
GDP (in trillion IDR) 6.864,1 7.831,7 9.524,7 10.542,7
Debt to GDP Ratio 24,5% 23,1% 23,0% 24,9% 24,7%
8.615,7
9.670,0
1.977,7
Nov-15
204,5
2011 2012 2013 20142010Description
23

Notes: • * Preliminary Figures
OUTSTANDING CENTRAL GOVERNMENT DEBT
BY CURRENCY
2010 2011
Original Currency
IDR (in trillion) 902,6 993,0 1.098,0 1.263,9 1.477,5 1.722,1
Gov't Securities 902,4 992,0 1.096,2 1.261,7 1.474,6 1.718,2
Loan 0,2 1,0 1,8 2,2 2,9 3,9
USD (in billion) 39,6 43,9 49,8 56,8 61,0 69,1
Gov't Securities 16,9 20,4 25,6 31,3 34,2 39,7
Loan 22,8 23,5 24,2 25,4 26,8 29,4
JPY (in billion) 2.689,8 2.589,8 2.498,8 2.395,3 2.204,0 2.183,5
Gov't Securities 95,0 95,0 155,0 155,0 155,0 255,0
Loan 2.594,8 2.494,8 2.343,8 2.228,8 2.049,0 1.928,5
EUR (in billion) 5,4 5,0 4,5 4,2 5,1 6,1
Gov't Securities - - - - 1,0 2,3
Loan 5,4 5,0 4,5 4,2 4,1 3,9
Other currencies
Equivalent in Billion USD
IDR 100,4 109,5 113,5 103,7 118,8 124,4 56,0%
USD 39,8 43,9 49,8 56,8 61,0 69,1 31,1%
JPY 33,1 33,4 29,1 22,8 18,5 17,8 8,0%
EUR 7,2 6,4 6,0 5,8 6,2 6,5 2,9%
Other currencies 6,5 6,3 6,1 5,8 5,0 4,4 2,0%
Total Eq. in Billion USD 187,0 199,5 204,5 194,9 209,4 222,2
Equivalent in Trillion IDR
IDR 902,8 993,0 1.098,0 1.263,9 1.477,5 1.722,1
USD 357,6 397,9 481,9 692,0 758,3 955,9
JPY 297,6 302,5 281,2 278,3 229,8 246,2
EUR 65,0 58,5 57,5 71,1 76,9 89,9
Other currencies 58,6 57,1 59,1 70,2 62,4 60,7
Total Eq. in Trillion IDR 1.681,7 1.808,9 1.977,7 2.375,5 2.604,9 3.074,8
Foreign Currency Portion 46,3% 45,1% 44,5% 46,8% 43,3% 44,0%
Exchange Rate Assumption USD/IDR 8.991 9.068 9.670 12.189,0 12.440,0 13.840,0
----------------Multiple Currencies -----------------------
2014 Nov-152012 2013
24

CENTRAL GOVERNMENT DEBT RATIOS
Debt to GDP Ratio Interest Payment to Revenue and
Expenditure Ratio
Debt Service to GDP Ratio Interest Payment to Tax Revenue &
Central Government Expenditure Ratio
Notes: Using GDP at Current Market Prices [2010 Version] * Preliminary Figures 25
23.1% 23.0%24.9% 24.7% 24.7%
0%
5%
10%
15%
20%
25%
30%
2011 2012 2013 2014 2015*
7.7%
7.5%
7.9% 8.6%
8.8%
7.2%
6.7%
6.8% 7.5%
7.8%
0%
1%
2%
3%
4%
5%
6%
7%
8%
9%
10%
2011 2012 2013 2014 2015*
Interest to Revenue Interest to Expenditure
2.9%3.2%
2.9%
3.5%3.2%
0%
1%
2%
3%
4%
2011 2012 2013 2014 2015*
10.7
%
10.8
%
10.5
%
11.6
%
10.5
%
10.6
%
9.9%
9.9%
11.1
% 11.8
%
9%
10%
10%
11%
11%
12%
12%
2011 2012 2013 2014 2015*
to Tax Revenue to Central Gov't Expenditure

RISK INDICATORS
Risk indicators are improving amidst pressure from rupiah depreciation Risk indicators show improvements in interest rate risk and stability in exchange and refinancing risks
26

Divider title
Directorate General of Budget Financing and Risk Management Ministry of Finance of Republic of Indonesia
Directorate of Government Debt Securities
Frans Seda building, 4th floor, Jl. Wahidin Raya No. 1, Jakarta Pusat – Postal Code: 10710
Phone: +6221 3810175 Fax. : +6221 3846516
Website: www.djppr.kemenkeu.go.id
END OF PRESENTATION