Embed Size (px)
Citation preview

1
Government of Kenya Adaptation Technical Analysis
Technical Report 8:
Availability and Accessibility to Climate Data for Kenya

2

3
Government of Kenya Adaptation Technical Analysis
Technical Report 8:
Availability and Accessibility to Climate Data for Kenya

4
This document is an output from a project funded by the UK Department for International Development (DFID) and the Netherlands Directorate-General for International Cooperation (DGIS) for the benefit of developing countries. However, the views expressed and information contained in it are not necessarily those of or endorsed by DFID, DGIS or the entities managing the delivery of the Climate and Development Knowledge Network*, which can accept no responsibility or liability for such views, completeness or accuracy of the information or for any reliance placed on them.
© 2012, All rights reserved
* The Climate and Development Knowledge Network (“CDKN”) is a project funded by the UK Department for International Development (DFID) and the Netherlands Directorate-General for International Cooperation (DGIS) and is led and administered by PricewaterhouseCoopers LLP. Management of the delivery of CDKN is undertaken by PricewaterhouseCoopers LLP, and an alliance of organisations including Fundación Futuro Latinoamericano, INTRAC, LEAD International, the Overseas Development Institute, and SouthSouthNorth.

5
Report prepared by:
LTS International
Pentlands Science Park, Bush Loan, Penicuik, EH26 0PL, UK
Tel: +44.131.440.5500
Fax: +44.131.440.5501
Skype: LTSInternational
Website: www.ltsi.co.uk
Acclimatise
Hexgreave Hall, Farnsfield, Newark, Nottinghamshire
NG22 8LS, UK
Tel: +44 (0) 1623 884347
Website: www.acclimatise.uk.com

6
Contents
List of Abbreviations ...................................................................................................................... 9
Executive Summary ....................................................................................................................... 11
1. Introduction .......................................................................................................................... 12
1.1 Agriculture ..................................................................................................................... 12
1.2 Livestock ........................................................................................................................ 13
1.3 Water resources ............................................................................................................. 13
1.4 Energy resources ........................................................................................................... 13
1.5 Manufacturing ............................................................................................................... 13
1.6 Transport ....................................................................................................................... 13
1.7 Tourism .......................................................................................................................... 14
1.8 Public health and safety ................................................................................................ 14
1.9 Human settlements ....................................................................................................... 14
1.10 Desertification ............................................................................................................... 14
1.11 Disaster risks ................................................................................................................. 15
2. Availability of Data from Kenya Meteorological Department (KMD)............................... 16
2.1 Surface and upper air data ............................................................................................ 16
2.2 Availability of agro-meteorological data .......................................................................17
2.3 Data collected by volunteer observers ......................................................................... 19
2.4 Data on climate trends .................................................................................................. 19
2.5 Strength and weakness of data collected by KMD ...................................................... 20
2.5.1 Strength of the data ............................................................................................... 20
2.5.2 Weakness of the data ............................................................................................. 20
2.6 Accessibility of climate data from KMD ...................................................................... 21
2.7 Accessibility of weather and climate information by the general public ................... 21
3. Availability of Hydrometeorological Data from Water Resources Management Authority (WRMA) ........................................................................................................................................ 23
3.1 Strength of hydrological data ....................................................................................... 23
3.2 Weakness of the hydrological data ............................................................................... 23
3.3 Accessibility of hydrological data ................................................................................. 24
4. Availability of Data on Crop Yield Assessment from US-Food Early Warning System Network (US-FEWSNET) ............................................................................................................ 25
4.1 The strength of the information ................................................................................... 25
4.2 The weakness of the information ................................................................................. 25
4.3 Accessibility of the information by the general public ............................................... 25
5. Availability of Satellite Derived Data ................................................................................... 26
5.1 Data from KMD ............................................................................................................. 26
5.2 Data from Department of Resources Survey and Remote Sensing (DRSRS) ........... 26

7
5.3 Strength of the satellite data ......................................................................................... 26
5.4 Weakness of the data .................................................................................................... 26
5.5 Accessibility of the DRSRS data by the general public ............................................... 27
6. Availability of Data from Climate Models by Local Institutions ....................................... 28
6.1 The strength of the data from the models ................................................................... 28
6.2 Weakness of the data from the models ........................................................................ 28
6.3 Accessibility of the data ................................................................................................ 28
7. Availability of data from Global Atmosphere Watch (GAW) Station ................................ 29
7.1 Strength of the data ....................................................................................................... 29
7.2 Weakness of the data .................................................................................................... 29
7.3 Accessibility of the data ................................................................................................ 29
8. Availability of Urban Climate Data ...................................................................................... 30
8.1 Strength of the data ....................................................................................................... 30
8.2 Weakness of the data .................................................................................................... 30
8.2.1 Accessibility of the data ......................................................................................... 30
9. Description of Some Climate Models That Are Being Applied in Kenya .......................... 31
9.1 Introduction ................................................................................................................... 31
9.2 PRECIS- Regional Climate Model ................................................................................ 31
9.2.1 Model strength ....................................................................................................... 32
9.2.2 Model weakness ..................................................................................................... 32
9.3 Model for the Assessment of Greenhouse Gas Induced Climate Change/Scenario Generator (MAGGICC/SCENGEN) ......................................................................................... 32
9.3.1 Model strength ....................................................................................................... 34
9.3.2 Model weakness ..................................................................................................... 35
10. Institutional Set-Up .......................................................................................................... 36
10.1 Kenya Meteorological Department (KMD) ................................................................. 36
10.2 IGAD Climate Prediction and Application Centre (ICPAC) ....................................... 36
10.3 Department of Meteorology ......................................................................................... 36
11. International Cooperation in Data Exchange ................................................................. 37
12. Data Needs for Climate Change Research and Monitoring ........................................... 38
12.1 Global Climate Observing System (GCOS) Surface Network (GSN) and GCOS Upper Air Network (GUAN) ................................................................................................................ 38
12.2 Global Terrestrial Network for Hydrology .................................................................. 38
13. Capacity Needs at National Level..................................................................................... 40
13.1 Equipment Needs .......................................................................................................... 40
13.1.1 Climate surface and upper air observing networks ............................................. 40
13.1.2 Surface hydrological observations ........................................................................ 40
13.1.3 Monitoring and research in agro-meteorology .................................................... 41

8
13.1.4 Carbon Cycle Observation and Research ............................................................. 41
13.1.5 Global Atmosphere Watch (GAW) Station .......................................................... 41
13.1.6 Urban Climate and Air Pollution Monitoring ...................................................... 41
13.1.7 Volunteer Observer Program ................................................................................ 41
13.2 Training Needs .............................................................................................................. 42
14. Institutional Collaboration ............................................................................................... 43
15. Conclusions........................................................................................................................ 44
References ..................................................................................................................................... 45
Appendix 1: List of people interviewed ...................................................................................... 46

9
List of Abbreviations
AWOS Airport Weather Observing Stations
AWS Automatic Weather Station
CO2 Carbon Dioxide gas
CRF Coffee Research Foundation
DRSRS Department of Remote Sensing and Resource Survey
ENSO El-Nino/Southern Oscillation
GAW Global Atmosphere Watch
GCM Global Climate Model
GCOS Global Climate Observing System
GEF Global Environmental Facility
GHA Greater Horn of Africa
GPRS General Packet Radio Service
GSN Global Surface Network
GTOS Global Terrestrial Observing System
GTS Global Telecommunication System
GUAN Global Climate Observing System Upper Air Network
HADCM3 Hadley Centre Third Generation Climate Model
HYCOS Hydrological Climate Observing System
ICPAC IGAD Climate Prediction and Application Centre
IOD Indian Ocean Dipole
IPCC Inter-governmental Panel on Climate Change
ITCZ Inter-tropical Convergence Zone
JKIA Jomo Kenyatta International Airport
JKUAT Jomo Kenyatta University of Agriculture and Technology
KAM Kenya Association of Manufacturers
KARI Kenya Agricultural Research Institute
KEFRI Kenya Forestry Research Institute
KEMFRI Kenya Marine and Forestry Research Institute
KENGEN Kenya Energy Generation Company
KMD Kenya Meteorological Department
KSCRF Kenya Sugar Cane Research Foundation
KU Kenyatta University
LBC Lateral Boundary Conditions

10
MAGGICC/SCENGEN) Model for the Assessment of Greenhouse Gas Induced Climate Change/Scenario Generator
MSG Meteo-Sat Second Generation
MU Moi University
NDVI Normalized Vegetation Index
PRECIS Providing Regional Climates for Impacts Studies
QBO Quasi-Biennial Oscillation
RANET Radio Internet
RTH Regional Telecommunication Hub
SABSTA Subsidiary Body on Scientific and Technological Advice
TRF Tea Research Foundation
UNFCCC United Nations Framework Convention on Climate Change
UON University of Nairobi
USAID United States Agency for International Development
US-FEWSNET United States Food Early Warning System Network
UV Ultra Violet
VSAT Very Small Aperture Terminal
WHYCOS World Hydrological Climate Observing System
WMO World Meteorological Organisation
WRMA Water Resources Management Authority

11
Executive Summary
Kenya’s economic development is driven by climate. Therefore climate change has far reaching implications on socio-economic development of the country. Climate change poses great risks to the major sectors of the economy such as agriculture, livestock, water resources, energy resources and tourism. Adaptation to climate change is therefore critical to the country’s resilience to the associated impacts in order to sustain development. In order to formulate effective short, medium and longer term adaptation plans it is necessary to undertake analysis of the potential impacts in terms of their frequency and magnitudes. This requires climate data collected in a systematic way from well distributed observations. Data from surface climate observations is collected and stored by the Kenya Meteorological Department including Agro-meteorological data. The observing stations are not well distributed in the country but most of them have long periods of data. This data is complemented by volunteer observers who transmit their data to the Department. Hydrological data is currently being collected and stored by the Water Resources Management Authority but prior to 1990 Ministry of Water was responsible for the collection and storage. The hydrological stations are well distributed in all the five drainage basins in the country and have long records. Satellite derived data is available from the KMD and Department of Resource Survey and Remote Sensing and USAID-FEWS/NET including Normalized Difference Vegetation Index for assessment of seasonal crop performance. Downscaled climate models for simulation of climate impacts in the country are being made operational at the Department of Meteorology, University of Nairobi using IPCC methodologies. KMD also collects other types of relevant data under the international cooperation on data exchange framework. All the data is accessible from the respective institutions on request by interested users. The information is also provided to the relevant institutions and the general public through various modes of communication for early warning to support decision making towards preparedness and contingency adaptation planning. There is need for capacity enhancement in the country towards more effective data collection and institutional collaboration in climate change training and research.
12
1. Introduction
Climate is one of the most important natural resources, which if properly exploited can play a crucial role in socio-economic development of the country. It is now an undisputable fact that climate is changing globally. The fourth Assessment Report of the Inter-Governmental Panel on Climate Change (IPCC 2007) stated that Climate Change is unequivocal. This is evident from observations of increases in global average air and ocean temperatures, widespread melting of glaciers, snow and ice and rising global average sea levels. This has mainly been attributed to the increasing concentration in the atmosphere of greenhouse gases that are emitted by human activities.
Climate in Kenya varies both in time and space on account of the equally variable topography that include large water bodies; high mountain ranges; and the Great Rift Valley among others. The small scale circulation patterns generated by these features interact with the large scale circulation systems mainly the Inter-Tropical Convergence Zone (ITCZ) to influence the weather/climate patterns. The climate is also influenced by global features such as El-Nino/Southern Oscillation (ENSO) events that are controlled by the sea surface temperature fields of the Pacific Ocean, upper level wind reversals known as Quasi-Biennial Oscillation (QBO), sea surface temperature fields in the adjacent oceans such as the Indian Ocean Dipole (IOD) as well as the south west Indian Ocean Tropical Cyclone activities.
Climate change in Kenya is being manifested in:
• Increasing mean surface temperatures in most areas
• Rainfall that is decreasing in some areas while increasing in others.
• Increasing variability in rainfall in both space and time.
• More extreme rainfall events such as droughts and heavy rainfall.
These changes will pose great risks to the major sectors that drive socio-economic development of the country because they are climate sensitive. The main risks are explained here below.
1.1 Agriculture
Agriculture is the main sector that drives the country’s economy and is mainly rain fed. It is the main source of livelihood for most of the rural communities who practice small holder subsistence farming.
Increasing frequency of droughts will lead to the risk of seasonal crop failures with far reaching implication on food security especially in the arid and semi-arid areas which cover over 80 percent of the country.
Increasing mean surface temperatures will lead to increasing rate of soil evaporation loses thereby leading to intensification of agricultural droughts including shortening of growing seasons.
The crops will face increasing risk of invasion by more species of pests which will be able to breed in areas whose climate conditions do not currently support them.
Droughts will lead to increasing risk of degradation of agricultural lands on account of over-cultivation under the conditions of inadequate soil moisture especially in the marginal rainfall areas.

13
1.2 Livestock
Most of the livestock is kept in the arid and semi-arid areas of the country and these are areas that are prone to severe droughts which lead to loses of many animals. With increasing frequency and intensity of droughts there is increased risk of the pastoralist communities losing huge numbers of their livestock and thereby raising their poverty levels.
Since these are also areas where most game reserves are located the droughts will also increase the risk of conflicts among pastoralists and between human and wildlife on account of competition for water and pastures.
The risk of Rift Valley Fever outbreaks will also increase on account of high temperatures during heavy rainfall conditions.
1.3 Water resources
Water is crucial to any reasonable socio-economic development and Kenya is generally referred as “water scarce country”. Increasing frequency of droughts will lead to high risk of water deficiency especially in the arid and semi-arid areas.
The risk will be even higher when it is considered that more and more people are migrating to these dry areas on account of demand for land. The result will be increasing demand for water leading to hydrological droughts and serious competition for the available water.
This situation will also increase the risk of crop failures in irrigated agricultural farms.
The glaciers on Mt. Kenya, one of the five major water towers in Kenya, are reducing on account of increasing frequency of dryness in the upper atmospheric levels over the region.
Many urban areas in the country are currently facing water shortage. With increasing frequency of droughts coupled with migration to urban areas will lead to higher risk of urban hydrological droughts with serious implication on water quality and associated human health
1.4 Energy resources
About 60% of electric energy that is generated in the country is from hydro-power dams in the major rivers. The country has been experiencing power shortages associated with the recurrent droughts. The risk of serious power shortages and resultant slowing down of economic growth will be even higher as droughts increase in frequency and intensity.
1.5 Manufacturing
Most of the industries in the country are heavily dependent on electric energy and water. Others are agro-based which means that their outputs are dependent on the performance of the agricultural sector. Increasing frequency of droughts will therefore lead to reduction of the manufacturing activities for all such industries.
1.6 Transport
As has been experienced in the past, floods caused by heavy rains lead to severe damage of roads in many parts of the country and thereby seriously disrupting transport of goods and people including road accidents.
With the projected increase of frequency and intensity of severe foods the risk of serious disruption of road transport will increase.

14
1.7 Tourism
Tourism in Kenya is driven mainly by wildlife which reside in game reserves and parks most of which are located in the arid and semi-arid areas of the country. With increasing frequency of droughts there is increasing risk of decimation of many species of the animals on account of lack of foliage and human-wildlife conflicts.
Furthermore changes in rainfall patterns may influence the migration patterns of wildlife in Maasai Mara and Serengeti game reserves.
The above situations will most likely lead to reduction in the number of tourists coming to the country.
1.8 Public health and safety
Some of major diseases that affect public health in the country are influenced by climate conditions. Vector borne diseases such as Malaria and Yellow Fever are influenced by climate conditions especially temperature and rainfall. Increase in temperature in the highlands will provide suitable environment for breeding of mosquitoes and hence increase the risk of contacting malaria and yellow fever among the communities especially during the rains.
Heavy rainfall and flooding leads to contamination of drinking water by organisms that cause such diseases as Typhoid and other stomach diseases and thereby increasing the risk among the communities which are not aware of the sanitary methods that are needed to avoid the diseases.
The drought related crop failures will lead to increased cases of malnutrition and those most at risk will be the communities in the arid and semi-arid areas as has been the case in the past.
The risk of community conflicts triggered by competition for scarce pastures and water is expected to increase with the increase in severe drought events with those most affected being in the dry lands.
1.9 Human settlements
Because of population increase human settlements are being established in areas that are prone to floods such as plains and river banks. These settlements will face increased risks of severe flooding during heavy rains.
Unplanned urban settlements may be especially at risk because of the fact that they are generally densely populated.
Furthermore settlements in the steep slopes will be at risk from land slides especially in deforested areas.
The settlements in the coastal zone will face increased risk of invasion by sea water on account of sea level rise including salinisation of agricultural lands.
1.10 Desertification
Desertification is driven by a combination of low rainfall and land use activities and is therefore associated with marginal rainfall areas. Because of the growing population in the country and the consequent increasing demand for land for agriculture and other economic activities more and more people are moving to the low rainfall areas and taking with them inappropriate land use methods. As climate variability increases, the risk of increased desertification in those areas will become higher. In this regard deforestation in most parts of the country will increase.

15
1.11 Disaster risks
About ninety percent of all disasters that occur in the country are weather and climate related. The two events that mostly trigger disasters are droughts and heavy rains. With the increased frequency of these extreme climate events the risks of disasters in the country will increase.
Our ability to effectively cope with the above climate situations will depend on our capacity to adapt to them in the short, medium and longer terms.
A well distributed network of climate observation stations will help us to obtain data that will enable us to study the changing patterns of both global and local drivers of the climate and consequently we are able to study the changing climate in both space and time and hence the related risks.
Furthermore by studying the changes in the past climate conditions and their driving factors we are able to establish the probable climate conditions in the future through scenario development using appropriate climate models for projections of the main drivers.
It is therefore seen that availability of both present and past climate data is of crucial importance in the understanding of the future climate impacts. Using this information we are then able to formulate climate change adaptation strategies in the short, medium and long terms.
In the sections that follow the various categories of climate data that are available and can be used for climate monitoring and research and institutions that are responsible for the data are described.

16
2. Availability of Data from Kenya Meteorological Department (KMD)
2.1 Surface and upper air data
Kenya Meteorological Department (KMD) is the institution that is mandated to collect and store climate data in Kenya. Data collection is undertaken through the climate observing stations operated by the institution and also through collaboration with other institutions and volunteer observers.
Currently, the Kenya Meteorological Department (KMD) operates and maintains the following climate observing systems:-
• Thirty-six surface climate observing stations countrywide (called Synoptic Stations) which provide information on rainfall, minimum and maximum temperatures, wind speed and direction, air pressure, soil temperature, solar radiation, sunshine duration, relative humidity, evaporation and cloud cover.
• Three upper air stations located at Dagoretti Corner, Garissa and Lodwar. Of these only Dagoretti is currently operational and is making one ascent instead of two ascents per day as required due to inadequate resources for purchasing consumables. This is major drawback because both morning and afternoon ascents are required for effective weather and climate forecasts.
• These current stations have sufficiently long periods of climate data so that they can be used to study past climate conditions that can be used as the basis for future climate projections.
• Over three thousand rainfall stations are operated by volunteer observers. The optimum number requirement is ten thousand.
• Four marine tidal gauges with automatic Meteorological sensors. These gauges are used to monitor ocean tides and waves as well as tsunamis. The data collected can also be used to study sea level rise associated with global warming. This data is crucial in providing information to support decision making in adaptation planning for coastal zone management.
The following are other specialized observing stations operated by KMD:
• Twenty four Automatic Weather Stations (AWSs) which automatically record climate data and transmit it to receiving stations at KMD
• Three Airport Weather Observing Systems (AWOSs) at Jomo Kenyatta International Airport, Wilson airport and Mombasa International Airport. These systems are able to detect and monitor hazards associated with extreme weather events
• Seventeen Hydro-meteorological Automatic Weather Stations which have been installed in the water catchments.
• Four lightning and thunderstorm detection systems at Nairobi, Mombasa, Kisumu and Eldoret. These systems are used to provide severe weather warnings especially for aviation safety.
• Three satellite receiving stations, two for Meteo-Sat. Second Generation (MSG) and one for National Oceanic and Atmospheric Administration (NOAA) satellites data. These stations receive global data on large scale systems such as sea surface temperatures and wind fields in cooperation with other international climate centers.

17
Fig.1. Geographic distribution of surface observing stations in Kenya
2.2 Availability of agro-meteorological data
KMD operates fourteen Agro-meteorological stations eight hrs manned by KMD and some by other institutions. The stations are installed at research stations owned by the Kenya Agricultural Research Institute (KARI) under a Memorandum of Understanding between the institute and KMD. The data is transmitted to KMD where it is stored
The map below shows the distribution of the current Agro-meteorological stations except two namely at Eldoret (Kapsoya) in the North Rift Valley and Mwea Irrigation Scheme in Central Kenya which are not shown.
Dag
Eld
Emb Gar
Jkia
Kak
KerKisi
Kisu
Kit
Lam
Lod
Mak
Mal
Man
Mar
Mer
Mom
Moy
Msab
Mtw
Nany
Nak
Nar
Nyah
Nye
Thi
Voi
Waj
Wil
Mach
Kab
Eas
34.00 35.00 36.00 37.00 38.00 39.00 40.00 41.00
-4.00
-3.00
-2.00
-1.00
0.00
1.00
2.00
3.00
4.00
5.00
WIND MEASURING SYNOPTIC STATIONS IN KENYA
Latitude
Longitude
Latitude
18
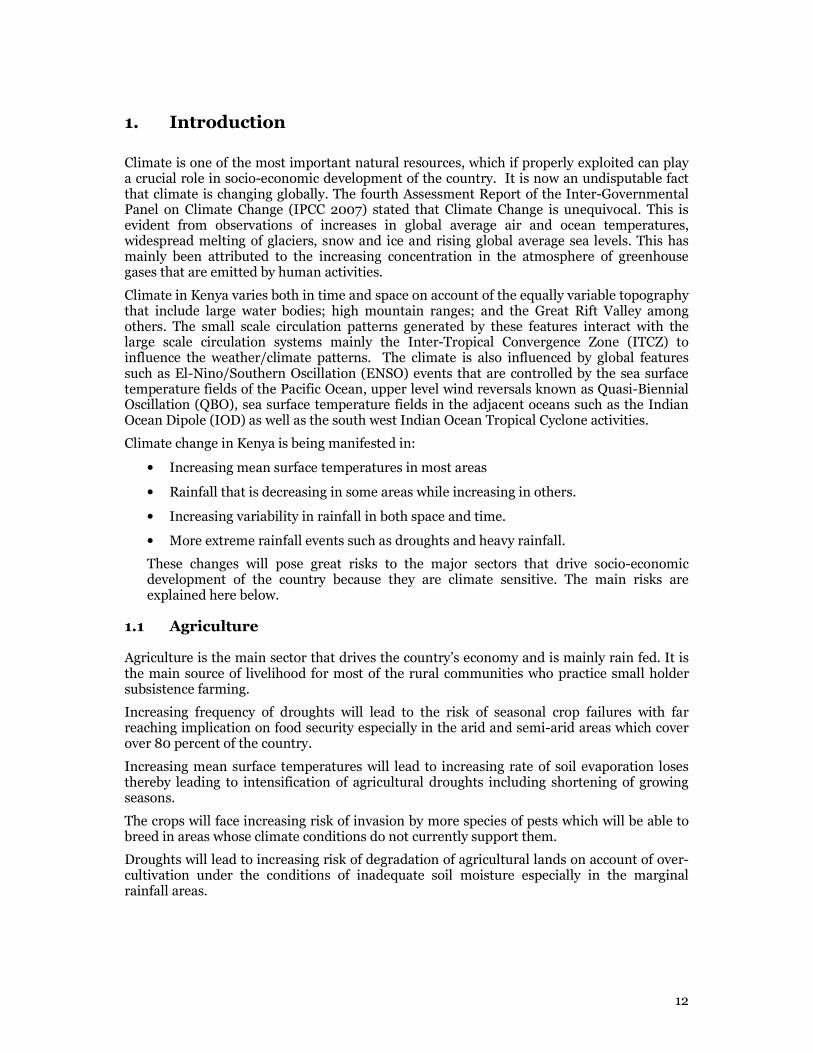
Fig. 2. Geographic distribution of agro-meteorological stations in Kenya.
Types of observations that are made in the agro-meteorological stations
In all the fourteen agro-meteorological stations, normal meteorological parameters are measured on a daily basis and the data is then conveyed to the Agro-meteorological division at the KMD headquarters, Dagoretti Corner, after every ten days for analysis and generation of advisory bulletins for the farming community. These observations include:
• Air Temperature.
• Soil Temperature at five, ten, twenty, thirty, fifty and one hundred centimeter depths.
• Sunshine duration.
• Radiation.
• Wind Speed.
• Relative Humidity.

19
• Pan Evaporation
• Rainfall in Millimeters per day
The same observations are also carried out in the other synoptic Stations spread across the country. In addition to the above observations, the following crop data is also obtained from the fourteen agro-meteorological stations:
• Variety of the grown crop;
• Stage of development attained by the crop;
• General assessment of crop performance;
• Damage by pests, diseases and adverse weather;
• State of weeding in the farm;
• Plant density;
Expected yield ( assessed visually), is normally made at the end of every ten days and along with the meteorological data is communicated to the Agro-meteorological Services Division to facilitate crop-weather impact analysis. In order to obtain a general assessment of crop performance in the entire country, especially on the main staple crops i.e. maize and beans, all the Stations report on the stage of crop development, general assessment of crop performance and expected yields from the surrounding farmers’ farms on the basis of what they see and oral interviews with farmers they come across from areas far from their reach.
This data and complimentary information is used to undertake assessment of crop performance under different climate conditions and to predict seasonal yields of the various crops and hence to assess food security. The information on the assessment is disseminated to the public through Agro-meteorological Bulletins which are published every ten days for early warning. This type of data and information is crucial to the formulation of effective short term (contingency) adaptation plans for different areas of the country.
2.3 Data collected by volunteer observers
Volunteer observers are individuals or institutions who make climate observations voluntarily and transmit the data to the KMD for use and storage. The majority of observers collect rainfall data mainly because of the simplicity of the observations but some also take temperature measurements.
At present there are about three thousand volunteer observers registered by KMD located in various areas all over the country but not all of them collect the data and transmit the same to KMD on a regular basis as required. However the data is a very useful supplement to the normal climate observation network because it increases the coverage of rainfall data which is critical for assessment of climate risks especially for the agriculture and water sectors.
2.4 Data on climate trends
Using the available climate data KMD has constructed graphs of temperature and rainfall trends for the various parts of the country. The graphs show the trends of both the means and variability of rainfall, maximum and minimum temperatures. By studying the changes in the trends over time it is possible to make an assessment of any changes in climate either with respect to the mean or the variability. This has implications on the impacts and consequently on any adaptation plans that may be formulated generally through the use of what is commonly referred to as synthetic scenarios.

20
2.5 Strength and weakness of data collected by KMD
2.5.1 Strength of the data
One of the strong points about the data collected by KMD is that the surface observations are made at synoptic stations that are installed at strategic areas so that the climate observations represent the general climate of a large area that is influenced by large scale climate systems such as the Inter-Tropical Convergence Zone (ITCZ), sea breezes and lake breezes.
The other strong point is that most of these stations have long observation periods so that it is possible to undertake analysis of climate trends in terms of mean and variability and to identify periods of extreme events and other climate characteristics.
Another point of strength is in the fact that Kenya’s network is much better maintained and denser than those of the other African countries and hence enhances the robustness of the country’s climate assessment compared to the others.
KMD has been able to recruit a large number of volunteer observers whose data collection is an important contribution to the country’s observation network and hence enhances our ability to monitor climate conditions.
KMD has also installed a number of specialized observation instruments such as agro-meteorological stations and automatic weather stations satellite receiving stations and severe weather stations all of which enhance the capacity to analyze climate conditions in sufficient time for early warning.
2.5.2 Weakness of the data
Some of the main causes of weakness in the data collected KMD include:
• The observation network is not well distributed throughout the country. Such distribution is necessary in order to observe smaller scale climate conditions that are influenced by small scale features such as topographical variations among others. The optimum number requirement of synoptic stations is seventy seven.
• The Department is faced with inadequate funds to purchase consumables whose cost is increasing. For this reason upper air observations in Garissa and Lodwar are currently not active and the Dagoretti one operates only once a day instead of twice as required.
• There is an inadequate technical capacity for operation and maintenance of equipment.
• There is lack of necessary infrastructures such as electricity, or access roads in some important observing stations.
• The department is faced with insecurity in some of the areas where observation sites are located.
• Some of the equipment was installed a long time ago but there are inadequate funds for their rehabilitation or replacement.
• The Department does not have adequate personnel as required in order to efficiently carry out observation obligations.
• Data collected by volunteer observers is not collected on a regular basis as required perhaps because the observers have other commitments.
However the Department has plans to increase the number of observing surface stations to an acceptable level in the near future. Once this installation is completed it will be possible to monitor climate conditions over smaller areas.
21
2.6 Accessibility of climate data from KMD
All the climate data that is collected and stored by KMD is accessible to the users. The Department can provide the processed data such as the averages or raw primary data. The normal procedure for accessing the data is for the user to make a written request to the Director of the Department detailing the type and form of data that is needed. That request will initiate the process of data acquisition the arrangement of which is facilitated by the Customer Service Office.
2.7 Accessibility of weather and climate information by the general public
KMD is the national institution that is responsible for providing weather and climate information that the communities can use to support decision making in planning for the various activities that are dependent on climate.
The institution uses a number of methods to;
• Provide the information on seasonal climate conditions in a timely manner for early warning and preparedness.
• Provide information for monitoring of agricultural and hydrological states.
• Provide information on day to day weather conditions.
• Provide information on extreme or unusual weather or climate events that may be detected or expected and have implications on safety and wellfare.
Types of information provided by the institution include the following:
• Daily weather forecasts
• Four day weather forecasts
• Seven day weather forecasts.
• Monthly climate forecasts.
• Agro-meteorological bulletins that are issued every ten days to provide information on assessment of crop performance and expected climate conditions that may affect the crops.
• Seasonal climate forecasts that contain information on expected performance of rainfall in the various parts of the country during the particular season. The forecasts also contain warnings on expected climate related hazards including areas likely to be at risk and advisories on cautionary measures that should be taken. These seasonal forecasts are issued in good time for early warning for communities and institutions for preparedness and contingency adaptation planning.
• Information on marine conditions include general state of the ocean such as wave heights, wind speeds, visibility, and ocean currents. This information is provided to the communities in the proximity of the oceans, ships and fishermen.
• Hydrological information include state of the river flows of the major rivers especially the potential for flooding of rivers such as River Nzoia. This information is provided to communities who live in close proximity of the rivers for early warning and preparedness.
22
The above described weather and climate information is provided to the user communities in a number of ways including the following:
• Print and electronic mass media where the information is made available to the media and in case of special bulletins which must be issued in full, KMD buys space in the media.
• Information provided to the local communities through provincial directors of meteorology.
• Radio Internet (RANET). This is an innovative community based radio program which was recently established by KMD with the aim of providing climate information to the local communities as widely as possible. The climate information is disseminated through the internet and broadcast by the radio to the local community groups. A very interesting aspect of this initiative is that the local groups are also able to discuss issues and exchange information related to their areas in addition to the weather and climate. The main barrier to satisfactory implementation of the program is that KMD may not have adequate financial resources to establish stations in many areas of the country where communities can benefit most.
• Through internet. Weather and climate information can also be accessed through the KMD internet site: www.meteo.go.ke or through telephone Number: 0203876957.

23
3. Availability of Hydrometeorological Data from Water Resources Management Authority (WRMA)
Measurement of river flow characteristics enables us to monitor flow volumes for the purpose of assessment of the impacts of climate on water resources. There is a wide distribution of river flow gauges in the five major drainage basins in the country.
Water Resources Management Authority (WRMA) is the institution that is responsible for maintaining and operating flow gauging stations.
In total there are four hundred and fifty five river gauging stations operated by WRMA in the five drainage basins.
These are as follows:
Basin 1: Lake Victoria ------------------------------------96.
Basin 2: Rift Valley---------------------------------------100.
Basin 3: Athi River and South Coast-----------------97.
Basin 4: Tana River-------------------------------------122.
Basin 5: Ewaso Ngiro and Northern Region—---40
Total-----------------------------------------------------------455
In addition KMD recently installed seventeen hydro-meteorological automatic weather stations in the major water catchments for measurements of surface discharge and weather parameters.
Monitoring of river discharge characteristics enables us to assess the impacts of climate on the water resources. When the monitoring is combined with seasonal rainfall forecasting it forms a central component of contingency adaptation planning in the water sector.
Kenya Energy Generation Company (KENGEN) uses this discharge data for assessment and monitoring of hydro-power generation under changing rainfall conditions.
The long periods of observations in many of the hydrological stations can be used to study the trends and hence support formulation of long term (strategic) adaptations plans for the management of the respective river basins.
3.1 Strength of hydrological data
The hydrological observing stations are well distributed in all the five drainage basins in the country. It is therefore possible to monitor river flow characteristics associated with local rainfall and small scale topographic features and human activities.
Furthermore many of the stations have long periods of data so that it is possible to undertake river flow trends and other characteristics in relation to the climate trends and other forcing factors especially human activities.
3.2 Weakness of the hydrological data
A significant number of the registered hydrological stations are no longer operational because they were being operated by volunteers who are now unable to make observations. This creates data gaps which are not able to be filled.
24
3.3 Accessibility of hydrological data
Hydrological data that was collected before the year 1990 can be accessed from the Ministry of water. The data that has been collected after 1990 can be accessed from WRMA. The procedure is writing officially to the Ministry and or Authority explaining the type of data that is needed and for what purpose.

25
4. Availability of Data on Crop Yield Assessment from US-Food Early Warning System Network (US-FEWSNET)
The United States Food Early Warning System Network (US-FEWSNET) undertakes crop yields assessment using climate data from both national weather services and climate predictions from international climate centers and field observations.
4.1 The strength of the information
The strength of this information is that it is disseminated to the country as an early warning to support decision making for preparedness. This type of information can therefore make a crucial contribution to contingency adaptation planning
4.2 The weakness of the information
The weakness of the information is in the fact that it is based on a project funded by United States Agency for International Development (USAID). The sustainability of the project in
the long term cannot therefore be assured.
4.3 Accessibility of the information by the general public
This information is provided in the form of early warning on the food security situation in the country based on monitoring and assessment of rainfall performance and expected state of crops. The information is issued in the form of food security alerts for different parts of the country to prompt decision makers to take action towards reduction of the potential impacts of the expected climate event.
The information is freely accessible to the public as it is disseminated through electronic and print media and to the relevant institutions in the form of food security alert bulletins. In addition it can be accessed through the FEWSNET website: www.fews.net

26
5. Availability of Satellite Derived Data
5.1 Data from KMD
It was explained earlier that Kenya’s rainfall is driven by local systems as well as global systems. The main global ones are the sea surface temperature fields in the adjacent oceans namely Indian Ocean and Atlantic Ocean. In addition El-Nino and La-Nina events, which are known to influence rainfall in most parts of the country, are driven by sea surface temperature fields of the Pacific Ocean. Since these temperatures change only slowly it is possible to monitor the changes and consequently to predict their influence on rainfall with sufficient lead time to provide early warning information for preparedness.
The data on sea surface temperature fields is provided through the use of global observing satellites that transmit the data to the global climate centers which in turn process and transmit the same to the national climate centers. Kenya Meteorological Department is the national center that receives the data on sea surface temperatures from the international climate centers. This data is crucial for predicting seasonal rainfall performance with sufficient lead time for early warning and preparedness. It is therefore a key component of contingency adaptation planning.
KMD also receives satellite derived Normalized Vegetation Index (NDVI) data which gives an indication of rainfall performance based on the performance of vegetation both natural vegetation and agricultural crops. This data can be used to assess crop yields in good time for early warning and is therefore useful for contingency adaptation planning.
5.2 Data from Department of Resources Survey and Remote Sensing (DRSRS)
DRSRS collects and stores data from satellites such as LANDSAT, SPOT and MODIS. The Department also collects and stores data derived from aerial photographs taken through flights over the areas of environmental interest.
Some of the data collected include: wildlife and livestock population, surface water variability, crop performance, land use and land use change, forest cover, urbanization and human settlements.
5.3 Strength of the satellite data
The strength of this data is that it enables KMD to monitor global systems that drive the country’s climate and hence the Department is able to make seasonal climate predictions for early warning.
The other strength is that the information is first processed and quality controlled by international climate centers before it is transmitted to the Department.
The strength of the data collected by DRSRS is that the satellite data is complimented by air craft observations for ground truthing.
The air craft derived data is accurate and covers large areas over a short period of time which
is an activity that cannot easily be undertaken by other means of travel.
5.4 Weakness of the data
The main weakness of the data is that NDVI does not differentiate between the green colour of the crops and those of other vegetation types. It is only an indicator of vegetation performance on account of soil moisture from the rain. However this weakness is addressed through specialized techniques
27
The other weakness of the data is in the fact that for the KMD the receiving stations require high level of technical maintenance which may not always be available when it is required.
However this is an issue that is being addressed by the Department.
5.5 Accessibility of the DRSRS data by the general public
This information is accessible from the DRSRS through official request explaining the use of the type and use of data that is requested. The processed information is also accessible through regular reports that are prepared by the Department.
The information is also disseminated to the public through technical reports, statistical summaries, brochures, local print and electronic media and website given below.
DRSRS website: www.drsrs.go.ke
The data collected by KMD is accessible on request as explained in earlier sections of this report.

28
6. Availability of Data from Climate Models by Local Institutions
Department of Meteorology of University of Nairobi, in collaboration with KMD is running regional climate models that are based on global circulation models that are down-scaled to regional dimensions. By using the Intergovernmental Panel on Climate Change (IPCC) Greenhouse gas Emission Scenarios and local climate parameters they are then able to simulate local climate changes at scales of down to 25 Kilometers and time intervals of two or so years and going on to fifty years and longer. These climate simulations can be used to assess climate risks at local levels and are therefore useful in providing information that can be used for formulation of medium and long term adaptation plans.
6.1 The strength of the data from the models
The main strength of the models is that they enable us to project the climate change impacts at a certain period in future by using climate predictions that are consistent with the past and current climates.
The other strength is that the models use methods that have been assessed and found to be robust through the assessment process of the IPCC.
6.2 Weakness of the data from the models
The weakness of the models is in the fact that the surface climate observing network is not distributed throughout the country well enough for effective validation of model outputs. This is so especially when it is considered that climate conditions in the country are highly variable in both space and time on account of variability in the forcing factors.
The other weakness is in the fact that assumptions that are made such as social-economic projections are associated with uncertainties some of which are large.
But under our existing circumstances these outputs can be used for projections with results that are good enough for medium and long term adaptation planning.
6.3 Accessibility of the data
This data is accessible through consultations with the scientists that are undertaking the climate modeling in the concerned institutions.
29
7. Availability of data from Global Atmosphere Watch (GAW) Station
The concern for climate change through global warming has led many nations to participate in assessing the current state and trends of the chemical state of the atmosphere. It is for this reason that World Meteorological Organization (WMO) initiated new GAW stations in 1989. The Global Environmental Facility (GEF) provided finances for the implementation of six (new) GAW stations in the world, located in Brazil, China, Algeria, Kenya, Indonesia and Argentina. The one in Kenya is located on Mt. Kenya at an altitude of about 4000m above mean sea level and operated by KMD. Because the station is high up in the atmosphere the systematic observations of atmospheric chemical composition and related physical parameters represent regional to global scale conditions. The information obtained from these GAW stations is used in the following ways:
• To support deliberations in the global environmental conventions for future policy development.
• To develop predictive capability for future states of the atmosphere.
• The specific systematic observations currently being made at the Mt. Kenya station, which are relevant to climate change assessment, are:
• Meteorological measurements.
• Surface Ozone concentration levels.
• Carbon monoxide concentration levels.
• Aerosols.
A complementary station to the Mt. Kenya global station is the Nairobi Ozone sounding station, started with the support of Swiss Government through WMO and operated by KMD. The station is used to measure vertical profiles of ozone.
7.1 Strength of the data
The main strength of the data collected at the Mt. Kenya station is that it is right at the Equator which is a unique position from the point of view of global climate data collection. It is also the only one in East and Central Africa.
7.2 Weakness of the data
The main weakness of the station is that it does not have the capacity to monitor Carbon
Dioxide gas which is the most globally important greenhouse gas.
7.3 Accessibility of the data
The data collected at the two stations is accessible on request to the KMD as explained above.

30
8. Availability of Urban Climate Data
An urban climatology station has been established at the Department of Meteorology, University of Nairobi. The station measures surface Ozone and Carbon monoxide. Plans are also under way to establish another urban climatology station at the Jomo Kenyatta International Airport (JKIA)
8.1 Strength of the data
The strength of the urban station data is that it helps us to monitor urban climates which are changing on account of human activities such as energy consumption and alteration of the urban energy balance and also modification of urban rainfall.
The data from the stations can therefore help us to formulate adaptation plans for the urban areas.
8.2 Weakness of the data
The weakness of the current urban data is in the fact that the station is not in the really built up areas of the city so that the effects of human activities are not well captured.
8.2.1 Accessibility of the data
The available data is accessible through consultations with the Department of Meteorology of the University of Nairobi.

31
9. Description of Some Climate Models That Are Being Applied in Kenya
9.1 Introduction
Global Climate Models (GCMs) are the primary tools for simulating past climates and projecting future climate change using different climate forcing scenarios. They are complex computer models that represent interactions between the different components of climate system such as land surface, atmosphere, hydrosphere and biosphere. GCMs solve various complex equations by adopting parameterisation schemes to represent atmospheric processes and thereby provide physically plausible and self consistent explanation of observed climate variations on various time-scales (IPCC, 2007, WG1, Chap. 8).
In making the projections of climate change, scenarios of future emissions of greenhouse gases are used. This process generates a suite of possible future scenarios, each of which is valid but some are considered more likely than others.
A scenario is defined as a plausible and simplified description of how the future may develop based on a coherent and internally consistent set of assumptions about the driving forces and key interactions
Because GCMs are global in scale with large spatial resolutions of the order of hundreds of kilometers they have to be downscaled to local or regional scale resolutions of the order of a few tens of kilometers.
Two approaches are used for downscaling namely:
• Statistical downscaling which uses statistical/empirical equations to represent the relationship between the large scale features and local scale climate drivers.
• Dynamical downscaling which uses physically based laws to represent the relationship between the large scale features and local or regional scale climate drivers.
In the sections below two models that are being used for projection of climate change in Kenya by the Department of Meteorology University of Nairobi in collaboration with KMD and ICPAC are described.
These two models are quite appropriate as the basis of the adaptation planning for the country.
9.2 PRECIS- Regional Climate Model
PRECIS, an acronym for Providing Regional Climates for Impacts Studies, is a regional climate modeling system used to downscale the coarse resolution GCM outputs for application to climate change impacts models. The model has been developed by the Hadley Centre of the United Kingdom (UK) Meteorological office based on the atmospheric component of the Hadley Centre third generation GCM (HadCM3) climate model. It is a portable, flexible and easy-to-use atmospheric and land surface regional climate modeling system of limited area and high spatial resolution; typically 25–50 km. PRECIS can be run on a relatively inexpensive personal computer and is locatable over any part of the world for purposes of generating detailed climate change scenarios for impact studies.
Like any other regional climate model, PRECIS is driven by boundary conditions downloaded from the course resolution GCMs. The atmospheric dynamics module of PRECIS is a hydrostatic version of the full primitive equations and uses regular latitude-longitude grid in the horizontal and a hybrid vertical coordinate to describe the dynamical flow, the atmospheric sulphur cycle, clouds and precipitation radiative processes, the land
32
surface and deep soil characteristics. PRECIS provides developing countries such as Kenya with affordable means of generating detailed, high quality climate predictions for their own regions at the earliest possible stage. The model is driven by prescribed Lateral Boundary Conditions (LBCs) which provide dynamical atmospheric information for different emission scenarios at the latitudinal and longitudinal edges of the model domain. These LBCs comprise the standard atmospheric variables of surface pressure, horizontal wind components, atmospheric temperature and humidity which are updated every six hours.
The model describes three main components that comprise the atmospheric dynamics which deals with advection of meteorological state variables that are consistently modified by physical parameterization; the sulphur cycle which is concerned with the simulation of distribution and transport of sulphate aerosols through horizontal and vertical advection, convection and turbulent mixing; and physical parameterization which deals with the clouds, precipitation, boundary layer, surface exchanges and gravity wave.
The aim of the Hadley Centre is to make PRECIS freely available for use and enable developing countries such as Kenya to make their own projections of national patterns of climate change and hence estimate the possible impacts on different sectors of the economy. The centre recognizes the fact that timely access to detailed climate change scenarios is vital in these countries where economic stresses are likely to increase vulnerability to impacts of climate change especially in the field of surface water resources and agriculture.
Climate change will adversely affect developing countries such as Kenya whose economies depend heavily on agriculture and natural resources. It is therefore important that such countries are enabled to make their own future predictions of climate and combine them with local knowledge in order to meet their local needs.
The coupled ocean-atmosphere GCMs used as starting points for regional climate projections are usually run in transient mode where they take the gradually increasing atmospheric concentrations of the greenhouse gases and calculate the resulting evolution of climate under different emission scenarios. This has been done for the period 1960 to 2100. The standard output data from PRECIS, which serve as the inputs to impact models, are available as time series of grid point data of temperature and rainfall in daily or hourly time-steps as well as climatic mean values for any area of interest.
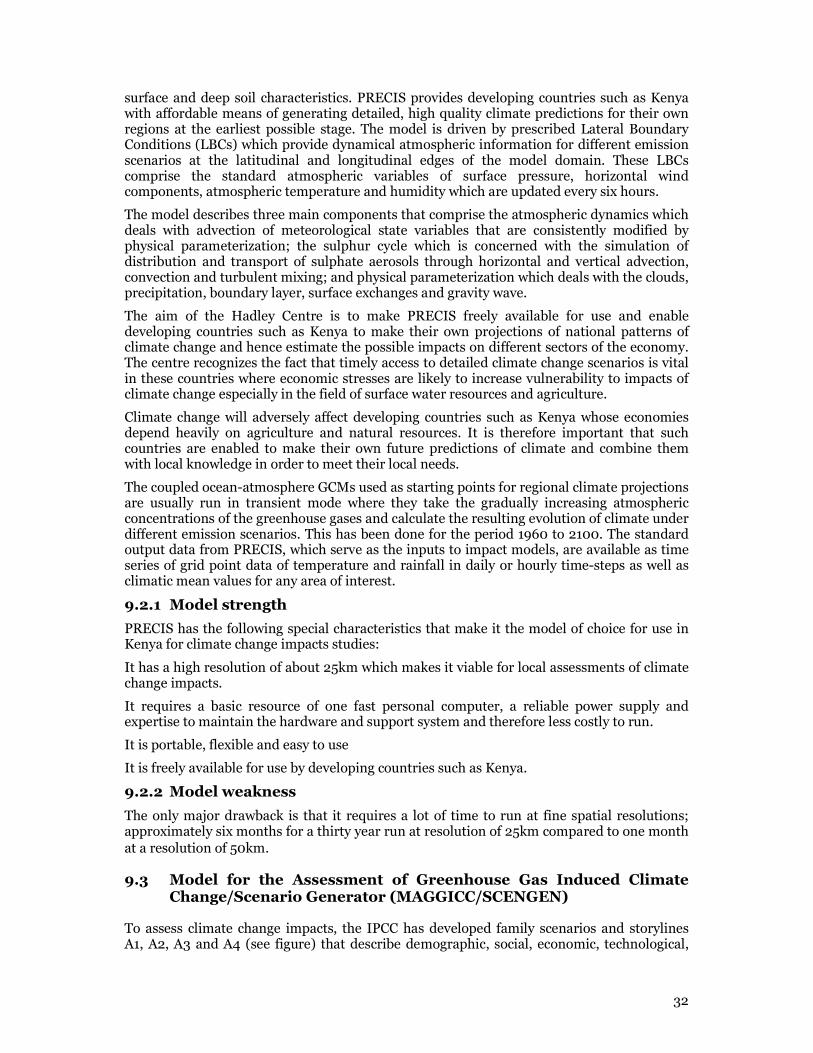
9.2.1 Model strength
PRECIS has the following special characteristics that make it the model of choice for use in Kenya for climate change impacts studies:
It has a high resolution of about 25km which makes it viable for local assessments of climate change impacts.
It requires a basic resource of one fast personal computer, a reliable power supply and expertise to maintain the hardware and support system and therefore less costly to run.
It is portable, flexible and easy to use
It is freely available for use by developing countries such as Kenya.
9.2.2 Model weakness
The only major drawback is that it requires a lot of time to run at fine spatial resolutions; approximately six months for a thirty year run at resolution of 25km compared to one month
at a resolution of 50km.
9.3 Model for the Assessment of Greenhouse Gas Induced Climate Change/Scenario Generator (MAGGICC/SCENGEN)
To assess climate change impacts, the IPCC has developed family scenarios and storylines A1, A2, A3 and A4 (see figure) that describe demographic, social, economic, technological,

33
environmental, and policy future for each one of these scenario families. Within each family, different scenarios explore variations of global and regional developments and their implications for trace gas emissions.
Schematic illustration of SRES scenarios
All four storylines and scenario families describe future worlds that are generally more affluent compared to the current situation. Each storyline assumes a distinctly different direction for future developments. They cover a wide range of key “future” characteristics such as demographic change, economic development, and technological change. Climate Change Impacts Assessors use a combination of the families to come up with scenarios for use in the climate change impacts assessment for their study site. Having chosen the story lines appropriate for the country, the climate change scenarios for the country are developed by building a good data set of current climate extending for a period of not less than 30 years and then determining and accessing a Scenario Generator Model (e.g., MAGGICC-SCENGEN or GRADs). MAGICC/SCENGEN, for example, is a coupled gas-cycle/climate model (MAGICC) that drives a spatial climate-change scenario generator (SCENGEN). It has built-in current and future climate data sets for the different regions of the world and General Circulation Model outputs (temperature, rainfall, etc) into the future (e.g., up to 2100). MAGICC has been the primary model used by IPCC to produce projections of future global-mean temperature and sea level rise. The flowchart below shows the directory structure of the MAGICC/SCENGEN software and useful information can be found in Wigley

34
and Raper (1992, 2001, 2002), Raper et al. (1996), Wigley (1993, 2000) and Wigley et al. (2002).
SCENGEN uses the scaling method of Santer et al. (1990) to produce spatial patterns of change from an extensive data base of atmosphere/ocean GCM (AOGCM) data. The scaling method is based on the separation of the global-mean and spatial-pattern components of future climate change, and the further separation of the latter into greenhouse-gas and aerosol components. Spatial patterns in the data base are ‘normalized’ and expressed as changes per 1oC change in global-mean temperature. These normalized greenhouse-gas and aerosol components are appropriately weighted, added, and scaled up to the global-mean temperature defined by MAGICC for a given year, emissions scenario and set of climate model parameters. For the SCENGEN scaling component, the user can select from a number of different AOGCMs for the patterns of greenhouse-gas-induced climate.
Climate Change scenarios of a region or a country are developed by combining current climate data with outputs from General Circulation Models extracted from the MAGGICC-SENGEN Model. The methodology requires first to run MAGICC in which one begins by selecting a pair of emissions scenarios, labeled as a reference scenario (R) and a policy scenario (P). The user then selects a set of gas-cycle and climate model parameters and for these the default (‘best guess’) is chosen which is then carried through to SCENGEN. Running MAGICC then produces four output files to drive SCENGEN where the spatial consequences are explored.
Running the SCENGEN component of the software enables access to many GCM outputs (14 Models in the MAGGICC-SCENGEN SG41 software) and the country’s 30-year current or baseline climate data. The 30-year monthly baseline data is averaged. The averaged country temperature data is correlated with the GCM Model output of current temperatures and the correlation coefficient is determined. The 3 GCMs with the highest correlation coefficients are the ones that have closely estimated the baseline climate of the country and these are the Models recommended for use in the development of climate change scenarios for use in Impacts Assessment for the country. The climate change scenarios for the period 2000 to 2100 are then calculated by the combination of baseline climate parameters with the GCM Outputs for the period 2000 to 2100.
9.3.1 Model strength
• MAGICC consists of a suite of coupled gas-cycle, climate and ice-melt models integrated into a single software package. The software allows the user to determine changes in greenhouse-gas concentrations, global-mean surface air temperature, and sea level resulting from anthropogenic emissions of greenhouse gases and aerosols. The Outputs from MAGICC are consistency with the IPCC AR4.
• The AOGCM Model data base being used in MAGICC are more up-to-date model results (state-of-the-art as of June 2007) and have higher spatial resolution at 2.5 by 2.5 degrees, latitude/longitude. For the AR4 models, most have resolution that is finer than 2.5 by 2.5.
• A key aspect of MAGICC is that it is able to emulate the global-mean temperature results of more complex AOGCMs. This is done via calibration of MAGICC parameters (such as the climate sensitivity) to obtain best fits to the more complex models. In this mode, MAGICC has been used in all IPCC reports to date to extend and generalize AOGCM results.
• Global-mean temperatures from MAGICC are used to drive SCENGEN. SCENGEN uses a version of the pattern scaling method described in Santer et al. (1990) to produce spatial patterns of change from a data base of atmosphere/ocean GCM (AOGCM) data from the CMIP3/AR4 archive. The pattern scaling method is based on the separation of the global-mean and spatial-pattern components of future climate change, and the further separation of the latter into greenhouse-gas and aerosol

35
components. Spatial patterns in the data base are normalized and expressed as changes per 1°C change in global-mean temperature. These normalized greenhouse-gas and aerosol components are appropriately weighted, added, and scaled up to the global-mean temperature defined by MAGICC for a given year, emissions scenario and set of climate model parameters. For the SCENGEN scaling component, the user can select from a number of different AOGCMs for the patterns of greenhouse-gas-induced climate
• SCENGEN displays MAGICC output spatially. Beyond simple climate change scenario construction (i.e., changes in the mean climate state), SCENGEN produces spatial pattern results for: changes in inter-annual variability; two different forms of signal-to-noise ratio (to assess the significance of changes); probabilistic output (the default being the probability of an increase in the chosen climate variable); and a wide range of model validation statistics for individual models or combinations of models to assist in the selection of models for scenario development.
9.3.2 Model weakness
• For some areas, there are still significant developments to be expected in the realism of both climate and carbon cycle models. For example, the current state-of-the-art carbon cycle models themselves face substantial uncertainties, related to, for example, nitrogen-fertilization, modeling of fire regimes, ocean chemistry, etc.
• A second limitation (for SCENGEN) arises from the incomplete knowledge on the patterns of climate model response to aerosol forcing, particularly indirect forcing. The limitation here is that the required AOGCM ‘single forcing’ experiments have not yet been done with state-of-the-art AOGCMs.
• Thirdly, there are uncertainties as to how AOGCM and carbon cycle models would behave for scenarios outside the tested range.
36
10. Institutional Set-Up
There are three institutions in Kenya that are mainly involved in research and systematic observations in the area of climate change as discussed below.
10.1 Kenya Meteorological Department (KMD)
This the institution in Kenya that has the mandate for systematic observation of climate and climate change. It is responsible for installation and maintenance of surface and upper air meteorological observing systems. It is also responsible for collection, analysis and storage of meteorological data including global data exchange. In addition, the Department conducts applied research in various areas of weather and climate. The Department has a compliment of about 105 class 1 meteorologists including 3 PhD and 48 MSc holders.
10.2 IGAD Climate Prediction and Application Centre (ICPAC)
This is a specialized institution of IGAD. It undertakes climate monitoring and seasonal predictions of climate stresses for the Greater Horn of Africa Region (GHA) and thereby providing climate information that can be used for early warning by the countries in the region. The center has established a historical climate data bank for the region that is continuously updated through timely reception and archival of near real time climate data from the participating countries. The historical data sets have been used to, among other things develop the seasonal forecast models for the GHA region and for individual countries as well as generate national climate atlases that include risk zone maps. The near real time data are used for monitoring of the climate conditions in the region with a view of identifying any climate stress signals as soon as they commence. The center conducts climate research towards improving the seasonal forecast skills including climate impacts assessment. Most of the staff at the center is seconded from the University of Nairobi and National Meteorological and Hydrological Services in the GHA.
10.3 Department of Meteorology
The Department of Meteorology, University of Nairobi has the responsibility of training the World Meteorological organization (WMO) Class One personnel (Bsc. and Post Grad. Dip). The Department is the WMO Regional Training Center for East and Central Africa countries. The Department also conducts research and training leading to MSc. and PhD. Degrees. Recently the Department commenced the following training programs in climate change:
Short training courses of up to 1 month for professionals in other fields who require knowledge of the science of climate change, impacts, adaptation and mitigation.
Post-Graduate Diploma and Master of Science degree courses in climate change
Its staff also undertake applied research in climatology including climate variability and
change and their impacts on various socio-economic sectors. .
The three institutions described above have developed strong links which have led to close collaboration in areas of training, research and systematic observations of climate variability
and change.

37
11. International Cooperation in Data Exchange
Like all other countries, climate in Kenya is influenced by systems in other parts of the globe. Such systems include sea and land surface temperature, pressure and wind fields of the large oceans and continents. Therefore in order to be able to characterize climate events on a daily or seasonal basis it is necessary for the country to have access to climate data from other areas around the globe. For this reason there is need for international cooperation in data exchange.
The World Meteorological Organization (WMO) is the institution that is mandated to develop the framework for this international cooperation and to create enabling environment for its implementation. The data exchange is achieved through the Global Telecommunication System (GTS). Kenya hosts the Regional Telecommunication Hub (RTH) responsible for data collection and exchange in eastern and Southern Africa. The major cause of non-availability of data from the region and country is the poor performances of telecommunication links. These limitations affect climate monitoring and prediction, not only for the country or region, but also for the entire global community.
In the year 2001 The Subsidiary Body on Scientific and Technological Advice (SABSTA) of the United Nations Framework Convention on Climate Change (UNFCCC) noted with concern the continued deterioration of the global climate observing systems. The IPCC Third Assessment (TAR) and Fourth Assessment (AR4) reports also emphasise the same concern. The Conference of Parties (COP) to the UNFCCC has encouraged parties to actively support capacity-building activities in developing countries to enable them collect, exchange, and utilize data to meet local, national, regional, and international needs (Decision 14/CP.4), and the need to identify priority capacity-building needs related to participation in systematic observations (Decision 5/CP.5).
The projections of climate change trends cannot be realistic unless data from all parts of the world are utilized in the global models for social-economic impact assessments and validation of the model outputs. Efficient climate monitoring and prediction would thus provide the climate information that is needed to formulate plans to reduce the negative impacts of extreme climate events such as food insecurity, public safety, poverty, economic growth stagnation, poor health and social conflicts among many others.

38
12. Data Needs for Climate Change Research and Monitoring
The data needs for research on climate change include long term observation records, which are of high quality and evenly distributed to capture national aspects of climate change through monitoring, detection and attribution. In addition long and continuous observations are necessary for development and testing of climate models that can be used for vulnerability and adaptation assessments. The data include surface observations of green house gases.
Climate change, being a global issue, requires a global network of data collecting stations. Globally, there is a network of stations dedicated to climate monitoring and research. The following are the types of data collection networks in operation
• Global Climate Observing System (GCOS) surface Network (GSN). This network is dedicated to observations and exchange of climate data collected on the surface of the earth
• GCOS Upper Air Network (GUAN). The network is concerned with measurements of upper air parameters such as temperature, humidity, pressure and winds,
• Global Terrestrial Observing System (GTOS) is the system that is dedicated to the monitoring of surface water resources and greenhouse gases.
12.1 Global Climate Observing System (GCOS) Surface Network (GSN) and GCOS Upper Air Network (GUAN)
The efficiency of the surface and upper air climate networks is important for climate change research and systematic observations. This contributes to the global cooperation in climate change initiatives coordinated by the Global Climate Observing System (GCOS) whose goals include:-
• Climate system monitoring, climate change detection, and monitoring the impact of climate change especially in terrestrial ecosystems and mean sea level.
• Climate applications for economic development.
• Research towards improved understanding, modeling and prediction of the climate.
The GCOS Surface Network (GSN) and GCOS Upper Air Network (GUAN) are two critically important meteorological networks within the Global Climate Observing System. There are fifty three GSN and ten GUAN stations within the eastern and southern Africa Region.
12.2 Global Terrestrial Network for Hydrology
There is an international initiative to develop and implement a global hydrological observing network for climate. The main variables that are targeted are surface water discharge, surface and ground water storage fluxes, precipitation, evaporation, relative humidity and transport of bio-geochemical substances from Land to Ocean.
The main objectives are
To respond to urgent information requirements towards climate prediction, impacts and adaptation including hydrological variability to detect climate change.
To assess water sustainability in terms of water use versus availability.
To improve understanding of hydrological processes.
Towards these objectives, the World Meteorological Organization (WMO) has initiated a World Hydrological Climate Observing System (WHYCOS) which is being developed and

39
implemented in the form of regional Hydrological Climate Observing System (HYCOS) projects, for example: IGAD-HYCOS, Nile-HYCOS, SADC-HYCOS and other such regional initiatives. The main aim of these projects is to assist the participating countries to improve their hydrological networks and institutional capacities.
The other Global Terrestrial Observing Systems are:
GTOS Carbon Cycle Observation Network. This network is concerned with measurements and monitoring of surface carbon fluxes.
Global Atmosphere Watch (GAW). These are stations that are installed in areas that have little or no local influence so that the measurements reflect the global conditions of atmospheric loading of constituents such as carbon dioxide and others that are important to global climate.
Ozone Stations. Ozone is of global importance because of the fact that it protects living things from the harmful effects of ultra- violet (UV) radiation from the sun. The ozone layer is being depleted by substances that are produced by industrial activities around the world. Its monitoring is therefore critical to the assessment of the quantity of the UV radiation reaching the earth’s surface.

40
13. Capacity Needs at National Level
Many stations in the country are not functioning adequately because funds are insufficient to buy modern equipment, to carry out day-to-day operation and/or to buy spare parts. In addition, there are not enough qualified staff to operate and maintain equipment. For example specialized observation of Carbon fluxes and pools is not being undertaken on account of lack of specialized equipment and qualified staff. There is therefore need to enhance observation capacity of the country in order to effectively provide data that can be used for climate adaptation planning. In the sections that follow the national needs in terms of equipment and training are indicated.
13.1 Equipment Needs
13.1.1 Climate surface and upper air observing networks
Climate monitoring is an expensive investment. The majority of equipment required is expensive and not available locally. Stations like GAW and Ozone stations have been acquired through external support. The computers required to study climate change are expensive and as mentioned earlier the only institution having a computer that can handle models for understanding the processes involved in climate change is the ICPAC, Nairobi. There is need to improve data collection from existing GSN and GUAN network by providing adequate and predictable funding for operations and maintenance
In addition to observation and data processing equipment needs, the equipments to transfer the data are also expensive. The Automatic Message Switching System at KMD that had been operating for over a decade was therefore recently upgraded to enhance its efficiency. The VSAT communication system has also been replaced by a fibre optic for the same reason. GPRS modems have been installed in many of the Synoptic Stations to facilitate fast and efficient transfer of near real time data to the Headquarters.
However, as was shown in earlier sections of this report, Kenya has only thirty six synoptic stations and most of these are located in the areas that are accessible and very few are in the remote areas of the country. From the point of view of climate change impacts these remote areas are the ones where climate information is needed most for adaptation planning because of their high vulnerability. There is therefore great need to enhance climate observation capacity in these areas by increasing the density of the observing stations.
One of the effective ways of meeting this need is through the use of automatic weather stations in these remote areas. Although this equipment has substantially high initial cost, they can be operated at much lower costs in terms of maintenance and personnel. The equipment could be installed in areas where data availability is crucial from the point of view of existing environmental circumstances. Currently twenty four such stations of synoptic type have been installed in a number of areas across the country in addition to seventeen of
the hydro-meteorological type installed in the main water catchments of the country.
13.1.2 Surface hydrological observations
There is need to improve the density of surface hydrological observing network in the country in order to enhance information on hydrological cycle towards better climate prediction, impacts and vulnerability assessment and adaptation planning. In addition there is need to monitor the trends of Mt. Kenya glaciers and the levels of lakes and rivers.
Although many river flow gauging stations have been registered over the years a significant number of them have ceased to operate or do not provide data on a regular basis.
The information provided by WRMA show that there are about four hundred and fifty five gauging stations that are operational to a reasonable extent. There is need to increase the observations density either by rehabilitating the non-functional ones or installing new ones.

41
13.1.3 Monitoring and research in agro-meteorology
Expansion of Network of stations: In order to improve the quality of information and products provided to various users for effective adaptation to climate change, there is need to increase the observation network. This requires optimisation of the network according to the population and associated activities and topographic distribution in the country
Improvement of data processing and dissemination: There is need to build capacity on data processing, analysis as well as archival by ensuring appropriate software and adequate hardware. Crop growth simulation models would also strengthen the yield forecasting aspects of the agro-meteorological bulletins currently being generated.
Stations’ ability to provide products: In order to improve provision of products to users at the local level, there is need to strengthen capabilities of the stations to provide different products that users may request at the farmer level. This is important to provide information closer to the users.
Stations maintenance: Regular maintenance of equipment at the observing stations is very necessary for quality data. Efforts need to be made to put in place a system that facilitates regular maintenance of equipment and instruments at the observing stations.
13.1.4 Carbon Cycle Observation and Research
In order for Kenya to participate effectively in observation and research on Carbon Cycle, there is need to establish carbon fluxes observation sites preferably within the global surface Network stations. However the equipment required is expensive and hence the need for developing partnership with institutions that are undertaking Carbon Cycle observations in order to build the required research and technical capacity. In particular, there is need to have a mobile carbon flux tower for CO2 measurements in a number of areas with different land use characteristics.
13.1.5 Global Atmosphere Watch (GAW) Station
There is need for equipment for:
• Measurement and analysis of greenhouse gases instead of the samples requiring to be sent abroad for analysis.
• Measurement of aerosol optical depth (Sun-photometer).
• Communication facilities linking the GAW station to world data centers and data quality assurance/scientific activity centers are crucial. In this regard, Internet connectivity at the GAW station can greatly improve the communication.
13.1.6 Urban Climate and Air Pollution Monitoring
As is the case with many other developing countries, Kenya’s urban centers are growing rapidly in spatial extent, population and human activities leading to changes in local climate and air quality. Urban climate and air pollution monitoring is therefore crucial for the study of climate change impact studies. However this activity has not been undertaken in a systematic way in the country because of lack of equipment. There is need to install appropriate equipment in major urban areas to enable studies of impacts of climate change on urban environment, public health and safety. KMD has an elaborate plan to install such stations in major urban areas of the country. The only handicap is financial resources. Only
one such station has, so far, been established at the University of Nairobi, Chiromo Campus.
13.1.7 Volunteer Observer Program
This is a program in which individuals, schools or companies volunteer to make observations on behalf of the national weather services. Volunteer observers are then trained in observation techniques and then provided with appropriate equipment for routine climate

42
parameters. This program can greatly enhance the density of systematic observation network in the country.
The system, if it is implemented, should be robust, user friendly and requiring minimum training to operate. Kenya Meteorological Department (KMD) has plans to design and mount short training courses for the volunteer observers and also to prepare equipment operation and maintenance manuals. It is estimated that to have an optimum volunteer network the number of volunteers should be in the region of 10,000.
13.2 Training Needs
Human capacity has to be developed in such areas as the systematic observations of climate change using the existing National and Global Networks. It is possible to make improvements on the existing institutional capacity in Kenya in order to participate in Climate Change research and Systematic Observations.
GAW and Carbon Cycle Observations are more specialized and the personnel need to be trained specifically for these activities. Therefore, Capacity building by training for monitoring including sampling techniques, data analysis and data management is necessary.
Urban climate and sir quality monitoring in major urban areas is very crucial. Capacity is needed to develop urban emission inventories and carry out urban climate studies, air pollution modeling, monitoring and forecasting.
The majority of climate scientists have the general knowledge of climate change. There is need for specialized training in aspects such as:
Climate variability and change studies.
Specialized training on climate change in areas such as impact assessments etc.
Climate change model development and application.
Specialized equipment maintenance and any other relevant courses.
The training for research especially in the area of modeling for impact assessment should be at post graduate level while in a number of specialized areas short term training courses and attachments to specialized institutions is a more practical option. University of Nairobi has the capacity to provide training in meteorology at both under-graduate and post graduate levels. Moi and Kenyatta Universities have Departments of Environmental Studies which can be utilized for some training needs. Short term specialized research and technical trainings can be undertaken at specialized institutions in other countries. Collaboration therefore needs to be developed with such institutions.

43
14. Institutional Collaboration
Climate change research and systematic observations are global and multidisciplinary requiring collaboration between institutions that are either specialized or are responsible for the various sectors in the country. There is therefore need to develop collaboration with universities and research institutions within the country as well as those that are outside. Some of the main institutions in the country that could develop collaboration include:-
• Kenya Meteorological Department (KMD).
• IGAD Climate Prediction and Application Centre (ICPAC).
• University of Nairobi (UoN).
• Moi University (MU)
• Kenyatta University (KU)
• Jomo Kenyatta University of Agriculture and Technology (JKUAT)
• Kenya Agricultural Research Institute (KARI).
• Kenya Forestry Research Institute (KEFRI).
• Kenya Marine and Fisheries Research Institute (KEMFRI).
• Coffee Research Foundation (CRF).
• Tea Research Foundation (TRF)
• Kenya Sugar Cane Research Foundation (KSCRF)
• Department of Remote Sensing and Resource Survey (DRSRS)
• Ministries responsible for Environment and Mineral Resources, Agriculture, Water, Energy, Transport and Communication, Industry,
• Kenya Association of Manufactures (KAM)
• Kenya Industrial Research and Development Institute (KIRDI)
• Kenya Medical Research Institute (KEMRI)
• Kenya Wildlife Service (KWS)
• Water Resources Management Authority (WARMA)
• Regional Development Authorities.
• And others.

44
15. Conclusions
On the basis of the contents of this report the following conclusions can be made:
• There are numerous sources of data in the country that can be used for the climate change studies with respect to impacts analysis and risk assessment.
• The surface climate observing stations are not distributed well enough throughout the country to enable satisfactory observation and monitoring of small scale climate processes that are driven by local features.
• Most of synoptic stations have long term data that can be used to undertake analysis of climate trends and impacts.
• The large number of volunteer observers is making a major contribution to the availability of surface observation data for the country.
• The upper air observations are currently not being made in a satisfactory way as it used to be the case before apparently because of lack of funds. It is therefore difficult to undertake analysis of the vertical profiles of temperature, moisture, pressure and wind fields.
• There is adequate agro-meteorological data for satisfactory assessment of the impacts of climate change in the agricultural sector.
• Hydrological stations are well distributed in all the 5 drainage basins in the country and the data can be used for satisfactory assessment of the impacts of climate change in the water resources sector.
• Satellite derived data collected by KMD, DRSRS and FEWS/NET is comprehensive and is being used to provide information to support decision making for contingency adaptation plans.
Climate models that are being made operational at the University of Nairobi in collaboration with KMD and ICPAC are able to simulate the various climate drivers at small spatial and time scales and do not require expensive equipment and are available for application to assess climate change impacts under Kenya’s conditions.
All the data and other relevant information are easily accessible from the institutions responsible for their collection and storage on request by the user. In addition the information can be obtained from websites of the institutions. KMD also disseminates weather and climate information through print and electronic media.
There is need to enhance institutional collaboration for more active and synergistic training and research programs in order to further strengthen the National Climate Change Response Strategy.
45
References
Hulme, M., Wigley, T.M.L., Barrow, E.M., Raper, S.C.B., Centella, A., Smith, S.J. and Chipanshi, A.C., 2000: Using a Climate Scenario Generator for Vulnerability and Adaptation Assessments: MAGICC and SCENGEN Version 2.4 Workbook. Climatic Research Unit, Norwich UK, 52 pp.
Raper, S.C.B., Wigley, T.M.L. and Warrick, R.A., 1996: Global sea level rise: past and future. (In) Sea-Level Rise and Coastal Subsidence: Causes, Consequences and Strategies (eds. J. Milliman and B.U. Haq), Kluwer Academic Publishers, Dordrecht, The Netherlands, 11–45.
Santer, B.D., Wigley, T.M.L., Schlesinger, M.E. and Mitchell, J.F.B., 1990: Developing Climate Scenarios from Equilibrium GCM Results. Max-Planck-Institut für Meteorologie Report No. 47, Hamburg, Germany, 29 pp.
Wigley, T.M.L., 1991: A simple inverse carbon cycle model. Global Biogeochemical Cycles 5, 373–382.
Wigley, T.M.L., 1993: Balancing the carbon budget. Implications for projections of future carbon dioxide concentration changes. Tellus 45B, 409–425.
Wigley, T.M.L., 2000: Stabilization of CO2 concentration levels. (In) The Carbon Cycle, (eds.
T.M.L. Wigley and D.S. Schimel). Cambridge University Press, Cambridge, U.K., 258–276.
Wigley, T.M.L. and Raper, S.C.B., 1992: Implications for climate and sea level of revised IPCC emissions scenarios. Nature 357, 293–300.
Wigley, T.M.L. and Raper, S.C.B., 2001: Interpretation of high projections for global-mean warming. Science 293, 451–454.
Wigley, T.M.L. and Raper, S.C.B., 2002: Reasons for larger warming projections in the IPCC Third Assessment Report. Journal of Climate 15, 2945–2952.
Wigley, T.M.L., Richels, R. and Edmonds, J.A., 1996: Economic and environmental choices in the stabilization of atmospheric CO2 concentrations. Nature 379, 240–243.
Wigley, T.M.L., Smith, S.J. and Prather, M.J., 2002: Radiative forcing due to reactive gas emissions. Journal of Climate 15, 2690–2696.

46
Appendix 1: List of people interviewed
INSTITUTIONS VISITED AND CONTACT PERSONS WHO WERE INTERVIEWED.
This report was based on review of background documents and personal and email correspondence with the key people in the institutions that collect and store various types of climate data and other types of climate related information. The technical assessment of the importance of the data in climate change adaptation planning was mainly based on the experience and expert view of the consultant after discussion with those interviewed.
The institutions visited and the contact officials who were interviewed are described below.
Kenya Meteorological Department (KMD).
The institution has the mandate, in the country, for collection and storage of climate data. It installs and operates the surface and upper air climate observing systems. It also receives data from volunteer observers and specialized data from international climate centres.
Contact persons interviewed:
Mr. Peter Ambeje, Deputy Director-- Weather Services.
Email address: [email protected]
Mr. Simon Gathara, Assistant Director--agro-meteorological Services.
Mail address: [email protected]
Mr. Johnson Maina, Assistant Director-- Hydrological Services.
Email address: [email protected]
Mr. Samuel Marigi, Assistant Director--Climate Modelling.
Email address: [email protected]
Ms. Mary Kilavi, Meteorologist—Working on climate trends.
Email address: [email protected]
IGAD Climate Prediction and Applications Centre (ICPAC)
This Institution undertakes seasonal climate prediction for the Greater Horn of Africa countries and it is based in Nairobi.
Contact person interviewed:
Mr. Philip Omondi- Scientist involved in climate modelling and prediction.
Email address: [email protected]
Department of Meteorology, University of Nairobi.
The Department is involved in training and research in meteorology.
Contact persons interviewed:
Dr. Christopher Oludhe—Senior Lecturer, involved in the downscaling of global climate models to regional scale and using Inter-Governmental Panel on Climate Change (IPCC) Greenhouse Gas Emission Scenarios.
Email address: [email protected]
Dr. Opere, Senior Lecturer- Working on hydrological data.
Email address: [email protected]

47
Dr. Fredrick Karanja—Senior Lecturer -Working on agro-meteorological data.
Email address: [email protected]
Dr. Gilbert Ouma—Senior Lecturer involved in satellite remote sensing.
Email address: [email protected]
Mr. Stephen Rwigi--Lecturer involved in downscaling of global climate models.
Email address: [email protected]
Kenya Agricultural Research Institute (KARI).
The institution undertakes agro-meteorological data collection and research in agriculture.
Contact person interviewed:
Dr. George Keya—Scientist.
Email address:[email protected]
Kenya Forestry Research Institute (KEFRI)
The institution undertakes research in forestry.
Contact person interviewed:
Dr. Vincent Oeba, Head- Climate Change and Carbon Sequestration.
Email address: [email protected]/ [email protected]
Water Resources Management Authority (WRMA)
The institution is responsible for the management of water resources in the country.
Contact person interviewed:
Lawrence Thooko—Surface Water Officer.
Email address: [email protected] :
Kenya Energy Generation Company (KENGEN).
The company is the main institution that is responsible for generation of hydro-power energy in the country.
Contact person interviewed: Pius Kollikho- Officer in charge of environment.
Email address: [email protected]
US Food Early Warning System-Network (USFEWS-NET).
The institution conducts crop performance for food early warning.
Contact person interviewed: Mr Gideon Kinyoda- Climate Scientist.
Email address: [email protected]
Department of Resource Survey and Remote Sensing (DRSRS).
The institution conducts surveys of changes in various natural resources mainly land cover changes including forest cover and human settlements.
Contact person interviewed:
Jasphat Agatsiva, Director—DRSRS
Email address: [email protected]/ [email protected]