Embed Size (px)
Citation preview

GOVERNMENT LED EXCLUSION OF
URBAN POOR GREATER
CONTRIBUTION AND LESSER RECIPIENT
The report is prepared by PRIA. The objective of the present study is to look
into the contribution of informal settlement households to urban economy.
Raipur Study
Report 2014

Pag
e1
ACRONYMS
BSUP Basic Service Urban Project
GDP Gross Domestic Product
GSDP Gross State Domestic Product
PHED Public Health Engineering Department
PPP Public Private Partnership
SAM Social Accountability Matrix

Pag
e2
Table of Contents
I. Introduction (Pg. 3)
II. Purpose (Pg. 3)
III. Methodology (Pg. 3)
IV. Positive Role of Informal Settlers (Pg. 4)
V. Urban Poverty Gets its Due Recognition in Census 2011 (Pg. 4)
VI. Chhattisgarh Demographic Profile (Pg. 4)
VII. Slums and City households CG, Census (Pg. 5)
VIII. Raipur District (Pg.6)
IX. Governance of Raipur City (Pg.8)
X. Study Concluded by PRIA (Pg.10)
XI. Other Conclusions (Pg. 19)

Pag
e3
I. INTRODCUTION
The phenomenon of increased urbanization in India is facing one of its foremost challenges in the form of
disparity between redistribution of economic opportunity and growth. The centre of poverty is gradually
shifting towards urban centres and this situation is further worsened by already high population densities,
poor infrastructure and a general lack of effective housing policy and provisioning for the poor. The Census
of India 2011 suggests that 66% of all statutory towns in India have slums, with 17.4% of total urban
households currently residing. However, this estimate of slums takes into account certain criteria set by the
Census for a settlement to be featured as a slum. A large proportion of households who are living in similar
or poorer dwelling conditions than those living in slums have been omitted. This study encompasses all those
settlements that comply with the definition of slums (as given by the Census of India) as well as those with
similar or poorer dwelling conditions that those of slums as ‘Informal Settlements’, because these are
primarily dwelling units where most of the urban poor live. Interventions should be targeted at all these
informal settlements instead of only slums as defined by the Census, since the quality of life and
infrastructure in these informal settlements are similar to those of slums. ( PRIA, 2013)
II. PURPOSE OF THE REPORT
The objective of the present study is to look into the contribution of informal settlement households to
urban economy. The primary reason for looking at this particular question is to determine whether the
informal settlement households, who normally form the poor strata of the urban population, do contribute to
the urban economy to a significant extent or not. If they do contribute to urban economy, whether providing
proper urban services to them should be treated as their legitimate right? For greater comprehension, this
study attempts to discover the role of informal settlement population as a productive agent in urban
economy, which is in contrast to the general notion that this section of population is “burden to the city.” (
PRIA, 2013)
III. METHODOLOGY
A primary survey of 50 top cities in India was conducted to achieve the study objective. The survey captured
various socio-economic–demographic dimensions of urban informal settlements dwellers in these cities. A
total of about 5350 households and about 24500 individuals were covered in the survey. The focus of the
questionnaire was to capture information about income–expenditure, employment, nature of job, education,
living conditions and the similar information to understand the economic component of their life as well as
their standard of living. Subsequently, we construct a social accounting matrix (SAM) of India that includes
urban informal sector as a component. SAM is the best possible tool that takes into account the inter-linkages
among various economic agents within an economy. One of the advantages of that it can incorporate certain
sections of households into a framework whereby the impact of that section on the economy in terms of
contribution to income (GDP) as well as the multipliers can be computed, thus allowing precise
quantification of the informal settlement population’s contribution to urban economy. In addition, the study
also captures the perceptions of non-informal settlement households regarding the role of the target segment
of population in a city life. This qualitative analysis provides an understanding of the shadow cost of non-
existence of this section of population in the urban centres. ( PRIA, 2013)

Pag
e4
IV. POSITIVE ROLE OF INFORMAL SETTLERS
On the contrary to the general notions, the study suggests that informal settlement dwellers play positive roles
in urban economy as well as urban life apart from a few known adverse roles. Their contribution to urban
GDP, and some of the “difficult to replace” nature of jobs they are engaged in, makes them an integral
productive economic agent of the urban economy. Based on the Census of India 2011 data, as well as primary
survey data of informal settlements of 50 cities, the study also suggests that a large proportion of the
households do not even have access to the basic facilities. As the services provided to this section of
population are often considered as favour to the community rather than their basic right, the approach and
attitude of the authorities needs to be re-examined. Certainly the informal settlement dwellers deserve the
basic facilities that other urban dwellers enjoy as their right. This needs to be translated into policies by the
policy makers and opinion leaders of the country. ( PRIA, 2013)
V. URBAN POVERTY GETS ITS DUE RECOGNITION IN CENSUS 2011
No uniform methodology existed to identify urban poverty and states have been using their own parameters
to reach out for providing benefits. Census-2011 has attempted to enumerate socio-economy data also at
household level such as quality of housing, water, electricity, literacy, access to education etc. Hashim
Committee report (full citation) states that as per ninth plan document the features of urban poverty are:
proliferation of slums, increasing casualization of labour, fast growth of informal sector, increasing stress on
civic amenities, increasing education deprivation and health contingencies.
There is change in approach and indicators in the current census than the previous census. The census 2011
has released data for slum blocks in more details for the first time. In earlier Census, it was more at
demography level limiting the study to blocks having 20,000 populations. In Census 2011 slum blocks have
been identified based on living conditions irrespective of population size - poor quality of living based on
combination of factors such as dilapidation, faulty arrangements and design of such buildings, narrowness or
faulty arrangement of street, lack of ventilation, light, or sanitation facilities etc. (Planning Commission, 2012)
VI. CHHATISGARH DEMOGRAPHIC PROFILE
Chhattisgarh is the 9th largest state in India in terms of area and 16th largest in population. It is 2nd largest
state in terms of forest coverage with 44% area covered under forest. It is a minerally rich state with 16% of
India’s minerals produced here. The state GSDP at current prices during the year 2011-12 is Rs 1.33 lakh
crores. In 2012-13 GSDP increased by 14% to Rs 1.54 lakh crores. Primary sector witnessed 14% increase,
manufacturing witnessed 13.8% and service sector 18.13%.
Status of Urban Slums at National Level (Census 2011)
Out of 4041 towns in country slums have been reported from 63% of towns (1.08 lakh slum blocks in
2543 towns comprising 137.49 lakh households). 37072 slum blocks have been notified, 30846 have been
recognized and 40,309 have been identified.
17.4% of 789 lakh household in country are slum households. Andhra Pradesh tops the list with 35.7%,
Kerala has least slum households as percentage of total households with 1.5%.

Pag
e5
Chattisgarh has an area of 1,35,191 kms. It has an overall population of 2,55,40,196 with 76% of popultion
living in rural areas. Out of which 1,28,27,915 are male and 1,27,12,281 are females. The decadel population
growth has been 22.59%. Population density is 189 per sq km as against 382 sq km of India. The gender ratio
is 991 for 1000 males which is the 2nd highest in India. The literacy rate is 81.45% among male and 60.59%
among female. The health indicators show improvement in healthcare during the decade, as Infant mortality
rate has decreased from 79 to 54%. Maternal mortality rate has decreased from 601 to 335 per lakh in 2001.
(Chhattisgarh Economic Review, 2012-13)
The decadal growth in urban and village population has been 23.3% and 18% respectively. Rural population
grew from 1.66 crores to 1.96 crores, while urban population grew from 42 lakhs to 59 lakhs.
Source: Chhattisgarh Population Census Data 2011
VII. STATUS OF CG HOUSEHOLDS CENSUS-2011
Chhattisgarh indicators from Census 2011
Chhattisgarh (CG) has 56.23 lakh households. Out of this 26.18 lakhs households (46.5%) are
considered good for living. 27.84 lakh households (49.5%) are considered in livable condition and
2.21 lakh houses(3.93%) are considered dilapidated.
Out of 56.23 lakh households 19% have water source in their home itself. Out of rest 81%
households, 54.5% have water source near their house and 26.5% of the households have to travel
far.
12.27% of households get treated tap water and rest are a combination of untreated water, well, river,
canal, lake etc.
75% of the households get electricity.

Pag
e6
24.6% of households have latrine facility within their home out of which, 10% have piped sewer
system. More than 41.59 lakhs (74%) households openly defecate and 80,239 households (34%) use
public latrine.
48.8% of the households avail banking facilities
31% of the households have televisions. 1.2% of the houses have computers with internet
connection, 29% of the households have mobile.
11% of household uses LPG. 3% household uses cow dung and 80% uses firewood
SLUM HOUSEHOLDS OF CHHATTISGARH, Census 2011 -
At 31.9%, Chhattisgarh ranks second in terms of %age of slum households to urban households.
There are 3,95,297 households identified as slums in Chhattisgarh. 57.4% are considered good,
39.4% livable and rest 32% under dilapidated condition.
36% have water source in their homes, 49% have water source in nearby area and rest 15% of the
household have to travel far off.
43% of household have access to treated water and rest use all other untreated sources like covered
well, hand pump, tube well etc.
92% of households have electricity.
49% have latrine facility within their homes out of which, 7.3% have piped sewer system. 1,64,626
(41.6%) households openly defecate and 38,278 households (9.6%) use public latrines.
32.2% have LPG and 1.84% use kerosene, 47% use firewood, 15% use coal/lignite or charcoal, 1.9%
use cowdung and rest use other sources.
47.5% of households use banking services
62% have Television, 5.1% have computer with internet, 6% have computer without internet and
52% of the houses have mobile phones.
VIII. RAIPUR DISTRICT
Backdrop
Raipur city comes under Raipur district. The district has a population of 19 lakhs. Raipur city is the capital of
CG and the largest city with population of 11.22 lakhs. It is an important commercial, industrial and
administrative centre of the region. Agricultural processing, steel, aluminium, sponge iron, plywood industries
provide economic base.

Pag
e7
With rapid urbanization, slum population in Raipur has increased drastically. 39% of households in Raipur
municipal area slum households. About 4.1 lakh people live in 86000 slum households in Raipur municipal
limits. (Raipur Municipal Corporation )
“Urban Raipur” status, Raipur District of Census 2011
There are 8,61,067 households in Raipur. Out of which 65% is rural and 35% is urban. 68% are
considered good, 30% livable and rest 2% under dilapidated condition.
2,99,151 households live in urban Raipur. 49% have water source in their homes, 36% have water
source in nearby area and rest 15% of the household have to travel far off.
45% of household have access to treated water and rest use all other untreated sources like covered
well, hand pump, tube well etc.
96% of households have electricity.
64% of household have latrine facility within their homes out of which, 5% have piped sewer system.
83,681 households (28%) openly defecate and 21,014 households (7%) use public latrines.
51% have LPG and 40% use firewood, 3% of household use coal/lignite/charcoal and rest use other
sources.
52.4% of households use banking services
71% have Television, 6.1% have computer with internet, 61% of the houses have mobile phones.
Raipur Slum Household Status, Census 2011
There are 80,274 slum households identified in Raipur. 61.28% are considered good, 35.16% livable
and rest 3.56% under dilapidated condition.
Households having number of dwelling rooms. 1.47% households have no exclusive rooms, 37.36%
households have one dwelling room, 31.79% households have two dwelling rooms and 29.38%
households live in three and above rooms.
70.16% slum households live in their own homes, 25.92% households live in rented homes and rest
3.93% live in other forms of home.
41.75% have water source in their homes, 14.52% have water source in nearby area and rest 43.73%
of the household have to travel far off.
52.73% of household have access to treated water and rest use all other untreated sources like
covered well, hand pump, tube well etc. 12.08% tap water from untreated source, 13.85% hand
pump, 18.06% tubewell and rest 3.26% use other sources of water.

Pag
e8
95.90% of households have electricity. Other sources of lighting used are 3.26% use Kerosene,
0.07% use solar energy, 0.10% use other oil, 0.09% use other sources of oils. 0.58% donot have any
form of lighting.
61.51% have latrine facility within their homes out of which, 4.40% have piped sewer system and
54.83% use septic tank and 2.28% have other form of disposal. 25.73% households openly defecate
and 12.73% households use public latrines.
24.925% of Slum Households in Patna have electricity, tap Water and latrine within their home
premises
45.41% of households use banking services.
70.48% have Television, 4.06% have computer with internet, 8.18% have computer without internet,
and 52.20% of the houses have mobile phones.
Type of houses 65.21% are permanent in nature, 24.78% are semi-permanent in nature, 9.43% are
temporary in nature and rest 0.59% are non-categorized.
IX. LOCAL GOVERNANCE STRUCTURE OF RAIPUR CITY
The administrative headquarter of Chhattisgarh includes, 4 revenue divisions, 18 number of districts, 149
Tehsils, 146 CD blocks, 182 towns and 20126 villages.
Raipur being the capital of state and the urban areas around it is called Raipur Urban Agglomeration (RUA).
Key agencies involved in urban governance are Raipur Municipal Corportion (RMC), State government
departments (Public Health Engineering, Medical & Health, Slum Upgradtion, Pollution control board,
housing board etc.)
RMC comprises 70 wards and has 70 elected councillors, headed by Mayor. Various committees comprising
elected members steer various functions. The executive wing of RMC is headed by commissioner and his
team of deputy commissioners, engineers, health officers and zonal commissioners. For administrative
efficiency, the wards are groups under 8 zones, each zone headed by a zonal commissioner. RMC takes care
of water, sanitation, sewerage, roads, street lights, secondary schools, parks, gardens, fire services. (Raipur
Municipal Corporation )

Pag
e9
Organogram: State Level Agencies
Source: Raipur, Chhattisgarh. City Development Plan (2006-2013)
The Governance in Raipur is divided in three area level agencies. Namely, Raipur Municipal Corporation,
Capital area Development Authority and Chhattisgarh Infrastructure Development Corporation
1) Raipur Municipal Corporation
RMC was formed in 1867 on 26th August 1961. The Raipur City is divided into 5 zones and 54
wards. It has 54 elected councilors respresenting each ward. The Mayor is elected directly.
2) Capital Area Development Authority
CADA is responsible for the planning agency for the capital city of Chhattisgarh.
3) Chhatisgarh Infrastructure Development Corporation
CIDC is entrusted with the development of city centre of Raipur and Bilaspur. It looks after
promoting and catalyzing private investments in infrastructure.
The Urban Development Department is another set up of the GoC oversees the urban issues and urban local
bodies. The Raipur Municipal Corporation has also started some Municipality sponsored programmes like;
Indira Sahara Yojana, Samajik Pension Yojana, Briddha Yojana and Goswara. With such good schemes does
the urban poor avail the benefits of such schemes. To ensure good governance in the state of Chhattisgarh,
the Government has removed redundant layers. The State has removed the number of departments from
over 50 to 18 together with closing 30 public sector enterprises. (State Urban Development Agency,
Chhattisgarh, June 2006. )

Pag
e10
Roles and Responsibilities – inter relationship of various departments
Source: Raipur, Chhattisgarh. City Development Plan (2006-2013)
X. STUDY CONDUCTED BY PRIA IN THE SLUMS OF RAIPUR
PRIA Study Report
PRIA had conducted a study in 50 cities of India. Where Raipur was also among them.
a) Key Findings

Pag
e11
b) Profiling of sample households
Demographic
Variable
Classification Proportion of
Respondents (%)
Gender Male 50
Female 50
Age Less than 20 45.4
20 – 39 38.6
40 – 59 15.99
Above 60 4.52
Educational
Qualification
Illiterate 29.00
Literate but did not complete Primary
school
24.93
Primary school completed but not
Middle school
21.13
Middle school completed but not
High school
17.80
Class 12 pass but not graduate 5.27
1) 70% of families have Ration card thus indicating satisfactory use of Public Distribution System
2) Aadhar enrolment is 34.6% among the urban poor
3) 92% people have voter id cards and have exercised their right to vote
4) Financial inclusion is low. 38% family in slums have savings account either in Bank or Postal
account. Credit facilities from financial institutes are negligible. 70% have borrowed from Bank,
20% people have borrowed from informal sources borrowings from Micro finance is very low.
5) 49% families in slums are migrants, roughly equally divided between inter-state and intra-state
migrants. 90% of migrant slum dwellers have been living for more than 5 years.
6) Expenditure component on food is extremely high which shows that their income level is just
enough to sustain.
7) Spending on education is negligible. State support may be needed for slum dwellers in
education at all levels from primry school, secondary school to tertiary education.
8) Staying in slum areas, their expenditure pattern is very high towards the food items and
intoxicants and very low component on rental. Hence, relocating to far places for rehabilitation
and resettlement of slum dwellers may make their earning unsustainable unless their job
location also changes to nearby areas.
Pag
e12
Graduate/Post Graduate 1.87
Source of
Earning/Livelihood
Industrial Worker 16.61
Skilled service worker 18.61
Unskilled service worker 55.66
Business owner 9.12
Employment Status Self Employed 10.85
Regular/ Salaried Wage 18.20
Casual Labour 70.96
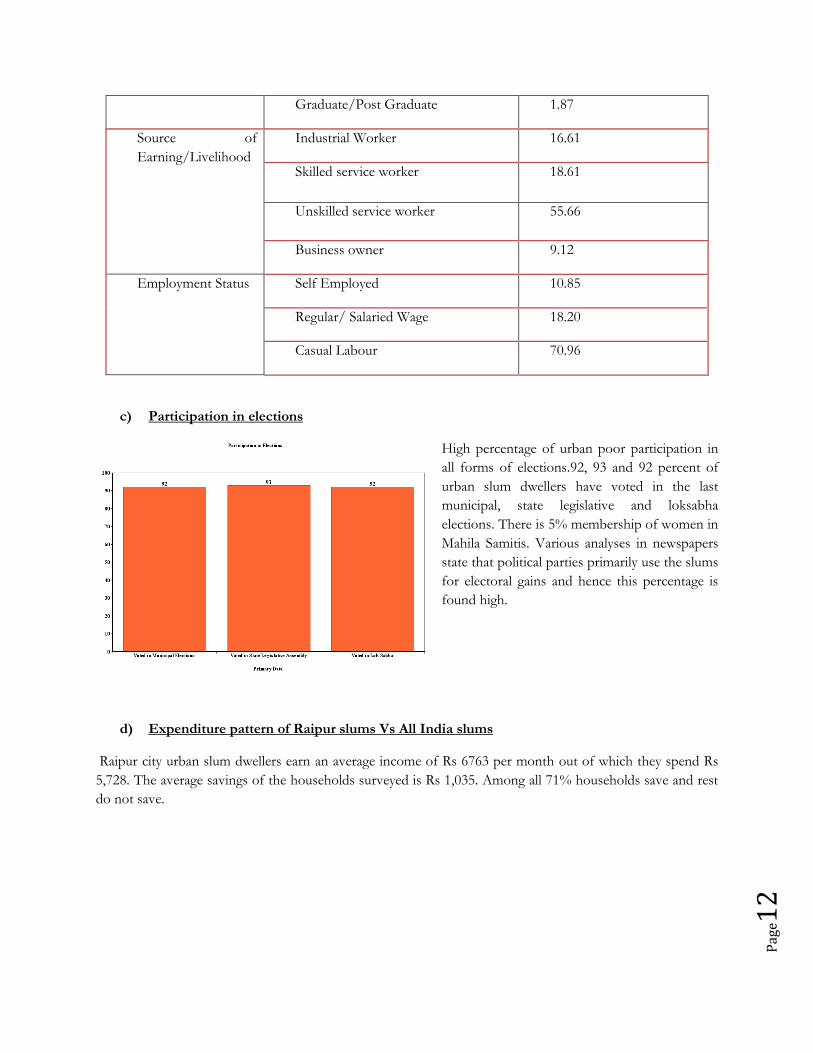
c) Participation in elections
High percentage of urban poor participation in
all forms of elections.92, 93 and 92 percent of
urban slum dwellers have voted in the last
municipal, state legislative and loksabha
elections. There is 5% membership of women in
Mahila Samitis. Various analyses in newspapers
state that political parties primarily use the slums
for electoral gains and hence this percentage is
found high.
d) Expenditure pattern of Raipur slums Vs All India slums
Raipur city urban slum dwellers earn an average income of Rs 6763 per month out of which they spend Rs
5,728. The average savings of the households surveyed is Rs 1,035. Among all 71% households save and rest
do not save.

Pag
e13
The urban slum dwellers of Raipur spend around 69%on food items, significantly higher than All India
average of 46% of urban slums. In all other categories, slums of Raipur spend much below the national
average.
e) Comparison with CPI of Chhattisgarh Urban Vs Raipur Slums
An attempt has been made to compare CPI of urban poor of Chhattisgarh urban with CPI of Raipur slums
S.No Groups Chhattisgarh Urban Raipur Slums
I Food, beverages and tobacco
35.28
72.04
II Fuel and light
8.02
3.93
III Clothing, Bedding and Footware 3.51 2.42
IV Housing
23.60
1.87
A Education
23.77
2.8
B Medical care
18.65
4.01
C Recreation and amusement (Entertainment)
9.51
1.27
D Transport and communication
22.63
7.29
Pag
e14
E Personal care and effects. (Purchase of personal vehicle and other personal goods)
10.24
0.26
F Household requisites (other articles)
13.06
3.56
G Others
Furniture and Fixtures
Utensils
Household appliances
Jewelry
Water charges
2.15
0.19
(Central Statistics Office, February 11, 2014)
From the above table we can see large variance in some areas. Such as:
Raipur slums spend 72% of their expenditure on food and intoxicants against 35% by Chhattisgarh
urban average.
Raipur slums spend negligible amount on housing whereas Chhattisgarh urban spends 23% on
housing.
Raipur slums spend negligible amount of 2.8% on education whereas Chhattisgarh urban spends
23.77% on education.
Raipur slums spend 4% on healthcare whereas Chhattisgarh urban spends 18.65%.
This shows that Raipur spends less on every aspect and more only on food items. Some important aspects
like education should have more spending.
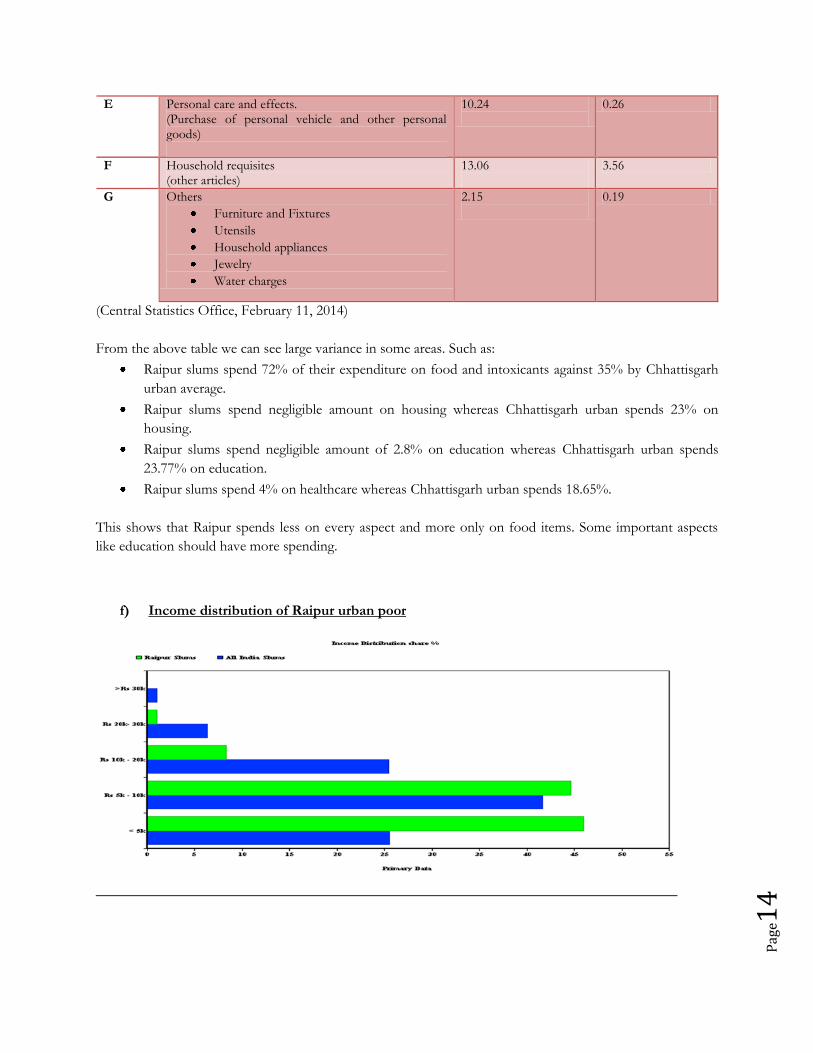
f) Income distribution of Raipur urban poor

Pag
e15
Out of the total sampled households, 70 %
save whose average monthly savings is, Rs
1,035. The state of Chhattisgarh has a high
percentage of savings. 46% of the households
earn a monthly income below Rs5000 per
month and they spend 91% of their income.
44% of households earn an average income
Rs5000 to Rs 10,000 and spend 84% of their
income. 8% of the households earn between
Rs10,000 to Rs 20,000 and spend 79% of
their income. 1% of the households earn an
income ranging from Rs20,000 to Rs 30,000
and they spend 82% of their income.
g) Asset ownership among Raipur urban poor
The ownership of assets in the form of availability of white goods like fans, mobile phones, vehicles, coolers,
computer, refrigerator et all is all positively skewed. TV, Mobile phone and electric fans is available in most
of the households. Refrigerator is in around 25% of the households and 60% have coolers.

Pag
e16
h) Distribution of Income across Livelihood and Educational Qualification
The average monthly earnings of Raipur urban poor are very below the All India average income level. The
income level of Raipur across employment status is 55% less for self-employed, 68% less and 63% less for
salaried and casual labor than All India slum average.
The average monthly earnings for industrial workers of Raipur 44% less than All India average. The skilled
worker, unskilled worker and business owner get 66%, 58% and 40% less than all India average of urban
slum dwellers. The industrial workers are defined as working in mills, factories etc. Skilled service workers
are the electrical, plumbing, tailoring, mechanic, driver and other artisans. The unskilled service workers
include domestic servants, rickshaw pullers, pushcart driver, watchman, petty traders and others.
The distribution of income according to education qualification is much below the national average. On an
average the Raipur slums earns half of the national average. Household members with no education earn 60%
less than national average. Respondents who have attained some level of education till Primary, secondary or
high school earn 62% less than all India slum average. Only household members who are professionals and

Pag
e17
have completed graduation earn better source of income. These professionals earn 62% higher than National
slum average.
i) Sources of Loan
While 17% of household have debt, 3% of the sample had taken loan during last one year. While 38.51% of
people have a savings bank account, borrowing is predominantly from informal sources. Insignificant number
of the people have post office savings account. 2% of households have Health Insurance and 13% of the
households have Life insurance. Out of the 3% households who had taken loan during last year, 70% have
borrowed from Bank, 10% from Microfinance. It shows that access to banking and micro finance though
slow is a recent phenomenon. Microfinance status is very low in Raipur where the sole intent of microfinance
is to provide financial assistance to the rural and the marginalized. Microfinance institutions and banks are
missing out on a huge opportunity by not tapping the potential of slums. In Raipur, 2% of the households
took microfinance credit to set up economic venture. 3% women have taken loan through microfinance for
group activity. Only 1% had membership in credit societies.
j) Status of various welfare benefits
In Raipur urban slums, only 4% of the people living in the households get old age pension, about Rs 300 per
month. 4% of the slum dwellers get widow pension of Rs 200 per month. Insignificant number of
households get disabled pension of Rs 250 per month. None of the families receive urban wage employment
scheme, housing assistance or skill training. 67% of the households use PDS to get various benefits. The
various benefits availed through PDS are 1kg of sugar, 25 kg of rice, 10 kg of wheat and 2 litres of kerosene.

Pag
e18
In Raipur, only 35% of the slum population of UID. Number of households using Annapurna Yojana is
66%.
k) Housing Status of Raipur Urban Poor
Land is an important economic resource and the ownership of such economic resource is important for every
family and household. Urban poor gets 60% of his source of income from the formal sector which he directly
and indirectly contributes to city level GDP. As an economic contributor he has the aspiration to land
ownership. In Raipur, only 19% of the slum households have Patta, which is an important document given by
Tehsildar for land ownerships. Households with Patta usually live in Pucca houses which are 15%. 48% of
the households have Possession Certificate document and might be living by Semi Pucca structured homes
which constitute 54% of slum households. 24% of sample surveyed live in Public land, Rest 9% live in
rented dwellings.
l) Migration
Migration is becoming a serious issue for cities like Raipur which can be seen from the decadal city growth of
23%. Growing urbanization and employment opportunities have attracted majority of the people away from
their home to earn basic livelihood. 49% among the Raipur urban poor are migrants. The demographics
show that 53%of migration is from other states to Raipur and migration within Chhattisgarh state is 47%.
88% Migration has been from rural to urban. 90% of the migrant households have migrated more than 5
years. The reasons of migration had primarily for employment opportunities.
Pag
e19
XI. Other Conclusion
Comparing with Raipur urban average, slum income levels are extremely low just enough for
survival. Food constitutes bulk of their expenditure much above urban average.
Spending on transportation is low in absolute terms, indicating that their livelihood is generated from
nearby locations.
At existing lower salary level, slum dwellers may be considered an irreplaceable part of economy.
This is a complex issue having many dimensions. When the state recognizes this, it should ensure
that access to basic amenities of drinking water, sanitation, hyeigine, public health and education is
not compromised. Present level of investment in these needs to be augmented and expedited.

Pag
e20
Bibliography
PRIA. (2013). Economic Contribution of Urban Poor. New Delhi: Indicus .
(2012-13). Chhattisgarh Economic Review. Raipur: Governemnt of Chhattisgarh.
Census. (2011). Census of India. Retrieved from http://www.censusindia.gov.in/
Central Statistics Office. (February 11, 2014). Consumer price index numbers - Separately for rural and urban
areas and also combined (rural plus urban). New Delhi : Ministry of Statistics and Programme
Implementation, Government of India .
Planning Commission. (2012). Report of the expert group to recommend the detailed methodology for identification
of families living BPL in urban areas. New Delhi: Government of India.
Raipur Municipal Corporation . Raipur Municipal Corporation. Retrieved from
http://www.nagarnigamraipur.com/About-Raipur
State Urban Development Agency, Chhattisgarh. (June 2006. ). City Development Plan, Raipur,
Chhattisgarh (2006-2013). Raipur .