Embed Size (px)
Citation preview
World Development Vol. 83, pp. 54–69, 20160305-750X/� 2016 The Authors. Published by Elsevier Ltd.
This is an open access article under the CC BY-NC-ND license (http://creativecommons.org/licenses/by-nc-nd/4.0/).
www.elsevier.com/locate/worlddevhttp://dx.doi.org/10.1016/j.worlddev.2016.03.006
Government Impartiality and Sustained Growth in Sub-Saharan Africa
PELLE AHLERUP a, THUSHYANTHAN BASKARANb and ARNE BIGSTEN a,*
aUniversity of Gothenburg, SwedenbUniversity of Siegen, Germany
Summary.— Many studies suggest that one of the main reasons for Africa’s dismal growth performance over most of the 20th century isits degree of ethnic fragmentation. Yet, there is still insufficient knowledge about whether ethnic diversity necessarily entails largeeconomic costs, or whether the implications of diversity depend, inter alia, on the government’s approach toward the ethnic question.We note that economic growth tends to increase average incomes, but it also affects the income distribution. Then, if growth is accom-panied by growing economic inequality, the perception of the impartiality of the government toward different ethnic groups is likely to beimportant for whether growth can be sustained, or whether sparks of growth will evaporate because of rising political divisions and inter-nal conflicts. In this paper, we study whether the degree of ethnic impartiality in the government’s policies is related to the emergence ofsustained growth in sub-Saharan Africa, irrespective of the actual content of the policies. We measure perceptions about the impartialityof the government with survey data from the Afrobarometer covering 20 countries starting in the late 1990 s. Our main definition ofsustained growth is when there is a GDP per capita growth rate of at least 2% for at least five consecutive years. Our empirical resultssuggest that countries whose governments are perceived as impartial are more likely to experience sustained growth. We conclude that inorder to ensure economic development, it is not only important to choose the ‘‘right” policies, but also to implement these policies in afair manner.� 2016TheAuthors. Published byElsevier Ltd.This is an open access article under theCCBY-NC-ND license (http://creativecommons.org/licenses/by-nc-nd/4.0/).
Key words — growth, institutions, sub-Saharan Africa
*We are grateful to seminar participants at the Department of Economics,
University of Gothenburg, for their comments on an earlier draft. We
thank Sida/Uforsk for financial support within the project ‘‘Fiscal
capacity and democracy in developing countries.” Final revisionaccepted: March 3, 2016.
1. INTRODUCTION
A short period of high growth is a relatively frequent eventeven in poor countries (Pritchett, 2000). What is less frequent,however, are extended periods of high growth. Based on thisobservation, many authors argue that the main differencebetween the growth miracles of the last century and the restof the developing world is the ability of the former to nurturea sudden spark of growth into a prolonged spell. There is thusa growing realization that the key economic challenge thedeveloping world is facing today is not to generate highgrowth rates per se, but to sustain growth once it emerges(Berg, Ostry, & Zettelmeyer, 2012).This paper contributes to the nascent literature on the polit-
ical economy of growth spells by exploring whether the impar-tiality of the government toward different ethnic groups is asignificant determinant of the incidence of sustained growthin a sample of sub-Saharan African countries. We ask, in otherwords, whether countries with an impartial government aremore likely to turn random sparks of growth into prolongedspells.Our dataset covers 20 sub-Saharan African countries from
1999 onward. 1 The empirical strategy is to relate the incidenceof appropriately defined periods of sustained growth to asurvey-based indicator of the perceived impartiality of thegovernment’s exercise of authority. The results suggest thatas the government becomes more impartial, the likelihood ofsustained growth increases.Government impartiality is a particularly important issue in
Africa given the continent’s highly fragmented ethnic land-scape. Many studies suggest that one of the main reasonsfor Africa’s dismal growth performance over most of the20th century is its degree of ethnic fragmentation (Easterly& Levine, 1997; Posner, 2004). 2 Yet, there is still insufficientknowledge about whether ethnic diversity necessarily entailslarge economic costs, or whether the implications of diversity
54
depend, inter alia, on the government’s approach toward theethnic question (Habyarimana, Humphreys, Posner, &Weinstein, 2008).More specifically, many authors treat public policies in
Africa as an outcome of ethnic divisions. For example,Easterly and Levine (1997) find that the quality of economicpolicies and public goods provision is lower in more frag-mented countries. But government policies, while subject toprevailing ethnic divisions, are determined by other factorsas well, such as the worldview and goals of its leaders,constraints on the executive and political accountability, inter-national political developments, and economic opportunities.We conjecture that such factors influence how leadersapproach the different ethnicities in their countries, and thatthe adopted approach toward the ethnic question, in turn,affects economic development.The argument for why government impartiality should
matter for sustained growth is as follows. Growth tends toincrease average incomes, but it also affects the income distri-bution. If growth is accompanied by growing economicinequality, the perception of the impartiality of the govern-ment toward different ethnic groups is likely to be importantfor whether growth can be sustained, or whether sparks ofgrowth will evaporate because of rising political divisionsand internal conflicts (Alesina, Michalopoulos, &Papaioannou, 2015). It is not uncommon that the economicgrowth disproportionally benefits certain ethnic minorities.In countries where the ethnic majority is politically dominant,increasing economic success of minorities might trigger policy

GOVERNMENT IMPARTIALITY AND SUSTAINED GROWTH IN SUB-SAHARAN AFRICA 55
responses that hamper the prospects of sustaining the growthtrend, such as increasing demands for more inter-group redis-tribution. 3 The economic consequences might be even worse ifgrowth benefits primarily a politically powerful majority. Inthis case, minorities could believe that the government activelydiscriminates them, which could lead to ethnic strife, politicalconflicts, attempts toward secession, or merely to increaseddemands for inter-group redistribution. 4 In Section 2, weelaborate the arguments for why impartiality could be relatedalso to economic performance in general.The most closely related previous study is Berg et al. (2012).
They explore various potential determinants of growth spellswith a worldwide sample, and find that growth duration isrelated to a number of economic and political factors. Theimportant political factor they identify is democratic institu-tions, but while they find a role of institutions in determiningthe length of growth spells, they do not study specific policiesor how policies are implemented. Our contribution over Berget al. (2012) is therefore the focus on the role of a specific but,for Africa, important issue: the impartiality of the governmentin its dealings with different ethnicities.Another related study is Johnson, Ostry, and Subramanian
(2010). By benchmarking the constraints for sustained growthin Africa, they identify ‘‘societal” fractionalization and inter-nal conflicts as particularly important. A third related studyis Tsangarides (2012), who finds that the determinants ofgrowth spells in Africa differ from the rest of the world, andthat in particular factors such as openness and droughts aremore important for African countries. Neither of these twostudies investigates the role of government impartiality.Our paper is also related to the literature that explores the
determinants of growth accelerations, i.e., periods wheregrowth begins to increase. One example from this literatureis Hausmann, Pritchett, and Rodrik (2005), who find thatpolitical regime change causes growth accelerations. Jointlyaddressing the relative importance of formal and informalinstitutions, Sen (2013) presents theoretical arguments andsupporting evidence that informal institutions matter forgrowth accelerations while formal institutions matter morefor growth maintenance. Easterly, Ritzen, and Woolcock(2006) use ethnic fragmentation as proxy for social cohesionand explore how social cohesion and its indirect effect on insti-tutions is related to annual growth rates (rather than the inci-dence of growth spells). Their results suggest that institutionalquality matters for how growth responds to social cohesion.Studies in this strand of the literature also do not addressthe role of government impartiality.This paper also draws insights from the political science liter-
ature on impartiality.While scholars from economics and polit-ical science mostly agree that good governance is important foreconomic development, they tend to differ in their understand-ing of the defining features of good governance. Economiststend to favor a broader definition, one that encompasses boththe implementation and the content of policies. For example,Kaufmann, Kraay, and Mastruzzi (2008) define governance asthe traditions and institutions that determine whether policiesare ‘‘efficient,” as traditionally understood by economists, aswell as how the policies are exercised, i.e., impartially, demo-cratically, or authoritarian. Political scientists, in particularRothstein and Teorell (2008), instead argue that a useful defini-tion of good governance should focus only on the ‘‘impartialityin the exercise of political authority,” irrespective of whether thepolicies themselves are ‘‘good” or ‘‘efficient.” The purpose ofour paper is to study whether government impartiality alonecan be an important determinant of growth spells, irrespectiveof the content of the policies that are being implemented.
The remainder of this paper proceeds as follows. Section 2offers a more elaborate discussion on the possible importanceof impartiality. In Section 3, we present our indicators forgovernment impartiality and sustained growth. Section 4 con-tains our empirical framework and our regression analysis,and Section 5 concludes.
2. IMPARTIALITY, GOOD GOVERNANCE, ANDECONOMIC DEVELOPMENT IN SUB-SAHARAN
AFRICA
(a) The importance of sustained growth for Africa
Sub-SaharanAfrica is the region of the world that has had theleast success in reducing poverty over the last decades. The rea-son for this inability is ex-ante unclear. One possible explana-tion is that African countries do not redistribute sufficientlyby transferring resources form the rich to the poor. On the otherhand, while inequality is indeed high in Africa, it has not chan-ged significantly over the last three decades (Ravallion & Chen,2012). Hence, more growth, and not more redistribution,appears to be the key for poverty reduction in Africa.There have been many instances of growth accelerations in
African countries, but they have seldom been extended for along time. Growth accelerations have become more commonand more sustained only in recent years (Berg et al., 2012),yet even these recent accelerations have not been evenly dis-tributed between countries. Arbache and Page (2010) note thatgrowth in sub-Saharan Africa has become somewhat morestable since the turn of the century, but they also find that thismore stable growth has led neither to improvements in invest-ments nor to better governance. Thus, the challenge to sustaingrowth remains, and it remains important to understand whatdoes and what does not lead to sustained growth in Africa.
(b) The role of institutions and policies
We now have a broad literature in economics on the role ofinstitutions for good governance. Kaufmann et al. (2008)define governance as the traditions and institutions that deter-mine how authority is exercised in a particular country. Theirdefinition includes three dimensions, namely the process bywhich governments are selected, held accountable, monitored,and replaced; the capacity of governments to manageresources efficiently and formulate, implement, and enforcesound policies and regulations; and the respect of citizensand the state for the institutions that govern economic andsocial interactions among them.Institutions tend to be persistent and difficult to change in
the short-run. For example, Acemoglu, Johnson, andRobinson (2001) and Acemoglu and Johnson (2005) find thatinherited property rights institutions are significant explana-tory variables in cross-country growth regressions. La Porta,Lopes-de-Silanes, Pop-Eleches, and Schleifer (2008) show thatthe (colonial) origin of the legal system determines contempo-raneous economic development. More recent research on therole of institutions gives attention to the contemporaneousfeatures of a country as well. Besley and Persson (2009), forexample, argue that the ability of the state to raise revenues,its state or administrative capacity, has a positive effect ondevelopment. Dincecco and Prado (2012) offer empirical sup-port for this hypothesis. Still, both the literature on historicalinstitutions and contemporaneous state capacity tend to beconcerned with the quality of policies as outcomes of institu-tions, while they are less concerned with whether these policiesare implemented in an impartial fashion.

56 WORLD DEVELOPMENT
Rothstein and Teorell (2008) argue that the definition ofgood governance typically employed in economics is toobroad. Good governance requires political equality on the ‘‘in-put” side of the relationship between a state and its citizens,and impartiality on the ‘‘output” side. Political equality isneeded in order to ensure equal access to political power. Bytheir definition, impartiality, the marker of good governanceon the output side, implies that ‘‘when implementing lawsand policies, government officials shall not take anythingabout the citizen/case into consideration that is not before-hand stipulated in the policy or the law” (Rothstein &Teorell, 2008, p. 168). Impartiality in their definition is thusa procedural norm that relates to the exercise of authorityand does not concern the content of policies, or how policymakers are elected. Their definition is close to what is gener-ally understood as the rule of law, which is part ofKaufmann et al.’s (2008) definition of governance, but stilldoes not include anything about the quality of policies orthe efficiency of the government. They hold that rights aremore important and fundamental than utility, and thus that‘‘impartiality is always preferable to efficiency” (Rothstein &Teorell, 2008, p. 182). Nevertheless, they contend that impar-tiality, since it implies meritocratic recruitment rather thanrecruitment based on political or clientelistic connections,may enhance efficiency.Is it reasonable to have such a strong focus on procedures?
To answer this question, we test whether a measure of impar-tiality can explain the sustainability of economic growth inAfrica. Impartiality can work in one of two ways toward mak-ing growth more sustained. Impartiality can work because it isan important determinant of quality of government, orbecause it proxies for the broad aspects of quality of gover-nance suggested by for example Kaufmann et al. (2008). It isplausible that an impartial government is also rational andefficient in terms of policy choice. An impartial approach togovernment may also be associated with secure property rightsand equality of opportunity, that is, also no ethnic favoritism(which may reflect the inclusive institutions emphasized byAcemoglu & Robinson, 2012).There has not yet been an attempt to test whether impartial-
ity leads to sustained growth in Africa. In an unpublishedmanuscript, Teorell (2009) uses a cross-section of 52 countriesto explore whether impartial governments have higher annualeconomic growth. Only South Africa is included from Africa,while the sample consists otherwise of developed and EasternEuropean countries. Using this small and unusual sample,Teorell (2009) finds that there is a significant relationshipbetween impartiality and economic growth.It is conceivable that the level of impartiality is higher where
the bureaucracy has stronger autonomy. If so, there is indirectevidence that impartiality matter for government perfor-mance. Cingolani, Thomsson, and de Crombrugghe (2015)find that bureaucratic autonomy matters more than statecapacity when it comes to fighting child mortality and tubercu-losis prevalence.
(c) Ethnic divisions, impartiality, and sustainability ofdevelopment in Africa
The effect of ethnic divisions on sustainable growth could bedirect or indirect. One could envisage that there is a directeffect of ethnic diversity, or lack of social cohesion, on eco-nomic growth and the sustainability thereof. This could takethe form of a lack of trust among economic agents, makingit harder to do business or to organize different forms of col-lective action. To capture this effect our empirical regressions
will, e.g., include a variable that captures the extent to whichan individual identifies with the nation rather than his or herethnic group.The indirect dimension concerns the government’s willing-
ness or ability to decide on and implement policies thatimprove the prospects for sustained economic growth. Wehypothesize that it will be harder to pursue an impartial devel-opment strategy in a society lacking social cohesion ornational consensus. In a divided society, it will be harder bothto agree on the content of policies and to ensure that they areimplemented without specific groups being favored. Easterlyand Levine (1997) hold that ‘‘Africa’s growth tragedy” canbe explained by reference to how ethnic divisions have fed intorent-seeking behavior and difficulties in agreeing on the provi-sion of such public goods that are needed for economicgrowth. This is in line with more recent findings that the qual-ity of government and the provision of public goods are lowerin societies with more social and economic inequalitiesbetween ethnic groups (Baldwin & Huber, 2010; Kyriacou,2013) and where ethnic groups are spatially more segregated(Alesina & Zhuravskaya, 2011).Further, it is commonly asserted that African policy-makers
often favor their co-ethnics and their home region. Forinstance, Kramon and Posner (2012) find evidence of ethnicfavoritism when it comes to educational outcomes in Kenya,and Hodler and Raschky (2014) find that foreign aid is dispro-portionately located to the leaders’ home regions. There is alsoindirect evidence that higher levels of perceived governmentimpartiality indicate less real ethno-regional favoritism.Ahlerup and Isaksson (2015) use the same question in theAfrobarometer as we use in this paper to construct our indica-tor of impartiality in their analysis of ethnic and regionalfavoritism. They show that respondents are less likely to saythat the government treats their group unfairly if they areco-ethnics with the president, live in the president’s homeregion, or live in a region where a large share of the populationbelongs to the president’s ethnic group. It is therefore likelythat lower levels of impartiality, as we measure it, is a reflec-tion of more intensive ethnic or regional favoritism. Consider-ing that such favoritism implies that governments do notallocate resources according to objective economic criteria, ahigh level of impartiality is a signal that common resourcesare allocated to individuals, regions, or sectors where theyare more likely to fulfill commonly agreed on goals, such asto ensure sustained economic growth. Furthermore, a plausi-ble assumption is that the pressure for between-group distribu-tion will be lower when people know that the government actsimpartially.Since a government that acts impartially effectively down-
plays ethnic identities, impartiality may have an effect onnation-building, often understood as being about forming acommon national identity. There is no agreement in the liter-ature about the benefits of nation-building policies. One theone hand, Bandyopadhyay and Green (2013) discuss variousforms of practical nation-building policies in Africa and findthem to be associated with a higher risk for conflict. Theyargue that this is because these policies acted as a ‘‘smoke-screen to advance the interest of the President and his party”and also ‘‘were highly controversial and led to more conflictthan integration” (Bandyopadhyay & Green, 2013, p. 115).On the other hand, Miguel (2004) argues that nation-building policies in Tanzania are the reason why there is nolink between ethnic diversity and lower public goods provisionin this country, while such a link is found in neighboringKenya. Ahlerup and Hansson (2011) uncover a non-linearrelationship between nationalism and governance; an increase

GOVERNMENT IMPARTIALITY AND SUSTAINED GROWTH IN SUB-SAHARAN AFRICA 57
in the sense of national identity is associated with better gov-ernance if the national identity is low, but worse governance ifnational identity is strong.Nation-building relates to impartiality in the following way.
By acting impartially, a government may over time contributeto create a common national identity for all its citizens, thuscreating a nation from a diverse landscape of ethnic identities.In this process, the ethnic group seizes to be important in eco-nomic and political life as one’s ethnic identity does not affecthow one is treated by the government. However, nation-building policies have throughout history, as noted by, e.g.,Tilly (1992), involved rulers actively seeking to homogenizetheir populations. Those whose ethnic identity or language isbeing forcefully suppressed will indeed not see the governmentas acting impartially.Poor economic growth in Sub-Saharan Africa can be
explained by reference to a volatility of revenues, publicinvestments, and aid (Museru, Toerien, & Gossel, 2014).Divided societies, and societies with a lack of social cohesion,may find it harder to respond effectively to economic shocks,as governments in such societies will be less capable of equita-bly allocating adjustment burdens across groups. It is alsolikely that transitions between governments after elections willbe more disruptive in such societies, since the new governmentmay feel that it is now their group’s turn to get their ‘‘fairshare.” Impartiality could thus imply more stable public poli-cies, as an impartial government is one that does not act tobenefit those groups that happen to have their members inpower at the time. Consider, for example, the disastrous con-sequences that followed the Kenyan elections in 2007, wherethe opposition felt that the incumbent government had‘‘stolen” the election (Wrong, 2009).To sum up the arguments, we contend that there are three
broad categories of mechanisms whereby impartiality maybe linked to sustained growth. First, impartiality implies lessethno-regional favoritism. Second, impartiality implies lessroom for rent-seeking. Third, as the stake in elections will belower, there will be more stability in economic and politicalconditions. Together, these mechanisms suggest that impar-tiality could lead to a more efficient use of available resourcesand higher social acceptance of potential relative changes inthe income distribution resulting from economic growth.
3. DATA
In this section, we first describe our main explanatoryvariables and then our definition of sustained growth.
(a) Impartiality
(i) Impartiality indexThe main explanatory variable is an index, the Impartiality
index, which represents the share of the population in a coun-try that thinks that the group they identify with is treatedfairly by the government.The Afrobarometer (2013) is a pan-African survey project
that since 1999 has led detailed individual-level surveys in anincreasing number of African countries. Starting with 12countries in the first round, they now cover more than 30countries in the sixth round. To assess the effect of impartialityon sustained growth, we need a sufficient number of years afterthe conclusion of each wave to identify sustained growthperiods. The fourth wave, conducted in 2008–09 and covering20 countries, is therefore the last wave we can use in thispaper. We thus draw data from the first four rounds of the
Afrobarometer survey, conducted during 1999–2009, and geta sample that consists of up to 20 countries. During this period,a total of 66 surveys were made, but the question used to createthe Impartiality index was not asked in two of them; the 1999survey in Ghana, and the 2005 survey in Zimbabwe.The following refers to the wordings used in the fourth wave
of the Afrobarometer. There are minor nuances in the exactphrasing of the relevant questions between the waves, see theAppendix for details. First, the respondents are asked theopen-ended question ‘‘What is your tribe? You know, yourethnic or cultural group.” In a follow-up question, they areasked ‘‘How often are ____s [R’s Ethnic Group] treatedunfairly by the government?” The respondent can chosebetween the pre-defined answers ‘‘Never,” ‘‘Sometimes,”‘‘Often,” and ‘‘Always.” Of these alternatives, only ‘‘Never”corresponds to an assessment that one’s group is treatedimpartially by the government. For this reason, we give eachrespondent the value one if they answer ‘‘Never,” and zerootherwise. We use the sample weights of each respondent tocalculate the share of the population for each country thathas a value of one. Our index thus relies not on the specificdegree of perceived partiality, but on whether the respondentsperceive it to be altogether absent. A complete list of all obser-vations of the Impartiality index that can be coded from theAfrobarometer can be found in Table 5 in the Appendix.Table 1 presents summary statistics for the Impartiality
index and the other variables used in the empirical analysis.Less than half of the populations in these sub-Saharan Africancountries feel that their group is never treated unfairly. Thereis considerable variation in perceived government impartiality,with the lowest value on the Impartiality index (8%) comingfrom the 1999 survey in Zimbabwe, and the highest value(88%) coming from the 2009 survey in Madagascar. Figure 1shows the Impartiality index averaged by country over thewhole sample period. There is no obvious geographical pat-tern or clustering, and there is no apparent systematic differ-ence between countries of the more Francophone WestAfrica and the more Anglophone East Africa. The highestaverage values are found furthest to the east, Madagascar(0.87), and furthest to the west, Senegal (0.76).The Impartiality index builds on answers to a question of
whether individuals perceive that the government has treatedtheir ethnic group fairly. The respondents are here likely toconsider, e.g., the allocation of public expenditures on itemslike education, health, and infrastructure, the allocation ofjobs and positions of influence, and security-related issues.All else equal, more people in countries where the governmentallocates these along ethnic or regional lines are likely say thatthe government treats their group unfairly. That is, the mea-sured level of the Impartiality index will be lower. Simplyput, people think it is unfair if they do not get their fair shareof government resources or if they are denied their fair shareof influence. In this African context, we thus primarily believethat impartiality would mean an absence of ethnic or regionalfavoritism. Such favoritism would go against resources beingrationally allocated, in the sense of supporting the poor orpromoting growth.Ahlerup and Isaksson (2015) find that members of the pres-
ident’s ethnic group more seldom feel unfairly treated. Thismakes it relevant to ask whether higher levels on the Impartial-ity index reflect that the government acts fairly (impartially)toward most or all groups or that respondents who belongto the president’s ethnic group, and therefore are favored bythe government and thus perceive the government to be fair,make up a larger fraction of the population. We drew informa-tion on the ethnicity of the president in 2005 from Ahlerup

Table 1. Summary statistics
N Mean Std.Dev. Min. Max.
Sustained growth 64 0.22 0.42 0 1Impartiality index 64 0.43 0.21 0.08 0.88Gini 61 50.85 9.97 33.83 74.33Linguistic fractionalization 61 0.7 0.23 0.02 0.92Ethnic fractionalization 64 0.67 0.19 0.25 0.93Religious fractionalization 64 0.61 0.22 0.08 0.86Polity2 64 5.16 3.75 �4 10GDP per capita 64 2,310.86 2,336.92 396.53 9,695.64Quality of government 53 0.42 0.1 0.22 0.67Internal conflict 37 8.74 1.53 5.83 12Government consumption 64 0.15 0.06 0.02 0.28Natural resource rents 64 9.80 10.80 0.32 47.12Price level of investment 64 0.53 0.19 0.04 1.25Inflation 60 10.22 7.36 �0.29 44.80Real effective exchange rate 61 99.19 14.65 59.57 154.43Population size 64 24,142,397 32,333,487 459,140 151,208,080National identity index 53 0.48 0.17 0.17 0.88
Notes: The table presents summary statistics for observations with data on the Impartiality index.
Figure 1. Average Impartiality index (1999–2009).
58 WORLD DEVELOPMENT
and Isaksson (2015) and investigated whether excluding mem-bers of this ethnic group makes a difference when calculatingthe Impartiality index for the third round of the Afrobarome-ter survey conducted in 2005–06. The effect on the Impartialityindex is surprisingly modest, with a typical change of a fewpercentage points or less. We observe the same stability inthe index if we omit respondents from the largest ethnic groupin each country when calculating the index. We are thereforereasonably certain that the Impartiality index does not simplycapture the relative size of the president’s (potentially favor-ably treated) ethnic group.We also calculated the value on the index separately for each
ethnic group within each country. There were between-groupdifferences within all these sub-Saharan African countries,but, importantly, also the lowest group-level values whereclearly higher in countries where the value on the (country-level) Impartiality index was higher. Therefore, higher valueson the Impartiality index do not simply come from a bettertreatment of major population groups, but also reflect that
members of the least favored groups in each country reportthat they feel more fairly treated. 5
(ii) Relationship between the impartiality index and otherindicators of democracy and governmentThe theoretical concept of impartiality is a distinct one, but
can what is measured by the Impartiality index also be reason-ably separated from what is measured by other popular indi-cators of democracy or governance? That is, does theImpartiality index also in practice relate to aspects of howthe affairs of the government are conducted that are notalready captured by other indicators that have been used inmany previous studies in economics and political science?In this sub-section, we discuss how the Impartiality index
relates to two popular indicators that are based on informa-tion collected by experts and investors, the Quality of Govern-ment and Polity2. As these are but two of many existing broadand aggregated proxies for governance and democracy, theprimary objective of the discussion in this sub-section is not

GOVERNMENT IMPARTIALITY AND SUSTAINED GROWTH IN SUB-SAHARAN AFRICA 59
to paint a complete picture of how the different theoreticalconcepts relate to each other, but to provide a brief illustrationof the empirical added value of the Impartiality index. In thenext sub-section, we proceed by discussing more in detailhow the Impartiality index has evolved in a selection of coun-tries.Quality of Government combines assessments of the level of
corruption, law and order, and bureaucratic quality. A highervalue indicates higher quality of government. We draw Qualityof Government from Teorell et al. (2015), but it is originallyfrom the International Country Risk Guide (ICRG), a set ofreports made by the consulting firm Political Risk Service(PRS) Group as a service to their international clientele(PRS Group, 2015). Given the market they cater for, it seemslikely that what the PRS Group summarizes as Quality ofGovernment is primarily what international investors wouldperceive as unfair or negative for efficiency. Asked about thefairness of government, the average citizen probably considersa set of characteristics that does not fully overlap with thoseconsidered by international investors. It is therefore possibleto have movements in the Impartiality index and the Qualityof Government going in different directions. Figure 2 showshow the Impartiality index measured in different surveys relateto Quality of Government for the same country and year. Qual-ity of Government seems virtually uncorrelated with the Impar-tiality index. This can also be seen from the correlationcoefficient of �0.02 between the two indicators, see the corre-lation matrix in Table 2. What we capture with the Impartial-ity index is thus quite distinct from what the PRS Groupmeasure in order to create this indicator of governance.The Polity IV-project’s Revised Combined Polity-score Poli-
ty2 (Marshall & Jaggers, 2002) captures democracy in a formalsense. A higher score on Polity2 indicates a more democraticsystem. Polity2 is aggregated from various sub-indicators,some of which clearly relate to the quality of democracy atthe central level of government rather than at the local level(Woodruff, 2006). Figure 3 shows how the Impartiality indexmeasured in different waves relate to the Polity2-scores. Whilethey appear to be positively correlated for the sample as awhole, suggesting that governments in more democratic coun-tries treat their populations more impartially, countries canalso experience changes in the Impartiality index between sur-vey waves without corresponding changes in their Polity2-score. The Impartiality index is thus not simply an indicatorof formal aspects of democracy.
Figure 2. Impartiality index and ICRG’s Quality of Government.
In sum, also in practice the Impartiality index capturessomething else than these two indicators of democracy andgovernance. While this, in principle, suggests less of a needto control for these two in our regressions, we include bothof them as control variables to reduce the omitted variablesbias.
(iii) The impartiality index in selected countriesTo validate that the impartiality index indeed measures gov-
ernment impartiality, we discuss in this section the value andevolution of the index in various African countries. In general,it is clear that governments in Africa are often partial, and thatmuch of the partiality is along ethnic lines. However, as shownby the range in the Impartiality index, there are also importantdifferences between countries in the degree of perceived impar-tiality.We first consider Kenya, which is a rather typical case for
Sub-Saharan Africa. Kenya was a colonial construct withabout 40 different ethnic groups. At independence, there wasa clear imbalance in influence between groups with the Kikuyubeing dominant. The politics since has largely been aboutbuilding coalitions to be able to rule, and these coalitions haveessentially been ethnically based. There is no pronounced left–right dimension in Kenyan politics. Instead, much of publicpolicy has been debated and understood in terms of ethnic dis-tribution. This suggests that government resources are used inways that are not primarily geared toward generating develop-ment or growth for the country as a whole. It is no coincidencethat the book on the 2007 election by Wrong (2009) has thetitle ‘‘It is our time to eat.” The Luo-dominated group, whohad previously been excluded from power, considered them-selves as winners after the 2007 election and as such entitledto a period in power, and to a shift in resources in their direc-tion. Their focus was not how to make sure that the new gov-ernment was impartial, although that has always been theofficial party line of all parties.The three observations on the perception of impartiality for
Kenya show a gradual increase from 0.15 in 2003 to 0.24 in2005 and to 0.27 in 2008. This is consistent with the eventsin terms of governance on the ground in Kenya, and therewas also a gradual upward shift in economic growth untilthe post-election drop in 2008. Mwai Kibaki became Presidentin December 2002, replacing Daniel arap Moi who had ruledfor 23 years and whose reign was characterized by extensivegovernment corruption and ethnic politics. Therefore,Kibaki’s government started from an extremely low level ofperceived impartiality. His new party was called the NationalRainbow Coalition (NARC), signaling a desire to reduceethnic partiality. Immediately, he started an officialanti-corruption campaign promising to end governmentcorruption. He put ministries and government corporationson performance contract in 2005, to make them more account-able, and took action to clean up the police force. In practice,he also condoned various instances of corruption. It seems asif his party was involved in the rigging of the December 2007elections, which should have affected perceptions in the oppo-site direction. Still, Kibaki’s first period was overall clearly amove in the direction of more accountability than during theMoi era. It is reasonable to assume that the combined effectof the new measures increased the faith in the impartiality ofthe government. This supports the view that variation in ourindicator of government impartiality captures how govern-ments have changed the way they interact with their citizens.Another interesting case is South Africa. Under apartheid,
the country was at one extreme in terms of political inequalityalong ethnic lines, although the implementation of these unjust

Table 2. Correlations
1 2 3 4 5 6 7 8 9 10 11 12 13 14 15 16 17
1 Sustained growth 1.00
2 Log Impartiality index 0.11 1.00(0.39)
3 Polity2 �0.34 0.31 1.00(0.01) (0.01)
4 Log Gini �0.46 �0.10 0.52 1.00(0.00) (0.43) (0.00)
5 Log Linguistic fractionalization 0.26 �0.30 �0.18 �0.12 1.00(0.04) (0.02) (0.16) (0.39)
6 Log Ethnic fractionalization 0.23 �0.11 �0.20 �0.39 0.32 1.00(0.07) (0.37) (0.11) (0.00) (0.01)
7 Log Religious fractionalization 0.04 �0.32 �0.31 �0.02 �0.01 0.13 1.00(0.77) (0.01) (0.01) (0.88) (0.92) (0.29)
8 Log National identity index 0.10 �0.06 �0.05 0.00 �0.10 �0.03 �0.06 1.00(0.48) (0.69) (0.70) (0.99) (0.49) (0.81) (0.68)
9 Log GDP per capita �0.38 �0.11 0.27 0.58 �0.02 �0.40 0.04 0.15 1.00(0.00) (0.40) (0.03) (0.00) (0.85) (0.00) (0.77) (0.28)
10 Log Quality of Government 0.05 �0.02 �0.06 0.29 �0.09 �0.25 0.30 0.27 0.37 1.00(0.73) (0.88) (0.68) (0.04) (0.51) (0.07) (0.03) (0.08) (0.01)
11 Log Internal conflict �0.08 0.50 0.51 0.44 �0.17 �0.39 �0.21 0.19 0.27 0.30 1.00(0.64) (0.00) (0.00) (0.01) (0.32) (0.02) (0.21) (0.35) (0.11) (0.07)
12 Log Government consumption 0.33 0.15 �0.26 �0.11 0.11 �0.23 �0.27 �0.00 �0.12 0.30 0.21 1.00(0.01) (0.24) (0.04) (0.41) (0.42) (0.07) (0.03) (0.98) (0.36) (0.03) (0.22)
13 Log Natural resource rents 0.23 �0.05 �0.37 �0.54 0.15 0.43 0.42 �0.37 �0.53 �0.55 �0.61 �0.22 1.00(0.07) (0.67) (0.00) (0.00) (0.25) (0.00) (0.00) (0.01) (0.00) (0.00) (0.00) (0.08)
14 Log Price level of investment 0.08 0.19 0.39 0.03 0.06 0.29 �0.13 �0.12 �0.21 �0.09 0.08 �0.17 0.17 1.00(0.51) (0.13) (0.00) (0.80) (0.65) (0.02) (0.29) (0.41) (0.10) (0.52) (0.62) (0.19) (0.18)
15 Inflation �0.01 �0.11 0.01 �0.05 �0.04 0.22 0.39 �0.30 �0.22 �0.04 0.13 �0.28 0.34 0.02 1.00(0.92) (0.39) (0.93) (0.68) (0.78) (0.09) (0.00) (0.03) (0.09) (0.76) (0.47) (0.03) (0.01) (0.86)
16 Log Real effective exchange rate index 0.15 0.26 �0.16 �0.27 0.02 0.03 �0.07 �0.03 �0.11 0.13 �0.06 0.23 0.01 0.00 �0.12 1.00(0.23) (0.04) (0.23) (0.04) (0.85) (0.81) (0.57) (0.81) (0.38) (0.36) (0.72) (0.08) (0.96) (0.97) (0.37)
17 Log Population size 0.11 �0.27 �0.37 �0.47 0.28 0.69 0.44 �0.00 �0.31 �0.49 �0.70 �0.35 0.69 0.07 0.20 0.01 1.00(0.38) (0.03) (0.00) (0.00) (0.03) (0.00) (0.00) (0.97) (0.01) (0.00) (0.00) (0.01) (0.00) (0.58) (0.12) (0.96)
Notes: The table presents raw pair-wise correlations (p-values) for observations with data on both the Impartiality index and Sustained growth.
60WORLD
DEVELOPMENT

Figure 3. Impartiality index and democracy.
GOVERNMENT IMPARTIALITY AND SUSTAINED GROWTH IN SUB-SAHARAN AFRICA 61
laws may have been impartial (Rothstein & Teorell, 2008). 6
Differential treatment of different ethnic groups (white, col-ored, African) was legislated. This led to a long struggle fordemocracy, which ended in 1994 when the first democraticelections were held. The coming of majority rule eliminatedthe legislative discrimination of certain ethnic groups. While,as argued above, not mechanically related, it is likely thatthe unjust content of the laws under apartheid also entailedthat these laws were implemented in a partial fashion, i.e., thatespecially black citizens were discriminated against in theimplementation of policies (in addition to any discriminationalready enshrined in the laws). Hence, it seems natural thatperceptions of partiality should decline strongly as the apart-heid system was dismantled. In addition, it is also likely thatwhen answering the question about being treated fairly bythe government, respondents not only take into account howlaws are implemented but also whether they explicitly stipulatediscriminatory practices. Our impartiality data do not coverthe 1990 s, but our impartiality index increased from 0.14 in2000 to 0.49 in 2006 (followed by a drop to in 2008). The ini-tial post-apartheid period saw falling per capita incomes until2002, followed by a steady increase until the beginning of theglobal financial crisis. The increase in the impartiality indexseems reasonable given the elimination of laws favoring thewhites. Even the introduction of affirmative action in favorof Africans may be perceived by the majority as fair given pre-vious injustices. The drop in 2008 may reflect disappointmentwith the ability of the new government to live up to expecta-tions. The case of South Africa highlights a potential discrep-ancy between the theoretical concept of impartiality and ourindicator, the Impartiality index. The theoretical concept refersonly to the exercise of authority, and it would in principle bepossible to consider the apartheid system as impartial if it wasimplemented with impartiality, but the Impartiality Indexcould capture perceptions also about political equality, i.e.,whether people feel there is impartiality in the access to polit-ical power. However, since the question in the Afrobarometerthat we use to create the Impartiality index specifically refers tohow one’s group is ‘‘treated by the government,” we believethat most respondents will understand it in terms of the exer-cise of authority, rather than the access to power, and thispotential discrepancy will be of little practical importance inour context.Another type of ethnic division is between the Indian minor-
ity and the black majority in several African countries. In thecase of Uganda, the sizeable Indian group was successful in
business, which led to animosity against it in broad groupsof the population. When Idi Amin took power in 1971, hesoon started with a policy of expropriating the assets of theIndian minority and then driving them out of the country.This was a policy that early on had some support in the pop-ulation, but the economic consequences for the country werevery negative. To control the country Amin also placed mem-bers of from his ethic group, the Kakwas, and allied groupsfrom West Nile and South Sudan, into positions of power inthe government and in the army, while he persecuted otherethnic groups, such as the Acholi and the Lango. Apart frompursuing ethnically divisive policies, Amin’s regime was char-acterized by corruption and inefficiency, political repressionand extensive human rights violations. During Amin’s eight-year reign GDP per capita fell by over a third and the shareof industry in GDP fell from 13% to 4%.There are, of course, also examples of countries that have
managed to handle ethnic diversity in a better way. It seemseasier to manage situations with numerous groups of moder-ate size than when there are a few dominant groups competingfor power. In Tanzania, there are more than 120 ethnic groupsand none is large enough to dominate the political scene. Afterindependence in 1963, President Julius Nyerere embarked on amission of nation-building and African socialism. The latterstrategy did not manage to build an efficient economy andwas essentially abandoned in the mid-1980, but the nation-building effort, including the attempt to establish Kiswahilias the national language, was more successful. It may wellbe that the sustained economic recovery, with stable growthsince the turn of the century, has been helped by the develop-ment of a state acting with reasonable impartiality. We notethat our last observation for Tanzania for 2008 is as high as0.63, while the number for Uganda in the same year was alow 0.18.
(b) National identity
To complement the Impartiality index, we construct aNational identity index, reflecting social cohesion in the sensethat it measures the share of the population that has a strongerattachment to their nation than to their (ethnic) group. Morespecifically, the National identity index represents the share ofthe population that identifies more with their nation, i.e., thecountry in which they live, rather than with their own groupor equally with both nation and group. The National identityindex can be coded from the second, third, and fourth waveof the Afrobarometer. On average, one in two identifies morewith their nation. The lowest and highest value on theNational identity index are for Nigeria in 2006 (17%) and Tan-zania in 2006 (88%).
(c) Sustained growth
There is no consensus in the literature of what constitutessustained growth. Previous studies have focused on aspectssuch as structural breaks or transitions between growthregions, (Jerzmanowski, 2006; Kar, Pritchett, Raihan, &Sen, 2013), growth accelerations (Hausmann et al., 2005),growth collapses (Hausmann, Rodriguez, & Wagner, 2007),duration of growth spells (Berg et al., 2012; Tsangarides,2012), or both growth accelerations and growth maintenance(Sen, 2013).In this study, we are not investigating whether government
impartiality is specifically linked to only growth accelerations,only growth decelerations, or only the length of growth spells.Instead, we investigate whether government impartiality can

62 WORLD DEVELOPMENT
explain why some countries manage to sustain a reasonablyhigh GDP per capita growth for a number of years while othercountries either have low growth or occasionally have highgrowth but cannot sustain it. We hold that this is a reasonableapproach given that data on our variable of interest, govern-ment impartiality, is available only from the end of the1990 s. The sample period is therefore quite short, and weneed a definition of sustained growth that provides us with asufficiently large sample. To focus only on growth accelera-tions or structural breaks would mean not searching for fac-tors that characterize countries that year after year continuesto experience high growth. Further, if we focused on deceler-ations or end of growth spells, we would lose observationsfor countries that were still in a period of relatively highgrowth at the end of our sample period. For instance, Liberiahas had a GDP per capita growth higher than 2% since 2005,and Zambia since 2003. We do not know how long thesegrowth spells will last. It does not seem reasonable neitherto code them as ending in 2013, simply for the reason thatwe do not know the future, nor to omit them from the analysison the basis that their growth spell is too long. Thus, while wein principle agree with, e.g., Sen (2013) on the virtues of under-standing transitions between different growth phases, andagree that structural breaks, growth accelerations, growth col-lapses, and duration of spells are important, we believe thatfindings based on our definition of sustained growth can addto the literature.A fairly common practice is to set the required threshold for
growth in the range of 2% to three and a half percent, and theduration of growth spells are often required to be at least fiveor eight years. In the definition of sustained growth used in thebaseline regressions, we follow this practice in principle butstill opt for a relatively generous definition of sustainedgrowth. We set Sustained growth to one if the growth rate inGDP per capita (World Bank, 2015) is 2% or more duringthe present and the next four years, i.e., for a period of at leastfive consecutive years. If this condition is not met, we set thisvariable to zero. We report robustness tests with other defini-tions. A threshold of 2% annual GDP per capita growth clo-sely follows studies such as Berg et al. (2012). In their study,Berg et al. (2012) analyze growth spells with a length of eitherfive or eight years. At the time of writing, the latest year for
Figure 4. Share of years with Su
which we could obtain growth in GDP per capita was 2013.Since we regress Sustained growth on lagged governmentimpartiality, a threshold of five years means that 2008 wouldbe the latest year for which we could use data on Impartiality,and a threshold of eight years means that 2005 would be thelatest year. Considering our short sample, we chose the lessrestrictive threshold of five years. We provide evidence show-ing that our conclusions are not excessively sensitive to thischoice. About one-fifth of the country-years in this samplehad sustained growth during the sample period, see Table 1.Figure 4 shows the average share of the years during 1999–
2009 that are coded as having sustained growth. In contrast towhat we saw for the Impartiality index, the East African coun-tries seem to have done much better when it comes to acquir-ing sustained growth.
4. EMPIRICAL FRAMEWORK AND REGRESSIONANALYSIS
(a) Empirical framework
The empirical specification to be estimated as a linear prob-ability model is
Sustained growthi;t ¼ ai þ c� Impartiality indexi;t�1 þ bXXt þ ei;
where Xt is vector of controls and ei is an error term. Our maininterest is in the sign of c, i.e., whether government impartial-ity is positively related to sustained growth.The main reasons for endogeneity are reversed causality or
omitted variables. Given the cross-country sample and theobservational nature of our data, we cannot deal with thoseissues by means of instrumental variables or similarapproaches that would rely on quasi-exogenous variation.Instead, we deal with them in the following way. First, toavoid direct reversed causality we always lag all explanatoryvariables. We also test whether a history of sustained growthfeeds positively onto the Impartiality index, and find that thisis likely not the case. Second, a bias due to the omission of truecorrelates (an omitted variables bias) would be a concern if wedid not control for factors systematically correlated with both
stained growth (1999–2009).
GOVERNMENT IMPARTIALITY AND SUSTAINED GROWTH IN SUB-SAHARAN AFRICA 63
the Impartiality index and Sustained growth. We use a fairlycomprehensive set of control variables, considering our smallsample, as well as country fixed effects in some models, to limitthis potential threat, but admit that we cannot exclude itentirely.In most of our pooled OLS-specifications, standard errors
are robust to heteroskedasticity and autocorrelation. For thefixed effects specifications we cluster the standard errors atthe country level. Given that the number of clusters (countries)is too low for ordinary clustering to be valid, we use the wildbootstrap procedure (Cameron, Gelbach, & Miller, 2008).
(b) Empirical results
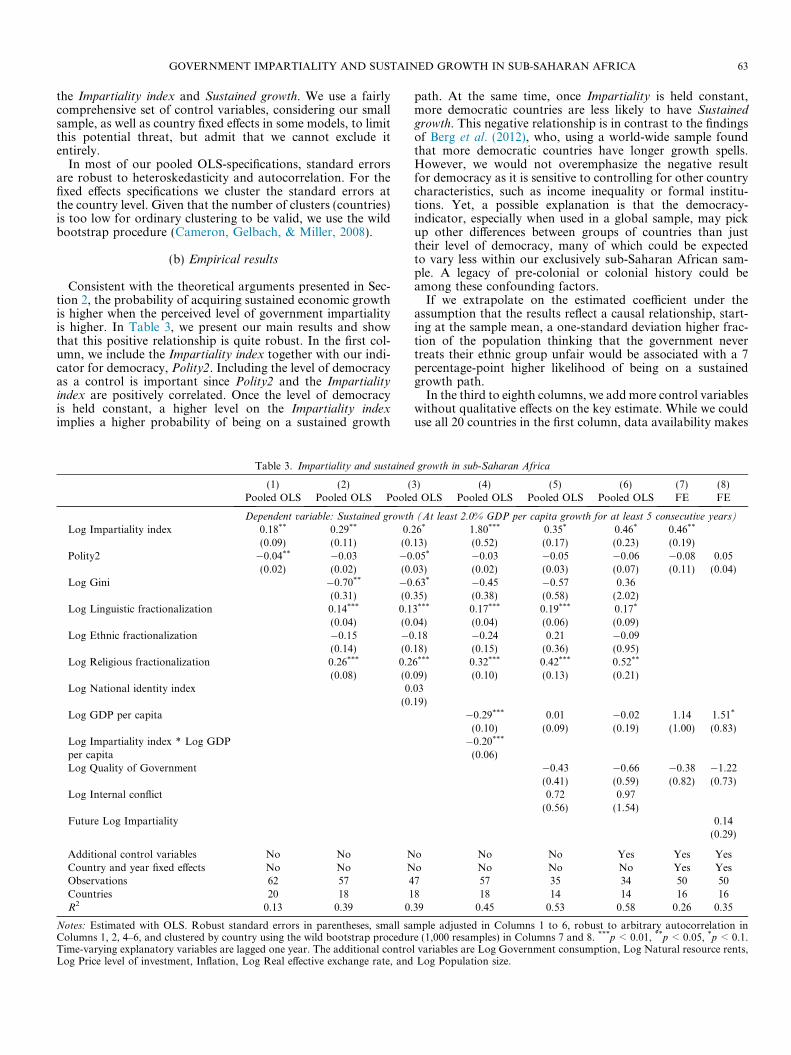
Consistent with the theoretical arguments presented in Sec-tion 2, the probability of acquiring sustained economic growthis higher when the perceived level of government impartialityis higher. In Table 3, we present our main results and showthat this positive relationship is quite robust. In the first col-umn, we include the Impartiality index together with our indi-cator for democracy, Polity2. Including the level of democracyas a control is important since Polity2 and the Impartialityindex are positively correlated. Once the level of democracyis held constant, a higher level on the Impartiality indeximplies a higher probability of being on a sustained growth
Table 3. Impartiality and sustained
(1) (2) (Pooled OLS Pooled OLS Poole
Dependent variable: Sustained growth
Log Impartiality index 0.18** 0.29** 0.(0.09) (0.11) (0.
Polity2 �0.04** �0.03 �0(0.02) (0.02) (0.
Log Gini �0.70** �0(0.31) (0.
Log Linguistic fractionalization 0.14*** 0.1(0.04) (0.
Log Ethnic fractionalization �0.15 �0(0.14) (0.
Log Religious fractionalization 0.26*** 0.2(0.08) (0.
Log National identity index 0.(0.
Log GDP per capita
Log Impartiality index * Log GDPper capitaLog Quality of Government
Log Internal conflict
Future Log Impartiality
Additional control variables No No NCountry and year fixed effects No No NObservations 62 57 4Countries 20 18 1R2 0.13 0.39 0.
Notes: Estimated with OLS. Robust standard errors in parentheses, small saColumns 1, 2, 4–6, and clustered by country using the wild bootstrap procedurTime-varying explanatory variables are lagged one year. The additional controLog Price level of investment, Inflation, Log Real effective exchange rate, and
path. At the same time, once Impartiality is held constant,more democratic countries are less likely to have Sustainedgrowth. This negative relationship is in contrast to the findingsof Berg et al. (2012), who, using a world-wide sample foundthat more democratic countries have longer growth spells.However, we would not overemphasize the negative resultfor democracy as it is sensitive to controlling for other countrycharacteristics, such as income inequality or formal institu-tions. Yet, a possible explanation is that the democracy-indicator, especially when used in a global sample, may pickup other differences between groups of countries than justtheir level of democracy, many of which could be expectedto vary less within our exclusively sub-Saharan African sam-ple. A legacy of pre-colonial or colonial history could beamong these confounding factors.If we extrapolate on the estimated coefficient under the
assumption that the results reflect a causal relationship, start-ing at the sample mean, a one-standard deviation higher frac-tion of the population thinking that the government nevertreats their ethnic group unfair would be associated with a 7percentage-point higher likelihood of being on a sustainedgrowth path.In the third to eighth columns, we addmore control variables
without qualitative effects on the key estimate. While we coulduse all 20 countries in the first column, data availability makes
growth in sub-Saharan Africa
3) (4) (5) (6) (7) (8)d OLS Pooled OLS Pooled OLS Pooled OLS FE FE
(At least 2.0% GDP per capita growth for at least 5 consecutive years)
26* 1.80*** 0.35* 0.46* 0.46**
13) (0.52) (0.17) (0.23) (0.19).05* �0.03 �0.05 �0.06 �0.08 0.0503) (0.02) (0.03) (0.07) (0.11) (0.04).63* �0.45 �0.57 0.3635) (0.38) (0.58) (2.02)3*** 0.17*** 0.19*** 0.17*
04) (0.04) (0.06) (0.09).18 �0.24 0.21 �0.0918) (0.15) (0.36) (0.95)6*** 0.32*** 0.42*** 0.52**
09) (0.10) (0.13) (0.21)0319)
�0.29*** 0.01 �0.02 1.14 1.51*
(0.10) (0.09) (0.19) (1.00) (0.83)�0.20***
(0.06)�0.43 �0.66 �0.38 �1.22(0.41) (0.59) (0.82) (0.73)0.72 0.97(0.56) (1.54)
0.14(0.29)
o No No Yes Yes Yeso No No No Yes Yes7 57 35 34 50 508 18 14 14 16 1639 0.45 0.53 0.58 0.26 0.35
mple adjusted in Columns 1 to 6, robust to arbitrary autocorrelation ine (1,000 resamples) in Columns 7 and 8. ***p < 0.01, **p < 0.05, *p < 0.1.l variables are Log Government consumption, Log Natural resource rents,Log Population size.

64 WORLD DEVELOPMENT
the sample smaller as we add more control variables. Lookingthe length of growth spells, Berg et al. (2012) find no significanteffect of fractionalization but a strong effect of income inequal-ity. However, Johnson et al. (2010) point to societal fractional-ization as a potential obstacle for sustained growth for Africancountries in general. From the correlation matrix, we see thatrespondents living in countries more fragmented in terms oflanguage or religion more often also feel that the governmentis not acting impartially, while ethnic fragmentation does notseem to matter. Perceived impartiality is also slightly lower incountries with more income inequality. Given this, we considerindicators for income inequality as well as for fractionalizationalong linguistic, ethnic, and religious lines as control variablesin the second column in Table 2. We draw Gini from WorldBank (2015), but since Gini is not reported for most years,we use the first available figure for each country after 1990.The fractionalization indices are all from Alesina et al.(2003). Holding these factors constant, the Impartiality indexis significant at the five-percent level. Evidently, incomeinequality is a predictor of sustained growth, but contrary tothe often-told tale of the perils of ethnolinguistic fragmenta-tion, we find that more fragmented countries in terms of lan-guage and religion are more likely to acquire sustainedgrowth. More central to the topic of this paper is that, evenwhen we control for the possibly confounding effects of incomeinequality and societal fractionalization, it is clear that coun-tries where people more seldom feel that their ethnic group istreated unfairly by the government are more likely to acquiresustained growth.Though the results in the second column suggest that, for
these African countries, time-invariant indicators of fragmen-tation may even be positively related to sustained growth,fragmentation could still be problematic if people not justbelonged to different groups but also identified relatively morewith their own group rather than with their country. If therewas a strong effect of the salience of group identity, thatshould show up as a significant coefficient for a variable suchas the National identity index, but it does not. We include theNational identity index in the third column and it is both sta-tistically and economically insignificant. When interacted withthe Impartiality index, neither the main estimates nor the inter-action term are significant (results not shown). The lack of sig-nificance for the National identity index could also be becausemost of these sub-Saharan African countries are by interna-tional comparison quite fragmented, and the real differencein this respect may not be within this group of countries butrather between these countries and other countries in theworld. While it may not be possible to generalize to otherregions, we conclude that fragmentation or the salience ofgroup identities probably do not constitute important imped-iment to sustained growth for these countries.The countries that have acquired sustained growth are on
average poorer. Hence, an interesting question is whetherthe Impartiality index is more strongly related to sustainedgrowth among relatively poor countries. The motivation forincluding an interaction term between government impartial-ity and the income level is that, though exceptions are not hardto find, as a general rule more developed countries have morerobust formal institutions and stronger civil societies thatenable citizens to demand equal treatment and that their rightsare respected. We therefore expect negative effects stemmingfrom low levels on the Impartiality index to be especially prob-lematic in less developed countries. The results in the fourthcolumn, where we include GDP per capita (World Bank,2015) and interact it with the Impartiality index, are consistent
with this reasoning. Low levels of the index are thus more of ahindrance in initially poor countries.The experience of and risk for internal violent conflict could
be reflected both in less perceived impartiality and less abilityto sustain growth once it emerges. We use an indicator fromICRG that combines assessments of the risks for civil war,coups, or civil disorder. On this indicator, Internal Conflict,a higher value means a lower risk. The data is drawn fromTeorell et al. (2015). From the correlation matrix, we see thatthe perceived level of government impartiality is, as expected,higher where there is a lower risk for internal conflict. We addour two indicators from ICRG, Internal Conflict and Qualityof Government, in the fifth column. Due to limited data avail-ability the sample shrinks considerably, which could con-tribute to these two indicators not being significantly relatedto sustained growth. The lack of significance could also becaused by multicollinerarity, but since we are interested pri-marily in the relationship between the Impartiality index andSustained growth, multicollinearity among the other indepen-dent variables is of little importance in our context. In resultsnot shown, we re-estimated the specification without the twoindicators from ICRG but using the same sample as in the fifthcolumn. The coefficient for the Impartiality index was hardlyaffected (Coeff: 0.38; S.E.: 0.17). This moderate effect clearlysuggests that our indicator for government impartiality isnot capturing the role of formal institutions, which one mayotherwise have had good reason to expect. The Impartialityindex may instead be seen as an indicator of the quality of aparticular form of informal institutions.In the sixth column, we add more variables that may be
important in the African context. We admit the endogenousnature of the variables we add as controls here, as for thoseadded in previous columns, but they serve to establish therobustness of the main results and additionally reveal interest-ing associations. Berg et al. (2012) find that external shockscan end growth spells, and it is then understandable that therisk falls with export sophistication and openness. We seekto pick the latter effect up by using the variable Naturalresource rents as share of GDP (World Bank, 2015) to indicatelack of export diversification and the Real effective exchangerate index (Darvas, 2012) to measure openness or externalcompetitiveness. The rate of consumer-price Inflation (WorldBank, 2015) is a proxy for the soundness of macroeconomicpolicies, and the Price level of investment (Feenstra, Inklaar,& Timmer, 2013) captures the user cost of capital. Economicgrowth is in theory tightly linked to investments, but weinclude the price level of investment as it is less problematicin this setting than the investment rate as such, though itcan still be endogenous. By expanding government consump-tion, governments could both appease unruly groups and cre-ate tensions between those that receive more and those thatreceive less. As a control, we therefore include Governmentconsumption as a share of GDP, drawn from the Penn WorldTables (Feenstra et al., 2013). The Impartiality index is nega-tively correlated with the size of the population, possiblybecause it is harder to please all segments of larger populationsand that the perceived level of impartiality therefore will belower in larger countries. Population size and growth couldalso be linked to the possibility of acquiring sustained growth,wherefore we include Population size (World Bank, 2015) as acontrol. Because of the limited size of our data set, we are con-strained in terms of the number of control variables that canbe included jointly. When we add both ICRG measures, thesample shrinks considerably. In order to retain sample sizewe drop Internal Conflict when we in the sixth column include

GOVERNMENT IMPARTIALITY AND SUSTAINED GROWTH IN SUB-SAHARAN AFRICA 65
all these controls related to current economic conditions andeconomic structure of the economy. Importantly, the estimateof the Impartiality index is not weakened when we includethese additional control variables, rather the opposite.Also within-country variation in the impartiality of the gov-
ernment is related to sustained growth. The fixed effects spec-ification in the seventh column shows that once time-invariantfactors, which could include, e.g., matters related to history orgeography, and here need only be invariant over period after1999, are held constant, the Impartiality index is a still a pos-itive correlate with Sustained growth. All our fixed effects spec-ifications include year dummies, to deal with shocks commonto all countries, and the standard errors are clustered at thecountry level. Since the number of clusters (countries) is onthe low side, we use the wild bootstrap procedure to estimatethe standard errors. The results suggest that if the impartialityof the government improves, so does the chance of obtainingreasonably high growth over a period of at least five years.Here, the imagined one-standard deviation increase govern-ment impartiality means a 19 percentage-points increase inprobability of sustained growth.Outside the controlled environment of a lab, one can never
completely rule out the possibility of an omitted variables bias.However, considering that the qualitative result is the samealso when country fixed effects are included, one can be rea-sonably certain that differences between the countries in oursample that are constant over the post-1999 sample periodare not causing such a bias. That is, our results do not reflectthe impact of factors such as geographical conditions, pre-colonial, colonial, or post-independence history, past or pre-sent structure of the population or the economy, deep formalor informal institutions, or a history of civil war. Since weinclude year fixed effects, neither common external shocks,such as global business cycles, are likely to cause an omittedvariables bias. At the same time, to drive our results, the omit-ted factor must be such that it is not captured by indicators forformal aspects of democracy or the quality of formal institu-tions, nor by the level of income or by various macroeconomicindicators, such as government size, inflation, the costs ofinvestment, real exchange rates, or natural resource rents.While we do not argue that there cannot be factors thathave these properties, we are not aware of any obviouscandidates.
Table 4. Impartiality an
(1) (2)Dependent variable: Sustained growth (At least __
con
Duration threshold (years) 5 4
Growth threshold (%) 2 2
Log Impartiality index 0.46** 0.55*
(0.19) (0.32)Time-varying control variables Yes YesCountry and year fixed effects Yes YesObservations 50 50Countries 16 16R2 0.26 0.40Sample year range [2000–09] [2000–09]Positives [Fraction of sample] 13 [0.26] 11 [0.22]
Notes: Estimated with OLS. In parentheses are robust standard errors, clus***p < 0.01, **p < 0.05, *p < 0.1. All explanatory variables are lagged one yearQuality of government, Log Government consumption, Log Natural resourcerate, Log Population size.
Can we be reasonably certain that we are not capturingthat sustained growth leads to respondents having positiveassessments of their government? We believe so. In the lastcolumn, we include the first lead of the Impartiality indexinstead of the lagged value. This future value has no predictivepower. The coefficient is close to zero, and the p-value is 0.68.In Table 6 in the Appendix, we even reversed the specificationused in the seventh column in Table 3 and set the present valueon the Impartiality index as the dependent variable and(lagged) values of Sustained growth as one of the explanatoryvariables. The estimate for Sustained growth switches frompositive to negative depending on the number of years it islagged, and is far from significant up to the sixth lag, wherewe get a negative coefficient significant at the 5% level. Thus,if anything, a history of Sustained growth is associated withlower levels of perceived impartiality, suggesting that ourresults may be biased downward. While we cannot determinethe lag structure of the ‘‘true model,” we are therefore reason-ably confident that impartiality has a positive impact on sub-sequent growth patterns rather than the reverse. That is, weare not capturing that sustained growth leads to higher levelsof government impartiality but the opposite.Overall, our empirical results demonstrate that a lack of
government impartiality could be a real hindrance to sustainedgrowth. As outlined in Section 2, we primarily envisage thetheoretical link from government impartiality to sustainedgrowth as going via less ethno-regional favoritism, less roomfor rent-seeking, and more stability in economic and politicalconditions. With the data at hand, we cannot identify the rel-ative importance of these potential mechanisms. We can saywith some certainty that the estimated coefficients for theImpartiality index are not capturing the role of objective levelsof societal fractionalization or income inequality, the role offormal aspects of democracy or the quality of formal institu-tions, nor the level of income or various macroeconomic indi-cators. More research is needed to pinpoint the exactmechanisms and to cleanly separate the role of real versus per-ceived impartiality.
(c) More robustness checks
In Table 4, we present results from a series of robustnesschecks. We have so far followed Berg et al. (2012) in using a
d sustained growth
(3) (4) (5) (6)% GDP per capita growth for at least __
secutive years)
Annual growth rate
6 5 5
2 1.5 2.5
0.71** 0.75** 0.40 6.65(0.32) (0.34) (0.24) (5.31)Yes Yes Yes YesYes Yes Yes Yes35 50 50 5014 16 16 160.74 0.42 0.35 0.56
[2000–07] [2000–09] [2000–09] [2000–09]9 [0.26] 16 [0.32] 11 [0.22] NA
tered by country using the wild bootstrap procedure (1,000 resamples).. The time-varying control variables are Polity2, Log GDP per capita, Logrents, Log Price level of investment, Inflation, Log Real effective exchange

66 WORLD DEVELOPMENT
per capita growth of rate 2% as the growth threshold. Now wetest alternative thresholds for what to code as sustainedgrowth, and while the results do not falsify the overallconclusion that the Impartiality index is positively related tosustained growth, they indicate that the results are sensitiveto which thresholds one chooses to use. We repeat our ‘‘bench-mark” specification, from the seventh column in Table 3, inthe first column in Table 4. In this sample, one in four obser-vations has a growth rate of 2% or more that year and the fol-lowing four years.First, we change the number of years of growth at or above
2% that is required for it to be coded as sustained. Lowering theyear threshold to four years gives us the same qualitativeresults, but the coefficient for the estimate of the Impartialityindex is less statistically significant. Increasing the year thresh-old to six years can be done without damage to the statisticalsignificance of the index. Second, we adjust the growth thresh-old. If we lower this threshold by half a percentage point, toone and a half percent, the share with sustained growthincreases to one in three and the Impartiality index is still signif-icant at the five-percent level. If the threshold is raised to twoand a half percent, the coefficient for the Impartiality index ison the same order of magnitude, but no longer statistically sig-nificant. The results are thus robust to some changes to thresh-olds, but cannot be generalized to any thresholds. To furthertest the effect of government impartiality on economic growth,without considering whether it is sustained or not, we useannual growth in GDP per capita as the dependent in the lastcolumn. The Impartiality index is positive but not statisticallysignificant. Our interpretation of these results is that, whilemore impartial governments can help countries stay on a pathof moderately positive growth for a decent number of years, itis not a sufficient condition that ensures that the growth rateduring those years is also at a consistently high level.
5. CONCLUDING REMARKS
The literature recognizes that a key problem for low-income countries is not only how to obtain high growthbut how to sustain it over a period of several years. In thispaper, we study sustained growth, which we define as agrowth rate in GDP per capita of at least 2% for a periodof at least five consecutive years, in a sample of 20 sub-Saharan African countries. Specifically, we ask whether thegovernment’s impartiality and salience of group identitiesmatter. We find that when the government is seen as impar-tial, there is greater prospect for sustained growth, but thatthe salience of group identity seems not to matter. A stan-dard deviation increase in the population share that seesthe government as treating their group fairly is associatedwith an increase in the probability of obtaining sustainedgrowth in a range from about seven to 19 percentage points.While causality remains an issue, we believe that a reasonablepolicy conclusion is that also moderate improvements in theimpartiality of the governments in these countries would be avital step for ensuring lasting growth in Africa, and possiblyelsewhere in the developing world.We have focused in this paper on ethnic impartiality given
the salience of the ethnic question. An interesting avenue forfuture work is to study the effect of other types of impartialityon sustained growth. For example, besides being impartialtoward different ethnicities, it may also be important that Afri-can governments are impartial toward different religions oreconomic classes (e.g., the poor) if they want to facilitate sus-tained growth. From a policy perspective, it will be interestingto establish the absolute and relative effects of these differentdimensions of impartiality.
NOTES
1. The countries are Benin, Botswana, Burkina Faso, Cape Verde,Ghana, Kenya, Lesotho, Liberia, Madagascar, Malawi, Mali, Mozam-bique, Namibia, Nigeria, Senegal, South Africa, Tanzania, Uganda,Zambia, and Zimbabwe.
2. Alesina, Baqir, and Easterly (1999), Alesina, Devleeschauwer,Easterly, Kurlat, and Wacziarg (2003), and Montalvo and Reynal-Querol (2005) offer similar evidence for the negative economic andpolitical consequences of ethnic fractionalization and/or polarization.
3. An example for such developments is Malaysia, where the economicsuccess of the Chinese minority led to policies that explicitly advantagedthe Malay majority. However, authors differ in their evaluation of theeconomic consequences of these policies (Jono, 2004). That is, Malaysiadid relatively well economically despite pursuing potentially impartialpolicies. On the other hand, it is possible that it would have grown even
more with more partial policies. For example, its neighbor Singapore,which was careful to treat all national ethnicities equally, did bettereconomically than Malaysia at similar levels of ethnic diversity.
4. Bhalla and Luo (2013) note that the Muslims in Jammu and Kashmirare poorer than the Hindus and that the Uighurs are poorer than the Hanin China, suggesting that ethnic (religious) inequality might be possibleexplanations for the smoldering conflicts in these two regions.
5. We thank an anonymous reviewer for pointing us in the direction ofinvestigating these aspects.
6. We thank a reviewer for making us aware of this potential shortcom-ing of the concept of impartiality.
REFERENCES
Acemoglu, D., & Johnson, S. (2005). Unbundling institutions. Journal ofPolitical Economy, 113(5), 949–995.
Acemoglu, D., Johnson, S., & Robinson, J. A. (2001). The colonial originsof comparative development: An empirical investigation. AmericanEconomic Review, 91(5), 1369–1401.
Acemoglu, D., & Robinson, J. A. (2012). Why nations fail: The origins ofpower, prosperity and poverty. New York: Crown Publishers (RandomHouse).
Afrobarometer, The. (2013). Available from <www.afrobarometer.org>.

GOVERNMENT IMPARTIALITY AND SUSTAINED GROWTH IN SUB-SAHARAN AFRICA 67
Ahlerup, P., & Hansson, G. (2011). Nationalism and governmenteffectiveness. Journal of Comparative Economics, 39, 431–451.
Ahlerup, P., & Isaksson, A.-S. (2015). Ethno-regional favouritism in Sub-Saharan Africa. Kyklos, 68(2), 143–152.
Alesina, A., Baqir, R., & Easterly, W. (1999). Public goods and ethnicdivisions. Quarterly Journal of Economics, 114(4), 1243–1284.
Alesina, A., Devleeschauwer, A., Easterly, W., Kurlat, S., & Wacziarg, R.(2003). Fractionalization. Journal of Economic Growth, 8(2), 155–194.
Alesina, A., Michalopoulos, S., & Papaioannou, E. (2015). Ethnicinequality. Journal of Political Economy (in press).
Alesina, A., & Zhuravskaya, E. (2011). Segregation and the quality ofgovernment in a cross section of countries. American Economic Review,101(5), 1872–1911.
Arbache, J., & Page, J. (2010). How fragile is Africa’s recent growth?Journal of African Economies, 19, 1–24.
Baldwin, K., & Huber, J. (2010). Economic versus cultural differences:Forms of ethnic diversity and public goods provision. AmericanPolitical Science Review, 104(4), 644–662.
Bandyopadhyay, S., & Green, E. (2013). Nation-building and conflict inmodern Africa. World Development, 45, 108–118.
Berg, A., Ostry, J. D., & Zettelmeyer, J. (2012). What makes growthsustained? Journal of Development Economics, 98, 149–166.
Besley, T., & Persson, T. (2009). The origins of state capacity: Propertyrights, taxation, and politics. American Economic Review, 99(4),1218–1244.
Bhalla, A. S., & Luo, D. (2013). Poverty and exclusion of minorities inChina and India. New York: Palgrave Macmillan.
Cameron, C. A., Gelbach, J. B., & Miller, D. L. (2008). Bootstrap-basedimprovements for inference with clustered errors. Review of Economicsand Statistics, 90, 414–427.
Cingolani, L., Thomsson, K., & de Crombrugghe, D. (2015). Mindingweber more than ever? The impacts of state capacity and bureaucraticautonomy on development goals. World Development, 72, 191–207.
Darvas, Z. (2012). Real effective exchange rates for 178 countries: A newdatabase, Bruegel working papers 2012/06.
Dincecco, M., & Prado, M. (2012). Warfare, fiscal capacity, andperformance. Journal of Economic Growth, 17, 171–203.
Easterly, W., & Levine, R. (1997). Africa’s growth tragedy: Policies andethnic divisions. Quarterly Journal of Economics, 112, 1203–1250.
Easterly, W., Ritzen, J., & Woolcock, M. (2006). Social cohesion,institutions, and growth. Economics & Politics, 18, 103–120.
Feenstra, R. C., Inklaar, R., & Timmer, M. P. (2013). The next generationof the Penn World Table Available from <www.ggdc.net/pwt>.
Habyarimana, J., Humphreys, M., Posner, D., & Weinstein, J. (2008). Isethnic conflict inevitable? Better institutions, not partition? ForeignAffairs, 87, 138–141.
Hausmann, R., Pritchett, L., & Rodrik, D. (2005). Growth accelerations.Journal of Economic Growth, 10, 303–329.
Hausmann, R., Rodriguez, F., & Wagner, R. (2007). Growth collapses.Mimeo.
Hodler, R., & Raschky, P. (2014). Regional favoritism. Quarterly Journalof Economics, 129(2), 995–1033.
Jerzmanowski, M. (2006). Empirics of hills, plateaus, mountains andplains: A Markow-switching approach to growth. Journal of Develop-ment Economics, 81, 357–385.
Johnson, S., Ostry, J. D., & Subramanian, A. (2010). Prospects forsustained growth in Africa: Benchmarking the constraints. IMF StaffPapers, 57, 119–171.
Jono, K. S. (2004). The new economic policy and interethnic relations inMalaysia, Identities, conflict and cohesion – Programme paper number7. United Nations Research Institute for Social Development.
Kar, S., Pritchett, L., Raihan, S., & Sen, K. (2013). Looking for a break:Identifying transitions in growth regimes. Journal of Macroeconomics,38, 151–166.
Kaufmann, D., Kraay, A., & Mastruzzi, M. (2008). Governance mattersVII: Aggregate and individual governance indicators for 1996–2007,World Bank policy research paper no 4654 .
Kramon, E., & Posner, D. (2012). Ethnic favoritism in primary education inKenya, mimeo. Mimeo (Massachusetts Institute of Technology &University of California, Los Angeles).
Kyriacou, A. (2013). Ethnic group inequalities and governance: Evidencefrom developing countries. Kyklos, 66(1), 78–101.
La Porta, R., Lopes-de-Silanes, F., Pop-Eleches, C., & Schleifer, A.(2008). The economic consequences of legal origins. Journal ofEconomic Literature, 46, 285–332.
Marshall, M. G., & Jaggers, K. (2002). Polity IV project: political regimecharacteristics and transitions, 1800–2002, dataset users’ manual.Mimeo (University of Maryland).
Miguel, E. (2004). Tribe or nation? Nation building and public goods inKenya versus Tanzania. World Politics, 56, 327–362.
Montalvo, J. G., & Reynal-Querol, M. (2005). Ethnic diversity andeconomic development. Journal of Development Economics, 76(2),293–323.
Museru, M., Toerien, F., & Gossel, S. (2014). The impact of aid andpublic investment volatility on economic growth in Sub-SaharanAfrica. World Development, 57, 138–147.
Posner, D. N. (2004). Measuring ethnic fractionalization in Africa.American Journal of Political Science, 48, 849–863.
Pritchett, L. (2000). Understanding patterns of economic growth:Searching for hills among plateaus, mountains, and plains. WorldBank Economic Review, 14, 221–250.
PRS Group. (2015). <https://www.prsgroup.com/about-us/our-two-methodologies/icrg>.
Ravallion, M., & Chen, S. (2012). Monitoring inequality. Mimeo (WorldBank), Available online at: <https://blogs.worldbank.org/develop-menttalk/files/developmenttalk/monitoring_inequality_table_1_.pdf>.
Rothstein, B., & Teorell, J. (2008). What is quality of government? Atheory of impartial government institutions. Governance, 21(2),165–190.
Sen, K. (2013). The political dynamics of economic growth. WorldDevelopment, 47, 71–86.
Teorell, J. (2009). The impact of quality of government as impartiality:Theory and evidence. Paper presented at the 2009 APSA meeting.
Teorell, J., Dahlberg, S., Holmberg, S., Rothstein, B., Hartmann, F., &Svensson, R. (2015). The quality of government standard dataset.Version: January 2015. University of Gothenburg: The Quality ofGovernment Institute, Available from: <http://www.qog.pol.gu.se>.
The World Bank (2015). World Development Indicators Online (WDI)database. Data retrieved on January 22, 2015. Available fromdatabank.worldbank.org.
Tilly, C. (1992). Coercion, capital, and European states, AD 990–1992.Oxford: Blackwell.
Tsangarides, C. G. (2012). Determinants of growth spells: Is Africadifferent? IMF working paper WP/12/227 .
Woodruff, C. (2006). Measuring institutions. In S. Rose-Ackerman (Ed.),International handbook on the economics of corruption (pp. 105–124).Cheltenham: Edward Edgar.
Wrong, M. (2009). It’s our time to eat: The story of a KenyanWhistleblower. London: Fourth Estate.

Table 5. The Impartiality index by country and year
Country Survey (Year) Impartiality index Country Survey (Year) Impartiality index
Benin 2005 0.48 Malawi 2005 0.32Benin 2008 0.53 Malawi 2008 0.53Burkina Faso 2008 0.60 Namibia 1999 0.29Botswana 1999 0.52 Namibia 2003 0.30Botswana 2003 0.34 Namibia 2005 0.38Botswana 2005 0.72 Namibia 2008 0.31Botswana 2008 0.76 Nigeria 2000 0.22Cape Verde 2002 0.30 Nigeria 2003 0.16Cape Verde 2005 0.54 Nigeria 2005 0.18Cape Verde 2008 0.33 Nigeria 2008 0.12Ghana 2002 0.58 Senegal 2002 0.72Ghana 2005 0.52 Senegal 2005 0.76Ghana 2008 0.47 Senegal 2008 0.79Kenya 2003 0.15 Tanzania 2001 0.46Kenya 2005 0.24 Tanzania 2003 0.27Kenya 2008 0.27 Tanzania 2005 0.54Liberia 2008 0.63 Tanzania 2008 0.63Lesotho 2000 0.23 Uganda 2000 0.21Lesotho 2003 0.20 Uganda 2002 0.21Lesotho 2005 0.86 Uganda 2005 0.34Lesotho 2008 0.67 Uganda 2008 0.18Madagascar 2005 0.87 South Africa 2000 0.14Madagascar 2008 0.88 South Africa 2002 0.24Mali 2001 0.41 South Africa 2006 0.49Mali 2002 0.54 South Africa 2008 0.33Mali 2005 0.75 Zambia 1999 0.16Mali 2008 0.69 Zambia 2003 0.24Mozambique 2002 0.48 Zambia 2005 0.45Mozambique 2005 0.71 Zambia 2009 0.57Mozambique 2008 0.50 Zimbabwe 1999 0.08Malawi 1999 0.39 Zimbabwe 2004 0.35Malawi 2003 0.16 Zimbabwe 2009 0.49
Notes: Countries and years for which the Impartiality index can be coded from the Afrobarometer (2013).
APPENDIX A
Table 6. Testing for direct reversed causality
(1) (2) (3) (4) (5) (6)Number of years all explanatory variables are lagged: 1 2 3 4 5 6
Dependent variable: Log Impartiality index
Sustained Growth 0.16 0.26 0.34 �0.21 �0.18 �0.37**
(0.24) (0.21) (0.42) (0.22) (0.16) (0.14)Polity2 0.08 �0.03* �0.04*** �0.05 �0.03* �0.04*
(0.10) (0.02) (0.01) (0.03) (0.01) (0.02)Log GDP per capita �2.14* �2.51*** �2.57 �1.77 �1.25 �0.75*
(1.25) (0.87) (1.62) (1.55) (0.90) (0.42)Log Quality of Government 0.34 0.59 0.06 0.04 0.17 0.21
(0.56) (0.53) (0.42) (1.97) (0.58) (0.20)Log Government consumption �0.33 �0.64 �0.71 �0.27 0.15 0.55***
(0.45) (0.44) (0.64) (0.34) (0.34) (0.00)Log Natural resource rents �0.02 0.00 0.17 �0.23 �0.02 �0.11
(0.09) (0.25) (0.11) (0.26) (0.13) (0.25)Log Price level of investment 0.01 �0.39 �0.33 �0.24 �0.41 �0.35***
(0.54) (0.44) (0.68) (0.37) (0.50) (0.12)Inflation 0.02* �0.00 0.00 0.00 0.00 �0.00
(0.01) (0.01) (0.01) (0.01) (0.01) (0.00)Log Real effective exchange rate �0.37 0.61 0.26 0.17 0.45 0.19
(0.55) (0.44) (0.40) (0.44) (0.38) (0.65)
Line missing
68 WORLD DEVELOPMENT
Table 6 (continued)
(1) (2) (3) (4) (5) (6)Number of years all explanatory variables are lagged: 1 2 3 4 5 6
Log Population size �3.37 �3.17 �2.64 �6.92 �3.21 �4.10(3.20) (3.06) (8.56) (4.40) (3.66)
50 49 49 49 4816 16 16 16 150.33 0.48 0.50 0.62 0.75
clustered by country using the wild bootstrap procedure (1,000 resamples).ed in all specifications.
GOVERNMENT IMPARTIALITY AND SUSTAINED GROWTH IN SUB-SAHARAN AFRICA 69
Impartiality and national identity
The Impartiality index is coded from the first four waves ofthe Afrobarometer surveys and the National identity index iscoded from the second, third, and fourth wave.
Fourth wave (2008–09)
Question Q79 is an open-ended question that asks ‘‘What isyour tribe? You know, your ethnic or cultural group.”Question Q82 asks ‘‘How often are ____s [R’s Ethnic
Group] treated unfairly by the government?” We give eachrespondent the value one if the answer is ‘‘Never”, and zeroif the answer is ‘‘Sometimes,” ‘‘Often,” or ‘‘Always.” We usethe sample weights of each respondent to calculate the Impar-tiality index as the share of the population that has a value ofone.Question Q83 asks ‘‘Let us suppose that you had to choose
between being a [Ghanaian/Kenyan/etc.] and being a [R’s Eth-nic Group]. Which of the following best expresses your feel-ings?” We give each respondent the value one if the answeris ‘‘I feel only [Ghanaian/Kenyan/etc.]” or ‘‘I Feel More[Ghanaian/Kenyan/etc.] than (r’s groups)” and zero if theanswer is ‘‘I Feel Only (r’s group),” ‘‘I Feel More (r’s group),”or ‘‘I feel equally [Ghanaian/Kenyan/etc.].”We use the sampleweights of each respondent to calculate the National identityindex as the share of the population that has a value of one.
Third wave (2005–06)
Question Q79 is an open-ended question that asks ‘‘What isyour tribe? You know, your ethnic or cultural group.”Question Q81 asks ‘‘How often are ____s [respondent’s
identity group] treated unfairly by the government?” We giveeach respondent the value one if the answer is ‘‘Never”, andzero if the answer is ‘‘Sometimes,” ‘‘Often,” or ‘‘Always.”We use the sample weights of each respondent to calculatethe Impartiality index as the share of the population that hasa value of one.Question Q82 asks ‘‘Let us suppose that you had to choose
between being a [Ghanaian/Kenyan/etc.] and being a [respon-dent’s identity group]. Which of these two groups do you feelmost strongly attached to?”We give each respondent the valueone if the answer is ‘‘I feel only [Ghanaian/Kenyan/etc.]” or ‘‘I
(4.02)
Observations 50Countries 16R2 0.46
Notes: Estimated with OLS. In parentheses are robust standard errors,***p < 0.01, **p < 0.05, *p < 0.1. Year and country fixed effects are includ
Feel More [Ghanaian/Kenyan/etc.] than (r’s groups)” andzero if the answer is ‘‘I Feel Only (r’s group),” ‘‘I Feel More(r’s group),” or ‘‘I feel equally [Ghanaian/Kenyan/etc.].” Weuse the sample weights of each respondent to calculate theNational identity index as the share of the population thathas a value of one.
Second wave (2002–04)
Question Q54 is an open-ended question that asks ‘‘Besidesbeing [national identity], which specific group do you feel youbelong to first and foremost?”Question Q56 asks ‘‘How often are ____s [respondent’s
identity group] treated unfairly by the government?” We giveeach respondent the value one if the answer is ‘‘Never”, andzero if the answer is ‘‘Sometimes,” ‘‘Often,” or ‘‘Always.”We use the sample weights of each respondent to calculatethe Impartiality index as the share of the population that hasa value of one.Question Q57 asks ‘‘Let us suppose that you had to choose
between being a [national identity] and being a [respondent’sidentity group]. Which of these two groups do you feel moststrongly attached to?” We give each respondent the valueone if the answer is ‘‘National identity” and zero if the answeris ‘‘Group identity.” We then use the sample weights of eachrespondent to calculate the National identity index as the shareof the population that has a value of one.
First wave (1999–2001)
Identity is an open-ended question of which group, besidethe nation, that the respondent feel that they belong to firstand foremost.Pfrfai. While there are nuances, in most of the countries
included in this wave it asks ‘‘To what extent are [membersof your identity group] people treated unfairly by the govern-ment?” We give respondent the value one if the answer is‘‘Never”, and zero if the answer is ‘‘Always”, ‘‘To a largeextent/most of the time,” ‘‘To some extent/some of the time,”or ‘‘Hardly at all.” We use the sample weights of each respon-dent to calculate the Impartiality index as the share of the pop-ulation that has a value of one.
ScienceDirectAvailable online at www.sciencedirect.com