Embed Size (px)
Citation preview

GOVERNMENT HOLDINGS (PRIVATE) LIMITED
ANNUAL REPORT 2019-20
1

GHPL Annual Report 2019-20 2
CONTENTS
VISION STATEMENT ..................................................................................................................................... 3
MISSION STATEMENT .................................................................................................................................. 4
CORE VALUES ............................................................................................................................................... 5
CORPORATE INFORMATION ........................................................................................................................ 6
COMMITTEES OF THE BOARD ..................................................................................................................... 7
ATTENDANCE OF THE BOARD & COMMITTEE MEETINGS ........................................................................ 9
KEY FINANCIALS ......................................................................................................................................... 10
SIX YEARS SUMMARY ................................................................................................................................. 11
VERTICAL & HORIZONTAL ANALYSIS ......................................................................................................... 16
STATEMENT OF VALUE ADDITION ............................................................................................................ 17
QUARTERLY ANALYSIS 2019-20 ................................................................................................................ 18
REVIEW REPORT TO THE MEMBERS ON THE STATEMENT OF COMPLIANCE WITH THE PUBLIC SECTOR
COMPANIES (CORPORATE) GOVERNANCE RULES, 2013 ......................................................................... 19
DIRECTORS’ REPORT 2019-20 ................................................................................................................... 28
UNCONSOLIDATED FINANCIAL STATEMENTS FOR THE YEAR ENDED JUNE 30, 2020 ............................ 38
CONSOLIDATED FINANCIAL STATEMENTS FOR THE YEAR ENDED JUNE 30, 2020 ................................. 98
2

GHPL Annual Report 2019-20 3
VISION STATEMENT
To be a leading Company in meeting the
growing energy requirements for the country
by increasing domestic production through
conventional and non-conventional sources
and marketing of cheaper energy alternatives
while ensuring optimal value for all
stakeholders.
3

GHPL Annual Report 2019-20 4
MISSION STATEMENT
To maximize energy production with a
sustainable growing return to the shareholders
and recognizing our people as the most
valuable resource.
4
GHPL Annual Report 2019-20 5
CORE VALUES
Professional Competence
Creative and Proactive
Ethical Behaviour and Integrity
Authority with Responsibility
Accountability
5

GHPL Annual Report 2019-20 6
CORPORATE INFORMATION
Board of Directors Ms. Ayla Majid (Chairperson Board, Independent, Non-Executive Director)
Mian Asad Hayaud Din (Non-Executive Director)
Mr. Nadeem Irshad Kayani (Non-Executive Director)
Mr. Muhammad Zubair (Non-Executive Director)
Mr. Muhammad Anwer Shiekh (Non-Executive Director)
Ms. Saira Najeeb Ahmed (Non-Executive Director)
Dr. Sajjad Ahmad (Independent, Non-Executive Director)
Mr. Haseeb Shakoor Paracha (Independent, Non-Executive Director)
Mr. Masood Nabi (CEO / MD)
Chief Financial Officer / Company Secretary Mr. Muhammad Arif Auditors Yousuf Adil Chartered Accountants
Registered Office 7th Floor, Petroleum House Ataturk Avenue G – 5/2, Islamabad Registration Number I - 02570 Contact Details PABX: +92 (51) 9211236-7, 9213976, 9211239-240 Fax: +92 (51) 9213972 Web Site: www.ghpl.com.pk Tax Advisors M/S A.F. Fergusons & Co., Chartered Accountants
Bankers National Bank of Pakistan United Bank Limited Allied Bank Limited MCB Bank Limited Habib Bank Limited Bank Al-Falah Limited Legal Advisors Rahman & Associates Attorneys at law & Corporate Counsel
6

GHPL Annual Report 2019-20 7
COMMITTEES OF THE
BOARD The Board has constituted five Committees to discharge its responsibilities in effective manner:
(i) Board Audit Committee (ii) Board Finance, Procurement and Risk Management
Committee (iii) Board Business Development & Strategy Committee (iv) Board Human Resource and Nomination Committee (v) Board Corporate Social Responsibility Committee
Board Audit Committee
Composition
Mr. Haseeb Shakoor Paracha Chairman
Mr. Muhammad Anwer Sheikh Member
Ms. Saira Najeeb Ahmed Member
Dr. Sajjad Ahmad Member
Terms of Reference
The Terms of Reference of the Board Audit Committee include the following:
• Determination of appropriate measures to safeguard the company’s assets;
• Review of quarterly, half-yearly and annual financial
statements of the company, prior to their approval by the
Board of Directors;
• Facilitating the external audit and discussion with external
auditors on major observations.
• Ensuring coordination between the internal and external
auditors of the company;
• Review of the scope and extent of internal audit and ensuring
that the internal audit function has adequate resources and is
appropriately placed within the Company;
• Consideration of major findings of internal investigations and
management’s response thereto;
• Ascertaining that the internal control system including
financial and operational controls, accounting system and
reporting structure are adequate and effective;
• Review of the company’s statement on internal control system
prior to endorsement by the Board of Directors;
• Instituting special projects, value for money studies or other
investigations on any matter specified by the Board of
Directors, in consultation with the Chief Executive and to
consider remittance of any matter to the external auditors or
to any other external body;
• Determination of compliance with relevant statutory
requirements;
• Monitoring compliance with the best practices of corporate
governance and identification of significant violations thereof;
• Recommending of approving the hiring or removal of the chief
internal auditor;
• Overseeing whistle-blowing policy and protection mechanism
and
• Consideration of any other issue or matter as may be assigned
by the Board of Directors.
• Suggesting the appointment of external auditor to the Board,
the audit fee and any question of resignation or dismissal.
• Considering the objective and scope of any non-financial audit
or consultancy work to be undertaken by the external auditors
and reviewing the remuneration of this work.
• Review Code of Conduct and related policies applicable to
employees, officers, and director and other agents and
associates of the Company at least annually and make
recommendations to the Board as appropriate.
• Provide oversight as needed to ensure that the Compliance
program effectively prevents and/or detects violations by
Company employees, officers, directors and other agents and
associates of the Company law, regulation, Company policy,
special conditions imposed on the Company by any licensing
authorities, and the Code of Conduct.
• The Whistle blowing unit will report to the Audit Committee.
Board Finance, Procurement and Risk Management Committee
Composition
Mr. Muhammad Anwer Sheikh Chairman
Ms. Ayla Majid Member
Ms. Saira Najeeb Ahmed Member
Mr. Haseeb Shakoor Paracha Member
Mr. Masood Nabi Member
Terms of Reference
The Terms of Reference of the Committee are given below:
• Reviewing corporate strategy, Operational Plans and Long-
term Projections of the Company.
• Reviewing Proposals/Feasibility Studies prepared by the
management of all major projects.
• Review the proposed annual Business Plan and Budget and
endorsing the same for approval of Board of Directors.
• Identification and management of strategic business risks of
the Company considering the general economic conditions of
the country, competitive realities and scenarios and ensuring
that risk management processes and cultures are embedded
throughout the Company.
• Providing regular update to the Board of Directors on key risk
management issues and its proposed mitigating factors.
• Considering investments and disinvestments of funds outside
normal conduct of business and reviewing cash and fund
management policies and procedures.
• Review and recommend Annual Procurement Plan of the
Company and required budget.
7

GHPL Annual Report 2019-20 8
Board Business Development & Strategy Committee
Composition
Ms. Ayla Majid Chairperson
Mr. Muhammad Anwer Sheikh Member
Ms. Saira Najeeb Ahmed Member
Dr. Sajjad Ahmad Member
Mr. Masood Nabi Member
Terms of Reference
The Terms of Reference are given as under:
• Review corporate medium to long-term business development
strategy
• Review proposals for medium to long term Strategic Business
Plan.
• Review and advise on business opportunities in upstream
sector such as Farm-in in Exploration Joint Ventures
• Review growth possibilities through new projects in oil and gas
which includes inter-alia infrastructure development, LNG,
downstream projects, refining etc.
• Review feasibility studies for special projects to assess
possibilities for prospective business expansion and
investment.
• Considering business opportunities as may be referred by the
Board of Directors.
Board Human Resource and Nomination Committee
Composition
Ms. Saira Najeeb Ahmed Chairperson
Mr. Muhammad Zubair Member
Mr. Muhammad Anwer Sheikh Member
Ms. Ayla Majid Member
Mr. Masood Nabi Member
Terms of Reference
The Terms of Reference of the Board HR & Nomination Committee
include the following:
• A sound plan of organizing for the company.
• An effective employees’ development program.
• Sound compensation and benefits plans, policies and practices
designed to attract and retain the caliber of personnel needed
to manage the business effectively.
• Evaluate and recommend for approval of changes in the
organization, functions and relationship affecting management
positions equivalent in importance to those on the
management position schedule.
• Establish plans and procedures that provide an effective basis
for management control over company manpower.
• Determine appropriate limits of authority and approval
procedures for personnel matters requiring decisions at
different levels of management.
• Review data of competitive compensation practices and
review and evaluate policies and programs through which the
company compensates its employees.
• Recommend for approval of salary ranges, salaries and other
compensation for the CEO and Senior Management/Senior
General Manager reporting to the CEO.
• Recommend annual increments and bonus to employees
• Identify, evaluate and recommend candidates for vacant
positions including casual vacancies on the Board including
candidates recommended by the Government for
consideration of shareholders or in case of casual vacancy to
the board of directors after examining their skills and
characters that are needed in such candidates.
Board Corporate Social Responsibility Committee
Composition
Mian Asad Hayaud Din Chairman
Ms. Ayla Majid Member
Dr. Sajjad Ahmad Member
Mr. Haseeb Shakoor Paracha Member
Mr. Zahid Nazeer Bhatti Member
Terms of Reference The Terms of Reference of the Board Corporate Social Responsibility Committee include the following:
• Areas of interest for CSR activities include Environment,
Education, Health, Sports, Safety (risk management, disaster
management), Work life balance, Governance (human rights,
transparency, anti-corruption, business practices, stakeholder
relations)
• GHPL shall encourage and support social development
initiatives undertaken by the Non-Government Organizations
(NGO’s) and Community Based Organizations (CBO’s) by
providing them financial support
8

GHPL Annual Report 2019-20 9
ATTENDANCE OF THE BOARD & COMMITTEE
MEETINGS Financial Year 2019-20
Meetings Attendance Meetings Attendance Meetings Attendance
Ms. Ayla Majid 18 18 1 1
Mian Asad Hayaud Din 18 13
Dr. Tanveer Ahmad Qureshi 14 13 2 2
Mr. Muhammad Anwer Shiekh 18 17 3 3 1 1
Ms. Saira Najeeb Ahmed* 3 3 1 1
Syed Tauqir Hussain 13 13 1 1
Mr. Shahid Yousaf 10 9
Mr. Haseeb Shakoor Paracha** 8 7 3 3 1 0
Mr. Sajjad Ahmed** 8 7 3 2
Mr. Muhammad Zubair*** 7 7
Mr. Kazim Niaz 8 0
Mr. Asim Murtaza Khan*** 1 1
Mr. Masood Nabi 1 1
Mr. Zahid Nazeer Bhatti 17 14 3 2 1 1
Fee paid to
the Directors
Meetings Attendance Meetings Attendance Meetings Attendance (Rupees)
Ms. Ayla Majid 10 10 12 12 1 1 4,200,000
Mian Asad Hayaud Din 1 1 1,400,000
Dr. Tanveer Ahmad Qureshi 6 6 12 12 3,300,000
Mr. Muhammad Anwer Shiekh 10 10 12 12 4,300,000
Ms. Saira Najeeb Ahmed* 2 2 600,000
Syed Tauqir Hussain 12 12 2,600,000
Mr. Shahid Yousaf 4 4 1 1 1,400,000
Mr. Haseeb Shakoor Paracha 1,000,000
Mr. Sajjad Ahmed 6 6 1,500,000
Mr. Muhammad Zubair** 700,000
Mr. Kazim Niaz -
Mr. Asim Murtaza Khan** 2 2 300,000
Mr. Masood Nabi ***
Mr. Zahid Nazeer Bhatti **** 10 10 12 4 1 1
Board Finance, Procurement
& Risk Management
Committee
Name of Director
Board Business
Development Strategy
Committee
Board HR & Nomination
Committee
Name of DirectorBoard Audit Committee
Board Corporate Social
Responsibility (CSR)
Committee
Board of Directors
Note: The Board was restructured on 03 January 2020.
* Ms. Saira Najeeb Ahmed replaced Syed Tauqeer Hussain Shah on 27 April 2020.
** Mr. Asim Murtaza Khan and Mr. Muhammad Zubair attended the meeting as co-opted member.
*** Mr. Masood Nabi assumed charge as MD / CEO, GHPL on June 19, 2020.
**** Mr. Zahid Nazeer Bhatti relinquished the charge of Acting MD / CEO, GHPL on June 18, 2020.
9

GHPL Annual Report 2019-20 10
KEY FINANCIALS
2018-19 2019-20
Sales - Gross Rs. billion 87.0 81.0
Sales - Net Rs. billion 77.6 71.5
Gross Profit Rs. billion 59.6 49.5
Profit for the year Rs. billion 34.6 33.1
Earnings per Share - Basic & Diluted Rs. 16.8 15.9
Cash Dividend Rs. billion 5.0 5.0
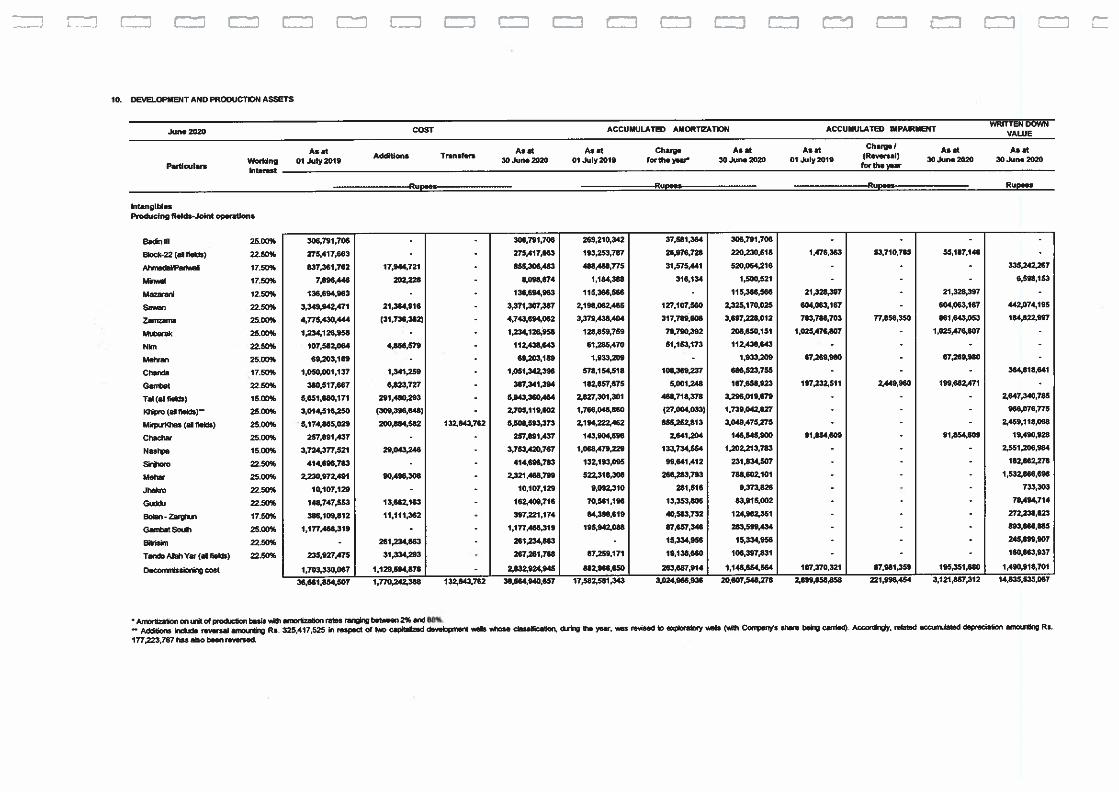
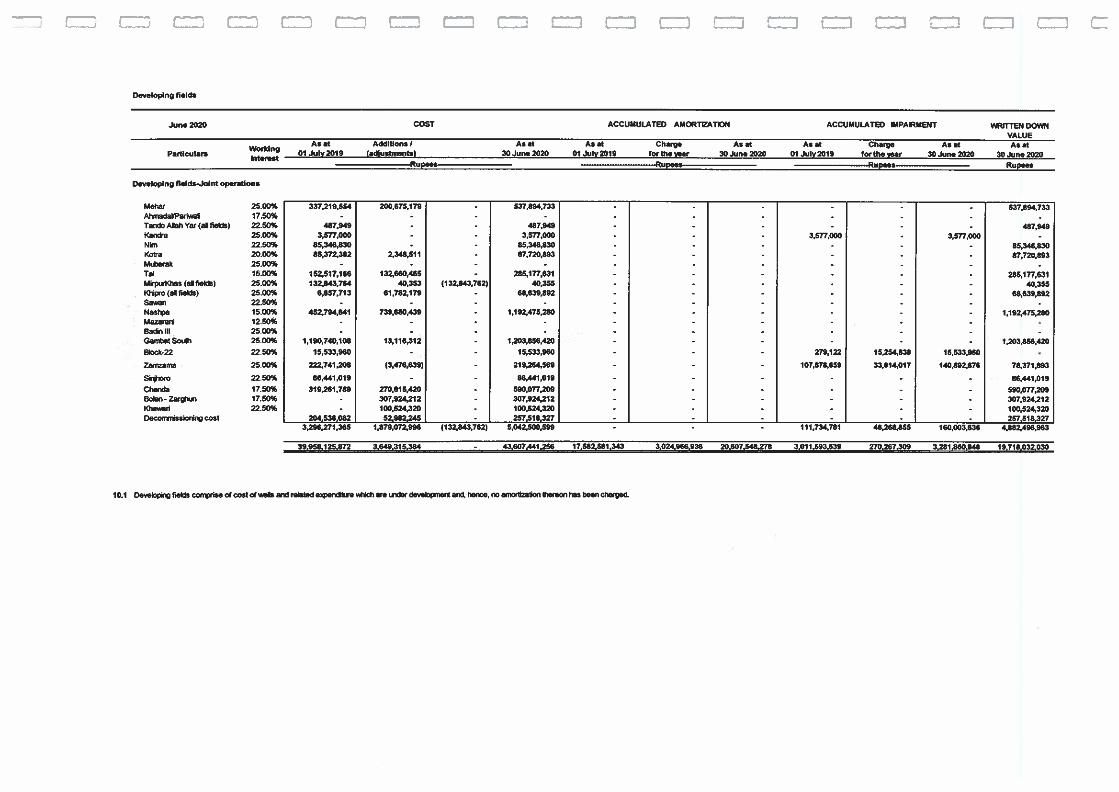
Development & Production Assets - at cost Rs. billion 40.0 43.6
Exploration and evaluation assets - at cost Rs. billion 4.1 5.5
Property, plant and equipment - at cost Rs. billion 53.8 56.9
Equity & Reserves Rs. billion 133.1 161.7
JV wise Net Sales 2019-20 Product-wise Net Sales 2019-20
10

GHPL Annual Report 2019-20 11
SIX YEARS SUMMARY
2014-15 2015-16 2016-17 2017-18 2018-19 2019-20
Operational Performance
Seismic Survey - 2 D line km 2,184 4,079 2,975 2,166 619 938
Seismic Survey - 3 D sq. km 1,987 3,523 1,483 440 614 510
Wells Drilled - Exploratory / Appraisal
numbers
30
25
25
22
21
9
- Development numbers 8 7 12 7 10 5
- Total numbers 38 32 37 29 31 14
Oil & Gas Discoveries numbers 13 11 10 6 8 3
Production (GHPL’s Share)
Oil / Condensate BPD 8,812 8,706 9,001 9,384 9,094 7,780
Gas MMSCFD 208 240 253 262 257 233
LPG MT/D 77 113 125 163 197 181
Financial Results
Sales - Gross Rs. billion 58.8 53.0 54.3 69.5 87.0 81.0
Sales - Net Rs. billion 53.1 46.6 48.0 61.9 77.6 71.5
Gross Profit Rs. billion 35.4 28.2 30.3 42.9 59.6 49.5 Other Income Rs. billion 3.2 2.4 3.6 2.3 3.2 4.7
Profit before Taxation Rs. billion 37.9 29.2 32.2 42.1 54.4 50.8
Profit after Taxation Rs. billion 24.3 18.1 20.3 27.5 34.6 33.1
Financial Position
Share Capital & Reserves Rs. billion 77.0 80.1 80.4 102.9 133.1 161.7
Non-Current Liabilities Rs. billion 14.7 15.3 16.2 17.2 19.6 19.5
Current Liabilities Rs. billion 13.1 5.4 22.0 11.1 15.3 15.9
Total Equity & Liabilities Rs. billion 104.9 100.8 118.6 131.7 168.0 197.2
Fixed Assets Rs. billion 42.9 47.0 47.7 48.8 51.9 53.7
Long term investment & Loan Rs. billion 2.4 2.8 3.1 4.8 7.4 3.5
Trade Receivables Rs. billion 20.3 33.2 28.8 53.4 79.2 98.7
Cash, Bank Balances &TDRs Rs. billion 35.6 14.6 35.5 15.3 22.0 29.4
Other Current Assets Rs. billion 3.6 3.2 3.5 9.2 7.6 12.0
Total Assets Rs. billion 104.9 100.8 118.6 131.7 168.0 197.2
Cash Flows
Operating activities Rs. billion 33.1 5.7 36.0 5.9 19.6 19.4
Investing activities Rs. billion (10.9) (23.4) (28.4) 11.2 (1.4) (7.3)
Financing activities Rs. billion (8.5) (15.0) (7.0) (18.0) (4.8) (4.6)
Cash & Cash Equivalents at year end
Rs. billion 35.6 2.9 3.5 2.6 16.0 23.4
Contribution to National Exchequer
Total Contribution Rs. billion 32.7 38.1 41.5 31.8 40.3 42.4
11

GHPL Annual Report 2019-20 12
SIX YEARS SUMMARY
2014-15 2015-16 2016-17 2017-18 2018-19 2019-20
Key Financial Ratios
Financial Performance / Profitability
Gross Profit Margin % 67% 60% 63% 69% 77% 69%
Pre tax Margin % 71% 63% 67% 68% 70% 71%
Net Profit Margin % 46% 39% 42% 44% 45% 46%
Return on equity % 35% 23% 25% 30% 29% 22%
Return on capital employed % 46% 31% 34% 39% 40% 30%
Operating Performance / Liquidity
Total assets turnover Times 0.57 0.45 0.44 0.49 0.52 0.39
Fixed assets turnover Times 1.35 1.04 1.01 1.28 1.54 1.36
Debtor turnover Times 3.10 1.95 1.72 1.67 1.30 0.90
Debtor turnover Days 118 187 212 219 281 405
Current ratio Times 4.53 9.37 3.08 7.02 7.13 8.79
Cash to Current Liabilities Times 2.71 2.68 1.61 1.38 1.44 1.85
Investment
Cash Dividend Rs. billion 8.5 15.0 20.0 5.0 5.0 5.0
Earnings per Share Rs. 12.0 8.9 10.0 13.6 16.8 15.9
Dividend per share Rs. 340 600 10 2.5 2.4 2.4
Dividend Payout Ratio % 35% 83% 98% 18% 14% 15%
Dupont Analysis
Net Profit Margin % 46% 39% 42% 44% 45% 46%
Total assets turnover Times 0.57 0.45 0.44 0.49 0.52 0.39
Equity Multiplier Times 1.34 1.31 1.37 1.37 1.27 1.24
Return on equity % 35% 23% 25% 30% 29% 22%
Dupont Analysis
▪ Net Profit margins for 2019-20 slightly improved to 46% as compared to 45% for the previous year despite reduced sales due to increase
in other income and reduction in other expenses and taxes.
▪ The asset turnover decreased due to reduction in sales as volumes and international crude prices remained low due to COVID-19.
▪ Equity multiplier slightly decreased due to increase in accumulated profits.
▪ The combined effect has resulted in a deterioration in ROE from 29% in previous year to 22% during the year.
12

GHPL Annual Report 2019-20 13
Six years Summary (at a glance)
▪ Due to COVID-19, few 2D/3D Seismic processing/reprocessing projects were delayed and expected to be completed in 2020-21.
▪ Few Exploration/Appraisal and Development wells were also postponed to next fiscal year due to pandemic
▪ COVID-19 pandemic affected production volume during March – May 2020.
13

GHPL Annual Report 2019-20 14
Sales per day (BoEs in 000’) Average Realized Exchange Rate & Prices
Six years Summary (at a glance)
Net Sales (Rs. in billion) Sales Volume (BoEs in million)
Sales per day (BoEs in 000’) Average Realized Exchange Rate & Prices
Gross Profit & Net Profit (Rupees in billion) Gross Profit Margin & Net Profit Margin (%)
14

GHPL Annual Report 2019-20 15
Current Ratio (times) Contribution to National Exchequer (Rs. in Billion)
Total Assets, Equity and Liabilities (Rs. in Billion)
Six years Summary (at a glance)
Trade Receivables (Rs. in Billion) Debtors Turnover (in days)
▪ The Company’s revenue declined by 8% during 2019-20 owing
to reduction in international oil prices and production volumes
following spread of COVID-19 Pandemic. This contributed to
reduction in the Company’s gross profit / net profit for the
year.
▪ The Company’s revenue fluctuates due to changes in
international oil prices, production level and USD/Rs. exchange
rates. Total revenue increased by 35% over the last six years.
▪ Over the years, the Company’s trade receivables have
increased due to the circular debt issue.
▪ During 2019-20, the trade receivables reached the
unparalleled level of Rs. 98.7 billion in the Company’s history,
mainly due to low recoveries from SNGPCL and SSGCL.
▪ Despite mounting receivables and liquidity constraints, the
Company successfully met all its operating, regulatory &
statutory financial obligations and is a significant contributor
to the National Exchequer.
15

GHPL Annual Report 2019-20 16
VERTICAL & HORIZONTAL ANALYSIS 2014-15 2015-16 2016-17 2017-18 2018-19 2019-20
Vertical Analysis
Profit or Loss Account
Sales - Net 100% 100% 100% 100% 100% 100% Cost of Sales -33% -40% -37% -31% -23% -31%
Gross Profit 67% 60% 63% 69% 77% 69% Other Income 6% 5% 7% 4% 4% 7% Expl. & Prospecting Expenditure 0% -1% -2% -2% -1% -1%
General & Admin expenses 0% 0% -1% 0% 0% -1%
Other expenses -1% -1% 0% -3% -10% -3%
Profit before Taxation 71% 63% 67% 68% 70% 71% Taxation -26% -24% -25% -24% -26% -25%
Profit after Taxation 46% 39% 42% 44% 45% 46%
Balance Sheet
Share Capital &Reserves 73% 79% 68% 78% 79% 82% Non Current Liabilities 14% 15% 14% 13% 12% 10% Current Liabilities 13% 5% 19% 8% 9% 8%
Total Equity & Liabilities 100% 100% 100% 100% 100% 100%
Non Current Assets 43% 49% 43% 41% 35% 29% Current Assets 57% 51% 57% 59% 65% 71%
Total Assets 100% 100% 100% 100% 100% 100%
Horizontal Analysis (base year: 2014-15)
Profit or Loss Account Sales - Net 100% 88% 90% 116% 146% 135% Cost of Sales 100% 104% 100% 107% 101% 124%
Gross Profit 100% 80% 86% 121% 168% 140% Other Income 100% 74% 112% 72% 101% 146% Expl. & Prospecting Expenditure 100% 673% 1206% 1204% 597% 663%
General & Admin expenses 100% 99% 157% 135% 181% 275%
Other expenses 100% 122% 57% 450% 1876% 555%
Profit before Taxation 100% 77% 85% 111% 144% 134% Taxation 100% 82% 87% 107% 146% 129%
Profit after Taxation 100% 74% 84% 114% 142% 137%
Balance Sheet Share Capital &Reserves 100% 104% 104% 134% 173% 210% Non-Current Liabilities 100% 104% 110% 117% 133% 133% Current Liabilities 100% 41% 167% 85% 116% 121%
Total Equity & Liabilities 100% 96% 113% 126% 160% 188%
Non-Current Assets 100% 110% 112% 119% 131% 126% Current Assets 100% 86% 114% 131% 182% 235%
Total Assets 100% 96% 113% 126% 160% 188%
16

GHPL Annual Report 2019-20 17
STATEMENT OF VALUE ADDITION 2018-19 2019-20
Rs. Billion % Rs. Billion % Gross Revenue 87.0 115% 81.0 108%
Less: Operating, G&A and Exploration Expenses
(6.8) -9% (8.4) -11%
80.1 106% 72.6 97%
Add: Income from Financial Assets 3.2 4% 4.7 6% Income from Non-Financial Assets 0.0 0% 0.0 0%
Less: Other Expenses (7.5) -10% (2.2) -3%
Total Value Added 75.8 100% 75.0 100%
DISTRIBUTED AS FOLLOWS:
Employees Remuneration and Benefits 0.3 0% 0.4 0%
Government as:
Income Tax 19.0 25% 19.7 26%
Sales Tax, Excise Duty & Other levies 9.5 12% 9.6 13%
Royalty 8.3 11% 7.9 11%
Dividends 5.0 7% 5.0 7% 41.8 55% 42.2 57%
To Society 0.0 0% 0.0 0%
Retained in Business:
Depreciation 2.2 3% 2.9 4%
Amortization 1.6 2% 3.0 4%
Impairment (0.5) -1% 0.4 1%
Deferred Taxation 0.8 1% (2.1) -3%
Net Earnings 29.6 39% 28.1 38% 33.8 45% 32.4 43%
75.8 100% 75.0 100%
17

GHPL Annual Report 2019-20 18
QUARTERLY ANALYSIS 2019-20
Quarter wise extracts from the Statement of Profit or Loss during the fiscal year 2019-20 are as follows:
1st Quarter
2nd Quarter
3rd Quarter
4th Quarter
Annual
SALES - NET Rs. billion 19.1 19.7 19.6 13.2 71.5
Royalty and other levies Rs. billion (2.2) (2.2) (1.9) (1.7) (8.1)
Operating expenses Rs. billion (3.5) (3.4) (3.1) (4.0) (14.0)
GROSS PROFIT Rs. billion 13.4 14.1 14.5 7.4 49.5
Other income Rs. billion 1.3 1.2 1.2 1.0 4.7
Exploration and prospecting expenditure Rs. billion (0.2) (0.1) (0.1) (0.2) (0.6)
General and administrative expenses Rs. billion (0.1) (0.2) (0.1) (0.1) (0.5)
Other expenses Rs. billion (0.4) (0.4) (0.4) (0.4) (1.7)
OPERATING PROFIT Rs. billion 14.0 14.6 15.1 7.7 51.3
Finance cost Rs. billion (0.0) (0.2) (0.2) (0.1) (0.5)
PROFIT BEFORE TAXATION Rs. billion 13.9 14.4 14.9 7.6 50.8
Taxation Rs. billion (5.7) (3.9) (6.7) (1.3) (17.6)
NET PROFIT FOR THE YEAR Rs. billion 8.2 10.5 8.2 6.2 33.1
EARNINGS PER SHARE - BASIC AND DILUTED Rs. 3.9 5.0 3.9 3.0 15.9
SALES VOLUME
Gas (MMBTUs in million) 17.8 18.3 18.0 16.5 70.6
Oil (BBLs in million) 0.6 0.7 0.7 0.6 2.7
LPG (MTs in thousand) 16.7 17.4 17.7 14.5 66.2
ANALYSIS:
▪ Net sales on quarterly basis remained consistent during the first three quarters of the FY 2019-20. The Net Sales reduced
significantly in the fourth quarter due to reduction in hydrocarbon demand and oil price caused by COVID-19.
▪ Gross profit, Net profit and Earnings per Share on quarterly basis depicts a similar trend as evident in the results of Net Sales.
18

GHPL Annual Report 2019-20 19
REVIEW REPORT TO THE MEMBERS ON THE
STATEMENT OF COMPLIANCE WITH THE
PUBLIC SECTOR COMPANIES (CORPORATE)
GOVERNANCE RULES, 2013
19

20

21
22

23
24

25

26

27

GHPL Directors’ Report 2019-20 28
DIRECTORS’ REPORT 2019-20
28

29

30

31

32

33

34

35

36

37

GHPL Annual Report 2019-20 38
UNCONSOLIDATED FINANCIAL STATEMENTS
FOR THE YEAR ENDED JUNE 30, 2020
38
39

40

41

42

43

44

45

46

47

48

49

50

51

52

53
54

55

56

57

58

59

60

61

62

63

64

65

66

67

68

69

70

71

72

73

74

75

76

77

78

79

80

81

82

83

84

85

86

87

88

89

90

91
92

93

94

95

96

97

98

99

100

101

102

103

104

105

106

107

108

109

110

111

112

113

114

115

116

117

118

119

120

121

122

123

124

125

126

127
128
129

130

131
132

133

134

135

136

137

138

139

140

141

142

143

144

145

146

147

148

149

150

151

152

153

154

155

156


![GRANDWELL HOLDINGS [PRIVATE] LIMITED MINISTER OF MINES](https://img.dokumen.tips/doc/110x75/6299c9599fa1042c0d138e24/grandwell-holdings-private-limited-minister-of-mines-.jpg)