Embed Size (px)
Citation preview

This PDF is a selection from an out-of-print volume from the NationalBureau of Economic Research
Volume Title: The Growth of Public Expenditure in the United Kingdom
Volume Author/Editor: Alan T. Peacock, and Jack Wiseman
Volume Publisher: Princeton University Press
Volume ISBN: 0-87014-071-X
Volume URL: http://www.nber.org/books/peac61-1
Publication Date: 1961
Chapter Title: Government Expenditure by Economic and Functional Categories
Chapter Author: Alan T. Peacock, Jack Wiseman
Chapter URL: http://www.nber.org/chapters/c2307
Chapter pages in book: (p. 62 - 95)

CHAPTER 5
Government Expenditure by Economicand Functional Categories
WE have now established that the secular growth in British governmentexpenditures relative to GNP, and the pattern of displacement in thatgrowth, cannot be completely explained by the "permanent" influencesaffecting government spending, or by the direct effects of war in makingincreased expenditures continuously necessary, or by these two influencesoperating together. We shall next examine the data from other points ofview, in order to discover what further characteristics of the displace-ment effect have been important to the nature and timing of expendituregrowth. To do this, we shall have to examine the statistics of governmentexpenditure classified by economic categories (capital and currentexpenditure, goods and services, and transfer expenditure) and accordingto function, and try to account for the behavior of the statistics when soclassified.
We hope with these reclassified statistics to learn something about theindirect effects of wars on government expenditures. However, theindirect character of these effects makes for difficulties in interpretation.The statement that an increase in war pension payments after a majorwar was "caused" by that war is unlikely to mislead anyone seriously.But can we say with equal clarity that the British Health Service, forexample, was the consequence of World War 11—inviting the inference thathad the war not occurred, the Service would not have come into existence?
This difficulty was explained in Chapter 2. The impact of socialdisturbances upon the enduring level of public expenditures must beseen as the consequence both of the displacement effect generated by thedisturbances (in releasing governments from the "bonds of the revenue,"in creating new social ideas, and in stimulating innovation in the fiscalsystem) and of the pre-existent socioeconomic environment in which thedisturbances occur. That is, the consequences of wars, for example, aredual in nature; they change the society in which they occur, but arethemselves conditioned by the existing characteristics of that society. Itis clear, therefore, that we must place our statistics against a backgroundwhich brings out the relevant facts of history, bearing particularly uponthe control of public expenditures and upon the attitudes of governmentand people to the functions of government and hence to the mechanicsof such control.
"Expenditure Depends upon Policy"We believe that the displacement effect of wars upon governmentexpenditures, insofar as it is not explicable by changes of the kind dis-
62

ECONOMIC AND FUNCTIONAL CATEGORIEScussed in the last chapter, must be the consequence of the wartimeweakening of checks that inhibit the rate of growth of public spending inmore normal times. Clearly, therefore, the importance of the displace-ment effect at any time depends partly upon the government's attitudetoward public expenditures, which will influence its willingness to takeadvantage of the opportunities for expansion created by war, and partlyupon how war affects the government's permanent ability to raise revenues,either by the changes it induces in the ideas of citizens as to what istolerable or by its effects upon the technical scope of the government'srevenue-raising activities. Associated with these influences, but distinctand important enough to require separate consideration, is the fact thatthe growth and pattern of expenditure may also be affected by changesin political organization which touch upon the control of expenditure.In each of these three respects—attitudes toward public expenditures,war-induced changes in social ideas about tax burdens and in technicalrevenue-increasing possibilities, and changes in political organization—the British economy has seen important developments over the lastcentury.
The secular rate of growth of government expenditures relative toGNP during our period is in striking contrast with the relative rateearlier in the nineteenth century. Perhaps the contrast can be explainedin part by the absence in the earlier period of major social disturbances,other than the Napoleonic Wars, and by the fact that the rapid rate ofgrowth in community output in the second half of the century gave scope forincreasing the absolute size of government expenditures without the needto increase the share of the public sector in total output. But, this leavesunexplained the apparent failure of even the Napoleonic Wars to causeany observable permanent increase in the share of government. It mightbe argued that a displacement effect did occur but cannot be seen in theglobal statistics because of the great importance of debt interest paymentsin that period. Thus, when debt payments were later reduced after beinginflated by the Napoleonic Wars, there was no equivalent fall in totalexpenditure, but some of the "slack" so created was taken up by increasesin expenditures of other kinds. In the light of the statistics and reasoningset forth in Chapter 3, such an argument is plausible. But it does notprovide a complete explanation of the difference between the periods.There have also been important developments in the attitude of thegovernment to public spending. Minimization of expenditures was anaim widely accepted in Parliament in the nineteenth century, and Parlia-mentary differences were concerned rather with the methods to be usedto raise revenues. This attitude to expenditures, exemplified in the viewheld by Gladstone and others that it was "a rule of finance that govern-ments should reduce their expenditures," stemmed from a particular
63

ECONOMIC AND FUNCTIONAL CATEGORIESinterpretation of the concept that "expenditure determines policy."This statement, admittedly a truism, has been of great importance inthe practical development of the British system of public finance. Itsapplication as a doctrine of policy falls Into two distinct periods, in whichit was interpreted first as a concept of retrenchment and later as a doctrineof expansionist public finance. There was of course never complete agree-ment with either interpretation. On the one hand, there was alwayssome opposition to the philosophy of retrenchment from those who gaveat least limited support to what Harcourt castigated as "the fatalisticdoctrine of progressive taxation." On the other hand, as late as the thirddecade of the twentieth century, when Harcourt's views had fallengenerally into disfavor, Hilton Young (Lord Kennet) could still write ina well-known book that "all the financial operations of the State are anunmitigated evil which is, unluckily, necessary. It is an evil, although anecessary one, that the State should have to collect and spend a revenue.A tax is a bad thing and not a good thing.... Could we do withouttaxes altogether, we should all be better off."2 But despite these exceptions,it is reasonably clear that until about the 1880's "expenditure determinespolicy" was for practical purposes a doctrine of retrenchment, and thatit thereafter became a justification for the expansion of the public sector.
The doctrine of retrenchment did not, however, derive simply from anobjection to "wasteful expenditure"; it was an operating principle ofpublic finance and depended upon a particular theory of employmentand the conclusions of that theory for tax policy.2a Incomes should be leftlarge enough for people to meet their needs; taxes (i.e., indirect taxes)impose a burden upon productive industry and in so doing induceunemployment and poverty. Such a view, dependent as it is upon adeficient theory of the economic consequences of taxation and publicexpenditures, led naturally to the proposition that government expendituresshould be kept to the minimum, and that economy rather than any con-ception of efficiency should be the yardstick for deciding upon any changein tax and expenditure policy.3 InGladstone's words, "the cost of any policywould generally be about the sole element in deciding its desirability."
1 It is also well illustrated by Bright's abortive motion of 1870 that the budget shouldhave an absolute limit of £70 million.
2 E. Hilton Young, The System of National Finance, London, 1924, Chapter X, p. 221.2a See B. A. Cony, "The Theory of the Economic Effects of Government Expenditure
in English Classical Political Economy," Economica, February 1958.3 There is evidence that the notion of efficiency was considered as a positive threat to
wise administration. Thus, Sir Winston Churchill writes of expenditure on militaryservices "It may begin in all individual earnestness in a simple demand for the reductionof expenditure. That is the first stage. But in the process of the controversy, the movementhas been insensibly and irresistibly deflected from the original object. It began in a cryfor economy; it has become a cry for efficiency. That is the second stage. The third stagebecomes an agitation in favour of an increase of expenditure and a more lavish establish-ment." Lord Randolph Churchill, new ed., London, 1952, Vol. II, p. 313.
64
ECONOMIC AND FUNCTIONAL CATEGORIESTogether with this general attitude, the doctrine of retrenchment
incorporated a special element which is of peculiar interest from ourpoint of view. This is the importance attached by the proponents ofretrenchment to the consequences of war. They saw the possibility thatthe large expenditures necessitated by wars would be continued after-wards, because the government could always find uses for the extra money,and they regarded this as a danger to be guarded against. The doctrineof retrenchment thus not only helps to explain the slow secular growth ofgovernment expenditures when ideas of retrenchment prevailed as com-pared with later years, but also provides a reason why the displacementeffect of wars should be less marked than it has since become; there was ademand in Parliament for restriction of the extent to which governmentrevenues and expenditures should be allowed to be permanently in-fluenced by war.
Dissatisfaction with the doctrine of retrenchment, and a new inter-pretation of "expenditure depends upon policy," developed in the l880's,at the beginning of our period. Retrenchment was itself becoming a lessplausible doctrine intellectually with the growth in importance of theincome tax. This "temporary," almost accidental by-product of the repealof the Corn Laws drove those who continued to inveigh against growingtaxes and expenditures to shift their ground, first to the unsatisfactoryeffects of the income tax on enterprise and then to the wider discussionof concepts of taxable capacity. At the same time, a philosophy of ex-pansion was being positively encouraged by the growth of the idea thatgovernment spending might actually generate incomes. This, in turn,was clearly related to the growth of "popular democracy" following thewidening of the franchise in 1884, and to a wider interpretation of thefunctions of government. By the 1890's, Harcourt, whose support forretrenchment persisted, was saying that "a Chancellor preaching againstextravagance is the voice of one crying in the wilderness," and Goschencould dismiss objections to the growth of expenditure simply as "bunkum."The era of "social socialism" had begun; there could be no more completecontrast with Gladstonian finance than Lloyd George's assertion in 1908that "No one need be afraid of any taxes being taken off in my time."Prophetically, some Fabian socialists saw these developments in stateactivity as a danger to the growth of "industrial" socialism.4
The development of doctrines of expansionist finance did not mean, ofcourse, that all desire to limit the size of government expenditures dis-appeared. Criticism of the new doctrines was continuous, and furtherevidence of disagreement is to be found, for instance, in the 1922 Com-mittee on National Expenditure, which suggested (unsuccessfully) ascheme for rationing government departments to keep expenditures in
Cf. Hubert Bland, "The Outlook," Fabian Essays in Socialism, 3rd ed., London, 1931.
65

ECONOMIC AND FUNCTIONAL CATEGORIEScheck. More important, while policy was becoming more generallyregarded as the significant matter and expenditure as its passive conse-quence, governments still had to take account of what citizens wouldtolerate by way of taxation. The important change thus lies in the govern-ment's attitude to public expenditures, in the relaxation of its desire forretrenchment for its own sake, and in the consequent shift in the effectiverestriction of the size of public expenditures away from what the govern-ment wished and toward what the electorate, broadened by the wideningof the franchise, would allow (by tolerating the implied tax burden).From the 1880's, then, the notion of taxable capacity began to replacethe doctrine of retrenchment as the effective curb on government expendi-tures. But it was a less concrete concept than retrenchment and hence aless severe curb—particularly in that it provided no similar check uponthe upward displacement of expenditures by wars. In consequence, thesecular rate of growth of government expenditures became much fasterand continued so throughout our period. Wars, which were seen earlieras dangerous invitations to later extravagance, now became simply theperiods in which community ideas about the tolerable burden of taxationunderwent enforced revision. As Ursula 1-licks puts it, "the high level oftaxation which can be established in wartime, almost without protest,conditions taxpayers to permanently higher exactions."5
This revision of ideas is to be clearly seen over the period of the twoWorld Wars. Sir Bernard Mallet has recorded that before World War ISir Robert Giffen was thought by some authorities to be taking an extremeview in suggesting that 10 per cent of national income was a reasonableproportion to appropriate for public purposes.6 After that war, as Malletpoints out, an actual proportion of between two and three times thatsize did not excite general disapproval; the famous Coiwyn Committeeof 1927, for example, took the view that "the present taxation . . . is notone of the main causes of industrial difficulty."7
Since World War II, the proportion has approached 40 per cent, andwhile (as always throughout fiscal history) there has been no lack ofcomplaint that the burden of taxation is too heavy, the objections havenot yet persuaded any British government drastically to reduce the scopeof its activities. It is consequently not easy to find an answer to Mallet'swry comment that "percentages are never so convincing as practicalexperience."8 During this later period, indeed, the doctrine of expan-
5 Ursula K. Hicks, British Public Finances, 1880—1952, Oxford, 1954, p. 13. See alsoA. M. Cartter, Redistribution of Incomes in Post- War Britain, New Haven, 1954.
6 See Sir Bernard Mallet and C. 0. George, British Budgets, 3rd ser. (192 1—22 to 1932—33), London, 1933, p. 464.
Report of the Committee on National Debt and Taxation, H.M.S.O., Command Paper2800, 1927. The detailed argument is to be found in the Majority Report, paragraph 702
8 Mallet and George, op. cit., p. 465.
66

ECONOMIC AND FUNCTIONAL CATEGORIESsionist finance has been further encouraged by the growing acceptance(connected with war, as we shall later show) of government action indirections formerly considered outside its scope, and by the encourage-ment given to ideas of "income generating" expenditures by the interwardepression years. Expenditure is now no longer a matter of defraying theexpenses of government; it has become an instrument of economic policy.Finally, over the period of World War II, we find the doctrine of retrench-ment being stood completely on its head, with the acceptance of the"new orthodoxy"—the Keynesian doctrine which sees governmentexpenditure not as a source of unemployment but as a possible instrumentfor its cure.
It is clear, then, that changes in government attitudes have been ofgreat importance in encouraging an increased rate of growth of Britishpublic expenditures. Also, this examination of the first of the three in-fluences singled out for study on page 63 has thrown some light upon thesecond—the influence of war on the government's ability to raise revenues.Perhaps the most reliable of economic predictions at any time is thatCitizens will dislike being asked to pay more taxes. Nevertheless, we haveseen that, once governments ceased actively to oppose the growth ofgovernment expenditures, the views of citizens about tax burdens werenot alone enough to prevent such growth. Whenever wars effectivelydestroyed existing ideas about tax burdens, the government, now that ithad a mind to, was able to increase the scope of its exactions. Also, thechanging ideas about the role of government, already referred to, affectedcitizens as well as governments. Despite the ability of individuals to holdincompatible views about the scope of government activities and aboutthe tolerable burden of taxes, these changing ideas can have made theacceptance of successively higher postwar tax levels at least no moredifficult. In particular, the widening of the franchise increased the politicalimportance of the group most likely to believe that public expendituresshould be increased for their benefit, but that the necessary revenuesshould be raised from others (the richer) by such means as progressivetaxation. Finally, revenue raising (and hence the growth of expenditures)has been facilitated by wars in a technical fashion, by the widening ofthe tax opportunities of governments and the consequent reduction ofthe difficulties of expansion. The tax system, indeed, provides a specialand important instance of the "inspection effect" of war. The exigenciesof periods of crisis make possible the general revision of the tax system,producing far-reaching permanent changes, and experimentation withnew tax sources also becomes possible. In our period, the result has beento produce a considerable widening of the fiscal system, making taxeseasier to raise and expenditures easier to envisage. To illustrate, experienceobtained during World War I in the techniques and administrative
67

ECONOMIC AND FUNCTIONAL CATEGORIESproblems of assessing lower income groups for income tax provided thefoundation for the permanent extension of that tax. Similarly, the pay-as-you-earn system, through which a considerable proportion of the popu-lation now has income tax deducted at source, was introduced duringWorld War II. It was also during this later period that the purchasetax was first introduced—as a "temporary" expedient—and the revenue-raising potentialities of the tobacco tax came to be fully appreciated.These changes are merely illustrative and could be multiplied withoutdifficulty.
It remains to consider the third influence on the nature and importanceof the displacement effect, namely, the character of, and changes in,Parliamentary institutions and organization. Continental writers haveinterpreted the changes described so far as an illustration of a generaldevelopment common to many countries; they are seen as the Britishmanifestation of the evolution of the public sector from a "participatingsystem" (Anteilsystem) into a "control system" (Kontrollsystem).9 One ofthe reasons suggested for this evolution, to which Schmölders in particularpays attention, is the growth of a "favorable attitude of Parliamentstowards spending."° The position of parliaments (the representativesof the people) vis-â-vis the governments (the executive bodies) has beenreversed, it is argued, by changes in the nature of the parliamentarydecision-taking process. In their earlier manifestations, parliamentsoperated as a brake on the tendency of the sovereigns to increase expendi-ture. Nowadays, it is usually governments that need to try to prevçntparliaments from introducing spending that would necessitate additionalrevenues. This is a not unrealistic description of what has happened inBritain, although the powers of the Sovereign in money matters had beenconsiderably curtailed before the beginning of our period. Rather, whathas now changed is the position of the Chancellor of the Exchequer inthe government, and the position of Parliament in relation to both.
British Chancellors of the Exchequer have always complained that theHouse of Commons exercised its influence in favor of increasing ratherthan reducing government expenditures; it is natural that the propensityof individuals to consume public services should encourage their repre-sentatives in Parliament to press for such services.11 So long as it persisted,however, the doctrine of retrenchment kept this influence in check. There
See F. K. Mann, Die Staatswirtschaft unserer 2jeit, Jena, 1929, and G. Schmölders,Finanzpolitik, Berlin, 1955, pp. 132—i 33. H. Laufenburger, Finances comparEes, Paris, 1952,describes the evolution as from the "Etat gendarine"to the "Etat providence" and then tothe "Etatfaustien"!
10 "Ausgabenfreudigkeit der Parlamente," ibid., pp. 138—139. On this point, see also Drees,op. cit., pp. 67—69.
See D. H. MacGregor, Public Aspects of Finance, Oxford, 1939, Part I, especiallypp. 62—65.
68

ECONOMIC AND FUNCTIONAL CATEGORIESwere few items of policy involving expenditure about which disagreementwas possible, and in such circumstances close centralized control overthe spending departments could be exercised by the permanent officialsof the Chancellor's own department, the Treasury. Indeed, in the daysof broad agreement about expenditure policy, Treasury control couldbe more continuous than the governments themselves, since successiveChancellors, even when of different parties, tended to accept the samepermanent Treasury view.12 At the same time, the Treasury and theChancellor stood at the center of the system of cabinet government. "Itused to be the distinguishing feature of the British administration," saidParnell, "that the Treasury was its heart. . . the other departments werenecessarily subordinate." This placed the Chancellor in a special position,for "the control of the Treasury is neither more or less than the personalinfluence of the Chancellor upon the Cabinet."3 Such a situation, possiblewhile the public economy remains a participating system based uponthe doctrine of retrenchment, meets difficulties as retrenchment isabandoned and a widening scope of public activities (the control system)becomes acceptable. Thus in 1919 Mr. Baldwin, Financial Secretaryto the Treasury, could point out that a minister appealing to the Cabinetagainst a decision of Mr. Gladstone would have met a hostile Cabinet,
• . which in nine cases out of ten would back the Treasury. The wholeoutlook to-day is changed. . . and all large items are controlled, not bythe Treasury, but by the policy of the Government, and if the Chancellorraises objection, and the Minister takes the matter to the Cabinet, thenatural bias will not be against the expenditure but in favour . . . . theHouse of Commons itself would in nearly every case support the Govern-ment which was spending the money on purposes of social amelioration."That is, the "changed attitude of Parliaments to public spending" isreally in the case of Britain a reduction in the powers of the Chancellorof the Exchequer to prevent such spending. Formerly those powers andthe efficacy of the Treasury control which flowed from them could renderany Parliamentary pressure for increased spending ineffective. To-day,while the Chancellor is still one of the most important members of theCabinet, his prime duty is to propose the means by which the revenuesneeded to implement government policies should be raised. His authorityover expenditures is limited to the support he can obtain in Cabinetdiscussion.'4 As a corollary, the nature of Treasury control has altered.It has become less concerned with "the saving of candle ends" and morewith the "efficient" allocation of resources as between public and private
12 Churchill, op. cii., pp. 179—180.'3lbid.,p. 184.14 The resignation of Mr. Thorneycroft in early 1958 is a case in point.
69

ECONOMIC AND FUNCTIONAL CATEGORIESuses,'5 thus remedying the deficiency complained Of by Sir RobertGiffen.'6 This is not to suggest, of course, that the traditional functionsof the Treasury have completely disappeared; they are still manifested,for example, in the Treasury examination of departmental projects to beincluded in the Annual Estimates so as to ensure "value for money."But the Chancellor and the Treasury no longer have their former authorityor efficiency in curbing the growth of public spending; the only importantobstacles to such growth now are the fear of political consequences ofthe concomitant need to raise more taxes, and the possible economic(incentive) consequences of that need. Clearly, such a situation enhancesthe possibility of upward displacements at times of social disturbance.'7
In the light of this review of parliamentary and social history, we turnto the actual expenditure statistics, classified by economic and functionalcategories. Clearly, we cannot hope to see the changes in social ideas, infiscal techniques, and in political control over spending reflected in neatand unambiguous fashion. We must expect them to affect both thesecular behavior of expenditures and the displacement generated byperiods of social disturbance, and the precise explanation of displacementin particular cannot be free from speculation. How far wartime displace-ment has been in some sense the fundamental cause of expenditure growthand how far it has operated only upon the growth's timing cannot bedetermined by statistics. The most we can hope for is that the data willlead us toward those further facts of history that are of relevance to anunderstanding of the growth in British public expenditures, and it is byits success in this that the displacement hypothesis should be judged.
Expenditure by Economic CategoriesTwo broad divisions of government expenditure invite examination:expenditures on goods and services and upon transfers, and on capitaland current account.
EXPENDITURE ON GOODS AND SERVICES AND ON TRANSFERS
Not all government expenditures imply the exercise of direct claimson the country's real resources, since some part of the expeaiditure con-sists of transfer and subsidy payments. Consequently, a study of "resource
15 Sir Edward (now Lord) Bridges, in "Treasury Control," Stamp Memorial Lecture,1950, p. 9, ascribes this change to the effects of World War I on traditional ideas aboutgovernment spending.
16 See Chapter 3, first section.Further and illuminating discussion of the development of political and ideological
views in Britain, and of the changing character of British government, is to be found inMoses Abramovitz and Vera F. Eliasberg, The Growth of Public Employment in GreatBritain, Princeton University Press for National Bureau of Economic Research, 1957.
70

TAB
LE 5
RES
OU
RC
E U
sE A
ND
GR
OSS
NA
TIO
NA
L PR
OD
UC
T, A
T C
UR
REN
TA
ND
1900
PRICES,
SELE
CTE
D Y
EAR
S, 1
890—
1955
(am
ount
s in
mill
ions
of p
ound
s; in
dex,
190
0=
100
)
Gov
ernm
ent E
xpen
ditu
res
1890
1900
1910
1920
1928
1933
1938
1950
1952
1955
1.O
n go
ods a
nd se
rvic
esM
oney
, cur
rent
pric
es96
.924
4.6
216.
998
9.6
560.
652
7.4
1,04
1.4
2,50
83,
689
3,810
Inde
x40
100
8940
529
921
642
61,
025
1,50
81,
558
Rea
l, 19
00 p
rices
98.9
244.
621
1.1
348.
628
5.1
306.
455
6.3
646
819
796
Inde
x40
100
8614
311
712
522
726
433
532
52.
On
trans
fers
and
subs
idie
sM
oney
, cur
rent
pric
es33
.736
.255
.160
2.5
534.
153
8.6
545.
62,
031
2,08
82,
333
Inde
x93
100
152
1,66
41,
475
1,48
81,
507
5,61
05,
768
6,44
5R
eal,
1900
pric
es34
.436
.252
.521
6.7
269.
730
9.5
294.
954
949
251
3In
dex
9510
014
559
974
585
581
51,
517
1,35
91,
417
3.
(1) a
s per
cent
age
of G
NP
Mon
ey7
13
10
16
12
13
20
22
26
23
Real
713
10
16
12
13
20
21
26
23
4.(1
) as p
erce
ntag
e of
tota
lex
pend
iture
Mon
ey74
8780
6251
5066
55
6462
Real
74
87
80
62
51
50
65
54
63
61
SOU
RC
E: A
ppen
dix
Tabl
esA-li and
A-1
2.

ECONOMIC AND FUNCTIONAL CATEGORIES
CHART IIGovernment Expenditure on Goods and Services, and Gross
Millions of pounds20,000
10,0009,0008,0007,000
6,000
5,000
4,000
3,000
2,000
1,000900800700600
500
400
200
10090
Nauonal Product, at Current Prices,
72
1890—1955
Ratto
o 0a, a, 0 0 0 0 0 0
— — IN 14) 14) It) It)a, a,

ECONOMIC AND FUNCTiONAL CATEGORIESusing" and other expenditures is a useful first step toward elucidating theresidual elements of the displacement effect.
The relevant material is contained in Table 5 and Charts 11 to 14and in Tables A-il and A- 12. From these, it is clear that the secular rateof growth of the government's direct claims on community product (asmeasured by its expenditures on goods and services) is still impressive,if somewhat less than the rate of increase in government expenditures asa whole. The index of money expenditures on goods and services perhead of population rose from 43 in 1890 (1900 = 100) to 381 in 1920and 1,258 in 1955. In real terms, a similar index moves from 100 in 1900to 263 in 1955. Over the whole period, this rate of increase is a good dealfaster than that of GNP; the proportion of expenditure on goods andservices to GNP was 7 per cent in 1890 and 23 per cent in 1955. Further,the statistics and Charts 11 to 14 also suggest that expenditure on goodsand services at least shared in the upward displacement of wars, although
CHART 12
Indexes of Government Expenditure on Goods and Services, andGross National Product, per Head of Population, at 1900 Prices,
1890-1955
73
Index (1900=100)500
o u' 0 0 'O 0 0 ID 0 U) 0 U)a., 0 0 — — C'J 'J r') U) U)
o o o
Rat to scale

ECONOMIC AND FUNCTIONAL CATEGORIESit did not of course account for all of it. Government expenditure ongoods and services was taking about 7 to 10 per cent of GNP up to WorldWar I and 12 to 15 per cent between the two wars (until the rearmamentcampaign in the late l930's which preceded the outbreak of World WarII). Since World War II, the proportion has risen to well over 20 percent for most of the years recorded. The effect of social disturbance uponspending on goods and services, that is, was less marked at the periodof World War I than at that of World War II.
The reason for this contrast is to be found in the changing relativeimportance of government expenditures on goods and services and ontransfers. We have already observed the great importance of transferpayments (chiefly interest on the national debt) during the nineteenthcentury. Such payments had begun to take a smaller part of total expendi-tures, however, well before the turn of the century, as debt interest pay-ments began to decline in relative importance. This growing importanceof spending on goods and services continued between 1890, when suchspending accounted for 74 per cent of all government expenditures, and1900, when the proportion was 87 per cent (Table 5, Chart 13). There-after, transfers became of rather greater significance once more; by 1913only 81 per cent of all expenditure was for direct government consump-tion. Following this, there was a quite marked increase in the relativeimportance of transfers over the period of World War I. As against 19per cent of total government spending going to such purposes in 1913, asmuch as 45 per cent of government expenditure was for transfers in 1921and a half of all spending was of this kind in 1923. That is, the time ofWorld War I saw an important growth in government activities involvingtransfers, since these took less than one-fifth of all spending before thewar and around one-half after it. It is not difficult to identify some ofthe kinds of expenditure that must have helped cause the change. Onecause we have observed earlier and discuss further below: debt interestpayments again became a significant part of total expenditure. But to aconsiderable extent, also, the change must have been due to the great
in the coverage of unemployment insurance, from two andone-quarter million workers before 1914 to nearly twelve million afterthe Unemployment Insurance Act of 1920, and to the increased scopeand higher real benefits of health insurance which became relevantaround the same time. This in turn provides an interesting commentaryupon the effects of unemployment on public expenditures. Periods ofdepression may have changed social ideas, but it is after a period of warthat we see those ideas translated into effective social action.
By way of contrast, the pattern since World War II shows the share ofexpenditures taken by goods and services as being similar to that of theinterwar years up to 1950, and higher and more variable thereafter.
71

AND FUNCTIONAL CATEGORIESCertainly there has been no change comparable to that after 1918; thedisplacement effect in this later period implied a general increase in theclaims of government rather than a relative growth in either transfer orresource using activities. This difference is partly but not completely
CHART 13
Percentage Distribution of Total Government Expenditure, byEconomic Category, at Current Prices, 1890—1955
Per cent100
und subsidies
90 :
80 : :---
70
60
50
40
Current goods and services
30
20
10 Captt& goodsand services .
0
75

ECONOMIC AND FUNCTIONAL CA TEGORIESexplained by the continuous full employment that Britain has experiencedsince World War II, with the consequent minimization of unemploymenttransfer payments.
Finally, from a secular point of view, resource-using expenditures, whilemuch larger in absolute size, constitute a smaller proportion of all govern-ment expenditure at the end of our period than at the beginning.
CHART 14
Indexes of Total Government Expenditure, by Economic Category,per Head of Poputation, at 1900 Prices, 1890—1955
76
(1900=100)2,000

ECONOMIC AND FUNCTIONAL CATEGORIES
EXPENDITURE ON CURRENT AND CAPITAL ACCOUNT
Table 6 and Charts 13, 14, and 15 show that government expenditureon current account, both in total money terms and in real terms perhead, rose during our period at a much faster secular rate than GNP.Such expenditures were 8 per cent of GNP in 1890 and 35 per cent (inreal terms) in 1955. Chart 15 also shows clearly that the rise follows thenow familiar pattern of displacement: the share of government currentexpenditures was between 8 and 11 per cent up to 1913, 22 to 26 per centbetween the wars, and 38 to 35 per cent after World War II.
Capital expenditure behaved rather differently. During the period1900—55, when the index of real current government expenditure perhead was rising from 100 to 425, a similar index of expenditure on capitalaccount rose only from 100 to 152, not much faster than that of realGNP. But the comparison is a little misleading; four years earlier theindex of capital expenditures had been 70 per cent higher, at 258. Infact, capital expenditures followed a less regular trend than expendituresof other types, and changes in their importance bear a less neat relationto the incidence of wars. This is clearly brought out in Chart 13, in thecurve showing the percentages of total government expenditures devotedto current and capital purposes.
This irregularity of capital spending suggests that expenditure oncurrent account explains most of the phenomenon of displacement; thiswas in any case inevitable since current expenditures have at no timeaccounted for less than 82 per cent of all government spending. Theirregularity of expenditure on capital account is itself not particularlysurprising. By definition, capital expenditures create durable assets,and such expenditures must, therefore, tend to occur irregularly. Also,the well-known phenomenon of "bunched investment" can affect publicas well as private investment, and there are two sorts of reasons forexpecting it to do so. First, the idea that spending on capital projectsmight help the unemployed did not begin with Keynes, though he gaveit intellectual plausibility. The direct effects of capital spending areobvious enough, and after the breakdown of the doctrine of retrenchmentthere was no overwhelming argument against such spending. Conse-quently, over most of our period we find growing pressure for capitalspending in time of unemployment. When such spending occurs it tendsto reduce the volume of investment spending required later. In contrastwith current relief payments in time of unemployment, for example, it isa transfer of expenditure in time rather than a simple addition to thetotal of government spending. Thus, investment spending shows afluctuation over time, and this may then be perpetuated by the period-icily with which the assets so created require replacement.
77

TAB
LE 6
GO
VER
NM
ENT
EXPE
ND
ITU
RE
ON
AN
D C
API
TAL
Acc
ouN
T, A
r4n
GR
OSS
NA
TIO
NA
L PR
OD
UC
T,A
T19
00PR
ICEs
, SEL
ECTE
D Y
EAR
S, 1
890—
1955
(am
ount
s in
millions of pounds;
inde
x, 1
900
=10
0)
Gov
ernm
ent E
xpen
ditu
res
1890
1900
1910
1920
1928
1933
1938
1950
1952
1955
1.O
n cu
rren
t acc
ount
Mon
ey, c
urre
nt p
rices
120.
423
0.4
226.
91,
490.
298
6.0
977.
51,
368.
34,
102
4,97
85,
525
Inde
x52
100
9864
742
842
459
41,
780
2,16
12,
398
Rea
l, 19
00 p
rices
122.
923
0.4
216.
153
6.0
497.
956
1.7
739.
61,
109
1,17
41,
214
Inde
x53
100
9423
321
624
432
148
151
052
72.
On
capi
tal a
ccou
ntM
oney
, cur
rent
pric
es10
.250
.445
.110
1.9
108.
788
.521
8.7
437
799
618
Inde
x20
100
8920
221
617
643
486
71,
585
1,22
6R
eal,
1900
pric
es10
.450
.447
.529
.356
.954
.211
1.6
8613
795
Inde
x21
100
9458
113
108
221
171
272
188
3.
(1) as
perc
enta
ge o
f GN
PM
oney
812
11
25
22
24
26
35
36
33
Real
812
11
25
22
24
26
37
37
35
4.
(1) as percentage
of to
tal
expenditure
Mon
ey92
8283
9490
9286
9086
90R
eal
9282
8295
9091
8793
9093
SOU
RC
E: A
ppen
dix
Tabl
es A
- 13
and
A- 1
4.

ECONOMIC AND FUNCTIONAL CATEGORIES
CHART IS
Government Expenditure on Current Account, and Gross NationalProduct, at Current Prices, 1890—1955
10,0009,0008,0007,0006,000
5,000
4,000
3,000
2,000
1,000900800700
600
500
400
300
200
100
79
Miffions of pounds20,000
o 0 0 0 tO 0 0 if) 0a.' a.' 0 0 — — N) rfl tO LI)
a.' a.' rn a.' a.' a.' 0.' 0.' 0.'
Ratio scale

ECONOMIC AND FUNCTIONAL CATEGORIESThe second and perhaps less obvious possible reason for bunchiness is
to be found in the phenomenon of displacement. There is evidence thatnew projects introduced over periods of displacement have their immediateeffect on the level of current expenditures, but that in course of time suchnew current obligations involve the government in the need to under-take new capital projects also. Consequently, while capital expendituresdo not follow the time pattern of other government expenditures, theirown irregularity over time is probably influenced by that pattern. Thegrowing problems of providing the requisite school and hospital accommo-dation in Britain to cope with the post-World War II expansion of theseservices illustrates the point.
Expenditure by FunctionThe discussion in Chapter 4 of one important government service—defense—which might account for the displacement effect yielded theconclusion that no complete explanation was possible along such lines.This suggests that a classification of all government expenditure byfunctions, apart from illuminating further the process of economic change,is also necessary in order to provide further understanding of the influenceof war on government expenditure. In this section, then, we classifyexpenditure in the following categories :18 (1) general administration(including the costs of tax collection), (2) national debt service, (3) lawand order, (4) overseas services (excluding defense), (5) military anddefense, (6) social services, (7) economic services, and (8) environmentalservices.
TABLE 7GOVERNMENT EXPENDITURE, BY FUNCTION AN]) ECONOMIC CATEGORIES,
AT CURRENT PRICES, SELECTED YEARS, 1890—1955(millions of pounds)
rearGoods and
Total CurrentServices
Capital Transfers
ADMINISTRATION AND OTHER1890 15.8 14.7 0.6 0.51900 16.5 13.6 2.0 0.91910 22.1 18.4 2.2 1.51920 71.5 64.2 4.7 2.61928 49.1 45.5 2.7 0.9
1933 44.3 40.9 3.0 0.41938 60.6 53.3 6.7 0.61950 175.0 118.0 18.0 39.01952 167.0 123.0 16.0 28.01955 182.0 138.0 18,0 26.0
'8The exact content of these categories is explained in the Appendix under the sameheadings.
80

ECONOMIC AND FUNCTIONAL CA TEGORIES
TABLE 7 (continued)
Goods and ServicesYear Total Current Capital Transfers Subsidies
NATEONAL DEBT1890 23.8 23.81900 19.6 19.61910 20.2 20.21920 324.8 324.81928 305.1 305.1
1933 228.4 228.41938 212.5 212.51950 507.0 507.01952 609.0 609.01955 707.0 707.0
LAW AND ORDER1890 9.0 8.2 0.3 0.51900 9.8 9.2 0.2 0.41910 12.9 12.1 0.2 0.6
33.3 32.3 0.4 0.61928 30.8 28.7 0.4 1.7
1933 30.9 29.0 0.4 1.51938 38.7 35.4 2.0 1.31950 79.0 72.0 7.0 —1952 96.0 85.0 10.0 1.01955 115.0 103.0 10.0 2.0
OVERSEAS SERVLCES1890 0,4 0.2 0.21900 1.0 1.0 — —1910 1.1 Q.9 0.2 —1920 2.5 0.2 — 2.31928 1.3 0.5 0.8
1933 1.7 1.1 0.61938 3.0 0.7 2.31950 179.0 39.0 140.01952 77.0 40.0 37.01955 80.0 41.0 39.0
MILITARY AND DEFENSE1890 34.9 32.7 1.5 0.71900 134.9 118.0 16.2 0.71910 74.3 55.5 16.5 2.3 —1920 519.7 499.1 10.6 8.0 2.01928 125.1 120.5 4.1 0.5 —
1933 112.4 107.0 3.5 1.91938 473.2 418.6 52.2 2.41950 836.0 822,0 5.0 9.01952 1,641.0 1,469.0 155.0 17.01955 1,606.0 1,523.0 59.0 24.0
81
ECONOMIC AND FUNCTIONAL CATEGORIES
TABLE 7 (concluded)
Goods and ServicesTear Total Current Capital Transfers Subsidies
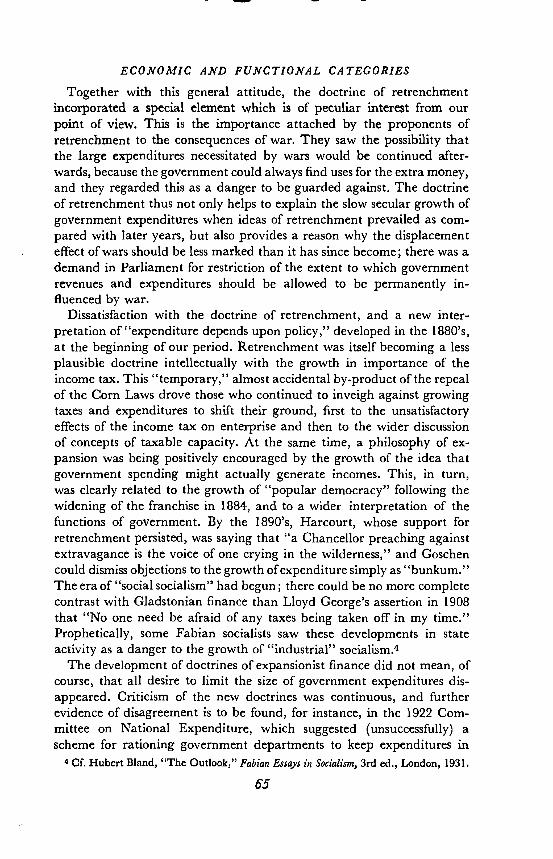
SOCIAL SERVICES1890 27.3 17.6 1.9 7.81900 50.6 28.6 7.6 14.41910 89.1 52.4 6.6 30.1 —1920 411.8 167.0 49.1 193.7 2.01928 434.8 161.2 54.3 218.8 —1933 497.2 167.1 36.9 293.21938 596.3 206.7 85.8 303.8 —1950 2,094.0 781.0 336.0 815.0 162.01952 2,438.0 896.0 442.0 989.0 111.01955 2,739.0 1,070.0 417.0 1,205.0 47.0
ECONOMIC SERVICES1890 14.4 10.2 4.0 0.21900 36.4 16.4 19.8 0.21910 37.8 21.6 15.8 0.4 —1920 203.2 102.7 34.0 1.9 64.61928 117.1 71.3 40.4 0.8 4.61933 111.8 66.0 34.7 0.7 10.41938 151.4 72.6 59.7 1.8 17.31950 572.0 169.0 44.0 120.0 239.01952 629.0 194.0 139.0 76.0 220.01955 531.0 220.0 68.0 44.0 199.0
ENVIRONMENTAL SERVICES1890 5.0 3.1 1.91900 12.0 7.4 4.61910 14.5 10.9 3.61920 25.3 22.2 3.1 —1928 31.9 24.2 6.8 0.91933 39.3 27.8 10.0 1.51938 51.3 35.4 12.3 3.61950 97.0 70.0 27.0 —1952 120.0 83.0 37.0 —1955 183.0 97.0 46.0 40.0
ALL SERVICES1890 130.6 86.7 10.2 33.71900 280.8 194.2 50.4 36.21910 272.0 171.8 45.1 55.1 —1920 1,592.1 887.7 101.9 533.9 68.61928 1,094.7 451.9 108.7 529.5 4.61933 1,066.0 438.9 88.5 528.2 10.41938 1,587.0 822.7 218.7 528.3 17.31950 4,539.0 2,071.0 437.0 1,630.0 401.01952 5,777.0 2,890.0 799.0 1,757.0 331.01955 6,143.0 3,192.0 618.0 2,087.0 246.0
For totals, see Appendix Table From 1890 to 1918subsidies are included in transfers.
82

ECONOMIC AND FUNCTIONAL CATEGORiESIn Table 7, the growth of expenditure by function at current prices is
illustrated, and in Table 8 the real growth per head of population.Government expenditure, both in money terms and in real expenditureper head of population, rose for all categories of expenditure over theperiod 1890 to 1955. Moreover, as Table 9 shows, the rate of growth of
TABLE 8
GOVERNMENT EXPENDITURE, BY FUNCTION AND ECONOMIC CATEGORIES,PER HEAD OF POPULATION, AT 1900 PRICES,
SELECTED YEARS, 1890—1955
(pounds per head)
Goods and Servicesrear Total Current Capital Transfers
ADMINISTRATION AND OTHER1890 0.4 0.4 —1900 0.4 0.3 0.1
1910 0.5 0.4 0.11920 0.6 0.5 —1928 0.5 0.5
1933 0.6 0.5 —1938 0.7 0.6 0.1
1950 0.9 0.6 0.1 0.2
1952 0.8 0.6 0.1 0.11955 0.8 0.6 0.1 —
NATIONAL DEBT
1890 0.7 0.7
1900 0.5 0.51910 0.4 0.41920 2.7 3.4
1928 3.4 3.4
1933 2.8 2.8
1938 2.4 2.4
1950 2.7 2.7
1952 2.9 2.9
1955 3.0 3.0
LAW AND ORDER1890 0.2 0.21900 0.2 0.2
1910 0.3 0.31920 0.3 0.31928 0.3 0.3
1933 0.4 0.4
1938 0.4 0.4
1950 0.4 0.4
1952 0.4 0.4
1955 0.4 0.5
83

ECOXOMIC AXD FUXCTIONAL CATEGORIES
TABLE 8 (continued)
Goods aTear Total Current
rid ServicesCapital Transfers Subsidies
OVERSEAS SERVICES18901900191019201928
1933 —1938 — — —1950 1.0 0.2 0.81952 0.4 0.2 0.21955 0.4 0.2 0.2
MILITARY AND DEFENSE1890 1.0 0.9 — —1900 3.3 2.9 0.4 —.1910 1.6 1.2 0.4 0.11920 4.3 4.1 0.1 0.11928 1.4 1.3 0.1 —
1933 1.4 1.3 0.1 —1938 5.4 4.8 0.6 —1950 4.5 4.4 — 0.1195Q 7.5 6.9 0.6 0.11955 6.9 6.6 0.2 0.1
SOCIAL SERVICES1890 0.7 0.5 0,1 0.21900 1.2 0.7 0.2 0.41910 1.9 1.1 0.2 0.61920 3.3 1.4 0.3 1.61928 4.8 1.8 0.6 2.4
1933 6.2 2.1 0.5 3.6 —1938 6.7 2.4 0.9 3.5 —1950 10.9 4.2 1.4 4.4 0.91952 10.8 4.2 1.5 4.6 0.51955 11.3 4.6 1.3 5.2 0.2
ECONOMIC SERVICES1890 0.4 0.3 0.1 —1900 0.9 0.4 0.5 —1910 0.8 0.5 0.4 —1920 1.6 0.8 0.2 0.51928 1.3 0.8 0.5 0.1
1933 1.4 0.8 0.5 — 0.11938 1.7 0.8 0.6 — 0.21950 3.0 0.9 0.1 0.7 1.31952 2.8 0.9 0.5 0.4 1.01955 2.1 1.0 0.1 0.2 0.9
84

ECONOMIC AND FUNCTIONAL CATEGORIES
TABLE 8 (concluded)
Goods a nd Servicesrear Total Current Capital Transfers Subsidies
ENVIRONMENTAL SERVICES1890 0.1 0.1 0.11900 0.3 0.2 0.11910 0.3 0.2 0.11920 0.2 0.2 —1928 0.4 0.3 0.1
1933 0.5 0.3 0.1 —1938 0.6 0.4 0.1 —1950 0.5 0.4 0.1 —1952 0.5 0.4 0.1 —1955 0.7 0.4 0.2 0.2
ALL SERVICES1890 3.6 2.4 0.3 0.9 —1900 6.8 4.7 1.2 0.9 —1910 5.9 3.6 1.1 1.2 —1920 12.9 7.3 0.7 4.4 0.61928 12.2 5.0 1.3 5.9 0.1
1933 13.2 5.4 1.2 6.5 0.11938 17.9 9.4 2.4 6.0 0.21950 23.8 11.2 1.7 8.8 2.21952 26.0 13.5 2.7 8.2 1.61955 25.7 13.8 1.9 9.0 1.1
SOURCE: For totals, see Appendix Table A- 16.
expenditure per head has been higher than that of the gross nationalproduct for all categories except administration, whose share remainedroughly constant. This is not to say, of course, that the growth has beenregular or that its rate has been uniform for each type of expenditure.
As we see from Chart 16, the rate of growth of real expenditure perhead on national debt interest and on social services has exceeded thatfor government expenditure as a whole. By the same measure, the rateof growth of economic services has roughly kept pace with that of expendi-ture as a whole, but the rates of growth of expenditures for militarypurposes, environmental services, and law and order have been slower.Expressing the most important of these categories as percentages of totalgovernment expenditure, as in Chart 17 and Table 9, we observe thatsocial services expenditure did not fall below 30 per cent of total expendi-ture after 1910 and remained well above 40 per cent after 1930, apart
85

TAB
LE 9
PER
CEN
TAG
E D
Ism
IBm
loN
ol'
GO
VER
NM
ENT
EXPE
ND
ITU
RE
BY
FUN
CTI
ON
, SEL
ECTE
D Y
EAR
S, 1
890—
1955
(per
cent
age
of to
tals
at c
urre
nt p
rices
)
Envi
ronm
enta
l
Tear
Soci
al S
ervi
ces
GN
PEx
pend
iture
Econ
omic
Ser
vice
sG
NP
Expe
nditu
reG
NP
Serv
ices
Expe
nditu
reG
NP
All
Serv
ices
Expe
nditu
re
1890
1.9
20.9
1.0
11.0
0.3
3.8
8.9
100.
019
002.
618
.01.
913
.00.
64.
314
.410
0.0
1910
4.2
32.8
1.8
13.9
0.7
5.3
12.7
100.
019
206.
825
.93.
312
.80.
41.
626
.210
0.0
1928
9.6
39.7
2.6
10.7
0.7
2.9
24.2
100.
0
1933
12.0
46.6
2.7
10.5
0.9
3.7
25.7
100.
019
3811
.337
.62.
99.
51.
03.
230
.010
0.0
1950
18.0
46.1
4.9
12.6
0.8
2.1
39.0
100.
019
5217
.542
.24.
510
.90.
92.
141
.510
0.0
1955
16.3
44.6
3.2
8.6
1.1
3.0
36.6
100.
0
Soua
en: A
ppen
dix
Tabl
es A
-15
and
A-1
7.
and
Oth
er)la
tiona
l Deb
tLa
w a
nd O
rder
Ove
rsea
s Ser
vice
sM
ilita
ry a
nd D
efen
seTe
arG
NP
Expe
nditu
reG
NP
Expe
nditu
reG
NP
Expe
nditu
reG
NP
Expe
nditu
reG
NP
Expe
nditu
re
1890
1.1
12.1
1.6
18.2
0.6
6.9
0.3
2.4
26.7
1900
0.8
5.9
1.0
7.0
0.5
3.5
0.1
0.4
6.9
48.0
1910
1.0
8.1
0.9
7.4
0.6
4.7
0.1
0.4
3.5
27.3
1920
1.2
4.5
5.4
20.4
0.5
2.1
—0.
28.
632
.619
281.
14.
56.
727
.90.
72.
8—
0.1
2.8
11.4
1933
1.1
4.2
5.5
21.4
0.7
2.9
0.2
2.7
10.5
1938
1.1
3.8
4.0
13.4
0.7
2.4
0.1
0.2
8.9
29.8
1950
1.5
3.9
4.4
11.2
0.7
1.7
1.5
3.9
7.2
18.5
1952
1.2
2.9
4.4
10.5
0.7
1.7
0.6
1.3
11.8
28.4
1955
1.1
3.0
4.2
11.5
0.7
1.9
0.5
1.3
9.6
26.1

Index1,000
900800700600500
400
300
10090807060
50
40
ECONOMIC AND FUNCTIONAL CATEGORIES
CHART 16
Indexes of Total Government Expenditure, and Expenditure byFunction, per Head of Population, at 1900 Prices, 1890—1955
from war periods.'9varied from about 25
Militaryto 30 per cent of total
in peacetimeexpenditure before World
War I, dropped significantly in the 1920's and 1930's to nearer 12 percent, but returned to well over 20 per cent after 1950. Of course, in war-time it rose significantly, although we cannot specify a percentage for World
19 During wartime the fall in percentage is rather misleading, because many forms ofsocial service, such as hospital treatment and housing, would be undertaken for thearmed forces and would appear under the category of military expenditure. All statisticsof wartime expenditures by subclassifications need Cautious handling, for similar reasons.Because of this, only intermittent statistics are given for such periods (Appendix, "Govern-ment Expenditure," 1939—45).
87
1900=100)
200
30
20 o it' C 0 't' 0 It' 0 0 It) 0 It)0 0 — C'J N) c3• It)
m a' C'•e ..- — — -.- — . r — — —
and defense expenditure
Ratio scole


ECONOMiC AJYD FUNCTIONAL CATEGORIESover one-quarter of government expenditure in the interwar years, fallingagain in the 1930's after the important conversion operations in 1932and 1934. Despite World War II, the percentage fell in the post-1945period. These changes reflect the greater efficiency of war finance duringWorld War II, and they illustrate once again why war-related expendi-ture is not sufficient to account for the displacement effect.2° They alsohelp account for the greater relative importance of transfer payments inthat displacement effect over the period of World War I.
The only remaining category of significance covers economic services.Expenditure per head in real terms for this category rose five timesbetween 1890 and 1955. Apart from periods of war, when such serviceswere reduced, and during immediate postwar periods, when reconstruc-tion was just beginning, the percentage of total government expenditureon such services varied very little, falling slightly over the whole periodunder review.
Next to be considered is the relation between expenditures classifiedby economic and by functional categories. Tables 7 and 8 give moneyand real per capita expenditures by both categories. Table 9 showsfunctional categories as a proportion of GNP. We find that the growthof social services is even more marked in the case of capital as distinctfrom current expenditure. In 1900, the capital expenditure on socialservices was about 15 per cent of total government gross capital formation.In 1928, it averaged 50 per cent, and reached about 67 per cent in 1955.Capital expenditure for military purposes and for economic servicesbecame relatively much less important; in the case of military and defensespending, gross capital formation fell from 32 per cent of governmentgross fixed capital formation in 1900 to around 9 per cent after WorldWar II. The economic services were the most important category so faras government capital investment was concerned at the turn of thecentury, but by 1955 they had given way to the social services, theirshare in government gross fixed capital formation having fallen fromabout 39 per cent to 11 per cent over the period.
In the case of transfer expenditures and subsidies, only social servicesand debt interest payments are of major importance. Debt interestpayments were more than half of total transfer payments in 1900, butless than one-third in 1955, while social services paid out around 40 percent of all transfers at the turn of the century but more than half thetotal in 1955. We have here the explanation of the secular behavior ofexpenditures on goods and services and on transfers which we describedearlier. The decline of transfers for debt interest has been offset by thegrowth in transfer expenditures on social services, so that the share of
20 See R. S. Sayers, Financial Policy, 1939—45, London, 1956, Chaptcr I.
89
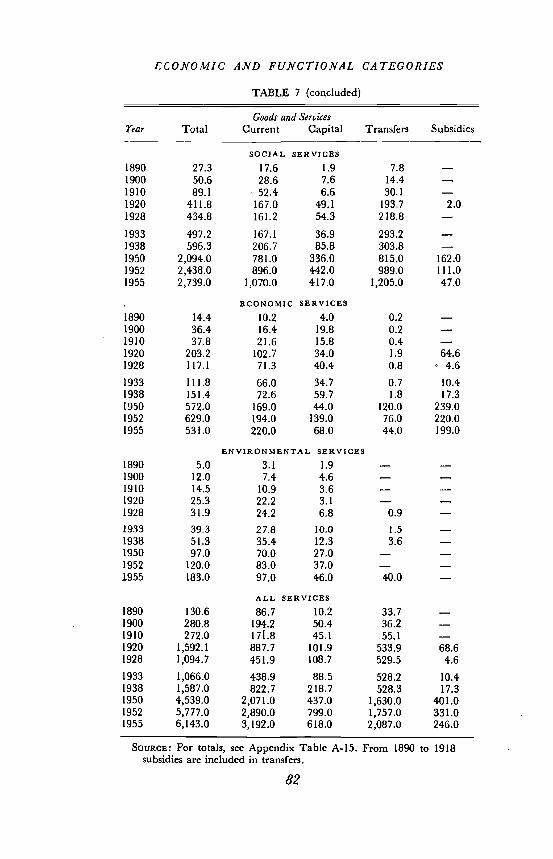
—I..
'..

ECONOMIC AND FUNCTIONAL CATEGORIEScharacteristics of change. Now this final analysis (of functional andeconomic categories together) takes us one step further. Complex asthe final picture is, it yet points clearly enough toward two kinds ofexpenditures, which by their magnitude and evolution must have beenof fundamental importance in displacement.
The first of these is war-related and military and defense spending. Itwas shown in Chapter 4 while such spending may be an importantelement in displacement (as e.g., debt interest undoubtedly was overthe period of World War I), it cannot alone provide a complete ex-planation of the phenomenon. Examining the nature of military anddefense expenditure in a little more detail will be useful here, however,as a means of illustrating the complications that lie behind the simplestatistics of expenditure growth. At the beginning of the period underreview, aircraft had not been invented; and during World War I, theywere lightly built structures made of wooden frames powered by enginesof some forty horsepower. That the airplane was an offensive force to bereckoned with was not demonstrated until the Spanish Civil War, andexpenditure on the Royal Air Force first assumed importance duringthe rearmament campaign of 1936. By the end of World War II thepicture was altered, and with it the proportions of expenditure betweenthe different armed forces. Thus in 1920, 24 per cent of military expendi-ture was for the Royal Navy, 56 per cent for the Army, and 6 per centfor the Royal Air Force. In 1956 the percentages were 24, 33, and 30respectively (the remaining 13 per cent representing expenditure by theMinistry of Supply on such items as weapons research, stockpiling ofstrategic raw materials).
The second group of expenditures that the analysis shows to warrantfurther study is social services. The wartime displacements in socialservice expenditures can be clearly seen in the statistics already given;not much more than 4 per cent of GNP up to World War I, social servicespending accounted for at least one-twelfth of community output everyyear until World War II, and after that war experienced another upwardshift, to take around one-sixth of GNP in the 1950's. The character ofthis change can be seen in greater detail by considering Table 10, whichgives social service expenditures by types from 1920 on, together with theinferences already drawn from the statistics in the earlier section of thischapter about the period before 1920. The great increase after WorldWar I must have been due in part to the considerable extension of socialbenefits of a "cash transfer" character (i.e., health and unemploymentbenefits), so that in 1920 we find insurance and assistance accounting formore than one-half of all social service expenditures. This proportion fellgradually up to the Great Depression, when the stimulation of these socialtransfer payments and the coincident checking or reduction in other
91

ECONOMIC AND FUNCTIONAL CATEGORIES
TABLE 10
GOVERNMENT EXPENDITURE ON SOCIAL SERVICES, BY TYPE,AT CURRENT PRICES, 1920—55
(millions of pounds)
SocialInsurance
and FoodYear Education Health Assistance Housing Subsidies Total
1920 97.4 48.8 212.8 52.8 411.81921 106.8 55.8 227.2 100.9 490.71922 97.3 54.1 206.1 65.7 423.21923 91.4 52.2 183.2 31.9 358.71924 92.7 54.0 182.6 35.7 365.0
1925 97.1 56.7 185.7 49.8 389.31926 99.4 62.4 194.9 67.7 424.41927 101.9 67.1 190.3 76.7 436.01928 104.8 66.4 202.5 60.6 434.31929 108.0 69.0 207.5 53.5 438.0
1930 113.4 71.9 247.9 51.5 484.71931 115.7 74.3 272.8 54.0 516.81932 110.2 74.5 278.9 47.5 511.11933 107.5 75.2 268.7 45.8 497.21934 111.0 75.7 266.4 45.2 498.3
1935 118.3 78.8 271.4 50.7 519.21936 125.2 83.3 264.9 59.3 532.71937 131.8 90.1 262.1 70.5 554.51938 138.9 98.9 278.2 80.3 596.3
1950 440.0 478.0 674.0 340.0 162.0 2,094.01951 497.0 497.0 707.0 368.0 165.0 2,234.01952 552.0 510.0 825.0 440.0 111.0 2,438.01953 581.0 524.0 916.0 496.0 71.0 2,588.01954 621.0 542.0 923.0 472.0 53.0 2,611.01955 675.0 582.0 1,015.0 420.0 47.0 2,739.0
social service spending produced a new increase in their relative import-ance after 1929. This change is perhaps typical of the behavior of transferand other social service payments between the wars. Their proportionswere not changing sharply as the result of new government policies or ofthe operation of permanent causes, but were affected over short periodsby the "built-in stabilizer" inherent in the social insurance schemes.Displacement over the World War II period had a different character.The post-1945 period has been marked by a relative decline in socialsecurity services to about one-third of total social service expenditure;in 1954, expenditure on unemployment benefits was almost the same
92

ECONOMIC AND FUNCTIONAL CATEGORIESin money terms as in 1938. To-day the bulk of social insurance benefitpayments represents old-age pensions; the problem of poverty in Britainhas become that of the old rather than of the unemployed or of the prolific.Inside the faster growing environmental social services, the most spec-tacular increase has been in expenditure on health. During the period1920 to 1938, expenditure on health grew at about the same rate as for allsocial services, but between 1938 and 1954 expenditure in money termsincreased nearly sixfold while that for all social services only increasedabout fourfold.
We have now discovered as much as possible by statistical methodsabout the association of the growth in British social service expendituresand the periods of war. It remains to seek a more qualitative answer tothe question that this association invites: Why should wars affect socialpolicy in such a fashion? Britain's wars since the turn of the centuryhave more and more affected all sections of the community, both byway of the demands of military service and through the removal of thefront line from foreign countries to the surrounding coast and air abovethe homeland. The conduct of war, therefore, has increasingly instituteda general inspection process for the whole population and economy,which has revealed much about social conditions. It has taken thecatastrophe of war to bring home to those in power that economic pro-gress does not automatically disseminate the benefits of education andhealth. As Titmuss has recalled, it was after the Battle of Waterloo in1815 that Lord Brougham's committee was set up to consider "theEducatiofl of the Lower Orders."21 The Crimean War of 1855—57 didmuch to improve conditions within the military services, but it was theBoer War of 1899—1902 that drew attention to the physical condition ofthe civilian population through medical reports on servicemen. Ofcourse, investigators like Charles Booth, the Webbs, and later SeebohmRowntree had quite independently confirmed these conditions, andAbramovitz and Eliasberg, in the companion volume on British govern-ment employment, have stressed the role of social statistics in drawingattention to social conditions. 22 But it has required major wars to stimulatepublic opinion and obtain general consent to the extension of socialpolicy.
The evolution of public social services was again accelerated by theevents of World War I; as we have seen, its conclusion brought a muchwider scope of unemployment benefits and health insurance, the develop-ment of subsidized housing schemes with the Housing Act of 1919, andthe extension of public elementary education. It is also noteworthy that
21 Richard M. Titmuss, "Problems of Social Policy," History of the Second World War,U.K. Civil Series, No. 1, London, 1950, p. 507.
22 See Abramovitz and Eliasberg, op. cii., pp. 30—3 1.
93

ECOXOMIC AXD FUNCTIOXAL CATEGORiESgovernments had become much more willing after World War I tocommit their successors, by the introduction of social benefits which werepayable as a right but which were to a considerable degree a charge onthe Exchequer, and of housing subsidies—those "intractable items inthe national expenditure,"23 which, even if the service were to be dis-continued at any time, would still require liquidation over many years.Despite warnings about growing expenditures from a succession ofParliamentary committees, notably the Geddes Committee of 1921 andthe May Committee, the view that social services had a positive contribu-tion to make to economic progress was too strong.24 The latter committeewas well aware that its suggested reduction in expenditure made in 1931would be difficult to carry Out "so heavily loaded are the dice in favourof expenditure."
Titmuss carries the story to the present day in his penetrating analysisof the growth of social services during World War II. As he shows, thesocial services during this period were an integral part of the war effort.We must look, for example, for the birth of the National Health Servicein the aftermath of the bombing of London which brought about thedevelopment of emergency state health measures on a large scale. Wemust view the plans for reconstruction after the war, especially thefamous Beveridge Plan, as a real part of the war effort.26 Also, as ourstatistics have led us to expect, the emphasis and interest in this lastperiod of displacement shifted away from the simple amelioration ofpoverty toward that provision of specific services in kind that constitutean important part of what is to-day popularly called the Welfare State.
We have shown the importance of the displacement effect to anyexplanation of the growth of British public expenditures, and we havenow shown the importance of war-related and social service expendituresto the explanation of displacement. It would be tempting to concludethat, war-related expenditures apart, the wartime displacements have
23 The words of the May Committee on National Expenditure, Command Paper 3920,1931, p. 10.
24 There was strong support for this view among Labour supporters in public life.Particularly noteworthy is Dalton's Principles of Public Finance (the first edition appearedin 1922), which criticized the negative attitude of previous British writers to publicexpenditure. His views have their counterpart in the minority report to the May Com-mittee written by two Labour supporters, Mr. Pugh and Mr. (later Lord) Latham, whoargued that the "growth in social services is a natural corollary to the development ofindustry and commerce and it cannot be denied that these have profited materially fromservices narrowly regarded as amenities, and it is not an overstatement of the case tosay that improved health and sanitation, better education, wider and cleaner roads,quicker communications and even open spaces and playing fields are essential to modernlarge-scale industry," Command Paper 3920, 1931, p. 226.
25Titmuss, op. Cit., Chapter XXV, passim.26 On this point, see also W. K. Hancock and M. M. Gowing, "British War Economy,"
History of the Second World War, Civil Series, No. 1, London, 1949, Chapter XIX.
94
ECONOMIC AND FUNCTIONAL CATEGORIESbeen caused by the influence of wars upon social policy. Such a con-clusion would be dangerous, in that we do not know what the level ofspending on social services would have been had the wars not occurred.Further, we know of no statistical techniques that might throw furtherlight on such a question. It is obviously very difficult to trace a particularsocial policy change to its exact time of origin. We have tried to makeclear our belief that we should be on very shaky ground if we ascribedany new social service introduced after a war purely to circumstancesoccurring during that war. Moreover, there is a difficulty in definingwhat precisely is meant by a "new" service. In terms of organization theNational Health Service was an innovation introduced after World WarII, but it nevertheless embraces a variety of services and duties that werepart of the public sector long before it existed. Yet again, after thewars the jump in social services expenditure often took the form, as inunemployment benefits after World War I and sickness benefits afterWorld War II, of an increase in the scope and standard of service. Howgreat an expansion of existing services should one take to constitutea new activity? In these circumstances, we cannot hope to carry ourstatistical analysis further by an extension of the method used earlierto eliminate war-related expenditures. We do not know what to eliminateas being in some sense the consequence of war, and what to retain as dueto other causes. This is a difficulty that bedevils all attempts to reachprecise conclusions about cause and effect in economic life when the"universe" under consideration involves the entire economy and thequestions to be answered are concerned with "what might have been."
We shall be content, therefore, with a more limited conclusion. Itwould be difficult to deny that the climate of opinion during the twentiethcentury has been increasingly favorable to the extension of public andsocial services. But it would be equally foolish, in the light of our statistics,to ignore the influence of war in actually stimulating changes both inideas and in actual policies. We would hope that our hypothesis ofdisplacement, by bringing these two influences together, has helped usto illuminate the nature of expenditure growth as a whole and the roleof the social services therein, and in doing so has directed attention tosome neglected aspects of British fiscal history.
95