Embed Size (px)
Citation preview

Governance, Risk, and Compliance TechnologyMARKET UPDATE | Q4 2020

Tim MacholzVice President, [email protected]
GRC Market Update–Q4 2020Dear Clients and Friends,
Houlihan Lokey is pleased to present its Governance, Risk, and Compliance (GRC) Technology Update for Q4 2020. We hope that you and your families remain safe and healthy. We have continued adapting to this fluid market and are busy helping our clients navigate financing, M&A, and other strategic alternatives. Please reach out to any of us if you would like to connect or brainstorm regarding any current needs or sector topics.
We have included industry insights, select recent transaction announcements, and a public markets overview to help you stay ahead in our dynamic industry. We hope you find this update to be informative and that it serves as a valuable resource to you in staying abreast of the market.
We hope you enjoy this report, and please reach out if you have any questions. We look forward to staying in touch.
Regards,
Rob LouvManaging Director, TMT
Group Co-Head
Andrew AdamsManaging Director, D&A
Group Head
[email protected]+44 (0) 20 7907 4242
Julian MooreManaging Director, D&A
[email protected]+44 (0) 20 7907 4219
Additional GRC Technology Team Contacts
GRC Technology Subsectors Covered
William EideDirector, [email protected]
Tara CarterManaging Director, D&A
[email protected]+44 (0) 20 7907 4215
Craig MuirManaging Director, D&A
Chin PandyaDirector,
Business Services
2
Broad GRC Suite
Compliance Reporting
Cyber and Privacy
Employee Risk
Technology Risk
Operations Risk
VendorRisk
VerticalSpecific

Governance, risk, and compliance technology enables the simplification, automation, and integration of enterprise, operational, and IT risk management processes and data.
GRC is a broad market that encompasses different segments, including compliance and reporting, cyber and privacy, employee, technology, operations risk, vendor risk, and vertical-specific applications.
By integrating GRC solutions and management practices, companies can create effective risk management programs that align with their strategic business direction.
Governance, Risk, and Compliance–Market Snapshot
Market Drivers
3
Market Overview
Global GRC Software Market Size and Growth
Sources: IndustryARC, 451 Research, and Gartner.
Interoperability/ Integrations
Growing demand for an integrated
GRC system to work alongside
ERM and performance
management systems
Data and AnalyticsIncreased volumes of complex
data around compliance requiring
single-repository management
DigitalizationNecessitates software that can
manage and protect business data
while providing key integration and
access points
Regulatory EnvironmentGrowing dependence on internal
audit features as increased
regulation drives demand to
regulate and control business data
Third-Party Risk Management
Need for third-party risk
management to be well
coordinated
Comprehensive Application
Growing need for comprehensive
GRC applications that reflect a
mature development path
MobileGrowing mobile dependence
demands DLP solutions to monitor
and protect sensitive content on
mobile devices
IT Financial ManagementGrowing adoption of robust IT
financial management systems to
provide transparent IT cost data
and analytics
$28.8$32.4
$36.6$41.3
$46.5$52.5
2020 2021 2022 2023 2024 2025
($ in billions)

GRC Solutions Span Horizontally Across an Organization
4
Applications leveraged by legal and
across the organization to manage
vendor portfolios and assess
possible vendor business disruptions
Vendor Risk
Applications leveraged by
operations to prevent losses caused
by human behavior and inconsistent
processes
Operations Risk
Applications leveraged by legal and
compliance to determine whether
businesses are aligned with laws,
regulations, and organizational
policies
Compliance Reporting
Applications leveraged by IT to
prevent an employee’s identity from
being compromised and to prevent
fraud
Technology Risk
Applications leveraged by IT to
monitor an organization’s cyber and
data privacy vulnerabilities
Cyber and Privacy
Applications leveraged by human
resources and compliance to
assess health, safety, environmental,
and other regulatory risks in relation
to employees
Employee Risk

Announce Date
February 4, 2019
Enterprise Value ($M)
$100
Description Galvanize took the next step in its industry consolidation strategy with the acquisition of Rsam, a recognized leader in IT, vendor, and security risk management solutions. This acquisition combines the strengths of Galvanize in delivering audit, compliance, and fraud related solutions with those of Rsam in delivering vendor risk, IT risk, and cybersecurity solutions to enterprise IT and security customers.
Announce Date
September 2, 2020
Enterprise Value ($M)
$185
Description Oversight, the global leader in spend management technology with an AI-powered platform, digitally transforms audit and risk mitigation processes for enterprise organizations, finding risk across systems and spend channels. Oversight continuously monitors and analyzes corporate card and vendor transactions, quickly identifying fraud, errors, and wasteful spend to improve financial and compliance outcomes.
Announce Date
January 23, 2020
Enterprise Value ($M)
$700
Description The transaction deepens Moody’s information portfolio and analytical capabilities by adding RDC’s unique governance, risk, and compliance and related BI analytics SaaS to enable financial institutions to prevent money laundering, bribery, and other financial crimes. It will also extend RDC’s global presence to a broader group of financial institutions, corporations, insurance companies, and government agencies served by Moody’s Analytics.
Announce Date
November 19, 2020
Enterprise Value ($M)
$2,750
Description The transaction combines Verafin’s comprehensive suite of anti-financial crime management products with Nasdaq’s reach and established regulatory technology leadership to create a global SaaS leader in the fight against financial crime, a worldwide problem that demands innovative actionusing machine learning and big-data analytics.
Transaction SpotlightsNasdaq Acquisition of VerafinMoody’s Acquisition of RDC
Galvanize Acquisition of Rsam
5
TCV Acquisition of Oversight
Source: 451 Group.

Steady GRC M&A volume over the past 10 years, with a significant increase seen in 2019 and 2020
Consolidation of mature GRC technology companies driving higher aggregate deal value YTD
Date Acquirer Target EV ($M)
11/19/2020 $2,750
07/08/2020 $41
04/28/2020 $145
01/23/2020 $700
01/28/2019 $250
08/22/2019 $2,100
05/27/2019 $58
04/11/2019 $350
12/10/2018 $95
11/02/2017 $565
Select Strategic M&A Activity
Significant Acceleration in Recent Consolidation of GRC Technology Market
6Source: 451 Group.
GRC Technology Strategic M&A Summary (2011–2020 YTD)
$2,349 $2,132
$5,637 $5,485
$8,422
$1,476 $1,757
$4,850
$5,946
$7,692
5662
4655
4842
28
38
71
93
2011 2012 2013 2014 2015 2016 2017 2018 2019 2020(YTD)
Deal Value Deal Volume
Private Equity Sponsors Have Responded by Prioritizing GRC Technology Investment
7Source: 451 Group.
Date Acquirer Target EV ($M)
11/10/2020 $135
09/02/2020 $185
01/06/2020 $1,300
09/29/2019 $218
08/06/2019 $100
08/02/2019 $30
09/12/2018 $30
07/17/2018 $1,400
07/27/2017 $72
02/14/2016 $624
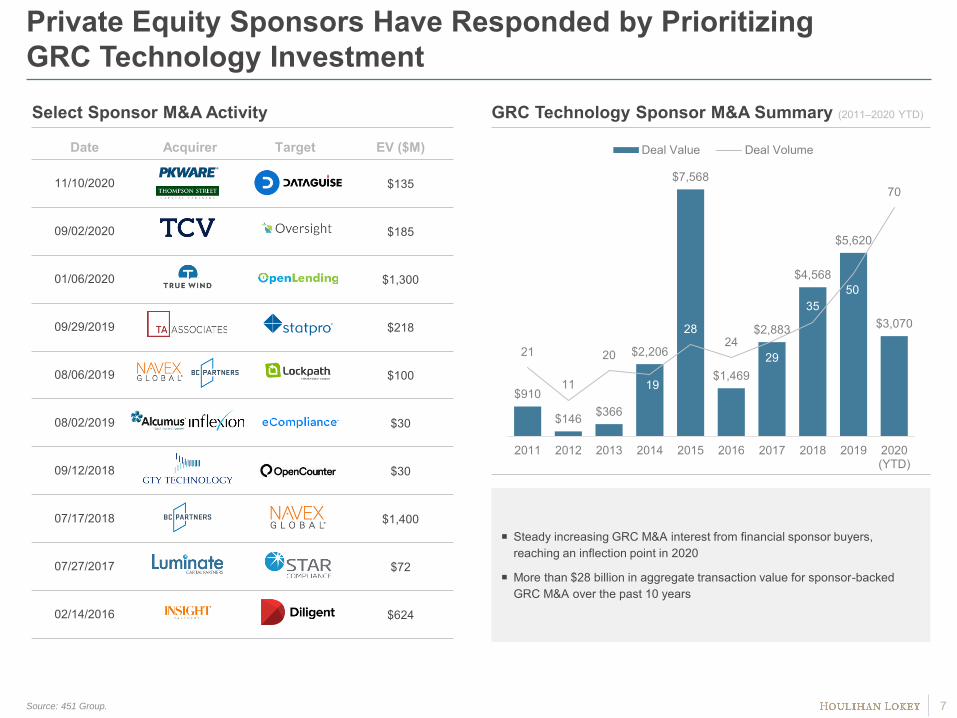
Select Sponsor M&A Activity
Steady increasing GRC M&A interest from financial sponsor buyers, reaching an inflection point in 2020
More than $28 billion in aggregate transaction value for sponsor-backed GRC M&A over the past 10 years
GRC Technology Sponsor M&A Summary (2011–2020 YTD)
$910
$146 $366
$2,206
$7,568
$1,469
$2,883
$4,568
$5,620
$3,070
21
11
20
19
2824
29
3550
70
2011 2012 2013 2014 2015 2016 2017 2018 2019 2020(YTD)
Deal Value Deal Volume

Private Investors Look to Capitalize on GRC Technology M&A Activity
8Source: Pitchbook.com.
Date Company Round Deal Size ($M)
01/15/2021 Series A $18
03/12/2020 Series F $113
02/19/2020 Later Stage VC $9
11/04/2019 Series B $19
09/13/2019 Later Stage VC $90
07/24/2019 Series D $200
01/31/2019 Series A $12
11/17/2017 IPO $240
02/07/2017 Series A $56
11/17/2016 Series C $60
Select Capital Raise ActivityGRC Technology Capital Raise Summary (2011–2020 YTD)
We have seen a significant increase in GRC software investment and deal volume over the past four years
$85
$193 $146 $143
$244 $254
$624 $673 $653
$617
26
29
46
34
63 64
102109
99
82
2011 2012 2013 2014 2015 2016 2017 2018 2019 2020(YTD)
Deal Count Deal Volume

GRC Has Outperformed the Broader MarketYTD Share Price Performance
YTD Multiple Performance
Source: S&P Capital IQ as of December 20, 2020.
Note: GRC is market-cap-weighted and compiled by Houlihan Lokey internally. 9
3.0x
7.6x
15.2%
36.2%
Public markets recovered to above pre-COVID-19 levels, while the Governance, Risk, and Compliance index has returned ~21% more than the broader market.
Governance, Risk, and Compliance players have experienced market tailwinds resulting in premium revenue multiples as compared to the broader market.
0.0x1.0x2.0x3.0x4.0x5.0x6.0x7.0x8.0x9.0x
Jan2020
Feb2020
Mar2020
Apr2020
May2020
Jun2020
Jul2020
Aug2020
Sep2020
Oct2020
Nov2020
Dec2020
S&P 500 GRC Index
(40.0%)(30.0%)(20.0%)(10.0%)
0.0%10.0%20.0%30.0%40.0%
Jan2020
Feb2020
Mar2020
Apr2020
May2020
Jun2020
Jul2020
Aug2020
Sep2020
Oct2020
Nov2020
Dec2020
S&P 500 GRC Index

Public Comparable Companies–Trading Metrics
10Note: Trading multiples are based on share price, other market data, and broker consensus future earnings estimates from S&P Capital IQ as of December 20, 2020.
Note: Stock price last updated on 12/20/20
NM in EBITDA Margin if EBITDA is negative
NA means information is not available or not applicable
Source: Capital IQ
EV / Revenue EV / EBITDA
Company Name Stock Price 52-wk High
% of 52-wk High Cash & ST Inv
Equity Mkt Cap
Enterprise Value CY 2019A CY 2020E CY 2021E CY 2019A CY 2020E CY 2021E
Oracle $65.06 $65.34 99.6% $38,610.00 $205,442.82 $224,546.85 5.7x 5.7x 5.5x 13.9x 11.6x 11.1x
ServiceNow 565.4 566.7 99.8% 2,951.6 114,101.8 109,538.6 31.7 24.5 19.6 NM NM NM
Thomas Reuters 80.8 90.5 89.3% 1,702.0 40,294.0 42,607.5 7.2 7.1 6.8 38.9 22.0 20.8
Verisk Analytics 204.5 206.8 98.9% 225.5 33,879.6 36,457.9 14.0 13.1 12.3 34.6 26.0 24.8
Wolters Kluw er 84.8 95.7 88.7% 1,100.6 22,847.2 25,090.9 4.8 4.4 4.3 17.1 15.0 14.6
Clarivate 30.7 33.6 91.6% 601.1 10,858.8 20,049.0 20.6 15.7 11.1 NM 41.1 24.8
Broadridge Financial 153.9 154.2 99.8% 357.0 18,015.5 19,520.0 4.5 4.2 4.1 22.9 18.4 17.5
SailPoint 55.6 57.9 95.9% 483.7 5,006.5 4,929.0 17.1 13.8 12.4 NM NM NM
Workiva 88.5 91.8 96.4% 523.9 4,240.8 4,068.6 13.7 11.7 10.1 NM NM NM
GB Group 12.3 13.3 92.6% 41.7 2,423.8 2,407.5 9.6 8.9 8.4 NM 36.9 35.0
Ideagen 3.2 3.3 97.1% 10.4 704.6 829.5 11.5 10.1 9.1 NM 29.2 25.9
Top Quartile $37,087 $39,533 15.5x 13.5x 11.7x 34.6x 31.1x 25.1x
Mean 41,620 44,550 12.8 10.8 9.4 25.5 25.0 21.8
Median 18,016 20,049 11.5 10.1 9.1 22.9 24.0 22.8
1st Quartile 4,624 4,499 6.4 6.4 6.2 17.1 17.6 16.8
Thomson Reuters

Public Comparable Companies–Trading Metrics (cont.)
11Note: Trading multiples are based on share price, other market data, and broker consensus future earnings estimates from S&P Capital IQ as of December 20, 2020.
Note: Stock price last updated on 12/20/20
NM in EBITDA Margin if EBITDA is negative
NA means information is not available or not applicable
Source: Capital IQ
Revenue EBITDA Revenue Growth EBITDA Margin
Company Name Stock PriceEquity Mkt
CapEnterprise
Value CY 2019A CY 2020E CY 2021E CY 2019A CY 2020E CY 2021E 2018-2019A 2019-2020E 2020-2021E CY 2019A CY 2020E CY 2021E
Oracle 65.06 205,443 224,547 39,583 39,389 40,611 16,174 19,433 20,295 0.3% NM 3.1% 40.9% 49.3% 50.0%
ServiceNow 565.43 114,102 109,539 3,460 4,477 5,589 294 1,417 1,726 32.6% 29.4% 24.8% 8.5% 31.7% 30.9%
Thomas Reuters 80.83 40,294 42,607 5,906 5,981 6,221 1,094 1,935 2,048 7.4% 1.3% 4.0% 18.5% 32.4% 32.9%
Verisk Analytics 204.47 33,880 36,458 2,607 2,788 2,969 1,055 1,402 1,469 8.9% 6.9% 6.5% 40.5% 50.3% 49.5%
Wolters Kluw er 84.82 22,847 25,091 5,176 5,687 5,769 1,466 1,673 1,715 6.1% 9.9% 1.5% 28.3% 29.4% 29.7%
Clarivate 30.72 10,859 20,049 974 1,274 1,806 213 488 809 0.6% 30.8% 41.7% 21.8% 38.3% 44.8%
Broadridge Financial 153.88 18,016 19,520 4,353 4,649 4,800 854 1,060 1,117 0.8% 6.8% 3.3% 19.6% 22.8% 23.3%
SailPoint 55.57 5,006 4,929 289 356 399 9 33 17 15.9% 23.5% 12.0% 3.1% 9.2% 4.2%
Workiva 88.52 4,241 4,069 298 348 402 (42) 8 (1) 21.9% 16.9% 15.6% NM 2.2% NM
GB Group 12.27 2,424 2,408 251 272 288 47 65 69 46.3% 8.3% 6.1% 18.9% 24.0% 23.8%
Ideagen 3.16 705 830 72 82 91 12 28 32 27.0% 13.6% 11.0% 17.2% 34.6% 35.2%
Top Quartile $37,087 $39,533 $4,764 $5,168 $5,679 $1,074 $1,545 $1,721 24.5% 21.8% 13.8% 26.7% 36.4% 42.4%
Mean 41,620 44,550 5,724 5,937 6,268 1,925 2,504 2,663 15.3% 14.7% 11.8% 21.7% 29.5% 32.4%
Median 18,016 20,049 2,607 2,788 2,969 294 1,060 1,117 8.9% 11.7% 6.5% 19.3% 31.7% 31.9%
1st Quartile 4,624 4,499 293 352 401 30 49 50 3.5% 7.3% 3.6% 17.5% 23.4% 25.3%
Thomson Reuters

Our Team Has Proven Expertise in GRC Technology
12Selected transactions were executed by Houlihan Lokey professionals while at other firms acquired by Houlihan Lokey or by professionals from a Houlihan Lokey joint venture company.
Tombstones included herein represent transactions closed from 2016 forward.
We have unparalleled transaction experience with GRC technology and services.
AI/Analytics IP Management
Bankruptcy Software
I-9 Compliance Regulatory Risk Management
Legal Data Solutions
Diversified Legal Software
Diversified Legal Software
Legal Data Solutions Governance, Risk, and Compliance
Legal Data Solutions Diversified Financial Software
Governance, Risk, and Compliance
Governance, Risk, and Compliance
Financial SoftwarePatent Intelligence
Project CycloneIn Market
Data GovernanceBuyside Advisor
has been acquired by
Vermeg Group N.G.
Sellside Advisor*
a portfolio company of
EQT
has been acquired by
Moody’s Corporation
Sellside Advisor*
has acquired
Trucost PLC
Buyside Advisor*
has been acquired by
Sterling Talent Solutions
Sellside Advisor*
has sold its Benelux operations to
Altares BV
a portfolio company of
Naxicap
Sellside Advisor*
a portfolio company of
Pollen Street Capital
has been acquired by
Tech Mahindra
Sellside Advisor*
a subsidiary of
has been acquired by
a portfolio company of
Sellside Advisor
a portfolio company of
has been acquired by
Sellside Advisor
has been acquired by
Sellside Advisor
has been acquired by
a portfolio company of
Sellside Advisor
and
has been acquired by
a portfolio company of
Sellside Advisor
has been acquired by
TechInsights
a division of
AXIO Data Group
a portfolio company of
Electra Partners
Sellside Advisor*
has received an investment from
Growth Capital Partners
Placement Agent*
has been acquired by
Lexis Nexis Legal & Professional
a division of
RELX Group
Sellside Advisor*
has been acquired by
Broadridge
Sellside Advisor*
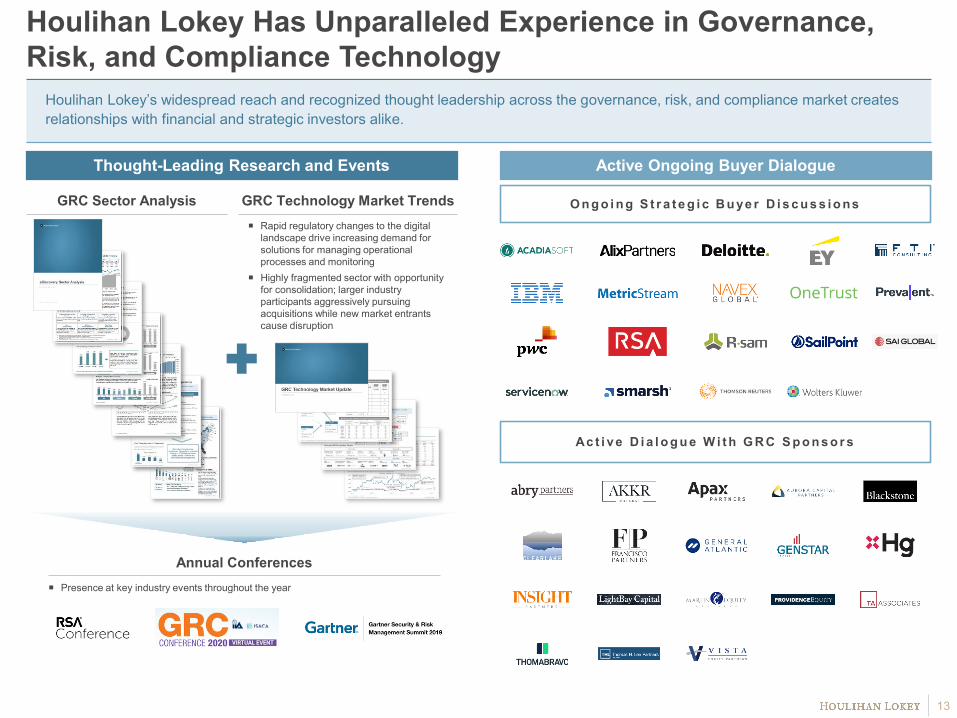
Houlihan Lokey’s widespread reach and recognized thought leadership across the governance, risk, and compliance market creates relationships with financial and strategic investors alike.
Houlihan Lokey Has Unparalleled Experience in Governance, Risk, and Compliance Technology
Thought-Leading Research and Events
GRC Sector Analysis GRC Technology Market Trends Rapid regulatory changes to the digital
landscape drive increasing demand for solutions for managing operational processes and monitoring
Highly fragmented sector with opportunity for consolidation; larger industry participants aggressively pursuing acquisitions while new market entrants cause disruption
Active Ongoing Buyer Dialogue
Ac t i ve D i a l o g u e W i t h G R C S p o n s o r s
Annual Conferences
O n g o i n g S t r a t e g i c B u ye r D i s c u s s io ns
Presence at key industry events throughout the year
13

Corporate Finance Financial Restructuring Financial and Valuation Advisory
No. 1 U.S. M&A Advisor
Top 5 Global M&A Advisor
Leading Capital Markets Advisor
No. 1 Global M&A Fairness Opinion Advisor
1000+ Annual Valuation Engagements
No. 1 Global Restructuring Advisor
1,400+ Transactions Completed Valued at More Than $3.0 Trillion Collectively
Houlihan Lokey is the trusted advisor to more top decision-makers than any other independent global investment bank.
14
2001 to 2020 Global M&A Fairness Advisory Rankings
Advisor Deals
1 Houlihan Lokey 956
2 JP Morgan 876
3 Duff & Phelps 802
4 Morgan Stanley 599
5 BofA Securities Inc 542Refinitiv (formerly known as Thomson Reuters). Announced
or completed transactions.
2020 Global Distressed Debt & BankruptcyRestructuring Rankings
Advisor Deals
1 Houlihan Lokey 106
2 PJT Partners Inc 63
3 Lazard 50
4 Rothschild & Co 46
5 Moelis & Co 39Source: Refinitiv (formerly known as Thomson Reuters)
2020 M&A Advisory Rankings All U.S. Transactions
Advisor Deals
1 Houlihan Lokey 210
2 Goldman Sachs & Co 172
3 JP Morgan 132
4 Evercore Partners 126
5 Morgan Stanley 123Source: Refinitiv (formerly known as Thomson Reuters)

How Can Houlihan Lokey Help?
Rob LouvManaging Director andTMT Group [email protected]
GRC Technology Team
Chin PandyaDirector, Business [email protected]
Tim MacholzVice President, [email protected]
William EideDirector, [email protected]
15
Houlihan Lokey GRC Key Focus Areas Houlihan Lokey Geographic and Product Overview
North America
AtlantaBostonChicagoDallasHoustonLos Angeles
MiamiMinneapolisNew YorkSan FranciscoWashington, D.C.
Asia-Pacific
BeijingHong Kong
SingaporeSydneyTokyo
Europe and Middle East
AmsterdamDubaiFrankfurtLondon
MadridMilan Paris
1,500+ Global Employees in 23 Locations
Mergers and Acquisitions
Capital Markets
Financial Restructuring
Financial and Valuation Advisory
Private Funds AdvisoryProduct Expertise
Alex CuociAnalyst, [email protected]
Broad GRC Suite
Andrew AdamsManaging Director andD&A Group [email protected]+44 (0) 20 7907 4242
Julian MooreManaging Director,Data & [email protected]+44 (0) 20 7907 4219
Tara CarterManaging Director,Data & [email protected]+44 (0) 20 7907 4215
Craig MuirManaging Director,Data & [email protected]
Joseph MillerAssociate, [email protected]
Compliance Reporting
Cyber and Privacy
Employee Risk
Technology Risk
Operations Risk
Vendor Risk
Vertical Specific

© 2021 Houlihan Lokey. All rights reserved. This material may not be reproduced in any format by any means or redistributed without the prior written consent of Houlihan Lokey.
Houlihan Lokey is a trade name for Houlihan Lokey, Inc., and its subsidiaries and affiliates, which include those in (i) the United States: Houlihan Lokey Capital, Inc., an SEC-registered broker-dealer and member of FINRA (www.finra.org) and SIPC (www.sipc.org) (investment banking services); Houlihan Lokey Financial Advisors, Inc. (financial advisory services); HL Finance, LLC (syndicated leveraged finance platform); and Houlihan Lokey Real Estate Group, Inc. (real estate advisory services); (ii) Europe: Houlihan Lokey EMEA, LLP, and Houlihan Lokey (Corporate Finance) Limited, authorized and regulated by the U.K. Financial Conduct Authority; Houlihan Lokey (Europe) GmbH, authorized and regulated by the German Federal Financial Supervisory Authority (Bundesanstalt für Finanzdienstleistungsaufsicht); Houlihan Lokey GmbH; Houlihan Lokey S.p.A.; Houlihan Lokey (Netherlands) B.V.; Houlihan Lokey (España), S.A.; and Houlihan Lokey (Corporate Finance), S.A.; (iii) the United Arab Emirates, Dubai International Financial Centre (Dubai): Houlihan Lokey (MEA Financial Advisory) Limited, regulated by the Dubai Financial Services Authority for the provision of advising on financial products, arranging deals in investments, and arranging credit and advising on credit to professional clients only; (iv) Singapore: Houlihan Lokey (Singapore) Private Limited, an “exempt corporate finance adviser” able to provide exempt corporate finance advisory services to accredited investors only; (v) Hong Kong SAR: Houlihan Lokey (China) Limited, licensed in Hong Kong by the Securities and Futures Commission to conduct Type 1, 4, and 6 regulated activities to professional investors only; (vi) China: Houlihan Lokey Howard & Zukin Investment Consulting (Beijing) Co., Limited (financial advisory services); (vii) Japan: Houlihan Lokey K.K. (financial advisory services); and (viii) Australia: Houlihan Lokey (Australia) Pty Limited (ABN 74 601 825 227), a company incorporated in Australia and licensed by the Australian Securities and Investments Commission (AFSL number 474953) in respect of financial services provided to wholesale clients only. In the European Economic Area (EEA), Dubai, Singapore, Hong Kong, and Australia, this communication is directed to intended recipients, including actual or potential professional clients (EEA and Dubai), accredited investors (Singapore), professional investors (Hong Kong), and wholesale clients (Australia), respectively. Other persons, such as retail clients, are NOT the intended recipients of our communications or services and should not act upon this communication.
Houlihan Lokey gathers its data from sources it considers reliable; however, it does not guarantee the accuracy or completeness of the information provided within this presentation. The material presented reflects information known to the authors at the time this presentation was written, and this information is subject to change. Houlihan Lokey makes no representations or warranties, expressed or implied, regarding the accuracy of this material. The views expressed in this material accurately reflect the personal views of the authors regarding the subject securities and issuers and do not necessarily coincide with those of Houlihan Lokey. Officers, directors, and partners in the Houlihan Lokey group of companies may have positions in the securities of the companies discussed. This presentation does not constitute advice or a recommendation, offer, or solicitation with respect to the securities of any company discussed herein, is not intended to provide information upon which to base an investment decision, and should not be construed as such. Houlihan Lokey or its affiliates may from time to time provide investment banking or related services to these companies. Like all Houlihan Lokey employees, the authors of this presentation receive compensation that is affected by overall firm profitability.
16
Disclaimer

CORPORATE FINANCE
FINANCIAL RESTRUCTURING
FINANCIAL AND VALUATION ADVISORY
HL.com


![Governance, Risk and Compliance Management [GRC]](https://img.dokumen.tips/doc/110x75/547a65f05906b50c358b468b/governance-risk-and-compliance-management-grc.jpg)
