Embed Size (px)
Citation preview

Gordon: Using Flash Memory to Build Fast, Power-efficient Clusters for Data-intensive Applications
Adrian M. Caulfield, Laura M. Grupp, Steven Swanson
Department of Computer Science and Engineering University of California, San Diego
1
Data Centric Computing
• Becoming ubiquitous – Retail sales data
• 2.5PB at Wal-Mart
– Indexing billions of web pages – Social Networking
• Facebook has 175M users, 25M joined last month
– Desktop search
• Terabyte scale, parallel • I/O bound • Power
2

Data Centric Frameworks
• Several frameworks exist
– Map Reduce (Hadoop)
– Dryad
– Sawzall
• Typically run on commodity systems
– Slow disks + I/O bound
– Optimizing rest of system makes little sense
3

Server Power Breakdown
11%
26%
7%
56%
CPU Bound
Disk (Idle)
CPU (Busy)
RAM(Busy)
Overhead
22%
18%
4%
56%
Disk Bound
Disk (Busy)
CPU (Idle)
RAM (Idle)
Overhead
4

NAND Flash Memory:
A Power Efficient Storage Technology
• New on the architecture scene – Density competitive with disk
• 256GB Next Gen. NAND Flash – Low Latency
• 250x better than disk
– High Bandwidth • 900MB/s possible
– Low power • Active: 12x better than disk (1.28W) • Idle: 1% of disk idle power (0.096W)
– Density scaling at 85%/year
5
0.01
0.1
1
10
100
1990 2000 2010
Gb
its/
flas
h d
evi
ce

Gordon Design Process
• System architecture designed around a flash array per node
– Start with flash array
– Optimize the flash controller
– Select a processor based on a design space exploration
• Cluster based
– Each node runs full OS
Flash Array
Flash Ctrl
CPU CPU CPU CPU
6

Gordon Overview
• Introduction
• Flash storage systems
– Flash basics
– Optimizing flash for data centric computing
• Design space exploration
• Gordon discussion
7
Flash Array
Flash Ctrl
CPU CPU CPU CPU

NAND Flash Overview
• Data arranged in blocks
– Blocks contain pages (64 typical)
– Each page has metadata section
• Flash Idiosyncrasies
– Pages must be programmed in order
– Read/Write and Erase size disparity
• Pages are smallest read/write unit
• Erases only at block level
– Blocks wear out
• Wear leveling required
Extra metadata space at end of each page
8

Flash Translation Layer (FTL)
Page 3 Page 1 Page 5 Page 7 Page 0 Page 6
Page 10 Page 9
LBA Map (SDRAM)
Flash Array
Read LBA 3
• Based on design from Microsoft Research [Birrel, 2007] • Maps a Logical Block Address (LBA) to a Physical Address • Map stored in SDRAM
– Reconstructed from Metadata section of pages on power-up
9
LBA 0 LBA 1 LBA 2 LBA 3 LBA 4 LBA 5 LBA 6 LBA 7

The Write Point
Block 3 Block 4
LBA 5
LBA 3
LBA 6
LBA 5
LBA 4
Sequence Number: 101 Sequence Number: 102 Map
Blk 3, Pg 1 Blk 3, Pg 9 Blk 3, Pg 0 Blk 3, Pg 2 Blk 3, Pg 3
10
LBA 0 LBA 1 LBA 2 LBA 3 LBA 4 LBA 5 LBA 6 LBA 7

Gordon Overview
• Introduction
• Flash storage systems
– Flash basics
– Optimizing flash for data centric computing
• Design space exploration
• Gordon discussion
11
Flash Array
Flash Ctrl
CPU CPU CPU CPU

Gordon FTL Enhancements
• Exploit parallelism in flash array
– Tuning architecturally visible block size
– Multiple write points
• Access pattern optimizations
– Write combining
– Bypassing
12

Super Pages
• Stripe data across several chips and/or busses • Handle larger units of data • Reduces metadata overhead
Bus 0 Bus 1 Bus 2
Horizontal
Vertical
2-D
13

Multiple Write Points
Block 3 Sequence Number 101
Block 4 Sequence Number 102
LBA 5
LBA 5
LBA 7
LBA 5
Map
Blk 3, Pg 0
Blk 4, Pg 0
Blk 3, Pg 1 Blk 4, Pg 1
14
LBA 0 LBA 1 LBA 2 LBA 3 LBA 4 LBA 5 LBA 6 LBA 7
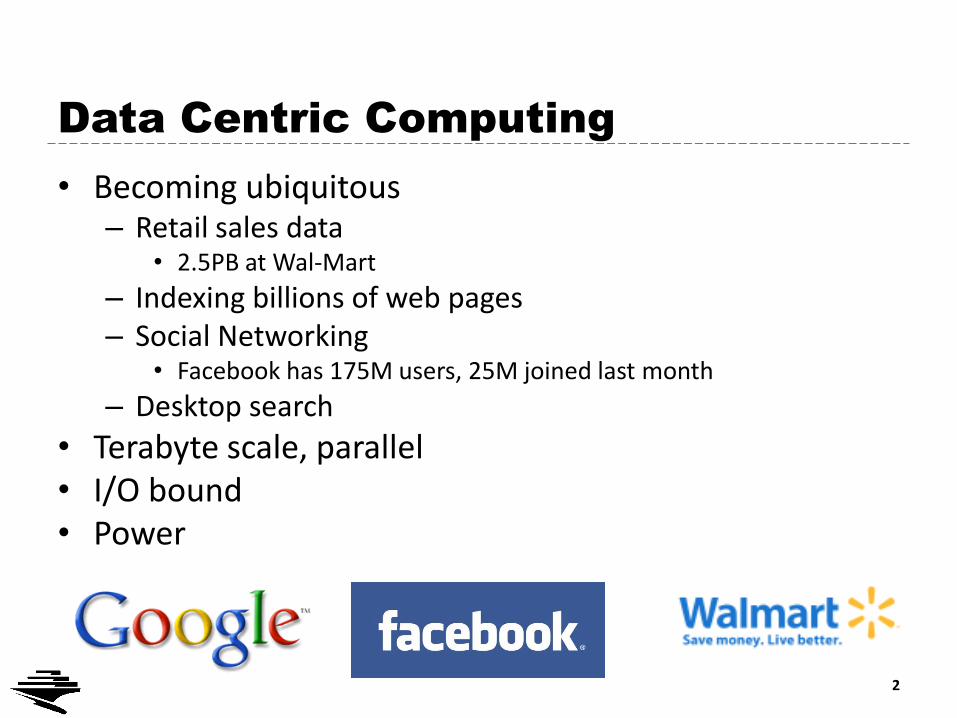
Workload Details
Name Description Size Disk Read Disk Write
Random Writer
Output random data 10GB 0.4 GB 26.9 GB
Identity Copy all inputs to outputs 15GB 45.1 GB 103.7 GB
Sort Sort random numbers 1GB 1.4 GB 5.7 GB
SimpleGrep Search for “the” in multi-lingual text
8GB 8.4 GB 0.5 GB
ComplexGrep Complex Regex search in multi-lingual text
8GB 9.2 GB 1.0 GB
N-Gram Find frequently occurring N-word phrases in multi-lingual text
4GB 40.1 GB 90.7 GB
WebIndex Indexing of web pages 13GB 18.9 GB 62.8 GB
15

0
1
2
3
4
5
6
7
8 16 32 64 128 256
Ban
dw
idth
Re
l. t
o 8
kB S
up
er
Pag
e
Page Size (kB)
average
randomWriter
sort
index
identity
ngram
simplegrep
complexgrep
Super Page Performance
16

Write Combining and Bypassing
• Write Combining
– Merge multiple writes to the same address when possible
• Bypassing
– Merge incoming read requests
– Cache last page read
17

0
1
2
3
4
5
6
7
8 16 32 64 128 256
Ban
dw
idth
Re
l . 8
kB S
up
er
Pag
e w
/o
Wri
te C
om
bin
ing
or
Byp
assi
ng
Page Size (kB)
average
randomWriter
sort
index
identity
ngram
simplegrep
complexgrep
Super Page Results
With Write Combining and Bypassing
18

Gordon Overview
• Introduction
• Flash Storage Systems
• Design Space Exploration
– Design Space
– Methodology
– Results
• Gordon Discussion
19
Flash Array
Flash Ctrl
CPU CPU CPU CPU

Design Space
• 84 designs
• 32 node cluster
Parameter Values
Processor Types Atom, Core 2
Processors 1, 2, 4
Atom Frequency (GHz) 0.8, 1.5, 1.9
Core 2 Frequency (GHz) 0.6, 1.2, 1.8, 2.4
Flash dies 0, 64
Hard drives 0, 1, 2, 4
Power Budget 300W
20
Methodology
• Trace Based Simulator
– Instruction count
– L2 miss count
– Network read/write usage
– Disk read/write usage, I/O count
• Traces processed using our cluster simulator
21

Gordon Cluster Simulator
• Calculates both Power and Performance
– Performance reported as total runtime
– Storage times simulated using our flash simulator and DiskSim
• Power model
– Estimate average power for a given trace slice using activity ratios
22
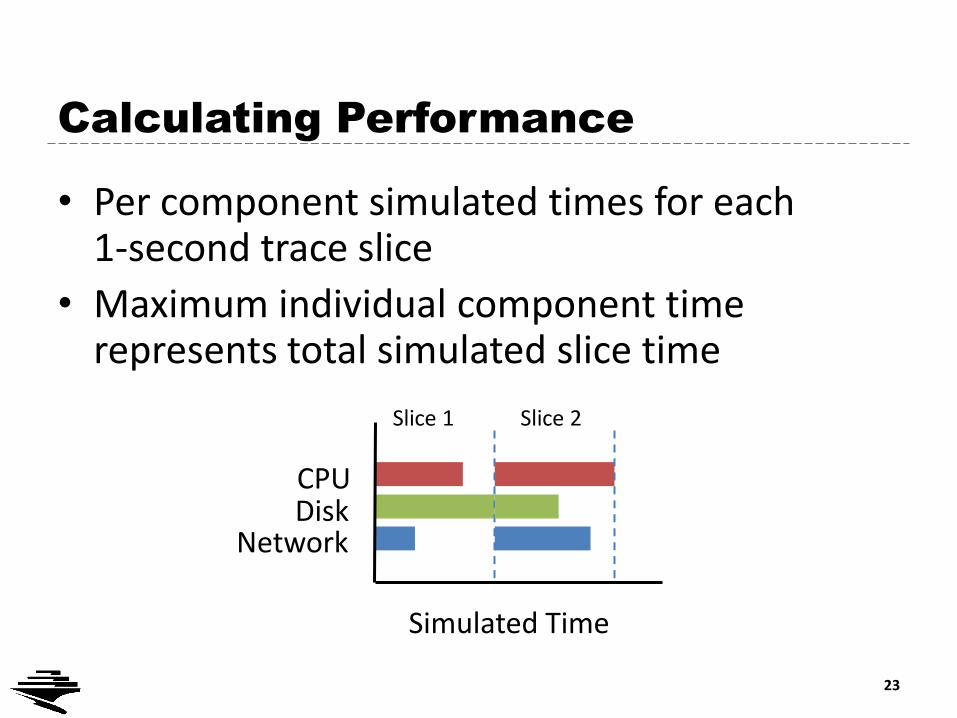
Calculating Performance
Disk
Simulated Time
CPU
Network
• Per component simulated times for each 1-second trace slice
• Maximum individual component time represents total simulated slice time
Slice 1 Slice 2
23

Power Model
• Calculate per second component activity factors – DRAM: L2 cache misses
– CPU: Instruction count
– Flash/Disk: Number of IO requests
•
• Active and Idle power measured on actual servers – Datasheet numbers when not possible
• CPU power scaled based on datasheet voltage range for different CPU frequencies
24
)%(% IdleActiveTotal PIdlePActiveP
2fvP
Gordon Overview
• Introduction
• Flash Storage Systems
• Design Space Exploration
– Design Space
– Methodology
– Results
• Gordon Discussion
25

0
0.2
0.4
0.6
0.8
1
1.2
1.4
1.6
0 2 4 6 8 10 12 14 16
Rel
ativ
e En
ergy
Relative Run Time Atom-Disk Atom-Flash Core 2-Disk Core 2-Flash
0
0.2
0.4
0.6
0.8
1
1.2
1.4
1.6
0 2 4 6 8 10 12 14 16
Rel
ativ
e En
ergy
Relative Run Time Atom-Disk Atom-Flash Core 2-Disk Core 2-Flash
0
0.2
0.4
0.6
0.8
1
1.2
1.4
1.6
0 2 4 6 8 10 12 14 16
Rel
ativ
e En
ergy
Relative Run Time Atom-Disk Atom-Flash Core 2-Disk Core 2-Flash
0
0.2
0.4
0.6
0.8
1
1.2
1.4
1.6
0 2 4 6 8 10 12 14 16
Rel
ativ
e En
ergy
Relative Run Time Atom-Disk Atom-Flash Core 2-Disk Core 2-Flash
0
0.2
0.4
0.6
0.8
1
1.2
1.4
1.6
0 2 4 6 8 10 12 14 16
Rel
ativ
e En
ergy
Relative Run Time Atom-Disk Atom-Flash Core 2-Disk Core 2-Flash
Design Space Survey Results
Pareto Optimal Design 26

Pareto Optimal Designs
Processor Average Power Number of Cores Type Frequency
1x Atom 1.9 GHz 4.81 W
1x Core 2 2.4 GHz 19.89 W
2x Core 2 2.4 GHz 45.66 W
4x Core 2 1.8 GHz 92.74 W
4x Core 2 2.4 GHz 106.18 W
• All pareto optimal configurations use flash memory
27

Efficiency vs Most Efficient Disk
0
0.5
1
1.5
2
2.5
Effi
cie
ncy
vs.
Max
Eff
icie
ncy
Dis
k
2.2
28

Speed Up vs Fastest Disk
0
0.2
0.4
0.6
0.8
1
1.2
1.4
1.6
Spp
ed
Up
vs.
Fas
test
Dis
k
29
1.5

Relative Energy Consumption
Most Efficient Flash vs Most Efficient Disk
0
0.1
0.2
0.3
0.4
0.5
0.6
0.7
0.8
0.9
1
Flash Disk Flash Disk Flash Disk Flash Disk Flash Disk Flash Disk Flash Disk
index compgrep sort simpgrep identity ngram average
Re
lati
ve E
ne
rgy
overhead cpu disk/flash mem30

Gordon Overview
• Introduction
• Flash Storage Systems
• Design Space Exploration
– Design Space
– Methodology
– Results
• Gordon Discussion
31
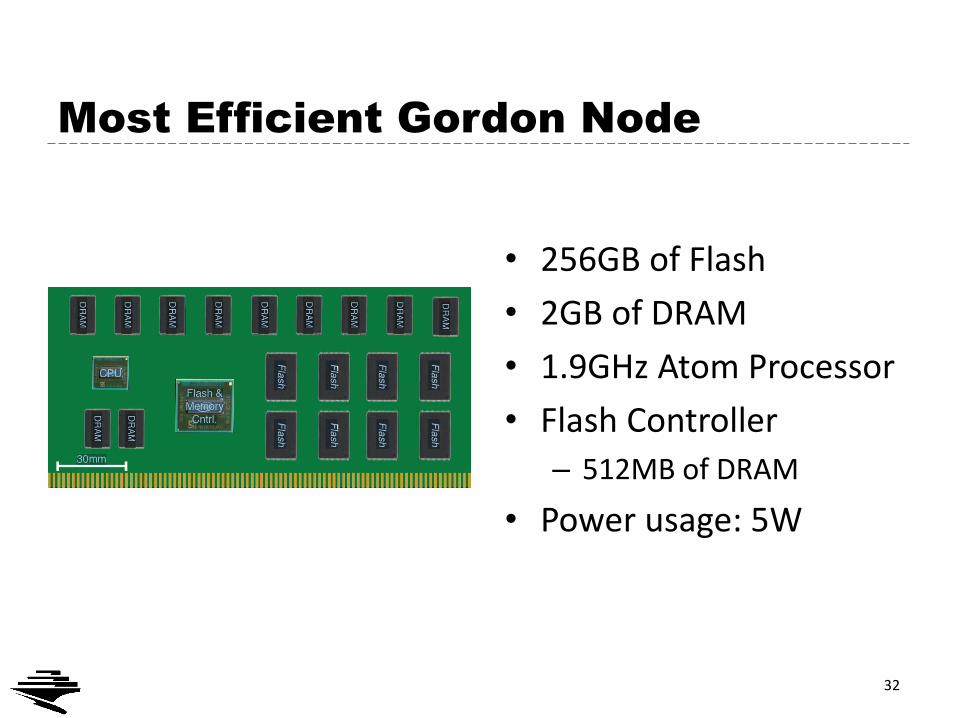
Most Efficient Gordon Node
• 256GB of Flash
• 2GB of DRAM
• 1.9GHz Atom Processor
• Flash Controller
– 512MB of DRAM
• Power usage: 5W
32

System Architecture
• 16 Gordon nodes per backplane – 1Gbit network
connectivity
• 16 backplanes per standard server rack – 256 Nodes – 64 TB of Storage – 230GB/s of aggregate I/O bandwidth – 1300 Watts power usage
• A data centric super computer
33

Gordon Cost
• Disk is cheaper per GB of storage
• Flash clear winner in Cost/MB/s
– For 900MB/s bandwidth
• Flash: $350, Disk: $4500
• Real value: Gordon enables new applications
– Fast random I/O
34

Virtualizing Gordon
• Keep Gordon as busy as possible
• Gordon becomes a data intensive coprocessor
– Large datasets stored on disk
– Transferred to flash for processing
• Pipeline loading and computation
35

Conclusion
• Data centric applications increasingly common
• Flash memory provides low power, low latency, high bandwidth storage
• Optimized Flash Translation Layer
• Gordon enables fast, power efficient data centric processing
• Gordon is up to 2.2X more efficient and 1.5X faster than disk based designs
36