Embed Size (px)
DESCRIPTION
-
Citation preview

Google Earth UtilityBy Mazhar Kazi

1. Google Earth Utility Google Earth Utility is an Excel Based Macro that plots the Cell Coverage Based on TP/TA values on Google Earth. Moreover, it also plots the 2G/3G/4G neighbors and various thematic based on Traffic, Drop Call Rate and Minutes per drops.
The tool is extremely important to propose optimum redesign recommendations which are the core to the optimization process.
1. TA/TP Based CoverageThe tool displays the coverage of both GSM and UMTS based on the TP/TA Statistics. The Color Theme used for plotting TA/TP Bins is mentioned in the table below.
RF Optimization Tools Page 2 by Mazhar Kazi
TA/TP Bin Sample Per. Color
>= 3 AND <5 Green >= 5 AND <10 Yellow >= 10 Red

1.1. TA/TP Bin’s Information BalloonTA/TP Bin’s Information Balloon displays the information related to a particular TA/TP bin. For e.g. Traffic
carried / Percentage sample in this particular Bin, the Distance of the bin from the site.
.
RF Optimization Tools Page 3 by Mazhar Kazi

1.2. Views
1.2.1. General View
1.2.2. BSC/RNC View
It displays the sites in different BSC with different colors. This is helpful in identifying the BSC Boundaries.
RF Optimization Tools Page 4 by Mazhar Kazi
It displays the cells as per the physical information on the Google Earth. The Site Color theme is as follows:-
Site Theme Color
Off Air Red
Micro Blue
All the rest Yellow

1.2.3. LAC View
It displays the sites in different LAC with different colors. This is helpful in identifying the LAC Boundary
RF Optimization Tools Page 5 by Mazhar Kazi

1.3. Thematic
1.3.1. TCH Utilization Thematic
RF Optimization Tools Page 6 by Mazhar Kazi
1.3.2. DCR Thematic
1.4. Cell Information BalloonThe Cell Information Balloon displays the physical and statistical information of the site.
RF Optimization Tools Page 7 by Mazhar Kazi

RF Optimization Tools Page 8 by Mazhar Kazi

1.5. Labels
RF Optimization Tools Page 9 by Mazhar Kazi
It displays the Frequency, HBA and MPD of the cells in-front of it.
Frequency Labels HBA Labels
MPD (Minutes per Drop) Labels

1.6. TA/TP Frequency
RF Optimization Tools Page 10 by Mazhar Kazi
It displays the TA/TP based coverage of all the cells having a particular frequency. This is very useful in determining Co and Adjacent Channel interferer.
TA Based Coverage of All Cells with Frequency “63”. TA Based Coverage of All Cells with Frequency “63” & “64”.
TA Based Coverage of All Cells with Frequency “63”, “64” & “65”.

1.7. Neighbor Display
Each Line represents a Neighbor. The color of the line is based on the neighbor stats are mentioned above.
RF Optimization Tools Page 11 by Mazhar Kazi
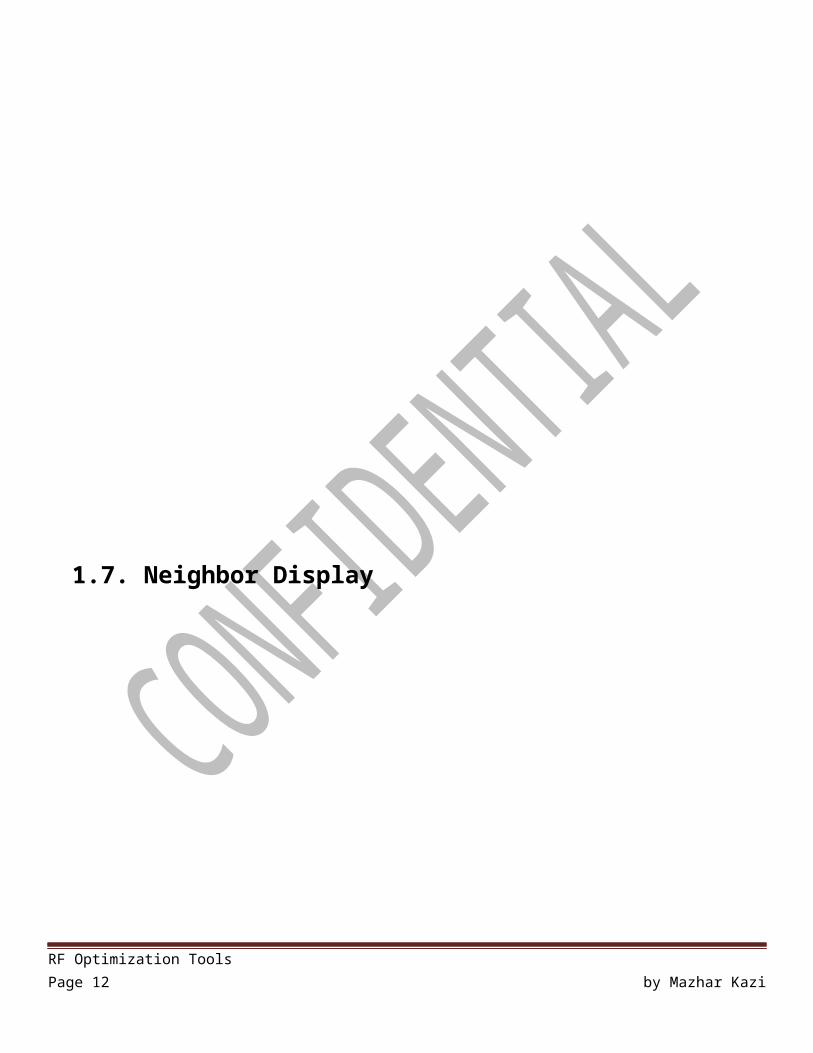
Neighbor Classification
(based on Attempt) Neighbor with Zero Attempts
Purple
Top 5 Neighbors Red
Top 6 – 10 Neighbor Yellow
All the rest Green
Color
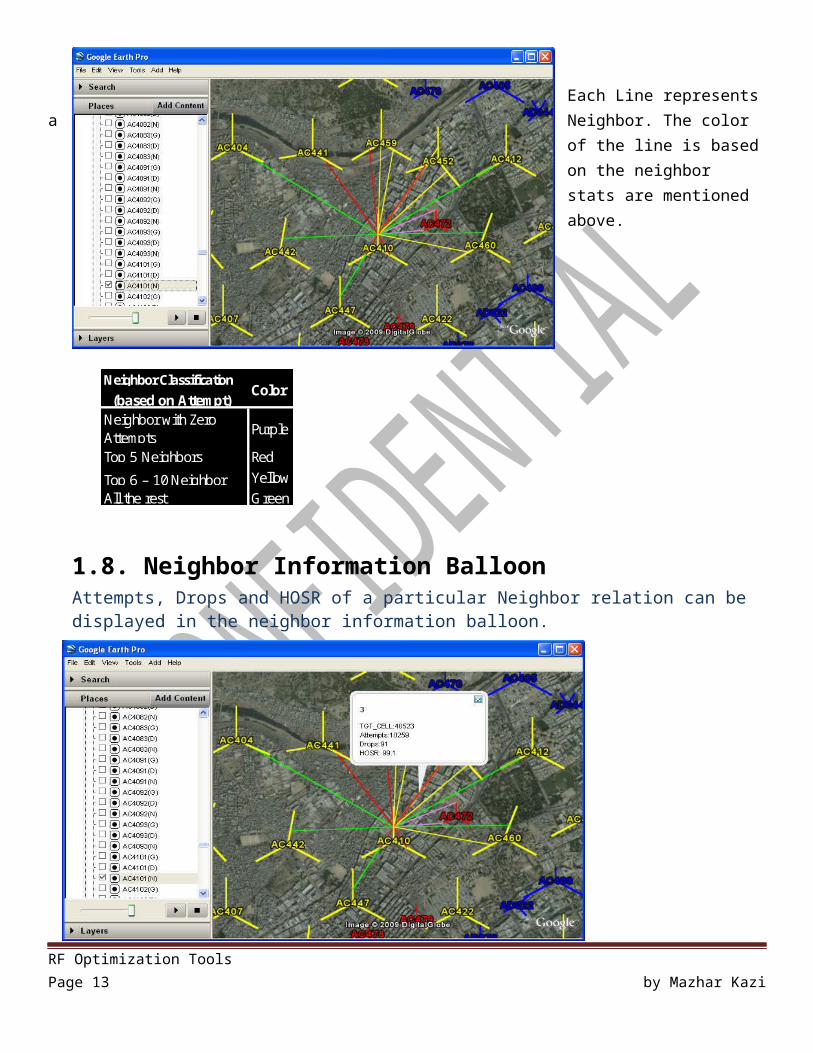
1.8. Neighbor Information BalloonAttempts, Drops and HOSR of a particular Neighbor relation can be displayed in the neighbor information balloon.
RF Optimization Tools Page 12 by Mazhar Kazi
1.9. Zero Attempts Neighbors
1.10. Low HOSR Neighbors
RF Optimization Tools Page 13 by Mazhar Kazi
Each Line represents a Neighbor Relation from Source Cell to Target Cell having Zero Attempts
Each Line represents a neighbor relation having the criteria defined below

1.11. High HO Drops Neighbors
RF Optimization Tools Page 14 by Mazhar Kazi