Embed Size (px)
Citation preview

Goodwood Resource Management Tract
Terrestrial Biological Inventory and Assessment
January, 2013

Report prepared by: Paul Prior, Fauna Biologist
Kelly Purves, Flora Biologist
Natasha Gonsalves, Environmental Technical Assistant
Patricia Moleirinho, GIS Technologist
Reviewed by: Sue Hayes, Project Manager, Terrestrial Field
Inventories
Scott Jarvie, Manager, Watershed Monitoring and
Reporting Section
This report may be referenced as:
Toronto and Region Conservation Authority (TRCA). 2013.
Goodwood Resource Management Tract Terrestrial Biological
Inventory and Assessment.

G o o d w o o d R e s o u r c e M a n a g e m e n t T r a c t
Januar y 2013
Table of Contents
p a g e
1.0 Introduction .......................................................................................... 1
1.1 TRCA’s Terrestrial Natural Heritage Program ............................................................... 1
2.0 Study Area Description ........................................................................ 2
3.0 Inventory Methodology ....................................................................... 2
3.1 Landscape Analysis ...................................................................................................... 3
3.2 Vegetation Communities, Flora and Fauna Species ..................................................... 4
4.0 Results and Discussion ....................................................................... 6
4.1 Regional Context .......................................................................................................... 6
4.2 Habitat Patch Findings for the Goodwood Resource Management Tract ..................... 6
4.2.1 Quantity of Natural Cover ................................................................................................. 6
4.2.2. Quality Distribution of Natural Cover................................................................................ 7
4.3 Vegetation Community Findings for the Goodwood Resource Management Tract ...... 8
4.3.1 Vegetation Community Representation ........................................................................... 8
4.3.2 Vegetation Communities of Concern ............................................................................... 9
4.4 Flora Findings for the Goodwood Resource Management Tract ................................ 10
4.4.1 Flora Species Representation ........................................................................................ 10
4.4.2 Flora Species of Concern .............................................................................................. 11
4.5 Fauna Species Findings for the Goodwood Resource Management Tract ................ 12
4.5.1 Fauna Species Representation ...................................................................................... 12
4.5.2 Fauna Species of Concern ............................................................................................ 12
5.0 Summary and Recommendations .................................................... 17
5.1 Site Summary ............................................................................................................. 18
5.2 Site Recommendations .............................................................................................. 18
6.0 References .......................................................................................... 22

G o o d w o o d R e s o u r c e M a n a g e m e n t T r a c t
Januar y 2013
p a g e
L is t o f Tab les Table 1: Habitat patch quality, rank and species response ............................................................. 6 Table 2: Schedule of the TRCA biological surveys at Goodwood Resource Management Tract .. 7 Table 3: Summary of Vegetation Communities, Goodwood Resource Management Tract ......... 10 Table 4: Summary of Flora Species, Goodwood Resource Management Tract ........................... 12 Table 5: Summary of Fauna Species of Concern, Goodwood Resource Management Tract ..... 15
L is t o f Maps
Map 1: Goodwood Resource Management Tract in the Context of Regional Natural Cover ..... 23
Map 2: Goodwood Resource Management Tract Study Area ..................................................... 24
Map 3: Regional Natural System Habitat Patch Quality ............................................................... 25
Map 4: Distribution of Fauna Regional Species of Concern ........................................................ 26
Map 5: Habitat Patch Size Scores with Fauna Area Sensitivity Scores ....................................... 27
Map 6: Interior Forest at Goodwood Resource Management Tract ............................................ 28
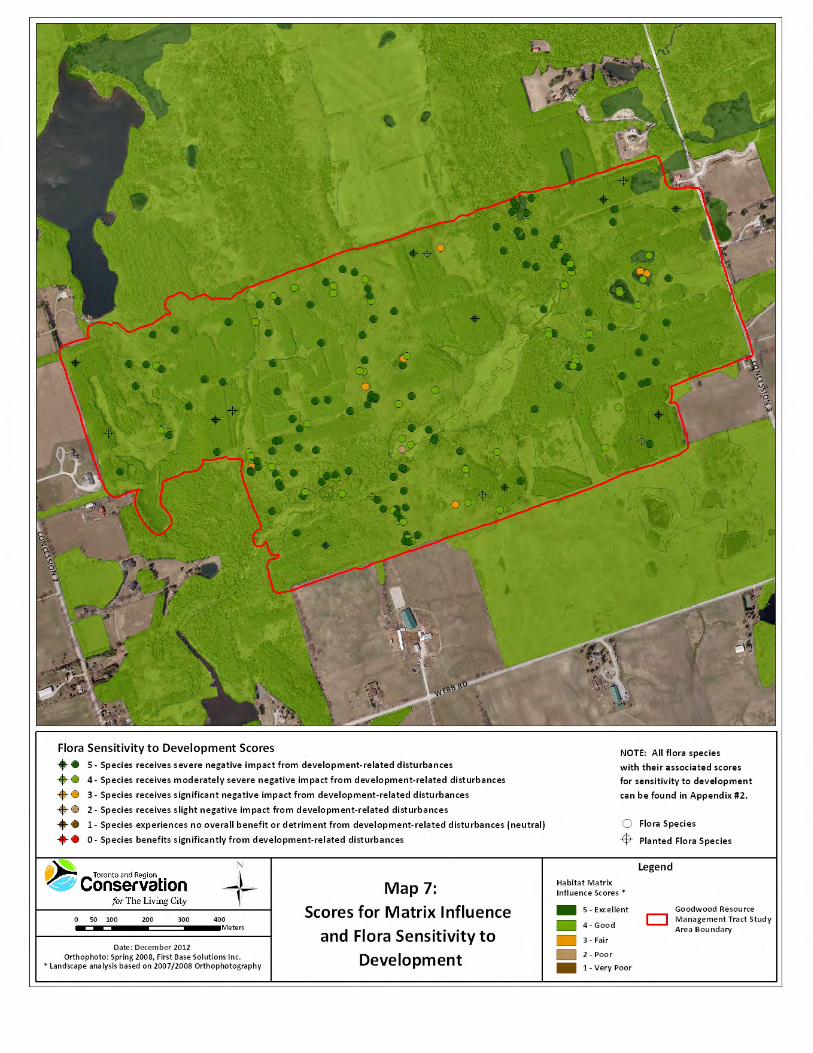
Map 7: Scores for Matrix Influence and Flora Sensitivity to Development .................................. 29
Map 8: Scores for Matrix Influence and Fauna Sensitivity to Development ................................ 30
Map 9: Habitat Patch Quality ........................................................................................................ 31
Map 10: Vegetation Communities with their Associated Local Ranks ........................................... 32
Map 11: Location of Flora Species of Concern .............................................................................. 33
Map 12: Flora Habitat Dependence Scores ................................................................................... 34
Map 13: Location of Fauna Species of Concern ............................................................................ 35
Map 14: Fauna Species of Concern Habitat Dependence Scores ................................................ 36
List of Appendices Appendix 1: List of Vegetation Communities ................................................................................. 37
Appendix 2: List of Flora Species .................................................................................................. 39
Appendix 3: List of Fauna Species ................................................................................................ 49

G o o d w o o d R e s o u r c e M a n a g e m e n t T r a c t
Januar y 2013
1
1.0 Introduction
In 2005, the Toronto Region Conservation Authority (TRCA) conducted flora and fauna inventories
of the natural cover associated with the Goodwood Resource Management Tract (GRMT) (Map 1).
This site had been initially selected for flora and fauna inventory as it was identified as a high
priority area for the Habitat Implementation Plan (HIP) program. In order to fulfill the requirements
under the HIP, a detailed field inventory was needed in order to better understand the then current
conditions of the site. The more recent request for a report on available inventory data from the
site is driven by the upcoming update to the management plan for the entire West Duffins
Headwaters. The baseline inventory information will be used to guide land management decisions
such as the designation of management zones and appropriate trail placement. For the purpose
of this report, additional fauna and flora data collected over the past decade, primarily as
incidental observations made during the annual Long Term Monitoring Project (LTMP) station
visits (collected at GRMT between 2008 and 2012), are included.
The purpose of the work conducted by the TRCA during the 2005 field season was to characterize
the terrestrial natural heritage features of the GRMT. Once characterized, the site features can then
be understood within the larger regional context of the Terrestrial Natural Heritage Program of the
TRCA. The question that the inventory addresses is “How does the area surveyed at GRMT fit
within the regional and watershed natural system, and how should its contribution to this system be
protected and maximized?” The important underlying message offered by this question is that the
health of the natural system is measured at the regional scale and specific sites must be
considered together for their benefits at all scales, from the site to the larger system.
1.1 TRCA’s Terrestrial Natural Heritage Program
Rapid urban expansion in the TRCA jurisdiction has led to continuous and incremental loss of natural cover and species. In a landscape that probably supported 95% forest cover prior to European settlement, current mapping shows that only 17% forest and wetland cover remains. Agricultural and natural lands are increasingly being urbanized while species continue to disappear from a landscape that is less able to support them. This represents a substantial loss of ecological integrity and ecosystem function that will be exacerbated in the future according to current urbanization trends. With the loss of natural cover, diminishing proportions of various natural vegetation communities and reduced populations of native species remain. Unforeseen stresses are then exerted on the remaining flora and fauna in the natural heritage system. They become even rarer and may eventually be lost. This trend lowers the ability of the land to support biodiversity and to maintain or enhance human society (e.g. through increased pollution and decreased space for recreation). The important issue is the cumulative loss of natural cover in the TRCA region that has resulted from innumerable site-specific decisions.
In the late 1990s the TRCA initiated the Terrestrial Natural Heritage Program to address the loss of
terrestrial biodiversity within the jurisdiction’s nine watersheds. This work is based on two
landscape-level indicators: the quality distribution of natural cover and the quantity of natural
cover. The aim of the program is to create a conservation strategy that both protects elements of

G o o d w o o d R e s o u r c e M a n a g e m e n t T r a c t
Januar y 2013
2
the natural system (vegetation communities, flora and fauna species) before they become rare
and promotes greater ecological function of the natural system as a whole. This preventive
approach is needed because by the time a community or species has become rare, irreversible
damage has often already occurred. A healthy natural system capable of supporting regional
biodiversity in the long term is the goal of the Terrestrial Natural Heritage Systems Strategy
(TNHSS) by setting targets – both short- and long-term (100 years) – for the two landscape
indicators in order to provide direction in planning at all scales (TRCA 2007a, TRCA 2007b).
A target system that identifies a land base where natural cover should be restored is a key
component of the Strategy. Although the objectives of the Strategy are based on making positive
changes at all scales, the evaluation models were developed at the landscape scale using a
combination of digital land cover mapping and field-collected data. Field-collected data also
provides ground-level information in the application of the landscape models at the site scale. The
two indicators and the targets that have been set for them are explained in Section 3.1. It is
important to understand that habitat quality and distribution are interdependent. For example,
neither well-distributed poor-quality natural cover nor poorly-distributed good-quality natural cover
achieves the desired condition of sustainable biodiversity and social benefits across the
watershed.
2.0 Study Area Description
As shown in Maps 1 and 2, the study area is located in the north-east corner of the jurisdiction in
the headwaters of the Duffins Creek watershed in the township of Uxbridge. It consists entirely of
the TRCA property situated between Concessions 2 and 3, north of Webb Road. The study area is
part of a larger forest network stretching to the north and east; this network includes the
neighbouring Secord property and a portion of the Goodwood/Glasgow Wetland Complex and
the Duffins Headwaters Area of Natural and Scientific Interest (ANSI). To the south, east and west,
much of the landscape is agricultural interspersed with smaller fragments of forest cover and with
relatively extensive forest cover remaining in riparian corridors.
The site lies entirely on the Oak Ridges Moraine (ORM) within the Great Lakes – St. Lawrence
floristic region, the latter historically composed of mixed coniferous-deciduous forest. The ORM is
a ridge of sand and gravel deposited approximately 12,000 years ago. The unconfined aquifer
systems overlying the bedrock are responsible for the groundwater seepage that occurs in parts
of the site.
3.0 Inventory Methodology
A biological inventory of the GRMT was conducted at the levels of habitat patch (landscape
analysis), vegetation community, and species (flora and fauna) according to the TRCA
methodologies for landscape evaluation (TRCA 2007c) and field data collection (TRCA 2007d).

G o o d w o o d R e s o u r c e M a n a g e m e n t T r a c t
Januar y 2013
3
Habitat patch mapping was taken from the regional 2007/08 mapping of broadly-defined patch
categories (forest, wetland, meadow and coastal) and digitized using ArcView GIS software.
A key component of the field data collection is the scoring and ranking of vegetation communities
and flora and fauna species to generate local “L” ranks (L1 to L5); this process was undertaken in
1996-2000 and ranks are reviewed regularly (TRCA 2010). Vegetation community scores and
ranks are based on two criteria: local occurrence and the number of geophysical requirements or
factors on which they depend. Flora species are scored using four criteria: local occurrence,
population trend, habitat dependence, and sensitivity to impacts associated with development.
Fauna species are scored based on seven criteria: local occurrence, local population trend,
continent-wide population trend, habitat dependence, sensitivity to development, area-sensitivity,
and patch isolation sensitivity. With the use of this ranking system, communities or species of
regional concern, ranked L1 to L3, now replace the idea of rare communities or species. Rarity
(local occurrence) is still considered as one of many criteria that make up the L-ranks, making it
possible to recognize communities or species of regional concern before they have become rare.
In addition to the L1 to L3 ranked species, a large number of currently common or secure species
at the regional level are considered of concern in the urban context. These are the species
identified with an L-rank of L4. Although L4 species are widespread and frequently occur in
relatively intact urban sites, they are vulnerable to long-term declines.
3.1 Landscape Analysis
The quality, distribution and quantity of natural cover in a region are important determinants of the species distribution, vegetation community health and the provision of “ecosystem services” (e.g. air and water quality, recreation, aesthetics) in that region.
Base Mapping
The first step in evaluating a natural system or an individual habitat patch is to interpret and map
land cover using aerial photographs. The basic unit for the evaluation at all scales is the habitat
patch in the region, which are then combined and evaluated as a system at any scale. A habitat
patch is a continuous piece of habitat, as determined from aerial photo interpretation. The TRCA
maps habitat according to four broad categories: forest, wetland, meadow, and coastal (beach,
dune, or bluff). At the regional level, the TRCA jurisdiction is made up of thousands of habitat
patches. This mapping of habitat patches in broad categories is conducted through remote–
sensing and is used in the evaluation of quality, distribution and quantity of natural cover. It should
not be confused with the more detailed mapping of vegetation communities obtained through field
surveys and that is used to ground-truth the evaluation (see Section 3.2).
Quality Distribution of Natural Cover
The quality of each habitat patch is evaluated according to three criteria: size (the number of ha
occupied by the patch), shape (edge-to-area ratio), and matrix influence (measure of the positive
and negative impacts from surrounding land use) (TRCA 2007c). A total score for each patch is

G o o d w o o d R e s o u r c e M a n a g e m e n t T r a c t
Januar y 2013
4
obtained through a weighted average of the scores for the three criteria. This total score is used
as a measure of the ‘quality’ of a habitat patch and is translated into a local rank (L-rank) ranging
from L1 to L5 based on the range of possible total scores from 3 to 15 points. Of these L-ranks, L1
represents the highest quality habitat and L5 the poorest.
Species presence or absence correlates to habitat patch quality (size, shape and matrix influence)
(Kilgour 2003). The quality target is based on attaining a quality of habitat patch throughout the
natural system that would support in the very long term a broad range of biodiversity, specifically
a quality that would support the region’s fauna Species of Conservation Concern (Table 1).
Table 1: Habitat patch quality, rank and species response
Size, Shape and Matrix Influence Patch Rank Fauna Species of Conservation Concern
Excellent L1 Generally found
Good L2 Generally found
Fair L3 Generally found
Poor L4 Generally not found
Very Poor L5 Generally not found
In addition to the three criteria that make up the total habitat patch score, another important
measure to consider in assessing habitat patch quality is forest interior, i.e. the amount of forest
habitat that is greater than 100 m from the edge of the forest patch, using 100 m increments. A
recognized distance for deep interior conditions occurs at 400 m from the patch edge. Such
conditions are a habitat requirement for several sensitive fauna species.
Quantity of Natural Cover
The amount of natural cover needed in the landscape is based on the quantity required to
accommodate and achieve the quality distribution targets described above. The two targets are
therefore linked to each other: it will be impossible to achieve the required distribution of natural
heritage quality without the appropriate quantity of natural cover. The proportion of the region that
needs to be maintained as natural cover in order to achieve the desired quality has been identified
as 30%.
3.2 Vegetation Communities, Flora and Fauna Species
Vegetation community and flora and fauna species data were collected through field surveys in 2005. These surveys were done during the appropriate times of year to capture breeding status in the case of amphibians and birds, and during the optimal growing period of the various plant species and communities (Table 2). Vegetation communities and flora species were surveyed concurrently.

G o o d w o o d R e s o u r c e M a n a g e m e n t T r a c t
Januar y 2013
5
Vegetation community designations were based on the Ecological Land Classification (ELC) and determined to the level of vegetation type (Lee et al. 1998). Community boundaries were outlined onto printouts of 2007/08 digital ortho-rectified photographs (ortho-photos) to a scale of 1:2000 and then digitized in ArcView. Flora regional species of concern (species ranked L1 to L3) were mapped as point data with approximate number of individuals seen. A list of all other species observed was documented for the site. The results from this survey have been augmented with earlier vegetation surveys conducted by the TRCA in 1998 in the analysis of this report.
The most recent formal fauna survey of the site was conducted by the TRCA in April, June and July of 2005. The threshold for inclusion of fauna data in TRCA reports is 10 years and therefore only incidental records from 2003 and later are included in the analysis of fauna data for this report. The spring surveys searched primarily for frog species of regional concern but recorded incidentally presence of any early-spring nocturnal bird species (owls and American woodcocks). Surveys in June and the July were concerned primarily with the mapping of breeding bird species of regional concern. As per the TRCA data collection protocol breeding bird surveys were carried out by visiting all parts of the site at least twice during the breeding season (last week of May to mid-July) to determine the breeding status of each mapped point. The methodology for identifying confirmed and possible breeding birds follows Cadman et al. (1987). All initial visits were completed by the end of the third week of June. The field-season is organized so that by late June only repeat visits are being conducted. It is imperative that any visit made in the first half of June is subsequently validated by a second visit later in the season. Fauna regional species of concern (species ranked L1 to L3) were mapped as point data with each point representing a possible breeding bird. In addition, data collected from regional long-term monitoring plots (LTMP) located within the GRMT provided supplementary flora and fauna species records for the site from 2008 - 2012.
Table 2. Schedule of TRCA biological surveys at the Goodwood Resource Management
Tract in 2005 - 2012
Survey Item Survey Dates Survey Effort (hours)
Patch / Landscape 2007/08: ortho-photos 21 hours
Vegetation Communities
and Flora Species
2005: May 16th, 30th, June 7th, 8th, 27th, July
15th, 17th, 18th, 23rd , September 2nd 70 hours
Frogs and Nocturnal
Spring Birds 2005: April 14th and 18th 6 hours
Breeding Songbirds 2005: June 2nd, 3rd, 20th – 22nd, July 14th 24 hours
Long-term Monitoring Stations (Vegetation, Salamander and Bird)
2008 – 2012: Various. Annual spring and summer visits
~ 45 hours

G o o d w o o d R e s o u r c e M a n a g e m e n t T r a c t
Januar y 2013
6
4.0 Results and Discussion Information pertaining to the GRMT was collected through both remote-sensing and ground-truthing surveys. This information contains three levels of detail: habitat patch, vegetation community, and species (flora and fauna). This section provides the information collected and its analysis in the context of the TNHS Strategy.
4.1 Regional Context
Based on 2007/08 ortho-photography, 25% of the land area in the TRCA jurisdiction consists of natural cover but this figure includes meadow and old field. Although historically, the region would have consisted of up to 95% forest cover, currently (i.e. 2007/08) only about 17% is covered by forest and wetland. Of the non-natural cover (i.e. the remaining 75%), 48% is urban and 27% is rural / agricultural.
The regional level analysis of habitat patches shows that the present average patch quality across
the TRCA jurisdiction is “fair” (L3); forest and wetland cover is contained largely in the northern
half of the TRCA jurisdiction, especially on the Oak Ridges Moraine; and the quantity is 16.7% of
the surface area of the jurisdiction (Map 3). In addition, meadow cover stands at 8.1% of the
region. Thus the existing natural system stands below the quantity target that has been set for the
region (30%) and also has an unbalanced distribution. The distribution of fauna species of
concern is also largely restricted to the northern part of the jurisdiction; fauna species of regional
concern are generally absent from the urban matrix (Map 4). The regional picture, being the result
of a long history of land use changes, confirms that all site-based decisions contribute to the
condition of a region.
4.2 Habitat Patch Findings for the Goodwood Resource Management Tract
The following details the study area according to the two natural system indicators used in designing the Terrestrial Natural Heritage System Strategy: the quality distribution and quantity of natural cover. Analysis was based on 2007/08 ortho-photos.
4.2.1 Quantity of Natural Cover
The area of the Duffins Creek watershed is approximately 28,653 ha containing 40.7% natural
cover, including 8,157 ha as forest (28.5%), 3002 ha as meadow (10.5%), 505 ha as wetland
(1.8%). Goodwood Resource Management Tract contains 0.4% of the total natural cover in the
Duffins Creek watershed.
The GRMT itself covers about 127.5 ha, all of which is natural cover (Appendix 1). The natural
cover includes 79.3 ha of forest (52.7 ha of which is plantation), 10.5 ha of successional, 24.2 ha
of wetland (including 15.1 ha of treed swamp), 1.6 ha aquatic and 11.8 ha of meadow.

G o o d w o o d R e s o u r c e M a n a g e m e n t T r a c t
Januar y 2013
7
4.2.2. Quality Distribution of Natural Cover
The results for quality distribution are reported below under the headings of habitat patch size and
shape, matrix influence and total score.
Habitat Patch Size and Shape
Within the GRMT the majority of the forest habitat is well connected and thus scores as one large
patch, resulting in the maximum score of 5 points, or “excellent” (Map 5). Since much of the study
area is forest this score is the average score for the entire study area; other habitat types such as
wetland are present as smaller patches but still score “fair”. In addition there are smaller patches
of meadow and successional habitat scoring as low as 1 and 2 points, “very poor” and “poor”.
In terms of shape, the habitat patches score “very poor”. This is actually a reflection of the network
of forest corridors connecting the forest as one large patch but contains many holes and gaps.
This emphasizes the fact that neither size nor shape attributes should be considered in isolation
from each other. A further understanding of the condition of the forest patch on the site can be
gained by considering forest interior (Map 6). There is one large patch of forest interior (forest
habitat situated more than 100 metres from the forest edge) in the western half of the site with two
smaller patches in the east and south. The amount of forest interior is limited by the very
convoluted edge of the forest habitat as the Duffins headwater stream winds its way, flanked by
open meadow marsh habitat, through the centre of the site.
Habitat Patch Matrix Influence
Analysis based on the 2007/08 ortho-photos shows that the matrix influence score for habitat in
the study area is “good” points, see Maps 7
and 8). This can be attributed to the mix of natural and agricultural land surrounding the site.
These scores are as expected given the rural setting, with a mix of natural and agricultural land-
types in the vicinity.
The TRCA measures matrix influence at the landscape level by assigning set values; positive,
neutral and negative, to the type of landscape use occurring within 2 km of the subject site. It is
important, however, to also understand and consider the matrix influence that occurs at the site
and patch level. Such influences include those transferred to an otherwise remote natural habitat
patch from a distant urban or suburban development, for example via a trail system.
Habitat Patch Total Score
The high scores for habitat patch size and matrix influence combine to counteract the “very poor”
patch shape score, resulting in an overall “good” habitat patch quality (Map 9). The forested
landscape that continues to the north of the study area scores similarly as high for habitat patch
quality. The fact that the landscape local to the GRMT is of such high quality should result in the
presence of an equally high quality biodiversity with a high incidence of Species of Regional

G o o d w o o d R e s o u r c e M a n a g e m e n t T r a c t
Januar y 2013
8
Concern throughout the forested landscape. It is important to understand the reciprocal
interaction between the study area and the landscape in which the study area is embedded: each
in their turn positively affects the other.
4.3 Vegetation Community Findings for the Goodwood Resource Management Tract
4.3.1 Vegetation Community Representation
The complex geology and topography of the study adiverse mosaic of vegetation communities (Appendix 1; Map 10). A total of 60 different ELC vegetation community types were described for the site including 11 complexes and inclusions within larger communities. There are 24 forest communities, 10 successional communities, 21 wetlands, 1 vegetated aquatic (plus 1 non-vegetated aquatic), and 3 meadows. A total of 11 communities were recorded solely as complexes and/or inclusions within other communities (2 forest types, 2 successional types, 4 wetland types, 1 aquatic type and 2 meadow types).
Table 3. Summary of Vegetation Communities, Goodwood Resource Management
Tract
Class Number of Types Area (hectares)
Forest 24 79.3
Successional 10 10.5
Meadow 3 11.8
Wetland 21 24.2
Aquatic 2 1.6
Total 60 127.4
The GRMT supports 24 types of forest covering almost 80 hectares, with twice the amount of
patch in the north-centre and one in the south-centre. Sugar Maple Deciduous Forest (FOD5-1)
and Fresh-Moist White Cedar - Hardwood Mixed Forest (FOM7-2) are the best represented types
and occur along one of the valleys in the middle of the site extending in some places to the
tablelands. There are over 50 hectares of plantations, half of which are Red Pine Coniferous
Plantations (CUP3-1). There is little to no understorey growth of later successional species such
as white ash (Fraxinus americana) and sugar maple (Acer saccharum ssp saccharum) likely
because of the high density of planted trees.
Wetlands occupy 24 hectares of the site, the section of Goodwood/Glasgow Wetland Complex
accounting for virtually all of this. There are some small kettle depressions, more so in the eastern
half of the study area that support many species of concern. White Cedar - Hardwood Organic
Mixed Swamp (SWM4-1) is found in six polygons and is the wetland best represented followed by
White Cedar - Hardwood Mineral Mixed Swamp (SWM1-1) covering about half as much land.
Overall, wetland communities are diverse including organic thicket swamps (SWT3-1), mineral

G o o d w o o d R e s o u r c e M a n a g e m e n t T r a c t
Januar y 2013
9
meadow marshes (MAM3-1), shallow marshes (MAS2-2) and deciduous swamps (SWD4-3). The
beaver activity in one of the rivers has altered some of the wetland communities nearby that at one
time likely were deciduous swamps or lowland forest including white elm. Now most is Reed
Canary Grass Mineral Meadow Marsh (MAM2-2) and Forb Organic Meadow Marsh (MAM3-9) with
dead eastern white cedar, white elm and other deciduous snags. There are also human-made
dams just outside of the site boundary that affect the state of the wetlands at the western edge.
The only aquatic polygon (OAO1) is part of the pond created by one of these dams.
Areas subjected to past clearing include 11.8 hectares of meadow (CUM1-A) dominated by tall
goldenrod (Solidago altissima) with an admixture of smooth brome (Bromus inermis) and other
European cool-season grasses. Another 10.5 hectares are in various stages of succession. There
is one 4.3 hectare Coniferous Sapling Cultural Thicket (CUT1-A3) dominated by Scots pine (Pinus
sylvestris). It is a result of a regenerating plantation nearby that is actually smaller than the thicket.
Manitoba maple (Acer negundo) is another invasive non-native species at GRMT. Poplar species
(P. tremuloides and P. balsamifera) are also common forming woodlands and thickets. 4.3.2 Vegetation Communities of Concern
The vegetation communities that occur in the TRCA jurisdiction are scored and given a local rank
from L1 to L5 based on the two criteria mentioned in Section 3.0. Vegetation communities with a
rank of L1 to L3 are considered of concern across the entire jurisdiction while L4 communities are
considered of concern in the urban portion of the jurisdiction. The GRMT lies within the rural
landscape and so L1 to L3 communities are identified as being of conservation concern. On the
other hand, community ranks do not take into account the intactness or quality of individual
examples of communities; thus, a common type of vegetation community may be of conservation
concern at a particular site because of its age, intact native ground layer, or other considerations
aside from rank. This is clearly the case for the older forest communities at the GRMT, most of
which have a rank of L4 or even L5 but are high-quality examples of their types. An old-growth
sugar maple forest may belong to a relatively common and adaptable vegetation type but should
still be considered of high conservation concern.
Thirteen of the 60 vegetation communities found at the GRMT are of regional concern; 4 of these
are only found as complexes or inclusions and are ranked as either L2 or L3 (Appendix 1; Map
10). There are 11 organic wetland types in the study area, 5 of which are ranked L2. The other six
are ranked L3 as is the Fresh-Moist Hemlock - Hardwood Mixed Forest (FOM6-2) and Dry-Fresh
White Cedar – Poplar Mixed Forest (FOM4-2).
Ten community types have restricted local distribution (generally, they are restricted to six or fewer
of the forty-four 10x10 km squares that encompass the TRCA jurisdiction). White pine is usually
less prominent in succession (at least in recent decades) than are deciduous trees such as ash
species partly explaining why White Pine Cultural Savannah (CUS1-A2) scores high. Basswood
(Tilia Americana) is usually found associated with other deciduous trees and not on its own as a
Dry-Fresh Basswood Deciduous Forest (FOD4-G) giving it also a higher score.
G o o d w o o d R e s o u r c e M a n a g e m e n t T r a c t
Januar y 2013
10
The geophysical requirements of communities in the TRCA jurisdiction make up the second
criteria of the community L-rank. Vegetation communities develop under certain site conditions
and may be restricted to particular locations based on slope aspect, hydrology, soil character
vegetation communities at the GRMT tend to score low to moderate in this respect. However, the
forests that have a coniferous component of eastern hemlock (Tsuga canadensis) or white cedar
(Thuja occidentalis) (FOC2-2, FOC4-1, FOM4-2, FOM6-2, FOM7-2) are associated with cool,
sheltered exposures, often a northerly or easterly aspect. To some extent, these forests are
associated with groundwater. Increased exposure and drying does cause decline of these forest
communities.
The wetlands at the GRMT are dependent upon ground water and surface water (the kettle
wetlands only receive water from rainfall). The wetlands that have organic soils score higher in this
category, having a minimum of three geophysical requirements. Organic wetlands are typically
associated with cool, shaded microclimates at lower elevations with groundwater seepage and
sufficient time for organic matter to have accumulated.
4.4 Flora Findings for the Goodwood Resource Management Tract
4.4.1 Flora Species Representation
With the inclusion of the LTMP data, a total of 318 naturally-the GRMT between 2005 and 2012 (Appendix 2). Of the 252 native species, 73 are of regional conservation concern (8 L2 ranked and 65 L3 ranked species) (Map 11). Three additional species: red pine (Pinus resinosa), white pine (Pinus strobus), and Norway spruce (Picea abies) exist in plantations only. The high biodiversity of this site (quite notable given the study area size) is due to the presence of so many different types of vegetation community, soil types, and age. In particular, the aquatic, marsh, treed swamp, and forest communities all have their own suite of species. The conifer plantations tend to have lower species richness. However, these plantings can create conditions favourable for certain native species, e.g. through the production of a slow-to-decay duff layer.
Table 4. Summary of Flora Species, Goodwood Resource Management Tract
Total # of species 321
Naturally-occurring species 318
Planted species 3
Native (naturally-occurring) species 252
Number of L1 - L3 species 73

G o o d w o o d R e s o u r c e M a n a g e m e n t T r a c t
Januar y 2013
11
4.4.2 Flora Species of Concern
All
consequently, they are highly susceptible to changes in these communities. They score relatively
high in habitat dependence (Appendix 2) (Map 12). Roughly, they are found in fewer than seven
ecosites or habitat types according to the ELC (TRCA, 2005a). There is a clustering of highly
sensitive plants in the organic swamps, kettle wetlands, and more mature forests. For example,
shinleaf (Pyrola elliptica), Indian pipe ( ), Dutchman's breeches (Dicentra
cucullaria), and partridgeberry (Mitchella repens) are found in the mature upland forests. Wetland
obligates include bulrushes (Scirpus spp.) and great water dock (Rumex orbiculatus). Crested
wood fern (Dryopteris cristata) and pink wood-sorrel (Oxalis montana) are generally in swamps but
sometimes in rich forests. Long-fruited thimbleweed (Anemone cylindrica) and pearly everlasting
(Anaphalis margaritacea) are characteristic of the dry, open or semi-open habitats.
the GRMT would be severely negatively affected by
sensitivity to development impacts, scoring three or more for this criterion (Appendix 2).
These impacts are indirect ones emanating from the surrounding land use or .
Generally, with a “good” matrix influence as exists at the GRMT, communities and species of
concern have a higher chance of thriving (Map 7). This is due to the relative isolation of the forests
and swamps and the low recreational pressure. Areas that have a history of land use disturbance,
including agriculture, have fewer sensitive species. Several disturbances warrant further
discussion because of the possible impacts they may have on the site.
Hydrological changes from nearby development can result in changes to drainage patterns and
increased stormwater. Most of the species of regional concern are sensitive to subtle changes in
hydrological regime. Horsetails (Equisetum scirpoides and Equisetum fluviatile), ferns, and other
primitive species are especially tied to specific hydrology. Delicate swamp species such as
goldthread (Coptis trifolia) are also very sensitive.
Air pollution or changes to soil composition alter the habitat and affect sensitive species such as
many of the ferns and coniferous trees. Fertilizers and herbicides and sediment from agriculture
and golf courses can pollute both air and surface water run-off.
Disturbance caused by development and increased recreational use also facilitates the spread of
invasive species. Dog-strangling vine (Cynanchum rossicum) and European buckthorn (Rhamnus
cathartica) are already present in parts of the GRMT. Although, dog-strangling vine is currently not
prevalent, it’s aggressive and highly prolific nature increases its ability to spread and establish at a
site. Garlic mustard (Alliaria petiolata) has not been introduced to the site but can be expected to
spread rapidly with trails and recreational use if seeds are brought in by visitors. Many native
plants, especially when subjected to other stresses, cannot compete with invasives. For example,
thin-leaved cotton grass (Eriophorum viridi-carinatum) and many of the marsh species cannot
compete as well as reed canary grass in wetlands that become exposed to high levels of nutrients
(e.g. agricultural run-off). Woodland sedges (Carex spp.) are smaller and slower-growing than a
G o o d w o o d R e s o u r c e M a n a g e m e n t T r a c t
Januar y 2013
12
number of invasive alien species. Increased populations of deer often occur in areas with light to
moderate amounts of development. The deer over-browse many native species.
Alteration of disturbance regimes can lead to the extirpation of species that require some kinds of
disturbance. For example, Howell’s pussytoes (Antennaria howellii ssp. howellii) and common
juniper (Juniperus communis) require open habitats that may result from either anthropogenic
Monotropa
spp.) require natural and undisturbed litter accumulation.
Increased access and use associated with an urban matrix also involves increased trampling and
soil compaction. Species that have a delicate stem and/or produce only a single set of leaves per
wer (Trientalis borealis), bunchberry (Cornus canadensis) and
Finally, a few species are directly targeted by people for collection as edibles or for planting in
their gardens. Wild leek (Allium tricoccum) is often eaten, and orchids (Cypripedium ssp.) and
declining population trend and may become rare or even extirpated. Because of urbanization,
the total land base becomes smaller. Species that are considered rare according to the local
occurrence criterion are found in fewer than seven of the forty-four 10x10 km grid squares that
cover the TRCA jurisdiction. Some of these include slender woolly sedge, (Carex lasiocarpa), pink
wood sorrel (Oxalis montana), and pink pyrola (Pyrola asarifolia).
4.5 Fauna Species Findings for the Goodwood Resource Management Tract
4.5.1 Fauna Species Representation
Over the past decade the TRCA has documented a total of 70 bird species, 12 mammals, and 6 herpetofauna species for a total of 88 breeding fauna species. The vast majority of these species were reported from the extensive inventory conducted in 2005, with just a handful of species added as incidental observations made during the ongoing long-term monitoring project which established three forest stations at the GRMT in 2008. Refer to Appendix 3 for a list of the fauna species and their corresponding L-ranks. 4.5.2 Fauna Species of Concern
Fauna species, like vegetation communities and flora species, are considered of regional conservation concern if they rank L1 to L3 based on their scores for the seven criteria mentioned in Section 3.0. Since the subject site is situated within the rural zone this report does not consider in detail those species ranked as L4, i.e. those species that are of concern in urban landscapes. As with flora, this is a proactive, preventive approach, identifying where conservation efforts need to be made before a species becomes rare.

G o o d w o o d R e s o u r c e M a n a g e m e n t T r a c t
Januar y 2013
13
Fauna surveys at the GRMT reported a total of 31 L1 to L3 ranked bird species: 5 L2 species
(broad-winged hawk, Buteo platypterus; red-shouldered hawk, Buteo lineatus, northern goshawk,
Accipiter gentilis; black and white warbler, Mniotilta varia; and ruffed grouse, Bonasa umbellus)
and 26 L3 species (including magnolia warbler, Setophaga magnolia:; golden-crowned kinglet,
Regulus satrapa; and scarlet tanager, Piranga olivacea). In addition, there were 4 herpetofauna of
concern (all ranked L2) and 4 mammal species of concern (including two L2 species: river otter,
Lutra canadensis and porcupine, Erithizon dorsatum), bringing the total to 39 fauna species of
regional concern. Locations of these breeding fauna species are depicted on Map 13. Appendix 3
lists all of the fauna species reported from the study area, together with their associated ranks and
scores.
Table 5. Summary of Fauna Species of Regional Concern, Goodwood Resource
Management Tract
Fauna Number of Species Number of Species of Regional
Concern (L1 to L3 rank)
birds 70 31
herps 6 4
mammals 12 4
TOTALS 88 39
Local occurrence is one of seven scoring criteria for fauna species and is based on TRCA data
and information from the Natural Heritage Information Centre (NHIC) of the Ontario Ministry of
Natural Resources (OMNR) (NHIC 2008). Using local occurrence as a measure of regional rarity,
any species that is reported as a probable or confirmed breeder in fewer than 10 of the forty-four
10x10 km UTM grid squares in the TRCA jurisdiction is considered regionally rare (i.e. scores
three to five points for this criterion).
At the GRMT there are 14 species of regional concern (i.e. ranked L1 to L3) that are considered
regionally rare, including 6 species that have been reported from fewer than 5 of the jurisdictions
10 km squares: river otter, hairy-tailed mole (Parascalops breweri), red-shouldered hawk, northern
goshawk, hermit thrush (Catharus guttatus) and magnolia warbler (Setophaga magnolia). As is the
case with ora, most regionally rare fauna species have other associated factors that explain their
vulnerability and need to be taken into account in conservation strategies.
Sensitivity to development is another criterion used to determine the L-rank of fauna species. A
large number of impacts that result from local land use, both urban and agricultural, can affect the
local fauna. These impacts – considered separately from the issue of actual habitat loss – can be
divided into two distinct categories. The first category involves changes that arise from local
urbanization that directly affect the breeding habitat of the species in question. These changes
alter the composition and structure of the vegetation communities; for example, the clearing and
manicuring of the habitat (e.g. by removal of dead wood and clearance of shrub understorey). The
second category of impacts involves changes that directly affect individuals of the species in

G o o d w o o d R e s o u r c e M a n a g e m e n t T r a c t
Januar y 2013
14
question. Examples include increased predation from an increase in the local population of
predator species that thrive alongside human developments (e.g. blue jays, Cyanocitta cristata;
American crows, Corvus brachyrhynchos; squirrels, Sciuridae; raccoons, Procyon lotor; and house
cats, Felis catus); parasitism (from facilitating the access of brown-headed cowbirds, Molothrus
ater, a species which prefers more open, edge-type habitat); competition (for nest-cavities with
bird species such as house sparrows, Passer domesticus; and European starlings, Sturnus
vulgaris); flushing (causing disturbance and abandonment of nest) and, sensitivity to pesticides.
Fauna species are considered to have a high sensitivity to development if they score three or
more points (out of a possible five) for this criterion. At the GRMT all of the 39 species that are
ranked L1 to L3 receive this score and are therefore considered sensitive to one or more of the
impacts associated with development or intensification of public use (Map 6). These species are
currently at this site because the surrounding matrix is largely natural and agricultural, and public
use is relatively low and concentrated along a small number of formal trails.
The tendency for local urbanization to be accompanied by the clearing and tidying of woodlands
and thickets in the vicinity would dramatically disrupt any species that are dependent on such
scru
requirements (e.g. eastern towhee, Pipilo erythropthalmus; veery, Catharus fuscescens; white-
throated sparrow, Zonotrichia albicollis).
Several of the bird species found at the study area nest low in the ground vegetation or on the
ground and as such are highly susceptible both to increased predation from ground-foraging
predators (house cats, raccoons) and to repeated ushing from the nest (by pedestrians, off-trail
bikers and dogs) resulting in abandonment and failed breeding attempts. Such sensitive forest-
bird species include ovenbird (Seiurus aurocapillus), wild turkey (Meleagris gallopavo), American
woodcock (Scolopax mino), and ruffed grouse. In addition, open habitat species such as the L4
ranked field sparrow (Spizella pusilla) are ground-nesters and would likewise be severely affected
by any increase in pedestrian or dog traffic within their habitat.
Changes in the hydrology of the site will affect the suitability of the habitat for bird species - such
as veery and northern waterthrush (Parkesia noveboracensis) - that prefer more moist conditions.
The study area presently supports healthy populations of wood frogs (Rana sylvatica) and spring
peepers (Pseudacris crucifer) together with smaller populations of gray treefrogs (Hyla versicolor)
and western chorus frogs (Pseudacris triseriata). All of these species would be negatively affected
by any changes in hydrology that decrease the breeding opportunities within the site.
Higher ranked species are persisting at this site because the landscape is still entirely rural.
However, it is important to understand that negative matrix influences are not solely associated
with the proximity of urban and suburban developments; many of the negative influences can be
transferred deep within an otherwise intact natural matrix by extensive trail networks used by large
numbers of people originating from quite distant urban and suburban centres. Extensive public
use of a natural habitat can have substantial negative impact through the cumulative effects of
hiking, dog-walking and biking on the site. Similarly, clearing of forest understory to
accommodate trails will displace such sensitive species.
G o o d w o o d R e s o u r c e M a n a g e m e n t T r a c t
Januar y 2013
15
Various studies have shown that many bird species react negatively to human intrusion (i.e. the
mere presence of people) to the extent that nest-abandonment and decreased nest-attentiveness
lead to reduced reproduction and survival. One example of such a study showed that abundance
was 48% lower for hermit thrushes (a ground-nesting/foraging species) in intruded sites than in
the control sites (Gutzwiller and Anderson 1999). Elsewhere, a recent study reported that dog-
walking in natural habitats caused a 35% reduction in bird diversity and a 41% reduction in
abundance, with even higher impacts on ground-nesting species (Banks and Bryant 2007).
Area sensitivity is a scoring criterion that can be closely related to the issue of a species’ need for
isolation. Fauna species are scored for area sensitivity based on their requirement for a certain
minimum size of preferred habitat. Species that require large tracts of habitat (>100 ha in total)
score the maximum five points, while species that either show no minimum habitat requirement, or
require <1 ha in total, score one point. Species scoring three points or more (require ≥5 ha in
total) are deemed area sensitive species. Researchers have shown that for some species of birds,
area sensitivity is a rather fluid factor, dependent and varying inversely with the overall percentage
forest cover within the landscape surrounding the site where those species are found (Rosenburg
et al. 1999).
A total of 29 of the 39 fauna species of regional concern that occur at the GRMT are considered
area sensitive. Four of these species (river otter, broad-winged hawk, northern goshawk and red-
shouldered hawk) are scored as requiring more than 100 ha of natural habitat. This requirement is
with large tracts of forest to the north (including the extensive forest cover at Secord) provides
adequate forest cover at the landscape level to support populations of all of these area sensitive
species. A further eight fauna species (including porcupine, Erithizon dorsatum; ovenbird, scarlet
tanager and sharp-shinned hawk, Accipter striatus ) all require in excess of 20 ha of forest cover.
Species’ patch-size constraints are due to a variety of factors including foraging requirements and
the need for isolation within a habitat block during nesting. In the latter case, regardless of the
provision of a habitat patch of sufficient size, if that block is seriously and frequently disturbed by
human intrusion, such species will be liable to abandon the site. Such a variety of habitat needs
are more likely satisfied within a larger extent of natural cover. Many of the forest bird species
which are well-represented on the site benefit considerably from the extent of their potential
nesting habitat, ensuring that, despite some degree of disturbance from the small number of
visitors and dogs, there are currently probably enough successful nestings for populations of
these species to be maintained. This is particularly true of ground-nesting and foraging species
such as ovenbird, American woodcock, ruffed grouse and wild turkey, but also is very true of large
raptor species (northern goshawk, red-shouldered hawk, broad-winged hawk) that are extremely
prone to disturbance at the nest site.
Three non-avian species which certainly benefit from the extensive areas of natural cover at the
site are the frog species: gray treefrog, wood frog and spring peeper. These species are
considered area sensitive primarily due to their requirement for two distinct habitat elements in

G o o d w o o d R e s o u r c e M a n a g e m e n t T r a c t
Januar y 2013
16
order to complete their life-cycles. All three species overwinter in upland forested habitat and then
migrate to nearby wetlands in the early spring to breed, returning to forest habitats to forage
throughout the summer and fall months. The complex mosaic of wetlands embedded in meadow
and forest habitat presents excellent opportunities for these species of regional concern.
Patch isolation sensitivity in fauna measures the overall response of fauna species to
fragmentation and isolation of habitat patches. One of the two main aspects of this scoring
criterion is the physical ability or the predisposition of a species to move about within the
landscape and is related to the connectivity of habitat within a landscape. The second main
aspect is the potential impact that roads have on fauna species that are known to be mobile. Thus
most bird species score fairly low for this criterion (although they prefer to forage and move along
connecting corridors) whereas many herpetofauna score very high (since their life cycle requires
them to move between different habitat types which may increase likelihood of road-kill). One
example of how this criterion affects species populations is the need for adult birds to forage for
food during the nestling and fledgling stage of the breeding season. By maintaining and
improving the connectivity of natural cover within the landscape (e.g. by reforestation of
intervening lands) we are able to positively influence the populations of such species, improving
their foraging and dispersal potential.
Nine of the species of regional concern that occur at the GRMT score high for patch isolation
sensitivity: one bird species, four frog species and four mammal species. The frog species along
with the mammal species are highly mobile and susceptible to road-kill. The frog species migrate
seasonally between upland forest summer/winter habitat and vernal wetland spring breeding
habitat. Imposing higher vehicular traf c densities within the “home-range” of such dispersing frog
species will certainly lead to a higher incidence of road-kill. Likewise, mammal species such as
river otter and porcupine, move quite freely across the landscape and are therefore prone to a
higher incidence of road-kill as traffic density intensifies.
Species such as wood frog and spring peeper have effectively been extirpated from much of the
natural cover within the urbanized portions of the jurisdiction, but are still thriving in rural areas,
even where agriculture has fragmented much of the forest cover. As long as the total percentage
natural cover within the agricultural rural areas remains relatively high, and obstacles such as
heavily used roads do not proliferate, it appears that these frog species are still able to
successfully migrate and disperse between separate patches of forest and wetland.
Fauna species that score greater than three points under the habitat dependence criterion are
considered habitat specialists (Map 14). These species exhibit a combination of very specific
habitat requirements that range from the microhabitat (e.g. decaying logs, aquatic vegetation) and
requirements for particular moisture conditions, vegetation structure or spatial landscape
structures, to preferences for certain community series and macro-habitat types. Sixteen fauna
species that occur in the study area are considered habitat specialists.
Almost all of the habitat dependent species that occur at the GRMT are associated with forest
habitat, the only exception being western chorus frog. Mature deciduous or mixed forest is the

G o o d w o o d R e s o u r c e M a n a g e m e n t T r a c t
Januar y 2013
17
preferred forest type for the majority of the species (wild turkey has a very specific requirement for
mast-bearing trees – oak and beech) although the conifer plantations on the site provide nesting
opportunities for northern goshawk and sharp-shinned hawk. Many of the less habitat dependent
species also exhibit a preference for conifer plantations (hermit thrush and yellow-rumped warbler,
Setophaga coronata). Certainly, the large variety of forest habitats within the study area accounts
for the high forest-fauna biodiversity.
Specific habitat requirements vary from ovenbirds’ need for intact and healthy leaf litter and forest
floor debris, to northern goshawks’ need for mature trees and a degree of isolation. The common
requirement for many of the bird species is for mature upland forest; veery on the other hand,
fares well in more lowland, earlier succession forest types.
Wood frog and spring peeper bring the number of habitat dependent species occurring at the
GRMT to a total of 22. These two frog species are considered habitat dependent primarily due to
their absolute requirement for two distinct habitat types within the landscape: ephemeral wetlands
for breeding, and upland forest for foraging and hibernating. Deterioration of one of these two
elements within the landscape will result in the decline of these two species. Any changes to the
local habitat such as the age characteristics of a forest or changes in hydrology may negatively
impact species that are habitat specialists.
Representation is essentially the presence or absence of a species at a site. However, beyond
mere representation of single species is the idea that a natural system can be considered as a
healthy functioning system if there is an association of several species thriving within that system.
Each habitat type supports particular species associations. As the quality of the habitat patch
improves so will the representation of ora and fauna species within that habitat. In this way
representative biodiversity is an excellent measure of the health of a natural system. The presence
at the GRMT of many habitat dependent species, in particular species that are dependent on
mature forest, indicates that the forest habitat is functioning at a high level. Representation of
many of these species is particularly high – 12 black-throated green warbler (Setophaga virens)
territories, 24 ovenbird territories, 17 veery territories – which constitutes further indication of the
quality of the natural system at the GRMT (and within the surrounding landscape).
5.0 Summary and Recommendations
The recommendations for the GRMT are given in relation to the regional targets for natural
heritage in the TRCA jurisdiction. To reach the regional targets for quality distribution and quantity
of natural cover, every site will require its own individualized plan of action. Following is a short
summary of the GRMT within the regional context, followed by specific recommendations.

G o o d w o o d R e s o u r c e M a n a g e m e n t T r a c t
Januar y 2013
18
5.1 Site Summary
1. The GRMT is a large block of natural cover (~128ha) in the Duffins Creek watershed; it is part of a larger forest network to the north and east.
2. The natural cover on the site supports an above average number of species that are of conservation concern in the TRCA jurisdiction.
3. Sixty vegetation types were observed, ranging from forest and swamp to submerged aquatic communities. The site includes 24 forest, 10 successional, 21 wetland, 2 aquatic, and 3 meadow vegetation community types.
4. The diversity of flora species remains relatively high at GRMT; this is primarily attributed
to the wide range of vegetation communities, soil types, and community ages that exist at the site. A total of 321 flora species (including 73 flora species of concern (ranked L1 to L3) were observed between 2007 to 2012. The vast majority (80%) were native in origin.
5. A high total of 88 vertebrate fauna species have been documented at the GRMT over
the past decade with 39 of these being species of conservation concern – a total which compares favourably to several other larger rural sites within the jurisdiction.
6. Twenty-nine area sensitive fauna species were identified on site, four of which require
in excess of 100 ha of natural cover including three large hawk species: northern goshawk, red-shouldered hawk and broad-winged hawk. The only other site within the region that accommodates all three large hawk species is the considerably more extensive forest complex at Glen Major.
7. One Species at Risk has been documented for the study area – a small population of
western chorus frogs was reported from one of the forest wetland pools in 2005.
5.2 Site Recommendations
In order to maintain a healthy level of biodiversity at the GRMT, the overall integrity of the natural
heritage system that includes the site must be protected. Therefore, habitat patch size and shape
needs to be optimized so as to provide large enough habitat patches with interior habitat to
support sensitive flora and fauna sustainably. In addition, connectivity between natural habitats
within and beyond the study area must be improved.
The following recommendations address the above natural heritage concerns, with an emphasis
upon bolstering the existing high-quality features on site. Thus, we recommend overall that 1)
existing habitats and features be protected and enhanced; 2) that public use be managed; and 3)
that invasive species be controlled.
1. Protect and Enhance Existing Features

G o o d w o o d R e s o u r c e M a n a g e m e n t T r a c t
Januar y 2013
19
The first priority should be to focus on maintaining conditions that allow existing
communities or species of conservation concern to thrive.
a. Management zones should be delineated for the study area in the management
plan that emphasizes protection of existing natural heritage features, i.e. vegetation
communities, and plant or animal species of high conservation rank.
b. The high quality forest fauna and flora communities are best protected by setting
aside large areas of the property where trail access is completely restricted,
allowing such areas to provide multiple opportunities for sensitive species to
flourish, potentially acting as source populations for the wider local landscape.
c. Although the GRMT has limited opportunities for large scale restoration there are
situations where gaps in the forest cover may provide small scale opportunities.
However, it is important to note that small gaps within a forest system provide
specific nesting and foraging opportunities for a whole suite of species that are not
best served by a continuous canopy (see (d) below).
d. Judicious management of the existing conifer plantations, including thinning and
gap-creation, will provide a wide variety of niche habitats which will accommodate a
number of habitat-dependent species which are currently excluded by the rather
uniform structure of the plantations.
e. Areas selected for restoration should have soil and moisture assessment in order to
help determine suitable lists of species for planting.
f. Ensure effective and adequate passage (e.g. tunnels) for amphibians and
mammals across or under roads and trails particularly any that cross wetlands; for
example, when the roads bordering the site create an obstruction for animals using
adjacent wetlands.
2. Manage Public Use
Although landscape metrics indicate that the matrix influence at this rural site is largely
positive, this does not take into account the disturbance that occurs along the extensive
network of roads and trails. Visitor pressure is likely to increase and it is important to pre-
empt any potential increase in user pressure by designing the trail network to
minimize negative impacts on sensitive forest species.
a. Any future trail planning needs to consider the locations of flora and fauna species
of concern and to direct visitor pressure away from these areas. Likewise,
restoration activities should target non-sensitive areas.

G o o d w o o d R e s o u r c e M a n a g e m e n t T r a c t
Januar y 2013
20
b. Installation of board-walks, where possible, as opposed to typical ground-borne
trails should be considered as a means of protecting the sensitive flora and fauna
species that occur throughout the various habitat patches on the site.
c. Dogs should be either excluded from the site or, at the very least; the leash-by-law
should be properly enforced, bolstered by effective interpretive signs, and
occasional enforcement staff patrols.
d. Discourage negative and destructive behaviours/activities by site users (i.e.
harvesting of sensitive flora, going off-trail) through the use of educational signage
and/or possible fines.
3. Control Invasive Species
It is essential that well-planned and realistic measures be undertaken to control
invasive species. A few invasive plant species pose a considerable threat to the native
biodiversity at the GRMT. Management for these invasive species will need to be tailored to
the individual species and will depend on how wide-spread and established they are.
a. The highest-priority invasive species at the GRMT are buckthorn, Manitoba maple,
reed canary grass, purple loosestrife, dog-strangling vine, and Scots pine. Of the
species listed, buckthorn and Manitoba maple are the most pervasive of the
forested communities while reed canary grass and purple loosestrife have infiltrated
most of the wetland and moist meadow areas across the site. Small patches of
these species may be managed through mechanical and/or chemical control but
larger, well-established populations may require a more integrated and long-term
approach.
b. Existing Scots pine plantations are in close proximity to hardwood and mixed forest
seed sources; consider the possibility of converting these exotic communities to a
more natural mixed or hardwood forest. To facilitate the natural succession
process, the more densely spaced plantations can be selectively thinned to allow
desirable native tree species such as paper birch, sugar maple and basswood to
move into the understorey (via natural processes or through active plantings).
Where feasible, efforts should also focus on controlling the regeneration and further
spread of these highly prolific exotics into the surrounding landscape through the
selective removal of all seedlings, saplings and seed producing plants from
adjacent field and meadow communities.
c. Invasive species control should be undertaken as a proactive measure prior to
planting around any fields that are being targeted for restoration. This would

G o o d w o o d R e s o u r c e M a n a g e m e n t T r a c t
Januar y 2013
21
include removal of Manitoba maple (Acer negundo) along with the other priority
species.

G o o d w o o d R e s o u r c e M a n a g e m e n t T r a c t
Januar y 2013
22
6.0 References Banks P.B. and Bryant J.V. 2007. Four-legged friend or foe? Dog walking displaces native
birds from natural areas. Biology Letters (2007) 3. 611-613. Available on-line at:
http://rsbl.royalsocietypublishing.org/content/3/6/611.full.pdf [Accessed 8 January 2010].
Cadman M.D., Sutherland D.A., Beck G.G., Lepage D., and Couturier A.R. (eds). 2007. Atlas of
the Breeding Birds of Ontario, 2001 – 2005. Bird Studies Canada, Environment Canada, Ontario Field Ornithologists, Ontario Ministry of Natural Resources, and Ontario Nature, Toronto, xxii + 706pp.
Gutzwiller K.J. and Anderson S.H. 1999. Spatial extent of human-intrusion effects on subalpine
bird distributions. Condor 101:378-389.
Kilgour B. 2003. Landscape and patch character as a determinant of occurrence of eighty
selected bird species in the Toronto area. A report prepared for the TRCA. Jacques-
Whitford Ltd.,2003
Lee H., Bakowsky W.D., Riley J., Bowles J., Puddister M., Uhlig P. and McMurray S. 1998.
Ecological land classification for southern Ontario: first approximation and its
application. Peterborough, Ontario: Ontario Ministry of Natural Resources, Southcentral
Science Section, Science Development and Transfer Branch.
OMNR [Ontario Ministry of Natural Resources]. 1999. Provincially Significant Eaton Hall-Mary-
Hackett Lakes Wetland Complex, Aurora, Ontario: Ontario Ministry of Natural Resources.
NHIC [Ontario Natural Heritage Information Centre] 2008. Natural Heritage Information website.
Available on-line at: http://nhic.mnr.gov.on.ca/nhic_.cfm [Accessed 14 February 2011].
Newman, R.M. and Biesboer, D.D. 2000. A decline of Eurasian watermilfoil associated with the
milfoil weevil, Euhrychiopis lecontei. J. Aquatic Plant Management 38: 105-111.
Oak Ridges Moraine Foundation. 2011. Achievements in Land Stewardship since the
Establishment of the Oak Ridges Moraine Foundation. King City, Ontario: Oak Ridges
Moraine Foundation. Available on-line at:
http://www.moraineforlife.org/resources/documents/05_ORMF-LandStewardshipReport-
WEB.pdf [Accessed 5 January 2012].
Rosenburg K.V., Rohrbaugh R.W. Jr., Barker S.E., Hames R.S. and Dhondt A.A. 1999. A land
manager’s guide to improving habitat for scarlet tanagers and other forest-interior
birds. Ithaca, NY: The Cornfell Lab of Ornithology.

G o o d w o o d R e s o u r c e M a n a g e m e n t T r a c t
Januar y 2013
23
TRCA 2007a. The Terrestrial Natural Heritage System Strategy. Toronto Region Conservation
Authority.
TRCA 2007b. Setting Terrestrial Natural Heritage System Targets. Toronto Region Conservation
Authority.
TRCA 2007c. Evaluating and Designing Terrestrial Natural Heritage Systems. Toronto Region
Conservation Authority.
TRCA 2007d. Terrestrial Natural Heritage Program Data Collection Methodology. Toronto
Region Conservation Authority.
TRCA 2008. Dog-strangling vine – Cynanchum rossicum (Kleopow) Borhidi: a review of
distribution, ecology and control of this invasive plant. Toronto and Region
Conservation Authority and Rouge Park. Available on-line at:
http://www.rougepark.com/unique/reports.php [Accessed 6 January 2012].
TRCA 2010. Vegetation Community and Species Ranking and Scoring method. Toronto
Region Conservation Authority.
TRCA 2012. Scarborough Shoreline: terrestrial biological inventory and assessment. Toronto
Region Conservation Authority.
Watchorn M.A., Hamilton P.B., Anderson T.W., Roe H.M. and Patterson R.T. 2008. Diatoms and
pollen as indicators of water quality and land-use change: a case study from the Oak
Ridges Moraine, Southern Ontario, Canada. J Paleolimnology 39: 491–509.


Appendix 1: List of Vegetation Communities at Goodwood Resource Management Tract (2005)
Tot. Localarea Local Geophy. Total Rank
# ha Occur. Requir. Score (2012-08)
ForestFOM4-2 Dry-Fresh White Cedar - Poplar Mixed Forest 0.6 3.0 2.0 5.0 L3FOM6-2 Fresh-Moist Hemlock - Hardwood Mixed Forest 1.0 2.0 3.0 5.0 L3FOC2-2 Dry-Fresh White Cedar Coniferous Forest 1.2 2.5 2.0 4.5 L4FOC3-1 Fresh-Moist Hemlock Coniferous Forest 0.0 2.5 2.0 4.5 L4FOC4-1 Fresh-Moist White Cedar Coniferous Forest 2.8 2.0 2.0 4.0 L4FOM7-2 Fresh-Moist White Cedar - Hardwood Mixed Forest 5.2 1.5 2.0 3.5 L4FOD3-1 Dry-Fresh Poplar Deciduous Forest 0.9 2.0 2.0 4.0 L4FOD3-2 Dry-Fresh Paper Birch Deciduous Forest 0.4 2.5 1.0 3.5 L4FOD4-G Dry-Fresh Basswood Deciduous Forest 0.4 3.0 0.0 3.0 L4FOD5-10 Dry-Fresh Sugar Maple - Paper Birch - Poplar Deciduous Forest 1.2 2.5 1.0 3.5 L4FOD5-1 Dry-Fresh Sugar Maple Deciduous Forest 8.8 1.5 0.0 1.5 L5FOD6-5 Fresh-Moist Sugar Maple - Hardwood Deciduous Forest 1.7 1.5 0.0 1.5 L5FOD8-1 Fresh-Moist Poplar Deciduous Forest 1.6 1.0 0.0 1.0 L5CUP1-1 Sugar Maple Deciduous Plantation 0.3 4.0 0.0 4.0 L5CUP3-1 Red Pine Coniferous Plantation 24.8 1.5 0.0 1.5 L5CUP3-2 White Pine Coniferous Plantation 15.2 1.5 0.0 1.5 L5CUP3-C White Spruce Coniferous Plantation 4.6 2.0 0.0 2.0 L5CUP3-G White Cedar Coniferous Plantation 2.9 2.5 0.0 2.5 L5FOD4-b Dry-Fresh Manitoba Maple Deciduous Forest 0.0 2.5 0.0 2.5 L+FOD7-c Fresh-Moist Exotic Lowland Deciduous Forest 0.8 2.5 0.0 2.5 L+CUP1-c Black Locust Deciduous Plantation 0.5 2.0 0.0 2.0 L+CUP2-b Black Locust - Conifer Mixed Plantation 0.3 3.0 0.0 3.0 L+CUP3-3 Scotch Pine Coniferous Plantation 3.5 2.0 0.0 2.0 L+CUP3-e Norway Spruce Coniferous Plantation 0.6 2.0 0.0 2.0 L+
SuccessionalCUT1-3 Chokecherry Deciduous Thicket 0.8 4.0 0.0 4.0 L4CUT1-A3 Coniferous Sapling Regeneration Thicket 4.3 2.5 1.0 3.5 L4CUS1-A2 White Pine Successional Savannah 0.8 2.5 1.0 3.5 L4CUW1-A1 White Cedar Successional Woodland 0.7 2.5 1.0 3.5 L4CUT1-1 Sumac Deciduous Thicket 0.0 2.0 0.0 2.0 L5CUS1-A1 Native Deciduous Successional Savannah 0.8 1.5 0.0 1.5 L5CUW1-A3 Native Deciduous Successional Woodland 1.0 1.0 0.0 1.0 L5CUT1-b Buckthorn Deciduous Thicket 0.0 2.5 0.0 2.5 L+CUS1-b Exotic Successional Savannah 1.6 2.0 0.0 2.0 L+CUW1-b Exotic Successional Woodland 0.5 1.5 0.0 1.5 L+
ELC Code
ScoresVegetation Type
(* indicates present as inclusion and/or complex only)
Page 37

Appendix 1: List of Vegetation Communities at Goodwood Resource Management Tract (2005)
Tot. Localarea Local Geophy. Total Rank
# ha Occur. Requir. Score (2012-08)
ELC Code
ScoresVegetation Type
(* indicates present as inclusion and/or complex only)
WetlandSWCA-A Hemlock Organic Coniferous Swamp 0.0 3.5 3.0 6.5 L2MAM3-1 Bluejoint Organic Meadow Marsh 0.5 3.5 3.0 6.5 L2MAS3-2 Bulrush Organic Shallow Marsh 0.1 4.0 3.0 7.0 L2MAS3-4 Broad-leaved Sedge Organic Shallow Marsh 0.0 4.0 3.0 7.0 L2MAS3-C Manna Grass Organic Shallow Marsh 0.0 4.0 3.0 7.0 L2SWM4-1 White Cedar - Hardwood Organic Mixed Swamp 9.0 2.0 3.0 5.0 L3SWM6-1 Birch - Conifer Organic Mixed Swamp 0.0 2.5 3.0 5.5 L3SWD5-1 Black Ash Organic Deciduous Swamp 0.0 3.0 3.0 6.0 L3SWT3-1 Alder Organic Thicket Swamp 0.8 3.0 3.0 6.0 L3MAM3-9 Forb Organic Meadow Marsh 2.0 3.0 3.0 6.0 L3MAS3-1A Broad-leaved Cattail Organic Shallow Marsh 0.3 2.5 3.0 5.5 L3SWM1-1 White Cedar - Hardwood Mineral Mixed Swamp 4.3 2.5 2.0 4.5 L4SWD4-3 Paper Birch - Poplar Mineral Deciduous Swamp 0.7 2.0 2.0 4.0 L4SWT2-5 Red-osier Mineral Thicket Swamp 0.3 2.0 2.0 4.0 L4MAM2-3 Red-top Mineral Meadow Marsh 0.1 3.0 0.0 3.0 L4MAM2-10 Forb Mineral Meadow Marsh 1.7 2.0 1.0 3.0 L4MAS2-1A Broad-leaved Cattail Mineral Shallow Marsh 0.1 2.0 1.0 3.0 L4MAS2-2 Bulrush Mineral Shallow Marsh 0.9 3.0 1.0 4.0 L4MAS2-9 Forb Mineral Shallow Marsh 0.1 2.5 1.0 3.5 L4MAM2-2 Reed Canary Grass Mineral Meadow Marsh 3.2 1.0 1.0 2.0 L+MAS2-1b Narrow-Leaved Cattail Mineral Shallow Marsh 0.2 2.0 0.0 2.0 L+
AquaticSAF1-3 Duckweed Floating-leaved Shallow Aquatic 0.0 2.5 1.0 3.5 L4OAO1 Open Aquatic (deep or riverine unvegetated) 1.6 2.0 0.0 2.0 L5
MeadowCUM1-A Native Forb Meadow 11.8 1.5 0.0 1.5 L5CUM1-b Exotic Cool-season Grass Graminoid Meadow 0.0 1.0 0.0 1.0 L+CUM1-c Exotic Forb Meadow 0.0 1.5 0.0 1.5 L+
Page 38

Appendix 2: Goodwood Resource Management Tract Flora Species (2005 - 2012)Local Popn. Hab. Sens. Total Rank
Occur. Trend Dep. Dev. Score TRCA Scientific Name Common Name 1-5 1-5 0-5 0-5 2-20 (08/2012)
Carex lasiocarpa slender woolly sedge 3 4 5 5 17 L2Coptis trifolia goldthread 2 5 5 5 17 L2Cornus canadensis bunchberry 3 5 5 5 18 L2Cypripedium reginae showy lady's slipper 3 4 5 5 17 L2Dulichium arundinaceum three-way sedge 3 4 5 5 17 L2Eriophorum viridicarinatum thin-leaved cotton-grass 4 4 5 5 18 L2Oxalis montana pink wood sorrel 4 4 5 4 17 L2Pyrola asarifolia pink pyrola 3 4 5 5 17 L2Acorus americanus sweet flag 3 3 5 4 15 L3Agrostis scabra ticklegrass 3 3 4 4 14 L3Alnus incana ssp. rugosa speckled alder 1 4 4 5 14 L3Anaphalis margaritacea pearly everlasting 3 4 4 3 14 L3Anemone acutiloba sharp-lobed hepatica 1 4 4 5 14 L3Anemone cylindrica long-fruited thimbleweed 3 4 3 4 14 L3Botrychium virginianum rattlesnake fern 2 5 4 5 16 L3Bromus ciliatus fringed brome grass 2 4 4 5 15 L3Carex albursina white bear sedge 2 3 5 4 14 L3Carex atherodes awned sedge 3 3 5 4 15 L3Carex comosa bristly sedge 3 3 5 4 15 L3Carex disperma two-seeded sedge 2 3 5 4 14 L3Carex flava yellow sedge 3 3 5 4 15 L3Carex interior fen star sedge 2 4 4 4 14 L3Carex laevivaginata smooth-sheathed sedge 2 4 4 4 14 L3Carex leptalea bristle-stalked sedge 2 3 5 4 14 L3Carex plantaginea plantain-leaved sedge 2 4 5 4 15 L3Carex tuckermanii Tuckerman's sedge 2 4 4 4 14 L3Carex utriculata beaked sedge 2 3 4 5 14 L3Chelone glabra turtlehead 2 3 4 5 14 L3Circaea alpina smaller enchanter's nightshade 2 4 5 4 15 L3Claytonia caroliniana broad-leaved spring beauty 2 4 5 5 16 L3Claytonia virginica narrow-leaved spring beauty 2 4 4 5 15 L3Clintonia borealis bluebead lily 2 5 4 5 16 L3Cypripedium parviflorum var. makasin smaller yellow lady's slipper 2 4 4 5 15 L3Cystopteris tenuis Mackay's fragile fern 2 4 5 5 16 L3Dicentra canadensis squirrel-corn 2 4 5 4 15 L3
Page 39

Appendix 2: Goodwood Resource Management Tract Flora Species (2005 - 2012)Local Popn. Hab. Sens. Total Rank
Occur. Trend Dep. Dev. Score TRCA Scientific Name Common Name 1-5 1-5 0-5 0-5 2-20 (08/2012)
Dicentra cucullaria Dutchman's breeches 2 4 4 5 15 L3Epilobium leptophyllum narrow-leaved willow-herb 2 5 4 4 15 L3Equisetum fluviatile water horsetail 2 4 5 4 15 L3Equisetum scirpoides dwarf scouring-rush 2 4 5 5 16 L3Geum rivale water avens 3 4 5 4 16 L3Glyceria borealis northern manna grass 2 3 5 5 15 L3Glyceria septentrionalis eastern manna grass 2 3 5 4 14 L3Gymnocarpium dryopteris oak fern 1 3 5 5 14 L3Hydrocotyle americana marsh pennywort 2 4 4 4 14 L3Hypericum ascyron great St. John's-wort 3 4 5 2 14 L3Hypopitys monotropa pinesap 2 4 5 5 16 L3Juglans cinerea butternut 1 5 4 4 14 L3Juniperus communis var. depressa common juniper 2 3 4 5 14 L3Larix laricina tamarack 2 4 4 4 14 L3Liparis loeselii Loesel's twayblade 2 3 5 5 15 L3Lobelia siphilitica great blue lobelia 2 3 4 5 14 L3Mitchella repens partridgeberry 2 4 4 5 15 L3Mitella diphylla mitrewort 2 3 4 5 14 L3Mitella nuda naked mitrewort 2 4 5 5 16 L3Monotropa uniflora Indian-pipe 2 4 5 5 16 L3Osmunda regalis var. spectabilis royal fern 2 4 5 5 16 L3Osmundastrum cinnamomeum cinnamon fern 2 4 5 5 16 L3
Phegopteris connectilis northern beech fern 2 3 5 5 15 L3Picea glauca white spruce 1 5 4 4 14 L3Pilea fontana spring clearweed 2 4 4 4 14 L3Poa alsodes grove meadow grass 3 3 5 3 14 L3Poa saltuensis ssp. languida languid spear grass 5 2 4 3 14 L3Ribes triste swamp red currant 2 4 4 5 15 L3Rumex britannica great water dock 3 3 4 4 14 L3Salix lucida shining willow 2 4 5 3 14 L3Sisyrinchium montanum blue-eyed grass 2 3 4 5 14 L3Streptopus lanceolatus var. lanceolatus rose twisted-stalk 2 4 4 5 15 L3Symphyotrichum urophyllum arrow-leaved aster 3 3 4 4 14 L3Taxus canadensis Canada yew 1 4 4 5 14 L3
Page 40

Appendix 2: Goodwood Resource Management Tract Flora Species (2005 - 2012)Local Popn. Hab. Sens. Total Rank
Occur. Trend Dep. Dev. Score TRCA Scientific Name Common Name 1-5 1-5 0-5 0-5 2-20 (08/2012)
Trientalis borealis star-flower 1 4 4 5 14 L3Uvularia grandiflora large-flowered bellwort 1 4 5 5 15 L3Verbena stricta hoary vervain 3 5 4 4 16 L3Viola canadensis Canada violet 2 4 4 4 14 L3Abies balsamea balsam fir 1 3 4 5 13 L4Acer rubrum red maple 2 4 1 5 12 L4Acer spicatum mountain maple 2 3 4 4 13 L4Actaea pachypoda white baneberry 2 3 4 3 12 L4Allium tricoccum wild leek 1 3 4 4 12 L4Amelanchier interior hybrid serviceberry complex 3 3 3 3 12 L4Antennaria howellii ssp. howellii Howell's pussytoes 3 2 3 3 11 L4Apocynum androsaemifolium spreading dogbane 2 3 2 4 11 L4Aquilegia canadensis wild columbine 1 4 3 5 13 L4Asarum canadense wild ginger 2 3 4 3 12 L4Asclepias incarnata ssp. incarnata swamp milkweed 2 3 4 4 13 L4Betula alleghaniensis yellow birch 1 4 3 5 13 L4Betula papyrifera paper birch 1 4 2 4 11 L4Bidens vulgata tall beggar's-ticks 3 2 3 4 12 L4Calamagrostis canadensis Canada blue joint 2 3 4 4 13 L4Caltha palustris marsh marigold 2 4 3 4 13 L4Cardamine diphylla broad-leaved toothwort 2 3 4 4 13 L4Cardamine pensylvanica bitter cress 3 2 4 4 13 L4Carex arctata nodding wood sedge 2 4 2 3 11 L4Carex bromoides brome-like sedge 3 3 4 3 13 L4Carex communis fibrous-rooted sedge 2 4 3 3 12 L4Carex deweyana Dewey's sedge 2 4 3 3 12 L4Carex gracillima graceful sedge 2 3 4 2 11 L4Carex hystericina porcupine sedge 2 3 2 5 12 L4Carex intumescens bladder sedge 2 4 4 2 12 L4Carex lacustris lake-bank sedge 2 3 3 4 12 L4Carex laxiflora loose-flowered sedge 2 3 4 3 12 L4Carex lupulina hop sedge 1 4 4 4 13 L4Carex peckii Peck's sedge 2 3 4 3 12 L4Carex pedunculata early-flowering sedge 2 3 3 3 11 L4Carex pensylvanica Pennsylvania sedge 2 4 3 4 13 L4
Page 41

Appendix 2: Goodwood Resource Management Tract Flora Species (2005 - 2012)Local Popn. Hab. Sens. Total Rank
Occur. Trend Dep. Dev. Score TRCA Scientific Name Common Name 1-5 1-5 0-5 0-5 2-20 (08/2012)
Carex projecta necklace sedge 3 2 4 3 12 L4Carex retrorsa retrorse sedge 1 3 3 4 11 L4Carex scabrata rough sedge 2 3 4 3 12 L4Carex sparganioides bur-reed sedge 2 2 5 2 11 L4Carex stricta tussock sedge 2 3 3 4 12 L4Caulophyllum giganteum long-styled blue cohosh 1 3 4 4 12 L4Cicuta bulbifera bulblet-bearing water-hemlock 2 3 4 3 12 L4Cystopteris bulbifera bulblet fern 1 3 4 4 12 L4Dryopteris cristata crested wood fern 1 4 4 4 13 L4Dryopteris intermedia evergreen wood fern 2 4 4 3 13 L4Dryopteris marginalis marginal wood fern 1 3 3 4 11 L4Eupatorium perfoliatum boneset 1 3 4 3 11 L4Eurybia macrophylla big-leaved aster 2 3 2 4 11 L4Fagus grandifolia American beech 1 4 3 4 12 L4Fraxinus nigra black ash 1 4 4 3 12 L4Galium asprellum rough bedstraw 3 2 4 2 11 L4Glyceria grandis tall manna grass 2 3 4 2 11 L4Juncus articulatus jointed rush 3 2 4 2 11 L4Lycopus americanus cut-leaved water-horehound 1 4 3 3 11 L4Lycopus uniflorus northern water-horehound 2 3 3 3 11 L4Maianthemum canadense Canada May-flower 1 4 1 5 11 L4Mimulus ringens square-stemmed monkey-flower 2 3 3 4 12 L4Myosotis laxa smaller forget-me-not 2 4 3 4 13 L4Oryzopsis asperifolia white-fruited mountain-rice 2 4 3 4 13 L4Osmorhiza claytonii woolly sweet cicely 2 3 4 3 12 L4Persicaria amphibia swamp smartweed (sensu lato) 2 3 4 4 13 L4Polygonatum pubescens downy Solomon's seal 1 4 2 5 12 L4Polystichum acrostichoides Christmas fern 1 3 5 4 13 L4Populus grandidentata large-toothed aspen 1 3 4 3 11 L4Pteridium aquilinum var. latiusculum eastern bracken 2 4 2 4 12 L4Pyrola elliptica shinleaf 1 4 4 4 13 L4Rubus pubescens dwarf raspberry 2 3 3 5 13 L4Rudbeckia hirta black-eyed Susan 1 4 4 3 12 L4Sagittaria latifolia common arrowhead 2 2 5 4 13 L4Salix amygdaloides peach-leaved willow 1 2 5 3 11 L4
Page 42

Appendix 2: Goodwood Resource Management Tract Flora Species (2005 - 2012)Local Popn. Hab. Sens. Total Rank
Occur. Trend Dep. Dev. Score TRCA Scientific Name Common Name 1-5 1-5 0-5 0-5 2-20 (08/2012)
Salix bebbiana Bebb's willow 2 3 3 4 12 L4Salix petiolaris slender willow 2 3 5 3 13 L4Schizachne purpurascens purple melic grass 2 3 3 5 13 L4Schoenoplectus tabernaemontani soft-stemmed bulrush 1 2 5 3 11 L4Scirpus cyperinus woolly bulrush 1 3 4 5 13 L4Sium suave water-parsnip 2 2 4 4 12 L4Solidago rugosa ssp. rugosa rough-stemmed goldenrod 3 3 2 3 11 L4Spiraea alba wild spiraea 2 4 4 3 13 L4Thelypteris palustris var. pubescens marsh fern 2 4 2 4 12 L4Thuja occidentalis white cedar 1 4 1 5 11 L4Tiarella cordifolia foam-flower 1 3 3 4 11 L4Trillium erectum red trillium 1 4 3 5 13 L4Trillium grandiflorum white trillium 1 3 4 5 13 L4Tsuga canadensis eastern hemlock 1 4 3 5 13 L4Typha latifolia broad-leaved cattail 1 4 4 4 13 L4Veronica americana American speedwell 2 3 4 4 13 L4Acer saccharum sugar maple 2 3 0 2 7 L5Actaea rubra ssp. rubra red baneberry 2 3 1 3 9 L5Agrimonia gryposepala agrimony 2 2 0 2 6 L5Anemone canadensis Canada anemone 2 2 2 2 8 L5Anemone virginiana common thimbleweed 3 3 0 3 9 L5Aralia nudicaulis wild sarsaparilla 2 3 1 4 10 L5Arisaema triphyllum Jack-in-the-pulpit 1 3 2 3 9 L5Asclepias syriaca common milkweed 2 2 0 2 6 L5Athyrium filix-femina var. angustum northeastern lady fern 2 3 1 3 9 L5Bidens cernua nodding bur-marigold 2 2 3 3 10 L5Bidens frondosa common beggar's-ticks 2 1 4 0 7 L5Carex cristatella crested sedge 2 2 4 1 9 L5Carex radiata straight-styled sedge 2 2 2 2 8 L5Carex rosea curly-styled sedge 2 2 3 2 9 L5Carex stipata awl-fruited sedge 2 3 2 3 10 L5Carex vulpinoidea fox sedge 2 2 4 1 9 L5Circaea canadensis ssp. canadensis enchanter's nightshade 2 1 1 1 5 L5Clematis virginiana virgin's bower 2 2 2 3 9 L5Cornus alternifolia alternate-leaved dogwood 2 2 1 2 7 L5
Page 43

Appendix 2: Goodwood Resource Management Tract Flora Species (2005 - 2012)Local Popn. Hab. Sens. Total Rank
Occur. Trend Dep. Dev. Score TRCA Scientific Name Common Name 1-5 1-5 0-5 0-5 2-20 (08/2012)
Cornus stolonifera red osier dogwood 2 2 0 3 7 L5Dryopteris carthusiana spinulose wood fern 2 3 2 2 9 L5Elymus virginicus var. virginicus Virginia wild rye 3 2 3 2 10 L5Equisetum arvense field horsetail 2 2 1 1 6 L5Equisetum hyemale ssp. affine scouring-rush 2 2 2 2 8 L5Erigeron annuus daisy fleabane 2 2 0 1 5 L5Erigeron philadelphicus var. philadelphicus Philadelphia fleabane 3 2 0 1 6 L5Erythronium americanum ssp. americanum yellow trout-lily 2 3 3 2 10 L5Euthamia graminifolia grass-leaved goldenrod 2 1 4 1 8 L5Eutrochium maculatum var. maculatum spotted Joe-Pye weed 2 2 3 3 10 L5Fragaria virginiana wild strawberry 2 2 0 2 6 L5Fraxinus americana white ash 2 2 0 3 7 L5Fraxinus pennsylvanica red ash 1 2 0 3 6 L5Geum canadense white avens 2 2 1 2 7 L5Glyceria striata fowl manna grass 2 2 1 2 7 L5Hackelia virginiana Virginia stickseed 2 2 0 2 6 L5Hydrophyllum virginianum Virginia waterleaf 2 2 1 2 7 L5Impatiens capensis orange touch-me-not 2 2 0 2 6 L5Juncus dudleyi Dudley's rush 2 2 3 1 8 L5Juncus tenuis path rush 3 2 1 1 7 L5Laportea canadensis wood nettle 2 3 2 2 9 L5Leersia oryzoides rice cut grass 2 2 3 2 9 L5Lemna minor common duckweed 2 2 4 2 10 L5Lysimachia ciliata fringed loosestrife 2 2 2 2 8 L5Maianthemum racemosum ssp. racemosum false Solomon's seal 2 3 2 3 10 L5Maianthemum stellatum starry false Solomon's seal 2 2 1 3 8 L5Matteuccia struthiopteris var. pensylvanica ostrich fern 2 2 2 2 8 L5Mentha arvensis ssp. borealis wild mint 2 2 3 2 9 L5Muhlenbergia mexicana var. mexicana common muhly grass 3 2 0 1 6 L5Nabalus altissimus tall wood lettuce 3 3 2 2 10 L5Oenothera biennis common evening-primrose 2 1 1 1 5 L5Onoclea sensibilis sensitive fern 2 3 1 3 9 L5Ostrya virginiana ironwood 2 3 2 2 9 L5Oxalis stricta common yellow wood-sorrel 5 1 1 1 8 L5Parthenocissus inserta thicket creeper 2 2 0 1 5 L5
Page 44

Appendix 2: Goodwood Resource Management Tract Flora Species (2005 - 2012)Local Popn. Hab. Sens. Total Rank
Occur. Trend Dep. Dev. Score TRCA Scientific Name Common Name 1-5 1-5 0-5 0-5 2-20 (08/2012)
Persicaria lapathifolia pale smartweed 3 1 4 0 8 L5Physalis heterophylla clammy ground-cherry 2 2 3 3 10 L5Plantago rugelii red-stemmed plantain 3 2 0 1 6 L5Populus balsamifera balsam poplar 2 2 3 2 9 L5Populus deltoides cottonwood 2 1 4 1 8 L5Populus tremuloides trembling aspen 2 3 1 3 9 L5Prunus serotina black cherry 2 2 0 2 6 L5Prunus virginiana var. virginiana choke cherry 2 2 0 1 5 L5Ranunculus abortivus kidney-leaved buttercup 2 3 1 2 8 L5Rhus typhina staghorn sumach 2 1 2 2 7 L5Ribes americanum wild black currant 2 3 2 2 9 L5Ribes cynosbati prickly gooseberry 2 3 2 2 9 L5Rubus idaeus ssp. strigosus wild red raspberry 1 1 0 1 3 L5Rubus odoratus purple-flowering raspberry 2 2 2 2 8 L5Salix eriocephala narrow heart-leaved willow 2 1 3 1 7 L5Sambucus racemosa ssp. pubens red-berried elder 2 3 2 2 9 L5Sanguinaria canadensis bloodroot 2 3 0 3 8 L5Scirpus atrovirens black-fruited bulrush 2 2 4 2 10 L5Scirpus microcarpus barber-pole bulrush 1 2 4 3 10 L5Scutellaria galericulata common skullcap 3 2 3 2 10 L5Scutellaria lateriflora mad-dog skullcap 2 2 3 3 10 L5Solidago altissima tall goldenrod 2 2 0 0 4 L5Solidago caesia blue-stemmed goldenrod 2 2 4 2 10 L5Solidago canadensis var. canadensis Canada goldenrod 2 2 0 1 5 L5Solidago flexicaulis zig-zag goldenrod 2 1 3 2 8 L5Solidago nemoralis ssp. nemoralis grey goldenrod 3 2 2 2 9 L5Symphyotrichum cordifolium heart-leaved aster 2 1 0 2 5 L5Symphyotrichum ericoides var. ericoides heath aster 2 1 2 1 6 L5Symphyotrichum lanceolatum var. lanceolatum panicled aster 2 2 3 1 8 L5Symphyotrichum lateriflorum var. lateriflorum calico aster 2 2 3 2 9 L5Symphyotrichum novae-angliae New England aster 2 2 2 1 7 L5Symphyotrichum puniceum var. puniceum swamp aster 2 2 2 2 8 L5Thalictrum dioicum early meadow rue 2 3 3 2 10 L5Tilia americana basswood 2 3 2 3 10 L5Ulmus americana white elm 2 4 0 2 8 L5
Page 45

Appendix 2: Goodwood Resource Management Tract Flora Species (2005 - 2012)Local Popn. Hab. Sens. Total Rank
Occur. Trend Dep. Dev. Score TRCA Scientific Name Common Name 1-5 1-5 0-5 0-5 2-20 (08/2012)
Urtica dioica ssp. gracilis American stinging nettle 2 3 2 2 9 L5Verbena hastata blue vervain 2 2 4 2 10 L5Verbena urticifolia white vervain 2 2 2 2 8 L5Viburnum lentago nannyberry 2 3 1 2 8 L5Viola labradorica dog violet 3 2 0 2 7 L5Viola pubescens stemmed yellow violet (sensu lato) 2 3 1 2 8 L5Viola sororia common blue violet 2 2 0 2 6 L5Vitis riparia riverbank grape 2 1 0 0 3 L5Acer negundo Manitoba maple 4 0 0 2 6 L+?Geranium robertianum herb Robert 4 4 L+?Phalaris arundinacea reed canary grass 3 3 L+?Potentilla norvegica rough cinquefoil 3 3 L+?Prunella vulgaris heal-all 5 5 L+?Achillea millefolium ssp. millefolium European yarrow 4 4 L+Agrostis gigantea redtop 4 4 L+Arctium minus common burdock 5 5 L+Bromus inermis smooth brome grass 4 4 L+Caragana arborescens Siberian pea-shrub 5 5 L+Cerastium fontanum mouse-ear chickweed 3 3 L+Chelidonium majus celandine 5 5 L+Cirsium arvense creeping thistle 4 4 L+Cynanchum rossicum dog-strangling vine 4 4 L+Dactylis glomerata orchard grass 4 4 L+Daucus carota Queen Anne's lace 4 4 L+Dianthus armeria Deptford pink 4 4 L+Dipsacus fullonum teasel 5 5 L+Echium vulgare viper's bugloss 3 3 L+Elaeagnus umbellata autumn olive 5 5 L+Epilobium hirsutum European willow-herb 5 5 L+Epilobium parviflorum small-flowered willow-herb 5 5 L+Epipactis helleborine helleborine 5 5 L+Galeopsis tetrahit hemp-nettle 5 5 L+Hypericum perforatum common St. John's-wort 4 4 L+Leonurus cardiaca ssp. cardiaca motherwort 4 4 L+Leucanthemum vulgare ox-eye daisy 2 2 L+
Page 46

Appendix 2: Goodwood Resource Management Tract Flora Species (2005 - 2012)Local Popn. Hab. Sens. Total Rank
Occur. Trend Dep. Dev. Score TRCA Scientific Name Common Name 1-5 1-5 0-5 0-5 2-20 (08/2012)
Linaria vulgaris butter-and-eggs 5 5 L+Lithospermum officinale Eurasian gromwell 5 5 L+Lonicera x bella shrub honeysuckle 4 4 L+Lythrum salicaria purple loosestrife 4 4 L+Malus pumila apple 4 4 L+Medicago lupulina black medick 5 5 L+Melilotus albus white sweet clover 4 4 L+Mycelis muralis wall lettuce 5 5 L+Myosoton aquaticum giant chickweed 4 4 L+Phleum pratense Timothy grass 4 4 L+Pilosella aurantiaca orange hawkweed 3 3 L+Pilosella caespitosa yellow hawkweed 5 5 L+Pinus sylvestris Scots pine 4 4 L+Plantago major common plantain 2 2 L+Poa compressa flat-stemmed blue grass 4 4 L+Poa nemoralis woodland spear grass 3 3 L+Poa pratensis ssp. pratensis Kentucky blue grass 4 4 L+Potentilla recta sulphur cinquefoil 5 5 L+Ranunculus acris tall buttercup 4 4 L+Rhamnus cathartica common buckthorn 4 4 L+Ribes rubrum garden red currant 4 4 L+Robinia pseudoacacia black locust 3 3 L+Saponaria officinalis bouncing Bet 5 5 L+Silene vulgaris bladder campion 3 3 L+Solanum dulcamara bittersweet nightshade 4 4 L+Sonchus arvensis ssp. arvensis glandular perennial sow-thistle 5 5 L+Sorbus aucuparia European mountain-ash 5 5 L+Symphytum officinale common comfrey 4 4 L+Syringa vulgaris common lilac 4 4 L+Tanacetum vulgare tansy 5 5 L+Taraxacum officinale dandelion 4 4 L+Tragopogon pratensis meadow goat's beard 3 3 L+Trifolium pratense red clover 5 5 L+Typha angustifolia narrow-leaved cattail 3 3 L+Urtica dioica ssp. dioica European stinging nettle 4 4 L+
Page 47

Appendix 2: Goodwood Resource Management Tract Flora Species (2005 - 2012)Local Popn. Hab. Sens. Total Rank
Occur. Trend Dep. Dev. Score TRCA Scientific Name Common Name 1-5 1-5 0-5 0-5 2-20 (08/2012)
Verbascum thapsus common mullein 4 4 L+Veronica officinalis common speedwell 5 5 L+Viburnum opulus European highbush cranberry 4 4 L+Vicia cracca cow vetch 4 4 L+Pinus resinosa red pine 2 5 5 5 17 pL2Pinus strobus white pine 1 4 3 4 12 pL4Picea abies Norway spruce 5 5 pL+
Page 48

Appendix 3: List of Breeding Fauna Species for Goodwood Resource Management Tract.
Common Name Code Scientific Name count LO PTn PTt AS PIS HD StD + TS L-Rank
Survey Species: species for which the TRCA protocol effectively surveys.
Birdsblack and white warbler BAWW Mniotilta varia 8 1 3 2 4 2 2 5 1 20 L2
broad-winged hawk BWHA Buteo platypterus 1 3 2 3 5 1 4 3 1 22 L2
northern goshawk NOGO Accipiter gentilis 1 4 2 2 5 1 3 3 1 21 L2
red-shouldered hawk RSHA Buteo lineatus 1 4 2 3 5 1 4 3 1 23 L2
ruffed grouse RUGR Bonasa umbellus 4 1 3 3 3 2 2 5 1 20 L2
American woodcock AMWO Scolopax minor 4 0 2 3 3 2 2 4 0 16 L3
black-billed cuckoo BBCU Coccyzus erythropthalmus 2 0 3 2 3 1 3 3 0 15 L3
Blackburnian warbler BLBW Setophaga fusca 1 3 1 2 3 1 4 4 0 18 L3
black-throated green warbler BTNW Setophaga virens 12 1 4 2 3 1 3 4 0 18 L3
brown creeper BRCR Certhia americana 3 1 2 2 3 2 2 4 0 16 L3
common nighthawk CONI Chordeiles minor 1 3 3 4 1 1 2 4 0 18 L3
common raven CORA Corvus corax 1 3 1 1 2 1 4 3 0 15 L3
eastern towhee EATO Piplio erythrophthalmus 1 2 3 2 2 2 1 4 0 16 L3
golden-crowned kinglet GCKI Regulus satrapa 4 3 2 2 3 1 3 3 0 17 L3
hermit thrush HETH Catharus guttatus 1 4 1 2 3 1 1 5 1 18 L3
magnolia warbler MAWA Setophaga magnolia 6 4 2 2 2 1 3 3 0 17 L3
mourning warbler MOWA Geothlypis philadelphia 2 0 3 2 2 2 2 4 0 15 L3
Nashville warbler NAWA Oreothlypis ruficapilla 12 2 1 2 2 1 2 5 1 16 L3
northern waterthrush NOWA Parkesia noveboracensis 2 1 2 2 3 1 4 5 1 19 L3
ovenbird OVEN Seiurus aurocapillus 24 0 2 3 4 2 4 4 0 19 L3
pileated woodpecker PIWO Dryocopus pileatus 1 0 2 2 4 1 3 3 0 15 L3
pine warbler PIWA Setophaga pinus 10 0 2 2 4 1 3 3 0 15 L3
scarlet tanager SCTA Piranga olivacea 5 0 2 2 4 1 3 4 0 16 L3
sharp-shinned hawk SSHA Accipiter striatus 1 1 2 2 4 1 3 3 0 16 L3
veery VEER Catharus fuscescens 17 2 3 2 3 1 2 5 1 19 L3
white-throated sparrow WTSP Zonotrichia albicollis 2 2 3 2 2 2 1 4 0 16 L3
wild turkey WITU Meleagris gallopavo 4 0 1 0 4 3 4 3 0 15 L3
winter wren WIWR Troglodytes troglodytes 1 1 2 2 3 2 3 5 1 19 L3
wood thrush WOTH Hylocichla mustelina 11 0 3 2 3 2 2 4 0 16 L3
yellow-billed cuckoo YBCU Coccyzus americanus 1 1 3 2 3 1 3 3 0 16 L3
yellow-rumped warbler YRWA Setophaga coronata 9 3 1 2 3 1 2 4 0 16 L3
belted kingfisher BEKI Ceryle alcyon x 0 3 2 2 1 2 2 0 12 L4
common yellowthroat COYE Geothlypis trichas x 0 2 2 1 2 1 4 0 12 L4
Page 49

Appendix 3: List of Breeding Fauna Species for Goodwood Resource Management Tract.
Common Name Code Scientific Name count LO PTn PTt AS PIS HD StD + TS L-Rank
eastern kingbird EAKI Tyrannus tyrannus x 0 4 2 2 1 1 3 0 13 L4
eastern wood-pewee EAWP Contopus virens x 0 4 2 2 1 1 3 0 13 L4
field sparrow FISP Spizella pusilla 6 0 3 2 2 1 1 4 0 13 L4
great-crested flycatcher GCFL Myiarchus crinitus x 0 2 2 3 1 2 2 0 12 L4
grey catbird GRCA Dumetella carolinensis x 0 2 2 1 1 1 3 0 10 L4
hairy woodpecker HAWO Picoides villosus x 0 2 2 3 1 2 2 0 12 L4
indigo bunting INBU Passerina cyanea x 0 2 2 1 1 2 4 0 12 L4
northern flicker NOFL Colaptes auratus x 0 3 2 1 1 2 3 0 12 L4
pine siskin PISI Carduelis pinus 1 3 3 2 3 1 1 1 0 14 L4
purple finch PUFI Carpodacus purpureus 1 3 4 2 1 1 0 1 0 12 L4
red-breasted nuthatch RBNU Sitta canadensis x 0 1 2 3 1 1 2 0 10 L4
red-eyed vireo REVI Vireo olivaceus x 0 2 2 2 1 1 3 0 11 L4
rose-breasted grosbeak RBGR Pheucticus ludovicianus x 0 2 2 3 1 2 3 0 13 L4
savannah sparrow SAVS Passerculus sandwichensis x 0 3 2 1 1 1 4 0 12 L4
swamp sparrow SWSP Melospiza georgiana x 0 1 2 1 2 1 5 1 13 L4
white-breasted nuthatch WBNU Sitta carolinensis x 0 2 2 3 1 2 2 0 12 L4
wood duck WODU Aix sponsa x 0 2 1 3 2 2 4 0 14 L4
American Crow AMCR Corvus brachyrhynchos x 0 1 2 1 1 0 0 0 5 L5
American goldfinch AMGO Carduelis tristis x 0 2 2 1 1 0 1 0 7 L5
American robin AMRO Turdus migratorius x 0 1 2 1 1 0 1 0 6 L5
Baltimore oriole BAOR Icterus galbula x 0 2 2 1 1 0 1 0 7 L5
black-capped chickadee BCCH Parus atricapillus x 0 1 2 1 1 0 1 0 6 L5
blue jay BLJA Cyanocitta cristata x 0 4 2 1 1 0 1 0 9 L5
brown-headed cowbird BHCO Molothrus ater x 0 2 2 1 1 0 1 0 7 L5
Canada goose CANG Branta canadensis x 0 1 1 1 2 1 0 0 6 L5
cedar waxwing CEDW Bombycilla cedrorum x 0 1 2 1 1 0 1 0 6 L5
chipping sparrow CHSP Spizella passerina x 0 2 2 1 1 0 2 0 8 L5
common grackle COGR Quiscalus quiscula x 0 3 2 1 1 0 1 0 8 L5
downy woodpecker DOWO Picoides pubescens x 0 3 2 1 1 1 1 0 9 L5
eastern phoebe EAPH Sayornis phoebe x 0 2 2 1 1 2 1 0 9 L5
house wren HOWR Troglodytes aedon x 0 2 2 1 2 1 1 0 9 L5
mallard MALL Anas platyrhynchos x 0 2 2 1 2 0 1 0 8 L5
mourning dove MODO Zenaida macroura x 0 2 2 1 1 0 0 0 6 L5
northern cardinal NOCA Cardinalis cardinalis x 0 2 2 1 1 1 2 0 9 L5
red-tailed hawk RTHA Buteo jamaicensis x 0 2 2 2 1 1 1 0 9 L5
Page 50

Appendix 3: List of Breeding Fauna Species for Goodwood Resource Management Tract.
Common Name Code Scientific Name count LO PTn PTt AS PIS HD StD + TS L-Rank
red-winged blackbird RWBL Agelaius phoeniceus x 0 2 2 1 1 0 2 0 8 L5
song sparrow SOSP Melospiza melodia x 0 2 2 1 2 0 2 0 9 L5
Herpetofaunagrey treefrog TGTF Hyla versicolor 1 0 3 3 3 4 2 5 1 21 L2
northern spring peeper SPPE Pseudacris crucifer crucifer x 0 2 3 3 4 3 5 1 21 L2
striped chorus frog MICF Pseudacris triseriata 2 3 3 3 2 4 3 5 1 24 L2
wood frog WOFR Lithobates sylvatica x 0 2 3 3 4 3 5 1 21 L2
American toad AMTO Anaxyrus americanus x 0 3 2 1 4 0 4 0 14 L4
green frog GRFR Lithobates clamitans x 0 2 2 1 3 1 4 0 13 L4
Incidental Species: species that are reported on as incidental to the TRCA protocol.
Mammalsporcupine PORC Erethizon dorsatum 1 2 2 2 4 4 3 3 0 20 L2
river otter RIOT Lutra canadensis 1 4 2 1 5 3 2 5 2 24 L2
hairy-tailed mole HTMO Parascalops breweri 2 4 2 2 1 4 1 4 0 18 L3
meadow jumping mouse MJMO Zapus hudsonius 1 3 2 2 2 3 2 3 0 17 L3
beaver BEAV Castor canadensis 1 1 2 1 2 3 1 3 0 13 L4
eastern chipmunk EACH Tamias striatus x 0 2 2 2 3 1 3 0 13 L4
mink MINK Mustela vison 1 1 2 2 3 3 0 3 0 14 L4
red fox REFO Vulpes vulpes x 1 2 2 1 3 0 1 0 10 L4
red squirrel RESQ Tamiasciurus hudsonicus x 0 2 2 1 3 1 2 0 11 L4
white-tailed deer WTDE Odocoileus virginianus x 0 2 1 3 2 2 1 0 11 L4
raccoon RACC Procyon lotor x 0 2 2 1 3 1 0 0 9 L5
striped skunk STSK Mephitis mephitis x 1 2 2 1 3 0 0 0 9 L5
LEGENDLO = local occurrence PIS = Patch Isolation Sensitivity LX = extirpatedPTn = population trend, continent-wide STD = sensitivity to development L+= non-native/introducedPTt = population trend, TRCA + = additional pointsHD = habitat dependence TS = total scoreAS = area sensitivity L-rank = TRCA Rank, October, 2008
Page 51