Embed Size (px)
Citation preview
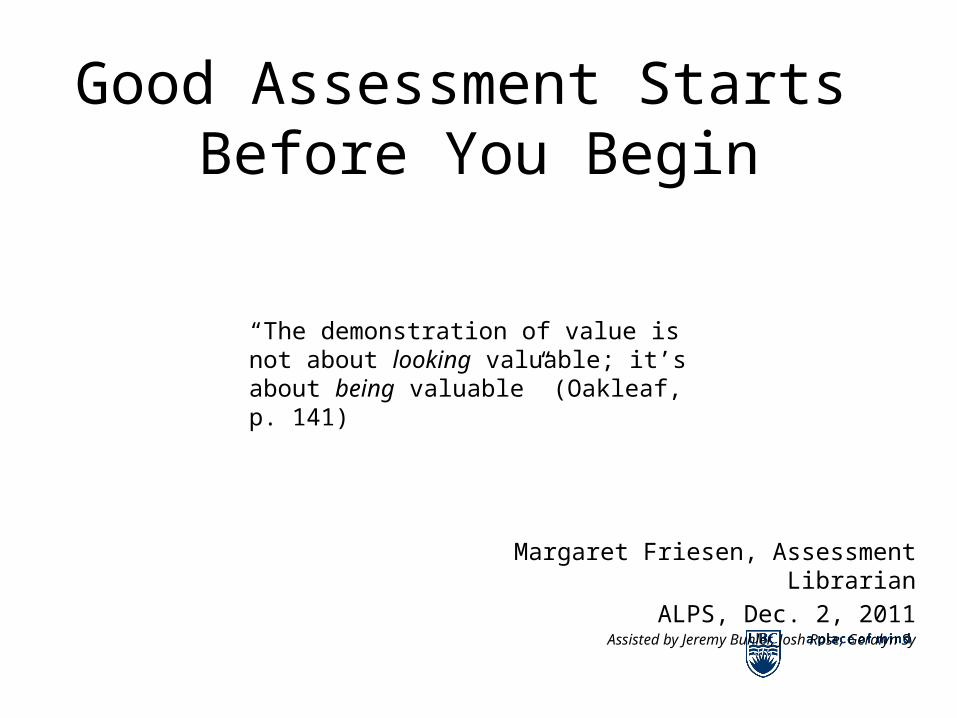
Good Assessment Starts Before You Begin
“The demonstration of value is not about looking valuable; it’s about being valuable” (Oakleaf, p. 141)
Margaret Friesen, Assessment Librarian
ALPS, Dec. 2, 2011 Assisted by Jeremy Buhler, Josh Rose, Geralyn Sy

Before you begin – project management steps
Assessment goals and principles
Methods
Tools
Assessment simplified – some tips
Don’t have data?
Don’t have tools?

Before you begin
Project Management Methodology
Purpose (Why?)
Focus (Scope/Not in Scope)
Stakeholders (Audience)
Partners
Timelines
Outcome (Product)
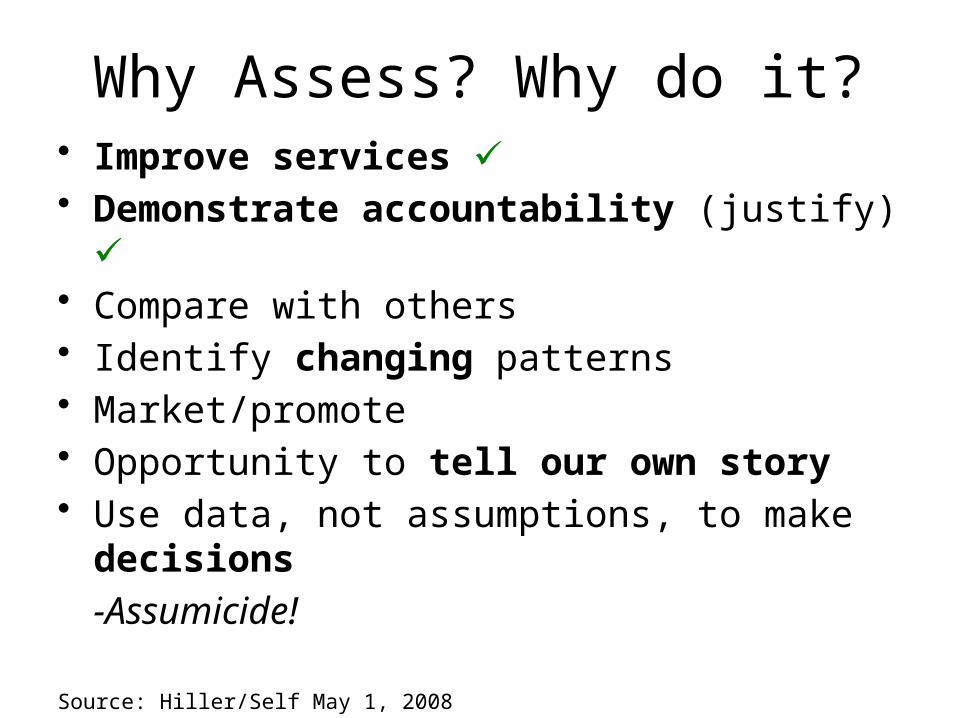
Why Assess? Why do it?• Improve services ✓• Demonstrate accountability (justify) ✓• Compare with others• Identify changing patterns• Market/promote• Opportunity to tell our own story• Use data, not assumptions, to make decisions
-Assumicide!
Source: Hiller/Self May 1, 2008

Definitions, principles, assessment context

Definition: Library Assessment
More than numbers
Library assessment is a structured process:• To learn about our communities• To respond to the needs of our users• To improve our programs and services
Source: Hiller/Self May 1, 2008

Methods ---Where does data come from?
• Statistics (reference, instruction, technical services,circulation, e-usage, virtual gate, gate, website…)
• BIG surveys– LibQUAL survey (general, broad, generic, multi-year)
• Small(er) in-house surveys (branch/unit/function)
• Usability studies, observation, focus groups, tracking, etc.

Differences between Assessment and Research
(Source: Oakleaf p. 31)
Assessment Research
strives to know "what is"
uses information to change status quo test hypotheses
observations of change correlation/causation among variables
political context apolitical
document observations prove/disprove ideas
complete projects - even with flaws researchers can start over
not always "perfect" studies
should be well planned, clear outcomes, appropriate methods, but "sometimes good enough"
Assessment = articulates effectiveness, fosters improvement, increases efficiency, demonstrates accountability.

• Correlate (align) strategy and assessment
• Assess Library’s contribution to the academic success of students/faculty
• Correlate library data (impacts/measures) with institutional data (education integration)
• Choose a framework for assessment that resonates and communicates effectively
• All assessment is local – assess own performance in relation to own users
Principles for assessment programs

Strategy = student successWhat is the library’s contribution? (teaching information lit?)Correlate library data with institutional data (usage/grades?)Communicate: match words to strategy (e.g., “teaching and learning” instead of “instruction”?) Local – own performance, own users
Purpose: Improve Learning Outcomes (Oakleaf)
How committed to student learning? (Metrics # of classes?) What do we want students to learn? (Metrics –discovery tools, save time?) How do we document student learning? (Metrics # evaluations?) How committed are we to our own learning? (Metrics # Staff dev activities?) What do we need to learn? (Assessment methods/tools?) How can we document our own learning? (Portfolio?)
Principles …

How do we compute the value which libraries are adding?
• Digital libraries add value• Human capital greatest asset – neglected area• Framework for “proof of worth” – must recognize and record these proofs
• Have evidence already, have not presented it, or impression is that we have not done so
e.g., identify a metric and calculate the value of teaching and learning, expertise (reference, liaison)
Purpose: Accountability
Value, values, valuation (Stephen Town)

How does library as place affect student capacity to learn? (Danuta Nitecki)
Metric – use of space? value of space?
• Include library space beyond the library, that is, the outreach/liaison librarians’ impact?
Metric – evidence of outreach? # of visits to faculty member in her/his department? # of consultations with students/faculty?
Purpose: AccountabilityLibrary as Place

Some examples of assessment projects, methods and tools
Tracking real time activity Tool =1. Reference services Desk Tracker,
2. Instruction ATLAS.ti, Nesstar,
Excel
Needs survey –
3. Research Commons Vovici (EFM) Survey Tool
4. Quality assurance feedback LibQUAL+® Survey, (total market survey) SPSS, Excel

Project 4
The LibQUAL story in 2010
Method: find out users’ perceptions of UBC library services
Tool: LibQUAL+® Survey
Result: The clear message from users:
“our priorities are…”
Access: make it easy to find …
Content: e-everything, print, AV…
library as place: more quiet space

Project 1.Purpose: improve service deliveryMethodology: Track reference activity – real timeTool = Desk Tracker

33%
32%
10%
4%
21%
The Reference Story - March 2011
Directional total
Reference Basic
Reference Advanced
Reference Referral
Reference Technical
Where are the people?Where are the places?Where is the stuff?
Tools
Expertise
Tool: Excel - Chart

Qualitative analysis:
analyze reference questions
Tools: Excel, ATLAS.ti

Reference Questions - Codes

Qualitative analysis - reference librarians assign codes

Proof of worth – human capital, expertiseResearch questions (evidence) Note: non-research, not necessarily “easy” either

For each branch, count frequency of codes

For decision making-compare branch to branch (e.g., evidence for level of staffing, configure service points, improve visibility of service point, match with demographics, etc.)
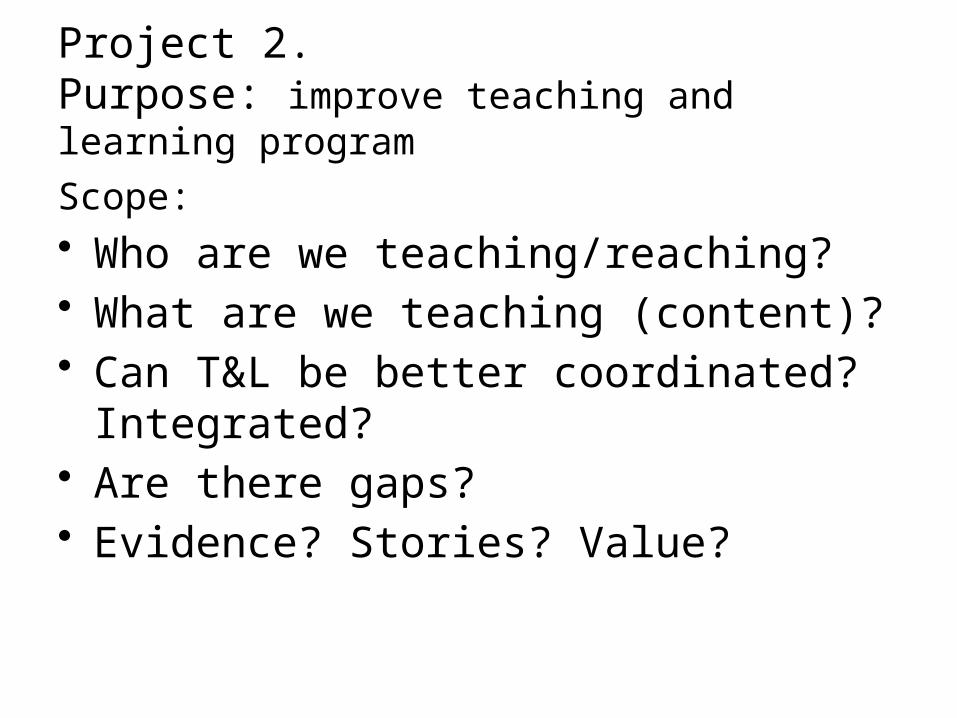
Project 2.Purpose: improve teaching and learning program
Scope:• Who are we teaching/reaching?• What are we teaching (content)?• Can T&L be better coordinated?
Integrated? • Are there gaps?• Evidence? Stories? Value?

Tool: Desk Tracker
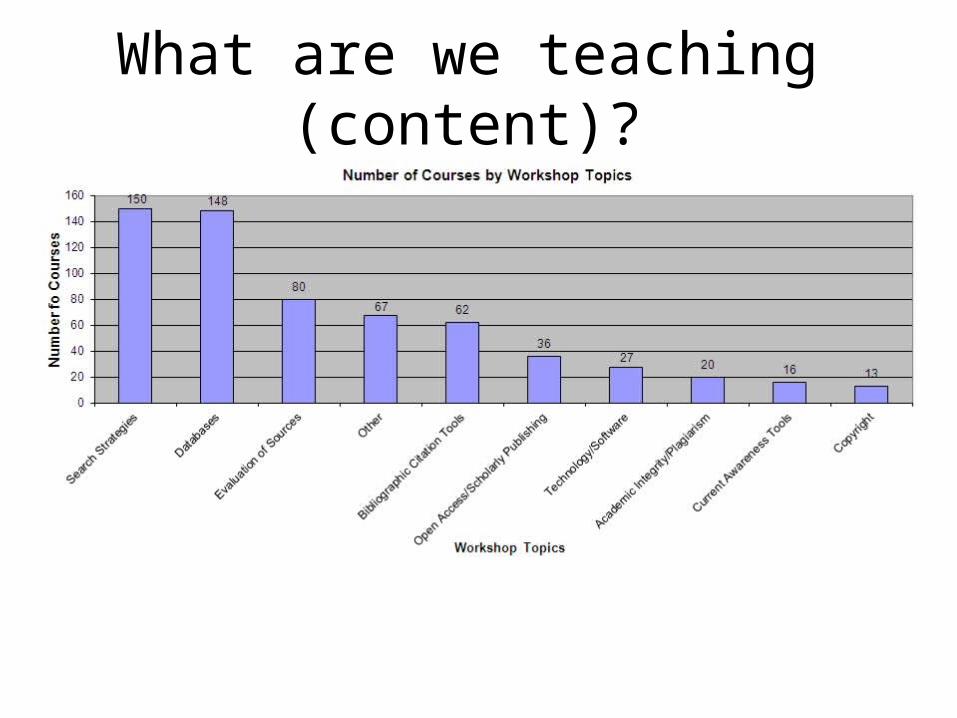
What are we teaching (content)?

Who are we teaching/reaching?Audience - Participants

Tool: Nesstar

Tool: Nesstar

Project 3.Purpose: Plan a Research Commons Space (to improve services to grad students)Method: Needs SurveyTool: Vovici Survey Tool

4) Which of the following facilities would you like to see? Result (table)
# of respondents% of total (396)
Designated zones for quiet study/research with equipment 241 61%
Designated zones for quiet study/research without equipment 220 56%A multi-purpose space for meetings 201 51%
A multi-purpose space to create digital materials (video, audio, textual) 178 45%A multi-purpose space to practice a presentation 169 43%
Designated zones for group study/research with equipment 160 40%A multi-purpose space to attend lectures 141 36%
Designated zones for group study/research without equipment 113 29%Other 27 7%

4) Which of the following facilities would you like to see? Result (chart)
0.0%
10.0%
20.0%
30.0%
40.0%
50.0%
60.0%
70.0% Designated zones for quietstudy/research w ith equipment
Designated zones for quietstudy/research w ithout equipment
A multi-purpose space for meetings
A multi-purpose space to create digitalmaterials (video, audio, textual)
A multi-purpose space to practice apresentation
Designated zones for groupstudy/research w ith equipment
A multi-purpose space to attendlectures
Designated zones for groupstudy/research w ithout equipment
Other

5) What hardware, software, equipment would you like to see?
Result (table)
# of respondents% of total (396)
Electrical outlets for laptops, etc. 313 79%Scanners 268 68%Printers 226 57%Faster computers 224 57%Digital audio/video editing equipment 126 32%Audio/video recording/playback equipment 126 32%Large LCD screens/double screens 120 30%Remote digital storage space [no physical storage] 117 30%Microforms equipment 53 13%Other 25 6%

5) What hardware, software, equipment would you like to see?Result (chart)
0.0%
10.0%
20.0%
30.0%
40.0%
50.0%
60.0%
70.0%
80.0%
90.0%Electrical outlets for laptops,etc.
Scanners
Printers
Faster computers
Digital audio/video editingequipment
Audio/video recording/playbackequipment
Large LCD screens/doublescreens
Remote digital storage space[no physical storage]
Microforms equipment
Other
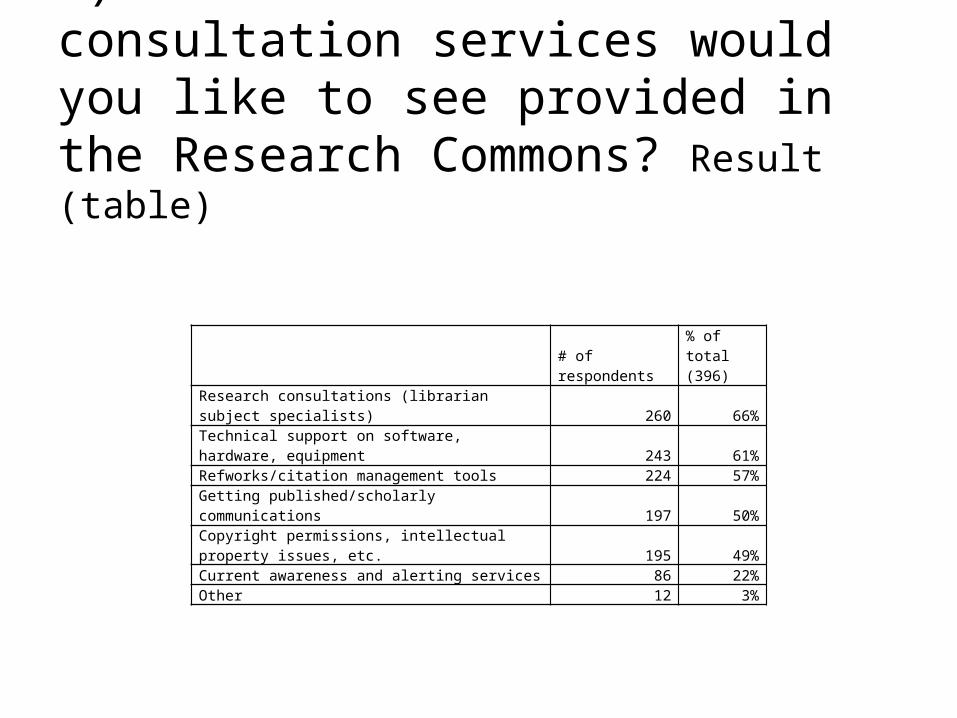
6) Which instruction and consultation services would you like to see provided in the Research Commons? Result (table)
# of respondents% of total (396)
Research consultations (librarian subject specialists) 260 66%Technical support on software, hardware, equipment 243 61%Refworks/citation management tools 224 57%Getting published/scholarly communications 197 50%Copyright permissions, intellectual property issues, etc. 195 49%Current awareness and alerting services 86 22%Other 12 3%
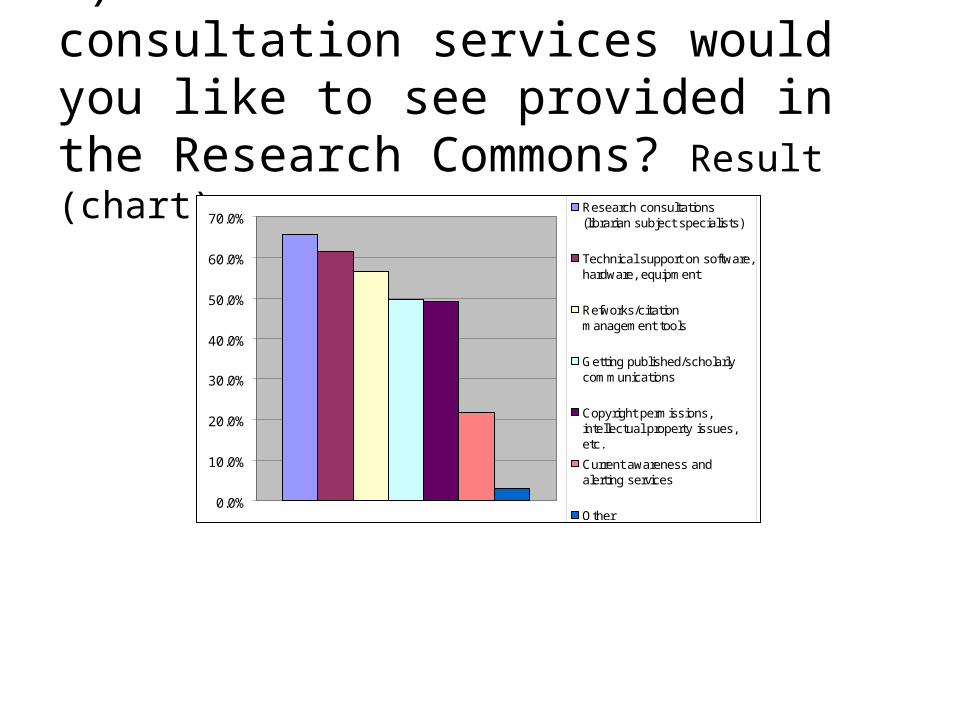
6) Which instruction and consultation services would you like to see provided in the Research Commons? Result (chart)
0.0%
10.0%
20.0%
30.0%
40.0%
50.0%
60.0%
70.0%Research consultations(librarian subject specialists)
Technical support on software,hardware, equipment
Refworks/citationmanagement tools
Getting published/scholarlycommunications
Copyright permissions,intellectual property issues,etc.
Current awareness andalerting services
Other

Assessment outcome
Powerful evidence from graduate students and faculty members –
What do they want to see in a Research Commons space?
Product: Case statement for fundraising includes specific needs and priorities identified by stakeholders

Assessment simplified
Don’t have data?
Try some “estimations”
2 examples of value/valuations

Example 1. Value of Library Services(a la Cornell value model)e.g., for UBC Library

Example 2. Value of Library Services –Teaching and Learning
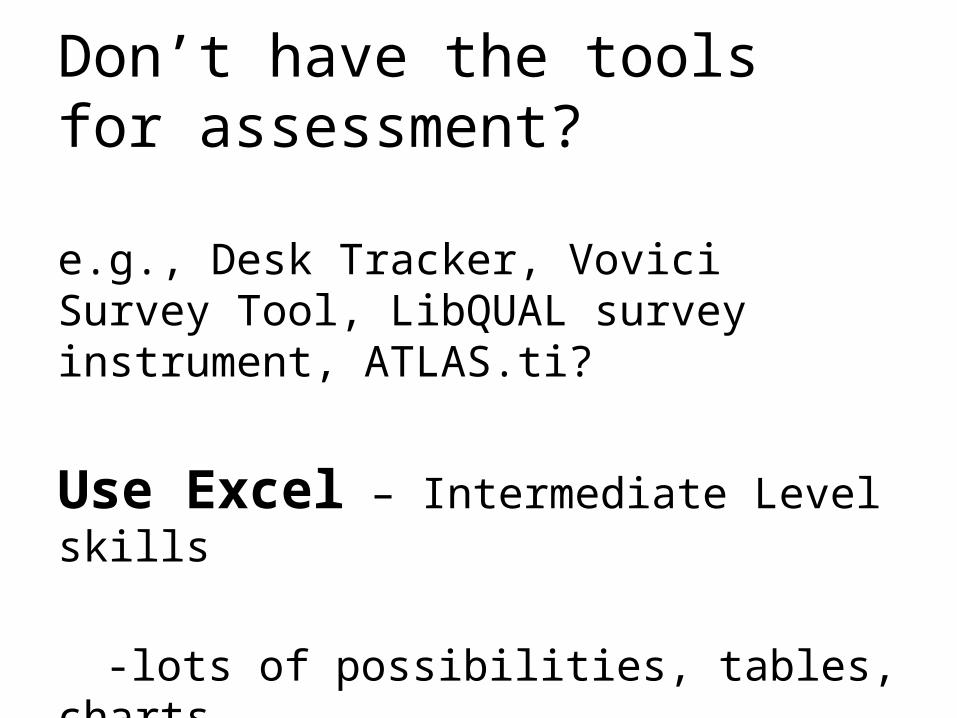
Don’t have the tools for assessment?
e.g., Desk Tracker, Vovici Survey Tool, LibQUAL survey instrument, ATLAS.ti?
Use Excel – Intermediate Level skills
-lots of possibilities, tables, charts ….

Number Dimension Avg Min Avg Des Avg Per Adq Gap Sup Gap n Area 1AS-6 Affect of Service Employees who deal with users in a caring fashion 5.598705271 7.493561926 6.426264495 0.827559223 -1.067297432 14057 7.493561926AS-5 Affect of Service Employees who have the knowledge to answer user questions 5.633408387 7.164297777 6.426892767 0.793484379 -0.73740501 14212 7.164297777AS-4 Affect of Service Readiness to respond to users' questions 6.583304964 8.002451147 7.203717573 0.62041261 -0.798733574 14687 8.002451147AS-3 Affect of Service Employees who are consistently courteous 6.624991235 7.987308043 7.20987308 0.584881846 -0.777434962 14261 7.987308043AS-2 Affect of Service Giving users individual attention 6.701730932 8.083309879 7.142414861 0.440683929 -0.940895018 14212 8.083309879AS-1 Affect of Service Employees who instill confidence in users 6.269141204 7.751323125 7.001199633 0.732058429 -0.750123492 14171 7.751323125LP-5 Library as Place Community space for group learning and group study 6.445328745 7.852369685 6.982720298 0.537391554 -0.869649387 13947 7.852369685LP-4 Library as Place A getaway for study, learning, or research 6.538456096 7.937097573 7.185169462 0.646713366 -0.751928112 14133 7.937097573LP-3 Library as Place A comfortable and inviting location 6.640628721 7.99341113 6.987298563 0.346669842 -1.006112566 12597 7.99341113LP-2 Library as Place Quiet space for individual activities 6.814243809 8.416399482 7.044682448 0.230438638 -1.371717034 14659 8.416399482LP-1 Library as Place Library space that inspires study and learning 6.913333333 8.33030303 7.066397306 0.153063973 -1.263905724 14850 8.33030303IC-8 Information Control Print and/or electronic journal collections I require for my work 6.633565621 8.017566783 6.740127758 0.106562137 -1.277439024 13776 8.017566783IC-7 Information Control Making information easily accessible for independent use 6.881116026 8.307587615 7.081456278 0.200340252 -1.226131337 14695 8.307587615IC-6 Information Control Easy-to-use access tools that allow me to find things on my own 6.90442587 8.267333516 7.185050699 0.280624829 -1.082282817 14596 8.267333516IC-5 Information Control Modern equipment that lets me easily access needed information 6.827536825 8.252659574 7.03525641 0.207719585 -1.217403164 14664 8.252659574IC-4 Information Control The electronic information resources I need 6.81323254 8.216866634 7.122061169 0.308828629 -1.094805465 14419 8.216866634IC-3 Information Control The printed library materials I need for my work 7.039708092 8.372612149 6.910853545 -0.128854547 -1.461758603 13977 8.372612149IC-2 Information Control A library Web site enabling me to locate information on my own 6.070829255 7.736120822 6.249195917 0.178366662 -1.486924906 14302 7.736120822IC-1 Information Control Making electronic resources accessible from my home or office 6.254661078 7.677626825 6.641277641 0.386616563 -1.036349183 13838 7.677626825AS-9 Affect of Service Dependability in handling users' service problems 6.180887136 7.808594561 6.619403501 0.438516366 -1.189191059 14451 7.808594561AS-8 Affect of Service Willingness to help users 6.235174861 7.800159293 6.680761712 0.445586851 -1.119397582 13811 7.800159293AS-7 Affect of Service Employees who understand the needs of their users 5.52563997 7.046917442 6.274919746 0.749279776 -0.771997695 12149 7.046917442
Green
NOTE : The questions are in reversed order to match the radar chart in the notebook.
ARL Colleges and Universities, American English, 2005 Session I
3
4
5
6
7
8
9AS-6
AS-5
AS-4
AS-3
AS-2
AS-1
LP-5
LP-4
LP-3
LP-2
LP-1IC-8
IC-7
IC-6
IC-5
IC-4
IC-3
IC-2
IC-1
AS-9
AS-8
AS-7
ARL Colleges and Universities, American English, 2005 Session I
Perceived Greater Than Desired
Perceived Less Than Desired
Perceived Greater Than Minimum
Perceived Less Than Minimum
e.g., Excel file – radar chart

Affect of Service Information Control Library As Place OverallPerceived 7.034571726 7.109538913 6.576849886 6.957920674Desired 7.594143466 7.898570425 7.967441867 7.898570425Desired 7.594143466 7.898570425 7.967441867 7.898570425Minimum 6.195018657 6.462274742 6.401057097 6.339800774Minimum 6.195018657 6.462274742 6.401057097 6.339800774
Source: Stark, Jeff. Charting LibQUAL+™ Data. (2004)
5
6
7
8
9M
ean
Dimension
Dimension Summary
e.g., Excel file – thermometer chart

Tell the story of human capital, value added by library to different audiences
Audience: For:Library Staff Learning
Library Administration Advocacy
Development Office “Making the case”
Managers Decision-making
Public Understanding the value of the library

Summary:Some examples of:
Assessment Projects
Assessment Goals
Methods
Tools
Scope: From big picture (LibQUAL) tofocused in-house (local) scope
Methodology: From real time tracking, surveys, to estimations
Tools: sophisticated, or Excel

Assessment is not…
• Free and easy• A one-time effort• A complete diagnosis• A roadmap to the future
Assessment is…
A way to improve An opportunity to know our customers A chance to tell our own story A positive experience.
Source: Hiller/Self, May 1, 2008

The positive assessment experience:
• Structured (framework, project management planning=beginning and end)
• Improves services, demonstrates value• Practical• Ongoing/continuous• Effective (outcome = knowledge,
evidence, accountability)Thank you!
Margaret Friesen, Assessment Librarian