Embed Size (px)
Citation preview

fwroot\projects\NY\Treasury\Investor_Relations\Presentations\Conferences\DB Presentation 2015\Presentation\DB 2015
Presentation (6.2.15) FINAL v2.pptx
Goldman Sachs Presentation to
Deutsche Bank Global Financial Services Investor
Conference
June 2, 2015
Gary D. Cohn
President and Chief Operating Officer

fwroot\projects\NY\Treasury\Investor_Relations\Presentations\Conferences\DB Presentation 2015\Presentation\DB 2015
Presentation (6.2.15) FINAL v2.pptx
Cautionary Note
on Forward-Looking Statements
Today’s presentation and any presentation summary on our website may include forward-looking statements.
These statements are not historical facts, but instead represent only the Firm’s beliefs regarding future events,
many of which, by their nature, are inherently uncertain and outside of the Firm’s control. It is possible that the
Firm’s actual results and financial condition may differ, possibly materially, from the anticipated results and
financial condition indicated in these forward-looking statements.
For a discussion of some of the risks and important factors that could affect the Firm’s future results and
financial condition, see “Risk Factors” in our Annual Report on Form 10-K for the year ended December 31,
2014. You should also read the forward-looking disclaimers in our Form 10-Q for the quarter ended March 31,
2015, particularly as it relates to capital and leverage ratios, and information on the calculation of non-GAAP
financial measures that is posted on the Investor Relations portion of our website: www.gs.com.
The statements in the presentation are current only as of its date, June 2, 2015.
2

fwroot\projects\NY\Treasury\Investor_Relations\Presentations\Conferences\DB Presentation 2015\Presentation\DB 2015
Presentation (6.2.15) FINAL v2.pptx
Corporates
Financial Institutions
Financial Sponsors
Governments
Public Authorities
Boards of Directors
Entrepreneurs
Mid/Late-Stage Ventures
Public Equity
Private Equity
Middle Market Corporates
PWM Clients
Large-cap Corporates
Corporates Asset Managers
Hedge Funds
Banks and Broker-Dealers
Governments, Central Banks
Pensions, Endowments, Foundations and Insurers
Asset Managers
Third Party Distributors
Insurance Companies
Pension Funds
High-net-worth Individuals
Foundations
Endowments
3
Investment
Banking
Institutional
Client Services
Investment
Management Investing &
Lending
Our business is
oriented to
our clients
Clients and their needs drive our business We have a diverse, global and broad client franchise

fwroot\projects\NY\Treasury\Investor_Relations\Presentations\Conferences\DB Presentation 2015\Presentation\DB 2015
Presentation (6.2.15) FINAL v2.pptx
Diversified Client-Driven Franchise Leading position and strong financial results in each of our businesses
4
Strong Fixed Income and Equity performance with
82% and 73% of fund assets ranked in the top two
quartiles over 3 and 5 years, respectively1
~14,000 clients across PWM, Institutions and Third
Party Distributors
Global, broad and deep offerings; managing assets
across all major asset classes and serving clients in
over 120 countries
Delivers the whole firm to clients
#1 ranked merger advisor and equity underwriting
franchise
More than 8,000 clients globally in nearly 100
countries across a broad range of industries
Advice, capital raising, hedging and risk management
solutions; leading defense franchise
Operates as an extension of our client franchise
Generating strong risk-adjusted returns from Investing
& Lending portfolios over the long-term
— Private Equity
— Corporate, PWM and Real Estate Lending
— Middle Market and Specialty Financing
Investing in a Volcker-compliant manner
Among the few global players with leading FICC and
Equities franchises, with ~7,000 active clients
Comprehensive capabilities across:
— FICC: Credit, Rates, Currencies, Mortgages and
Commodities
— Equities: Cash, Derivatives and Prime Services
Robust ROAE framework creates discipline and
drives opportunities
Investment Management 17% of 2014 Net Revenues
Investment Banking
19% of 2014 Net Revenues Institutional Client Services
44% of 2014 Net Revenues
Investing & Lending 20% of 2014 Net Revenues
1 Performance calculated using period-end data for global long-term fund assets (non-money market) for all share classes ranked by Morningstar as of 1Q15

fwroot\projects\NY\Treasury\Investor_Relations\Presentations\Conferences\DB Presentation 2015\Presentation\DB 2015
Presentation (6.2.15) FINAL v2.pptx
0.55x
0.95x
2011 2015
5
Peer Group Average Price to Book Value1,3
Competitive Dynamics Lagging ROEs drive strategic reassessments and more rational marketplace
Peer Group Average Gross Leverage1,2
Peer Group Average ROE1
22x
17x
2011 1Q15
-24%
6%
2%
5% 4%
2011 2012 2013 2014
Increased capital requirements and tougher
macro backdrop have led to asset reductions
across the industry
Deleveraging and improved credit profiles have
boosted multiples, though ROEs continue to lag
at an average of 4.2% in 2014
Lagging returns have led many peers to rethink
their strategic priorities and businesses
1 Peer data represents average for JPM, MS, C, BAC, CS, DB, UBS and BARC 2 Euro banks’ gross leverage calculation reflects IFRS, except for CS which reflects US GAAP 3 2015 through 5/22/15
73% GS Average ROE
2011 to 2014: 9.2%

fwroot\projects\NY\Treasury\Investor_Relations\Presentations\Conferences\DB Presentation 2015\Presentation\DB 2015
Presentation (6.2.15) FINAL v2.pptx
Quest for Growth M&A
Announced M&A % of Global Market Cap and GS Volume Share1 Top Announced M&A Sectors1
6
While dominant sectors have varied over different periods, GS held the #1 rank in
announced M&A in 13 of the last 15 years
GS average share 2000-2014: 28%
Participated in 18 of the 20 largest completed M&A deals since our IPO in 1999
Advisory net revenues in 1Q15 were ~1.8x our closest peer4
1Q15 total investment banking backlog up significantly YoY
GS
Global
Rank
Time Period Leading
Industry
Industry
% of
Global
Volume
#1 2000-2002 TMT 35%
#1 2003 FIG 22%
#1 2004-2005 TMT 22%
#1 2006-2007 Nat. Resources 23%
#1 2008 FIG 24%
#1, #2 2009-2012 Nat. Resources 28%
#1 2013 TMT 23%
#1 2014-2015YTD3 Nat. Resources 22%
10.2%
6.2%
5.0% 5.5%
6.0%
7.4%
8.5% 7.8%
6.5% 5.6% 5.5%
5.1% 5.4%
4.3%
5.5%
(40)%
(30)%
(20)%
(10)%
0%
10%
20%
30%
40%
2%
4%
6%
8%
10%
12%
14%
2000 2002 2004 2006 2008 2010 2012 2014
Total Announced M&A Volume as % of Global Market Cap GS Share
Average GS
Share: 28%
2015YTD2:
5.9%
1 Source: M&A from Thomson Reuters. Global market cap from Factset 2 Annualized announced M&A as of 5/20/15 3 As of 5/20/15; 4 Peers include JPM, MS, C, BAC, CS, DB and UBS
An
no
un
ce
d M
&A
% o
f
Glo
ba
l M
ark
et
Cap
GS
Sh
are
Long-term
Performance
Current
Performance

fwroot\projects\NY\Treasury\Investor_Relations\Presentations\Conferences\DB Presentation 2015\Presentation\DB 2015
Presentation (6.2.15) FINAL v2.pptx
$0.4
$1.5
Trough: 2002-2003 Peak: 2006-2007
$0.7 $1.3
Trough: 2009-2010 2014
Quest for Growth Cross-border
Cross-Border Announced M&A Activity ($ trillion)1
Cross-Border Opportunity: Comparing M&A Cycles ($ trillion)1,3
7
+4.3x +1.8x
Cross-border transactions have
increased in share in the recent
upcycle
In the last M&A cycle, cross-
border transactions grew 4.3x
from the trough, vs. only 1.8x in
the current cycle
GS historically has shown
leadership, with almost 30%
share of cross-border
transactions since 2000
GS has ranked #1 in announced
cross-border transactions in 12
of the last 15 years
33%
36% 30% 26%
32%
34%
34% 45%
38%
27% 37% 35% 35% 30%
38%
$0.0
$1.0
$2.0
$3.0
$4.0
$5.0
2000 2001 2002 2003 2004 2005 2006 2007 2008 2009 2010 2011 2012 2013 2014
Global Volume ex-Cross Border Cross-Border
2015YTD2:
41%
1 Source: Thomson Reuters 2 As of 5/20/15 3 Trough and peak periods represent average annual announced cross-border M&A volume during the period

fwroot\projects\NY\Treasury\Investor_Relations\Presentations\Conferences\DB Presentation 2015\Presentation\DB 2015
Presentation (6.2.15) FINAL v2.pptx
2010 2014
€0.7
€1.2
2008 2014
1 Source: Federal Reserve; represents non-financial corporate bond market. US corporate bonds represent 58% of US credit 2 Source: ECB. Represents non-financial corporate bond market in all countries in the European Monetary Union; EU corporate bonds represent 11% of EU credit 3 Source: Bloomberg
8
+3.5x
+75%
GS European HY Debt Underwriting Volumes
$3.0
$4.4
2008 2014
+48%
Significant opportunity in European bank
disintermediation
Growth in European corporate bond market
penetration to US levels would equate to an
increase of ~5 times1,2
New EU leverage constraints and competitor
retrenchment have opened new opportunities
GS Europe HY Debt U/W rank averaged #3
from 2011 to 2014, up 4 spots from an average
of #7 from 2005 to 20103
Low Interest Rates How GS helps Investment Banking clients navigate the low rate environment
US Corporate Bond Market Growth ($tn)1 European Corporate Bond Market Growth (€tn)2
fwroot\projects\NY\Treasury\Investor_Relations\Presentations\Conferences\DB Presentation 2015\Presentation\DB 2015
Presentation (6.2.15) FINAL v2.pptx
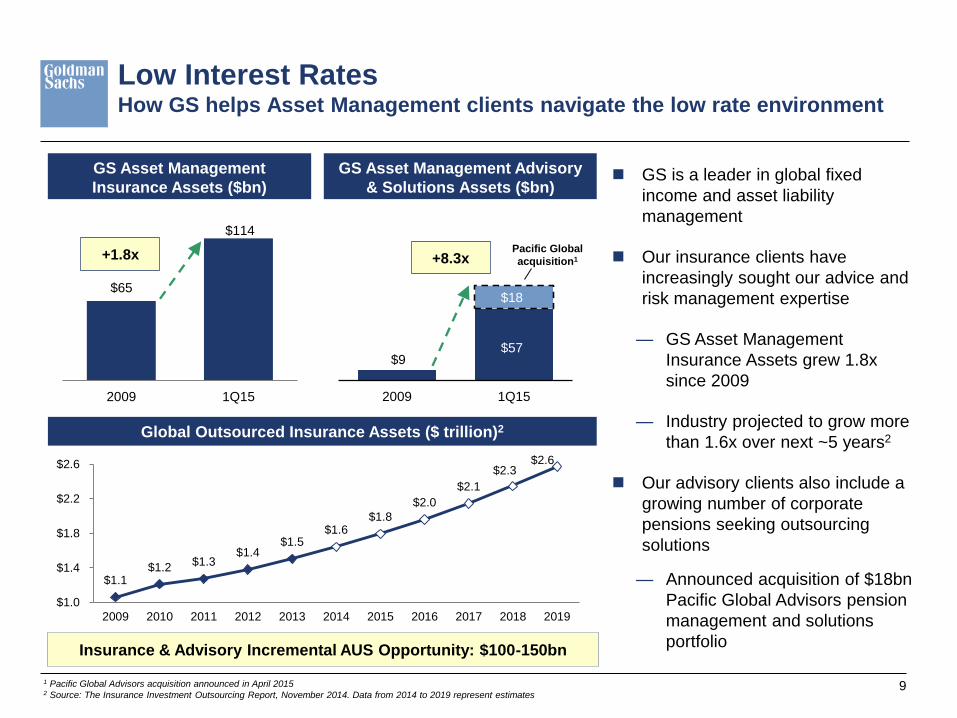
$9 $57
$18
2009 1Q15
9
$65
$114
2009 1Q15
+1.8x
GS is a leader in global fixed
income and asset liability
management
Our insurance clients have
increasingly sought our advice and
risk management expertise
— GS Asset Management
Insurance Assets grew 1.8x
since 2009
— Industry projected to grow more
than 1.6x over next ~5 years2
Our advisory clients also include a
growing number of corporate
pensions seeking outsourcing
solutions
— Announced acquisition of $18bn
Pacific Global Advisors pension
management and solutions
portfolio
GS Asset Management
Insurance Assets ($bn)
Global Outsourced Insurance Assets ($ trillion)2
1 Pacific Global Advisors acquisition announced in April 2015 2 Source: The Insurance Investment Outsourcing Report, November 2014. Data from 2014 to 2019 represent estimates
GS Asset Management Advisory
& Solutions Assets ($bn)
+8.3x Pacific Global
acquisition1
Low Interest Rates How GS helps Asset Management clients navigate the low rate environment
$1.1 $1.2
$1.3 $1.4
$1.5 $1.6
$1.8
$2.0
$2.1
$2.3 $2.6
$1.0
$1.4
$1.8
$2.2
$2.6
2009 2010 2011 2012 2013 2014 2015 2016 2017 2018 2019
Insurance & Advisory Incremental AUS Opportunity: $100-150bn

fwroot\projects\NY\Treasury\Investor_Relations\Presentations\Conferences\DB Presentation 2015\Presentation\DB 2015
Presentation (6.2.15) FINAL v2.pptx
+28%
CommoditiesVolatility
CommoditiesNet Revenues
+25%
1.8x
Interest RateVolatility
Interest RatesNet Revenues
+41%
2.7x
CurrenciesVolatility
CurrenciesNet Revenues
Diverging Monetary Policy Revenue is leveraged to higher volatility in a normal environment
10
In these examples, avg. increase of ~30% in volatility translated into avg. quarterly net revenue growth of 2.6x
Cold weather drives
significant increase in natural
gas prices, better operating
environment and increased
opportunities
Expectation of a Federal
Reserve shift to higher rates
vs. accommodative
monetary policy elsewhere
drives global activity
Pick-up in volatility amid
idiosyncratic market events
and strong-dollar trends
drives activity
Recent performance: Volatility and Quarterly GS ICS Product Net Revenues1
1Q14 3Q14 1Q15
1 GS net revenues versus trailing 4 quarter average; volatility indices versus prior quarter-end. Commodities volatility per the MLCX Index; Currencies volatility per the CVIX Index; Interest Rate volatility
per the MOVE Index
3.2x

fwroot\projects\NY\Treasury\Investor_Relations\Presentations\Conferences\DB Presentation 2015\Presentation\DB 2015
Presentation (6.2.15) FINAL v2.pptx
Technology-Driven Change Technology is critical for us and our clients
SecDB
— Tracking risk across the firm
— 23 billion prices calculated daily across 2.8mm
positions and 500k market scenarios
— 7.5 quintillion instructions executed around the
clock
— Hundreds of stress tests run on a regular basis
ROAE framework
— Dynamic top-down and bottom-up capital
attribution process
— Full capital and cost allocations enable real view
of returns
Symphony
— Cloud-based, encrypted platform for secure
instant communication and content
Marquee
— GS’ open architecture platform for electronic
delivery of content to institutional clients
including:
– Ideas and intellectual capital
– Market analytics and data
– Trade execution
Communicate
Ideas
Share
Analysis
Disseminate
Pricing and
Request Quotes
Facilitate Pre-Trade
and Post-Trade
Workflows
$
11
Commercial Opportunities Risk Management & Capital Efficiency

fwroot\projects\NY\Treasury\Investor_Relations\Presentations\Conferences\DB Presentation 2015\Presentation\DB 2015
Presentation (6.2.15) FINAL v2.pptx
Technology-Driven Change GS Marquee supports all phases of our clients’ transaction life-cycle
12
Market Data & Research
GS Markets
Sales & Pre-Trade
SIMON
Execution
Marquee Trader
Post-Trade
Trade Tracker
Portfolio Construction
Strategy Studio

fwroot\projects\NY\Treasury\Investor_Relations\Presentations\Conferences\DB Presentation 2015\Presentation\DB 2015
Presentation (6.2.15) FINAL v2.pptx
Quest for Growth
Low Interest Rates
Diverging Monetary
Policy
Technology- Driven Change
Growth of Capital Markets
Global Demographic
Trends
“New Oil
Order”
Consolidation of Asset
Management
Other Important Trends Affecting our Clients
13
Our
Clients
Additional trends affecting our clients create further opportunities for GS
Leading position across all of our businesses
Strengthened financial profile
Expense discipline and capital efficiency
Improved competitive positioning
Positioned for revenue leverage
GS Key Highlights
Significant operating leverage

fwroot\projects\NY\Treasury\Investor_Relations\Presentations\Conferences\DB Presentation 2015\Presentation\DB 2015
Presentation (6.2.15) FINAL v2.pptx
Goldman Sachs Presentation to
Deutsche Bank Global Financial Services Investor
Conference
June 2, 2015
Gary D. Cohn
President and Chief Operating Officer