Embed Size (px)
Citation preview
Presentation by:
Jim Craigie, Chairman & CEO
Matt Farrell, EVP & CFO
May 12, 2011
Goldman Sachs Conference
Safe Harbor Statement
This presentation contains forward-looking statements relating, among others, to sales and earnings growth, including
growth for the laundry detergent business, cash flow, margin improvement, marketing spending, new product
introductions, contribution to revenue, growth and gross margin expansion by the new laundry detergent manufacturing
plant and warehouse facility, capital expenditures and cash transition expenses related to the new facility, forecasted
organic sales growth and earnings per share growth, the Company’s focus on targeted marketing and new product
introductions and investment in a global information systems project. These statements represent the intentions, plans,
expectations and beliefs of the Company, and are subject to risks, uncertainties and other factors, many of which are
outside the Company’s control and could cause actual results to differ materially from such forward-looking
statements. The uncertainties include assumptions as to market growth and consumer demand (including the effect of
political and economic events on consumer demand), retailer actions in response to changes in consumer demand and
the economy, raw material and energy prices, the financial condition of major customers and vendors, interest rate and
foreign currency exchange rate fluctuations and changes in marketing and promotional spending. With regard to the new
product introductions referred to generally in this release, there is particular uncertainty relating to trade, competitive and
consumer reactions. Other factors that could materially affect actual results include the outcome of contingencies,
including litigation, pending regulatory proceedings, environmental matters and the acquisition or divestiture of
assets. For a description of additional factors that could cause actual results to differ materially from the forward looking
statements, please see the Company’s quarterly and annual reports filed with the SEC, including information in the
Company’s annual report on Form 10-K in Item 1A, “Risk Factors.”
2

1. Top 10 TSR Drivers Jim Craigie
2. Q&A Jim Craigie
Matt Farrell
Agenda
3
1. Recession Resistant
Product Portfolio
4
Top 10 TSR Drivers
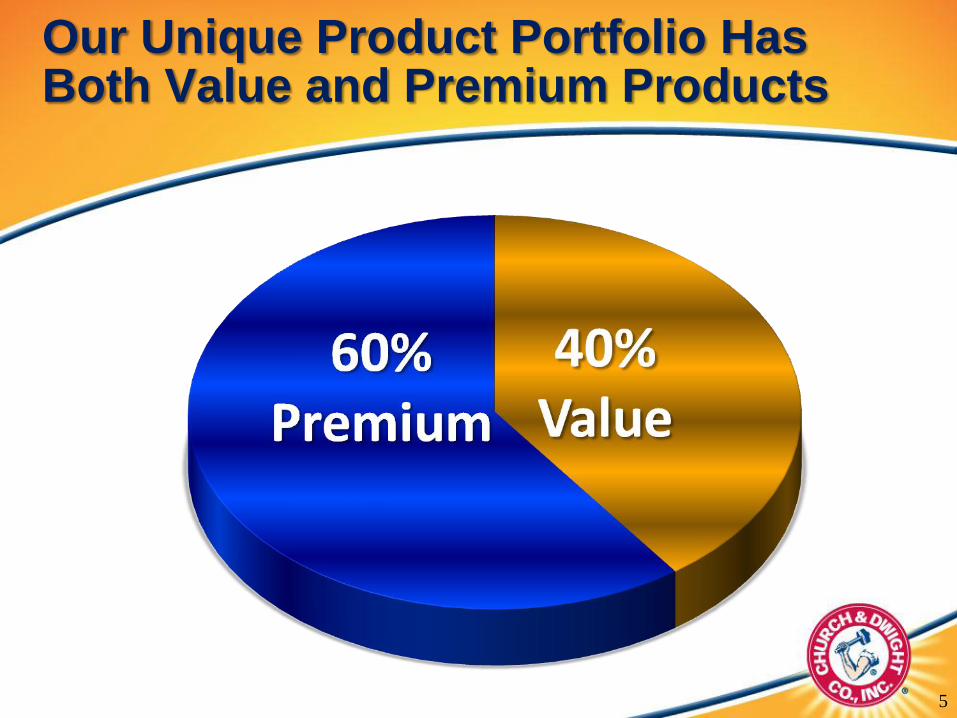
Our Unique Product Portfolio Has Both Value and Premium Products
5
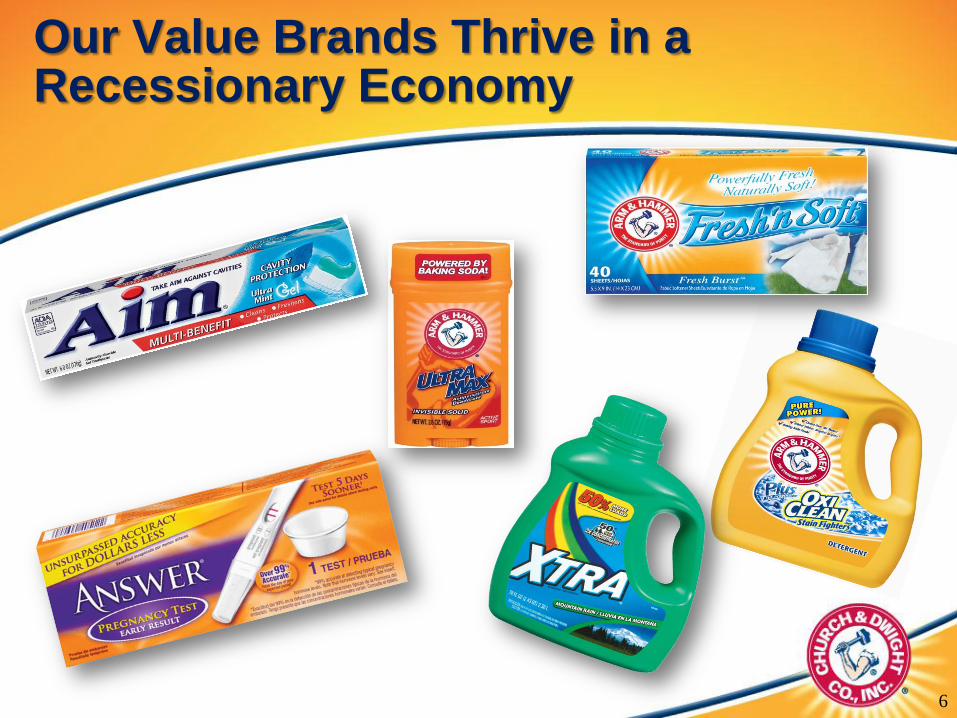
Our Value Brands Thrive in a Recessionary Economy
6
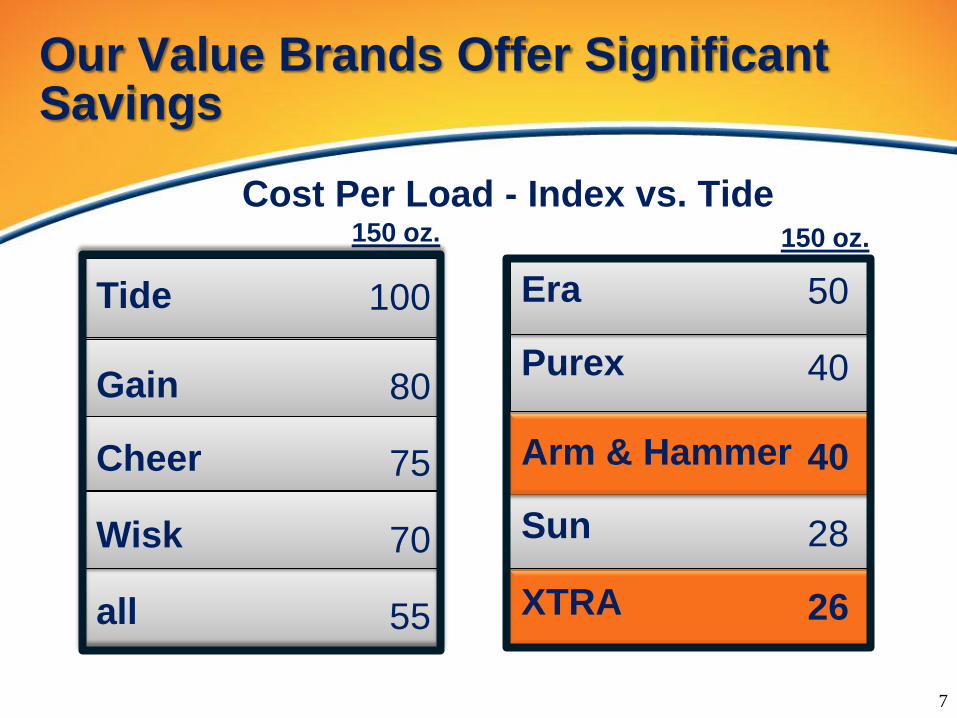
Era
Purex
Arm & Hammer
Sun
XTRA
Our Value Brands Offer Significant Savings
7
Cost Per Load - Index vs. Tide
100
80
75
70
55
150 oz.
50
40
40
28
26
150 oz.
Tide
Gain
Cheer
Wisk
all
2. Build Power Brands
8
Top 10 TSR Drivers
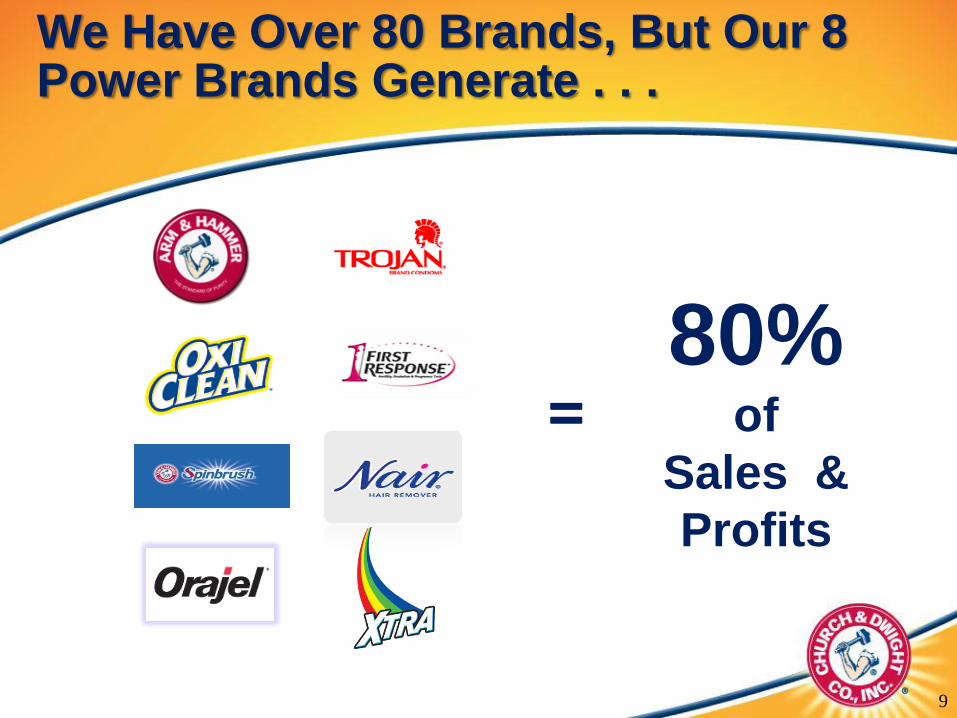
We Have Over 80 Brands, But Our 8 Power Brands Generate . . .
9
=80%
of
Sales &
Profits
10
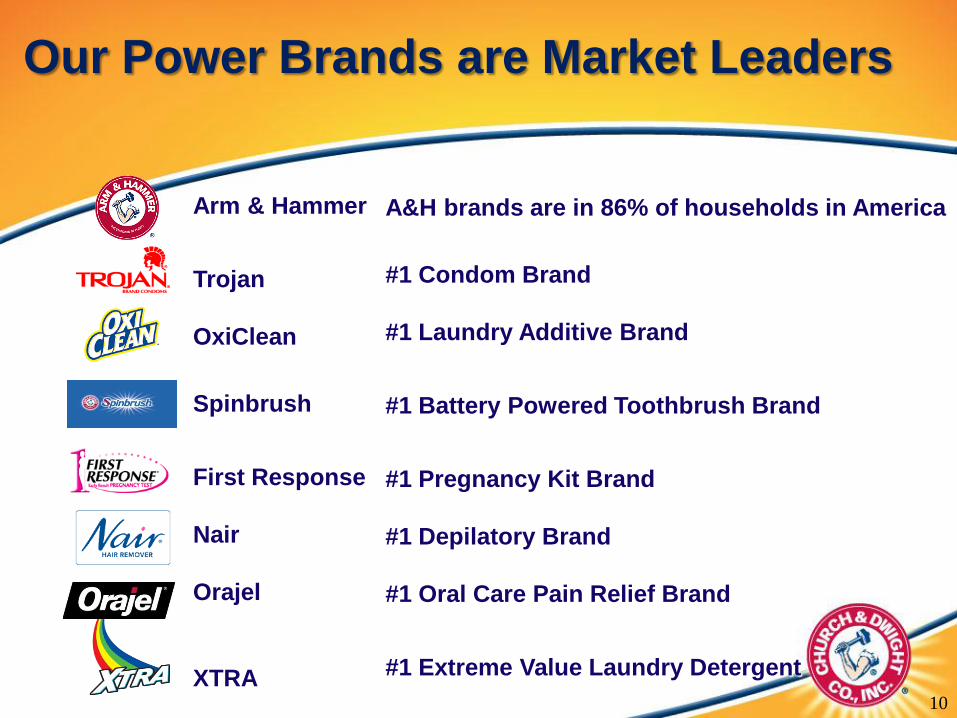
Our Power Brands are Market Leaders
A&H brands are in 86% of households in America
#1 Condom Brand
#1 Laundry Additive Brand
#1 Battery Powered Toothbrush Brand
#1 Pregnancy Kit Brand
#1 Depilatory Brand
#1 Oral Care Pain Relief Brand
#1 Extreme Value Laundry Detergent
Arm & Hammer
Trojan
OxiClean
Spinbrush
First Response
Nair
Orajel
XTRA
11
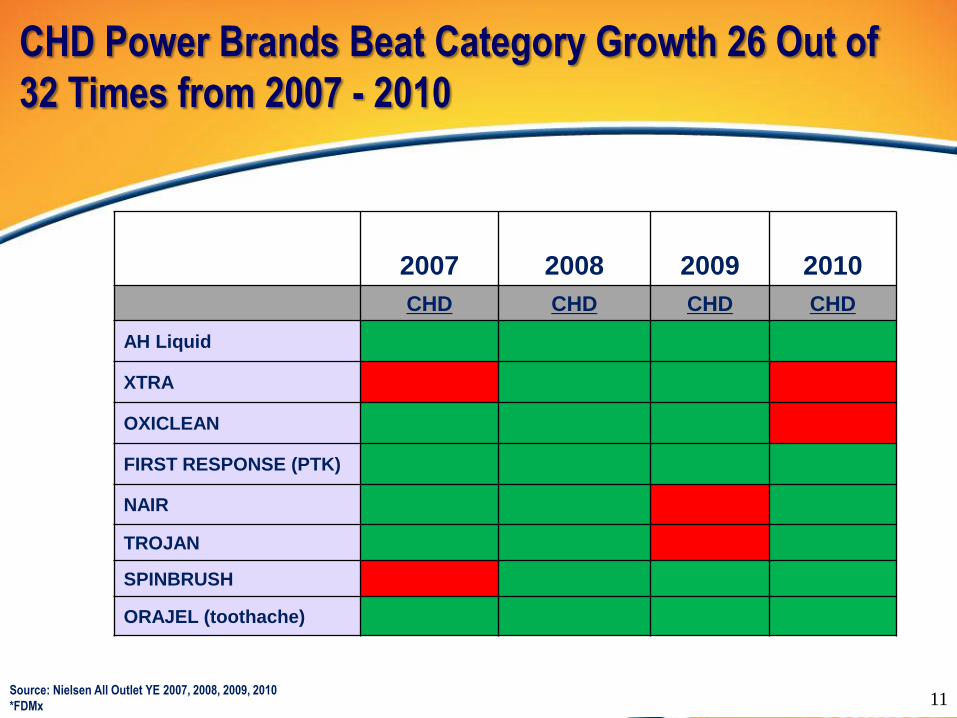
2007 2008 2009 2010
CHD CHD CHD CHD
AH Liquid
XTRA
OXICLEAN
FIRST RESPONSE (PTK)
NAIR
TROJAN
SPINBRUSH
ORAJEL (toothache)
CHD Power Brands Beat Category Growth 26 Out of
32 Times from 2007 - 2010
Source: Nielsen All Outlet YE 2007, 2008, 2009, 2010
*FDMx

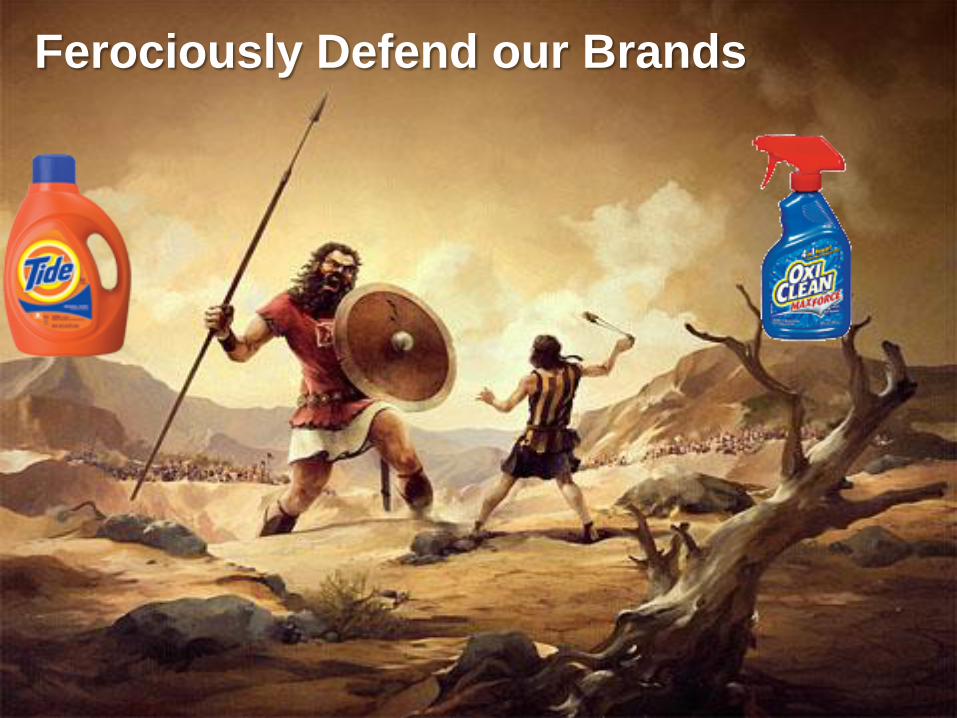
3. Ferociously Defend Our
Brands
12
Top 10 TSR Drivers
1313
Ferociously Defend our Brands
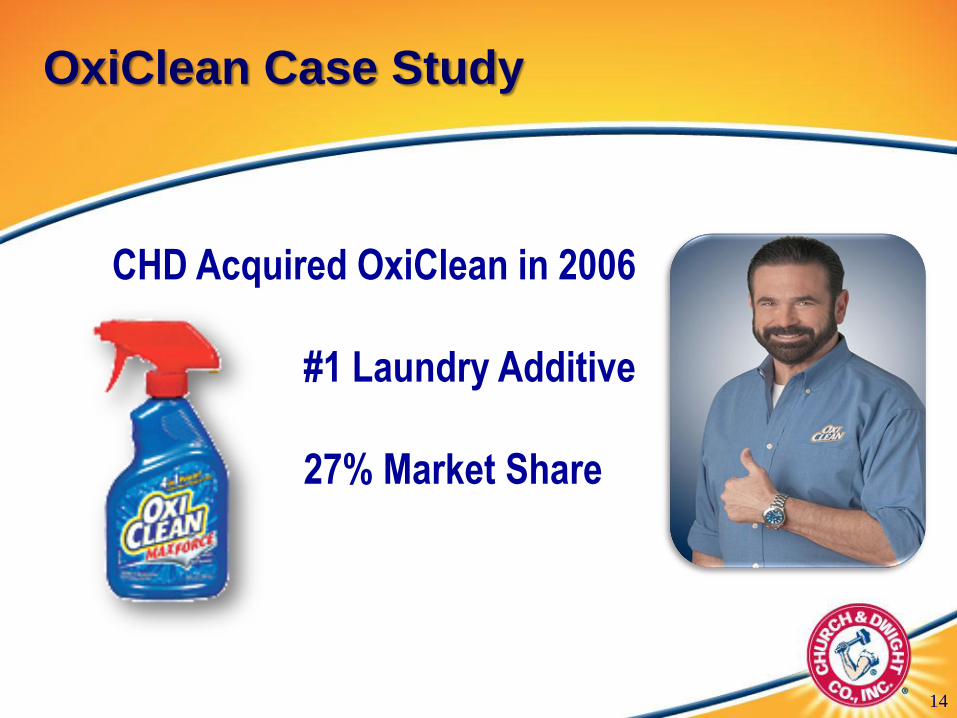
OxiClean Case Study
14
CHD Acquired OxiClean in 2006
- #1 Laundry Additive
- 27% Market Share
C
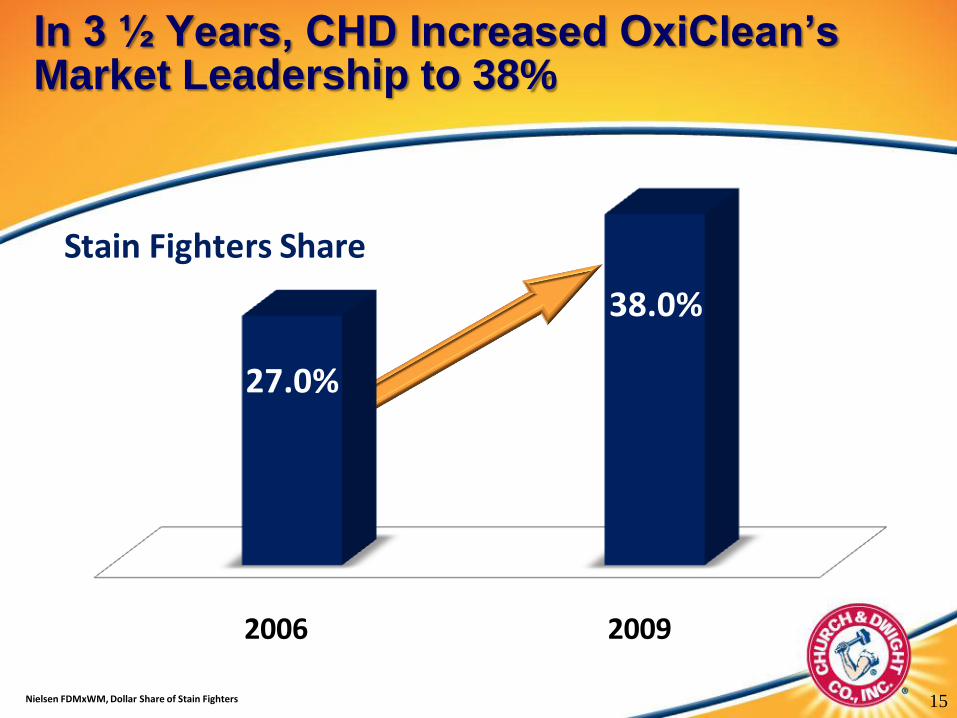
2006 2009
27.0%
38.0%
Stain Fighters Share
In 3 ½ Years, CHD Increased OxiClean’s Market Leadership to 38%
Nielsen FDMxWM, Dollar Share of Stain Fighters 15
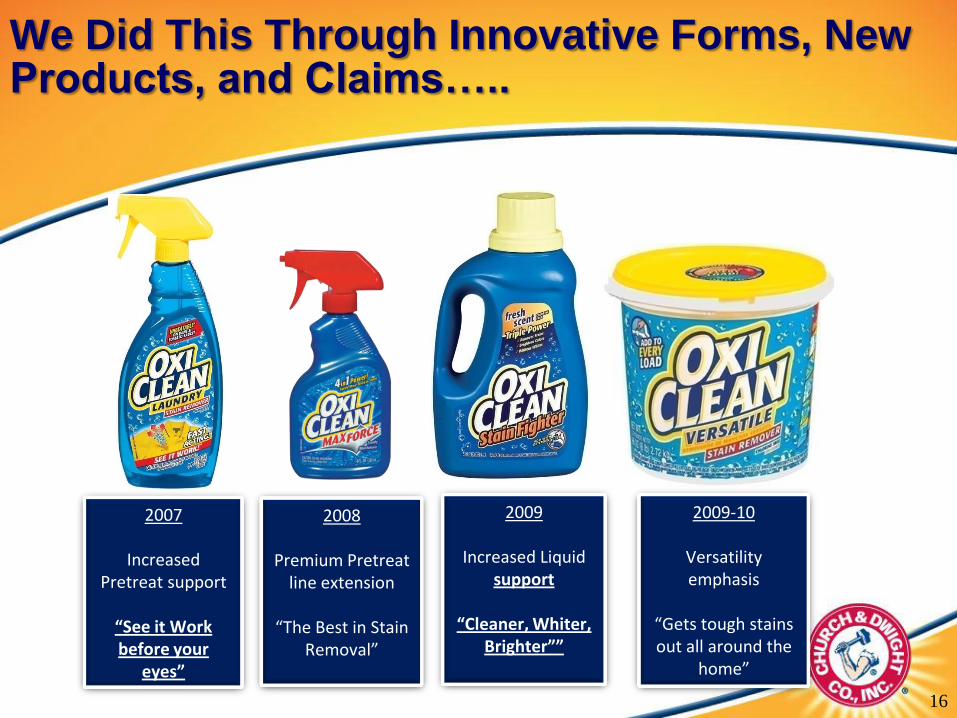
We Did This Through Innovative Forms, New Products, and Claims…..
2007
Increased Pretreat support
“See it Work before your
eyes”
2009-10
Versatility emphasis
“Gets tough stains out all around the
home”
2008
Premium Pretreatline extension
“The Best in Stain Removal”
2009
Increased Liquid support
“Cleaner, Whiter, Brighter””
16
0
50
100
150
200
250
300
350
400
450
500
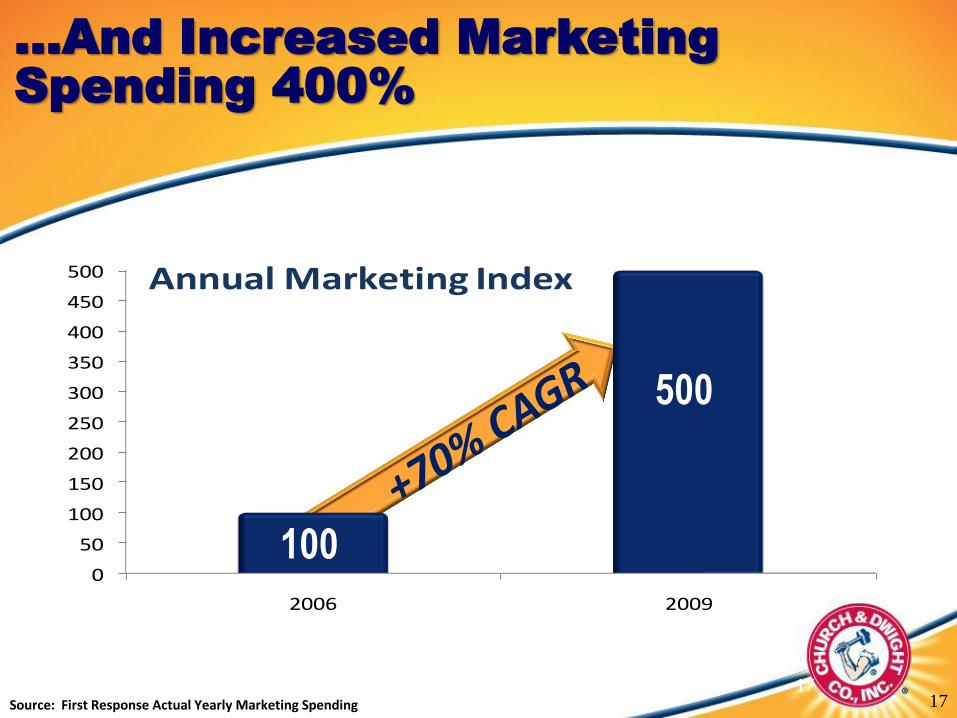
2006 2009
Annual Marketing Index
17Source: First Response Actual Yearly Marketing Spending
…And Increased Marketing
Spending 400%
100
500
17
18
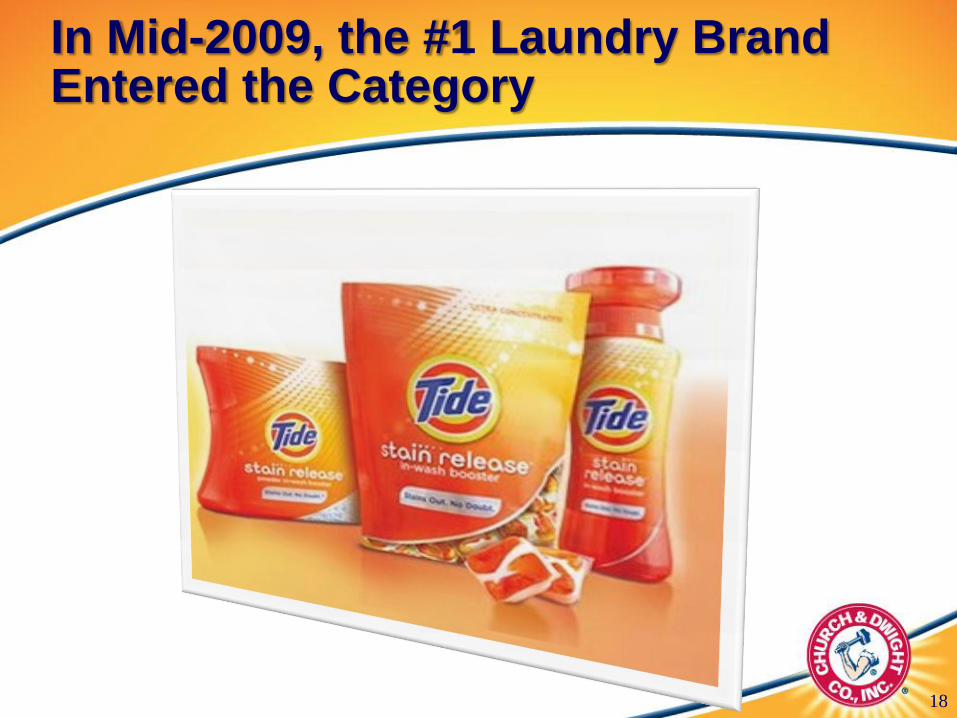
In Mid-2009, the #1 Laundry Brand Entered the Category
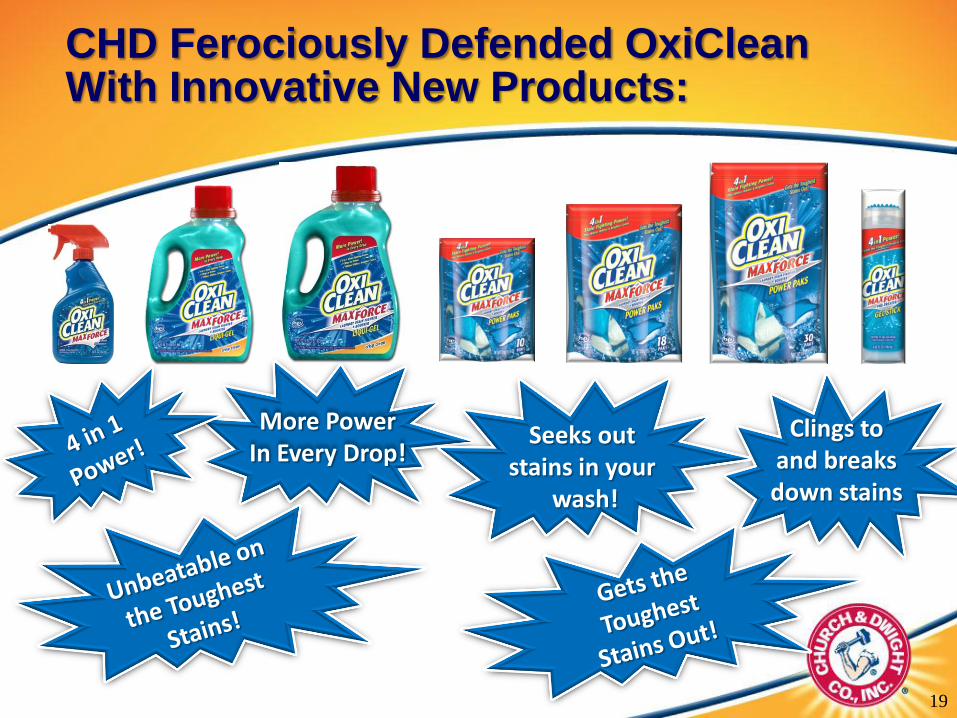
CHD Ferociously Defended OxiClean With Innovative New Products:
Clings to and breaks down stains
More Power In Every Drop!
Seeks out stains in your
wash!
19
20
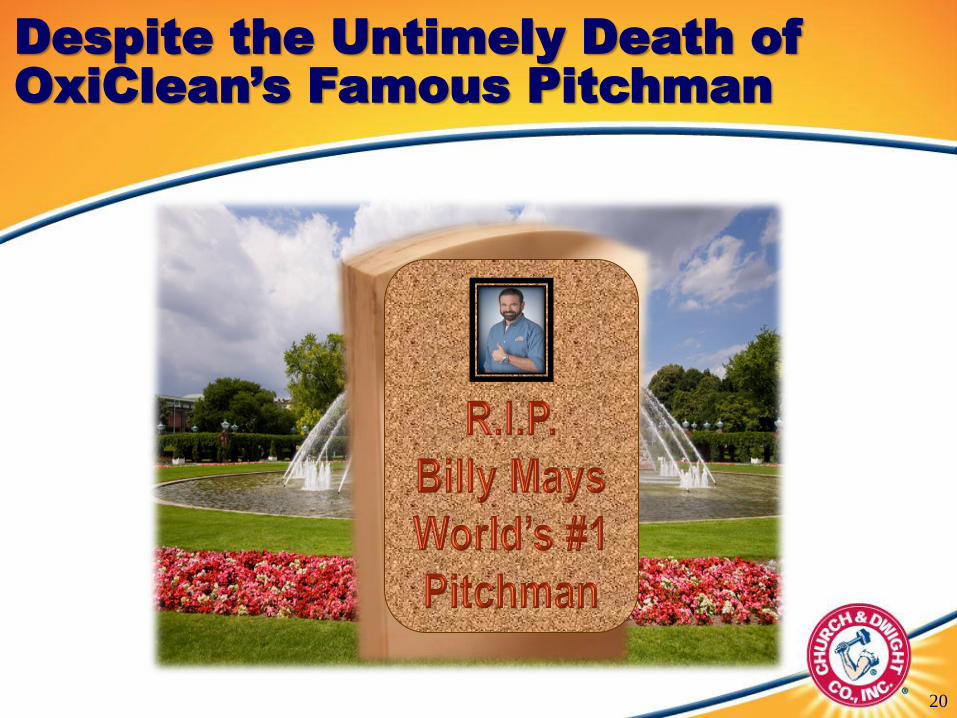
Despite the Untimely Death of
OxiClean’s Famous Pitchman
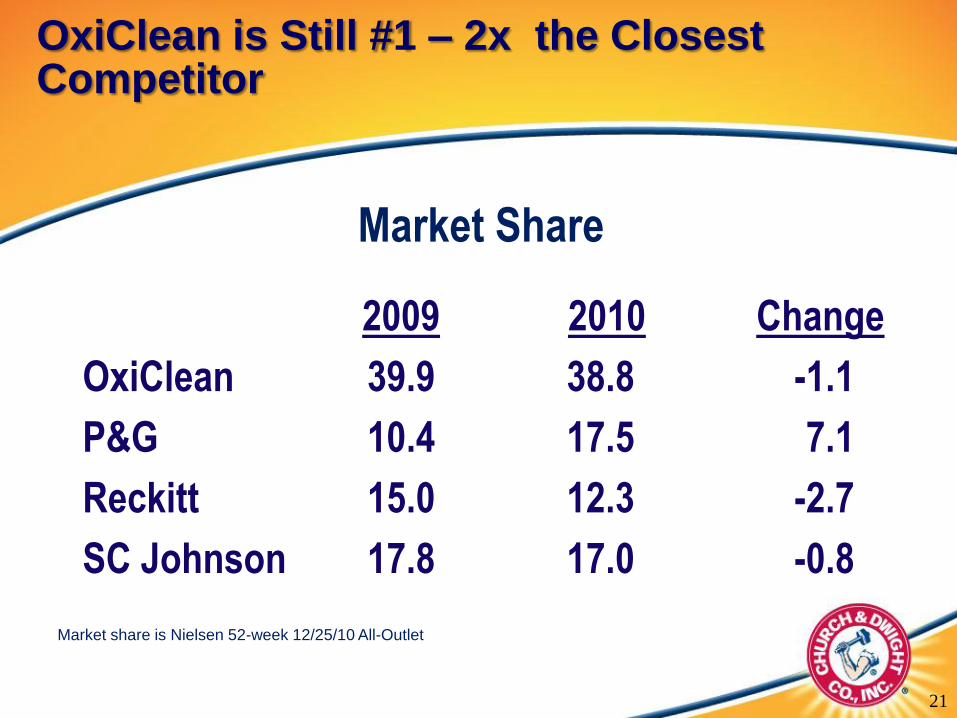
OxiClean is Still #1 – 2x the Closest Competitor
2009 2010 Change
OxiClean 39.9 38.8 -1.1
P&G 10.4 17.5 7.1
Reckitt 15.0 12.3 -2.7
SC Johnson 17.8 17.0 -0.8
Market Share
21
Market share is Nielsen 52-week 12/25/10 All-Outlet
4. Driving International
Growth
22
Top 10 TSR Drivers
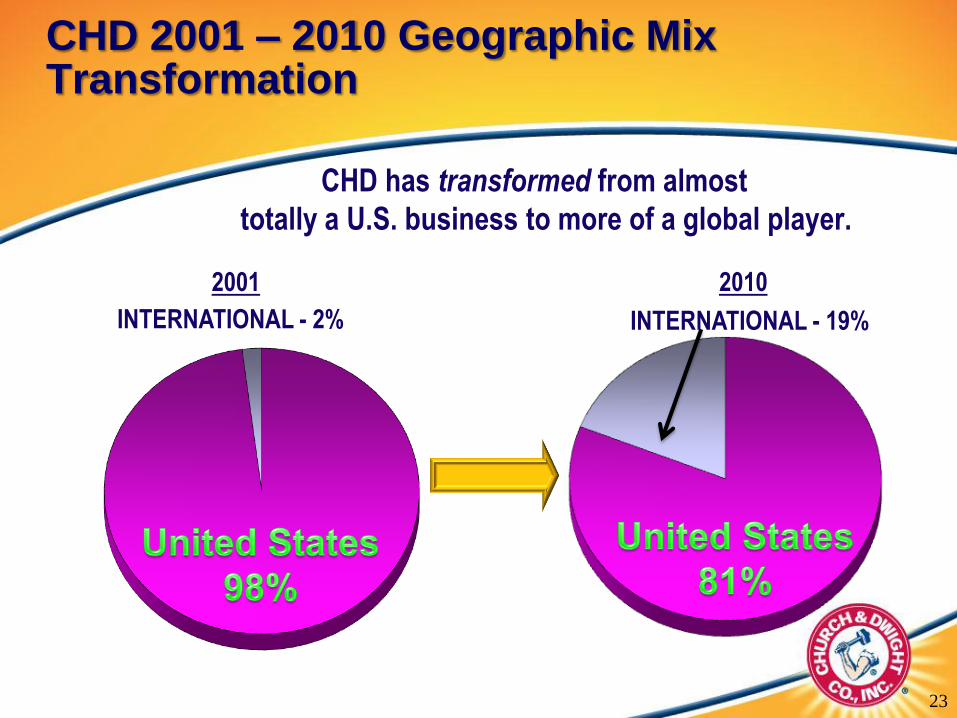
CHD has transformed from almost
totally a U.S. business to more of a global player.
INTERNATIONAL - 2%
2001 2010
INTERNATIONAL - 19%
CHD 2001 – 2010 Geographic Mix Transformation
23
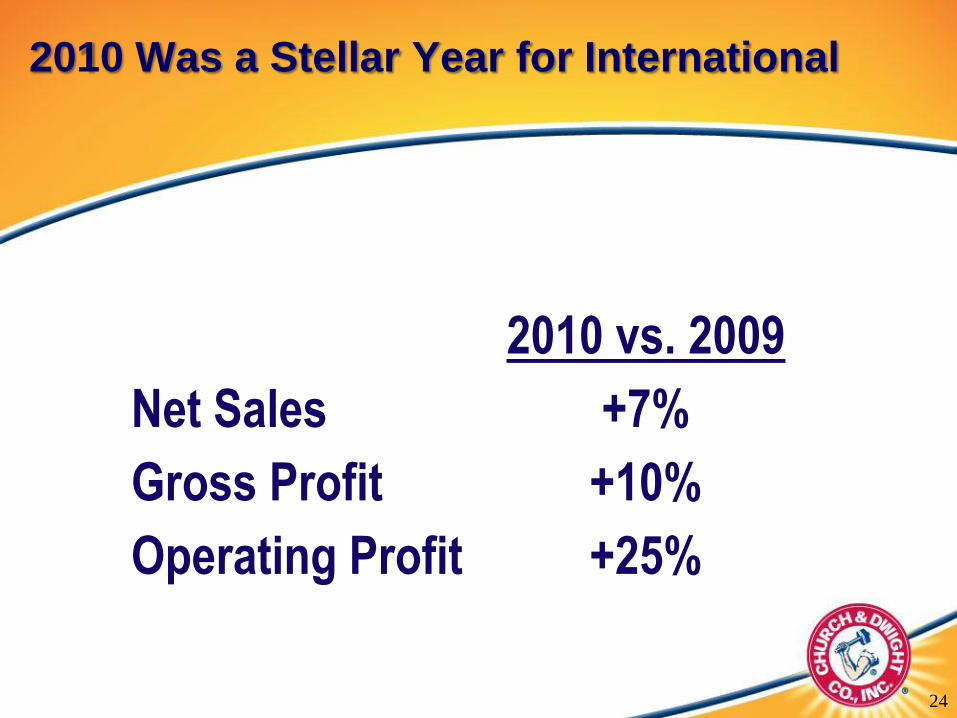
2010 Was a Stellar Year for International
2010 vs. 2009
Net Sales +7%
Gross Profit +10%
Operating Profit +25%
24
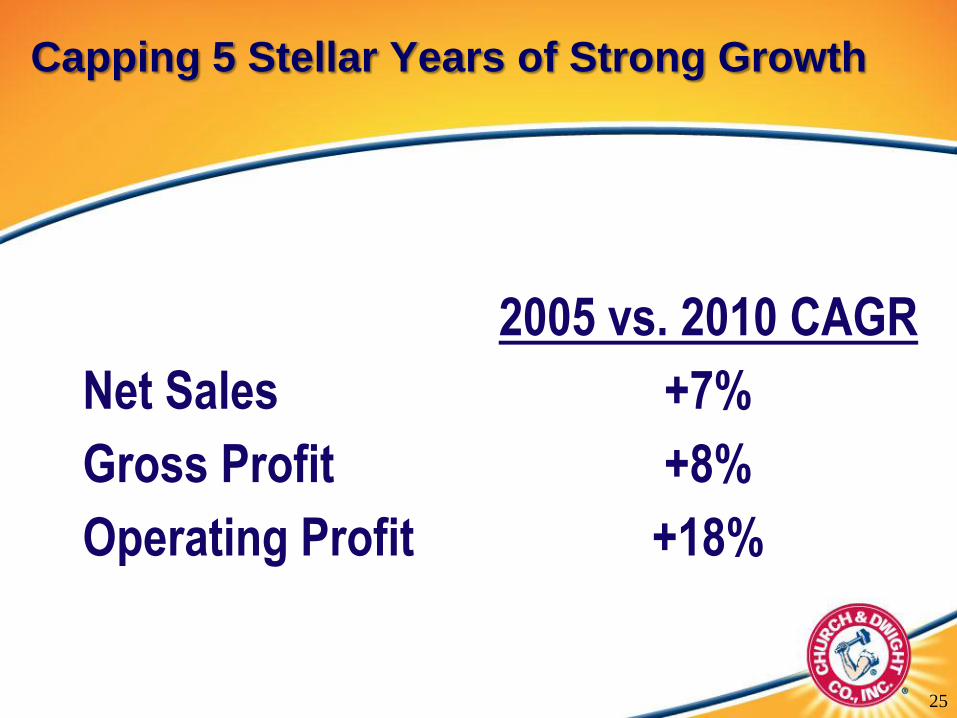
Capping 5 Stellar Years of Strong Growth
2005 vs. 2010 CAGR
Net Sales +7%
Gross Profit +8%
Operating Profit +18%
25
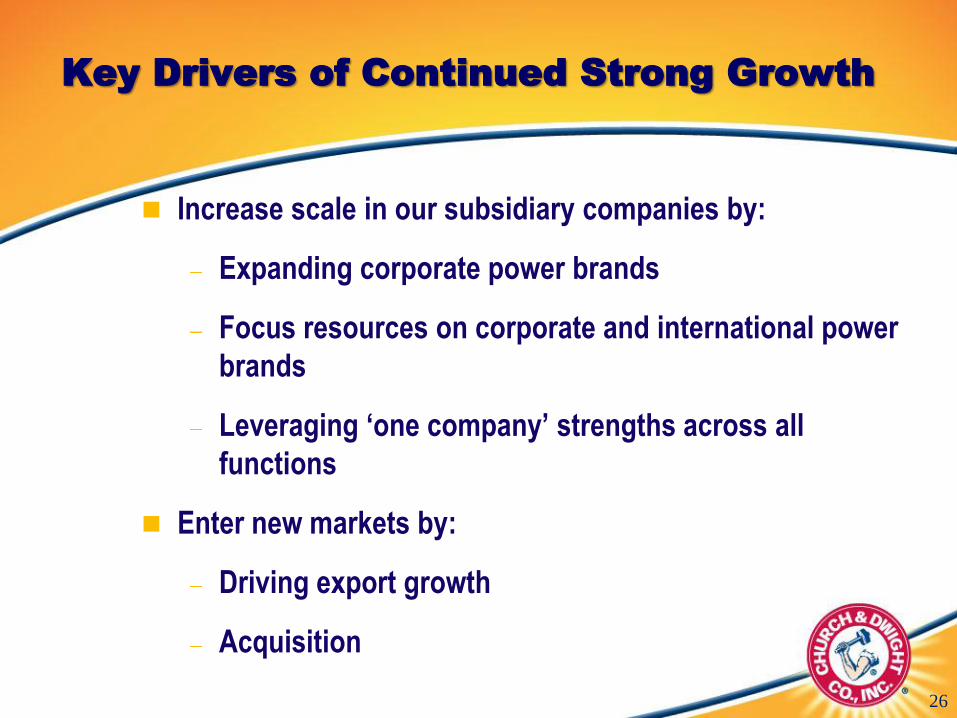
Key Drivers of Continued Strong Growth
Increase scale in our subsidiary companies by:
Expanding corporate power brands
Focus resources on corporate and international power
brands
Leveraging ‘one company’ strengths across all
functions
Enter new markets by:
Driving export growth
Acquisition
26
5. Expanding Gross
Margin
27
Top 10 TSR Drivers
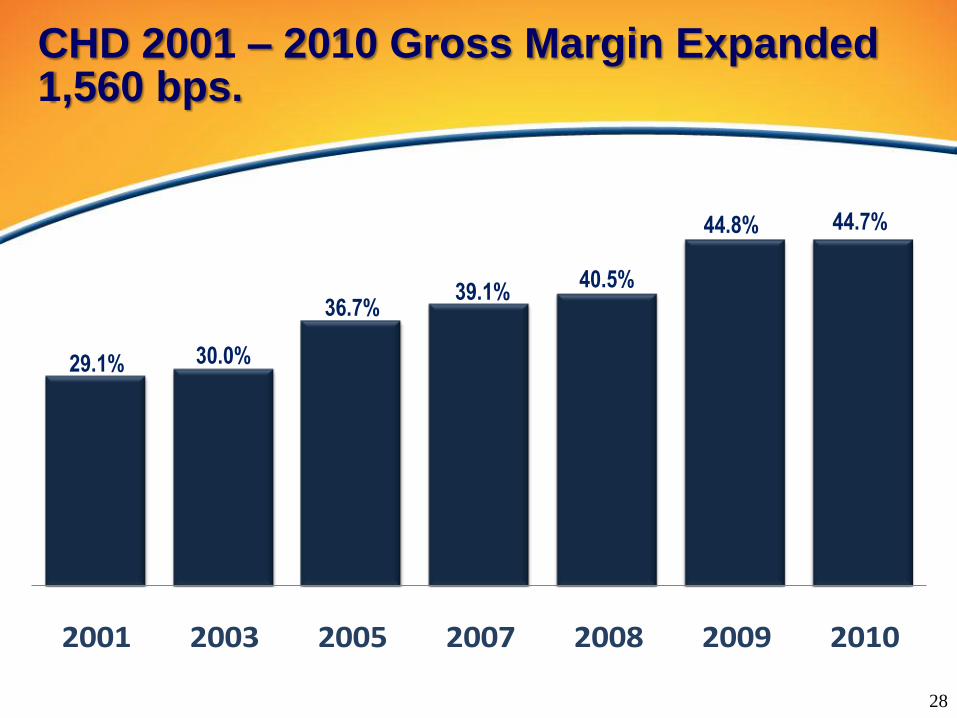
CHD 2001 – 2010 Gross Margin Expanded 1,560 bps.
2001 2003 2005 2007 2008 2009 2010
30.0%29.1%
36.7%39.1%
40.5%
44.7%44.8%
28
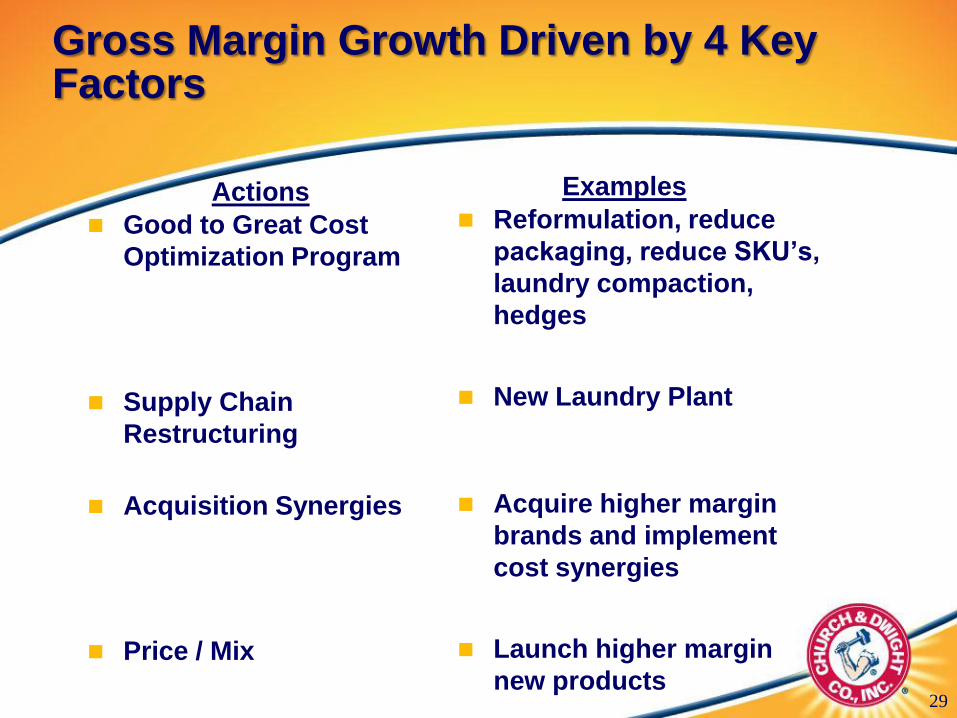
Gross Margin Growth Driven by 4 Key Factors
Good to Great Cost
Optimization Program
Supply Chain
Restructuring
Acquisition Synergies
Price / Mix
29
Reformulation, reduce
packaging, reduce SKU’s,
laundry compaction,
hedges
New Laundry Plant
Acquire higher margin
brands and implement
cost synergies
Launch higher margin
new products
Actions Examples

New Laundry Plant Built in 2009
30
The Davies Plant; York, Pennsylvania
6. Superior Overhead
Management
31
Top 10 TSR Drivers
32
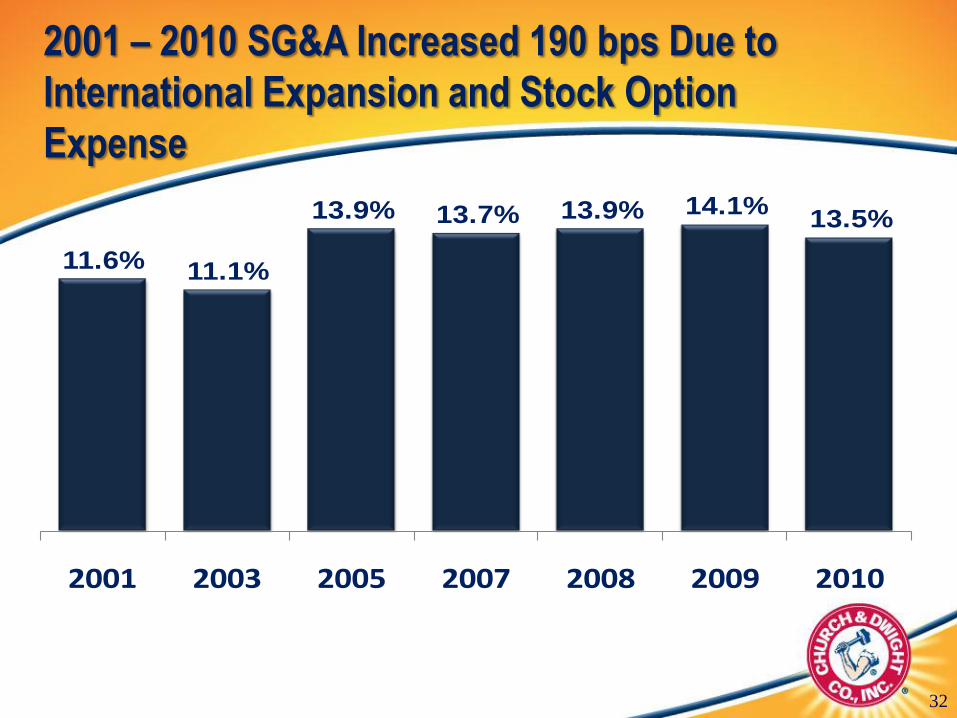
11.6% 11.1%
13.9% 13.7% 13.9% 14.1%13.5%
2001 2003 2005 2007 2008 2009 2010
2001 – 2010 SG&A Increased 190 bps Due to
International Expansion and Stock Option
Expense
33
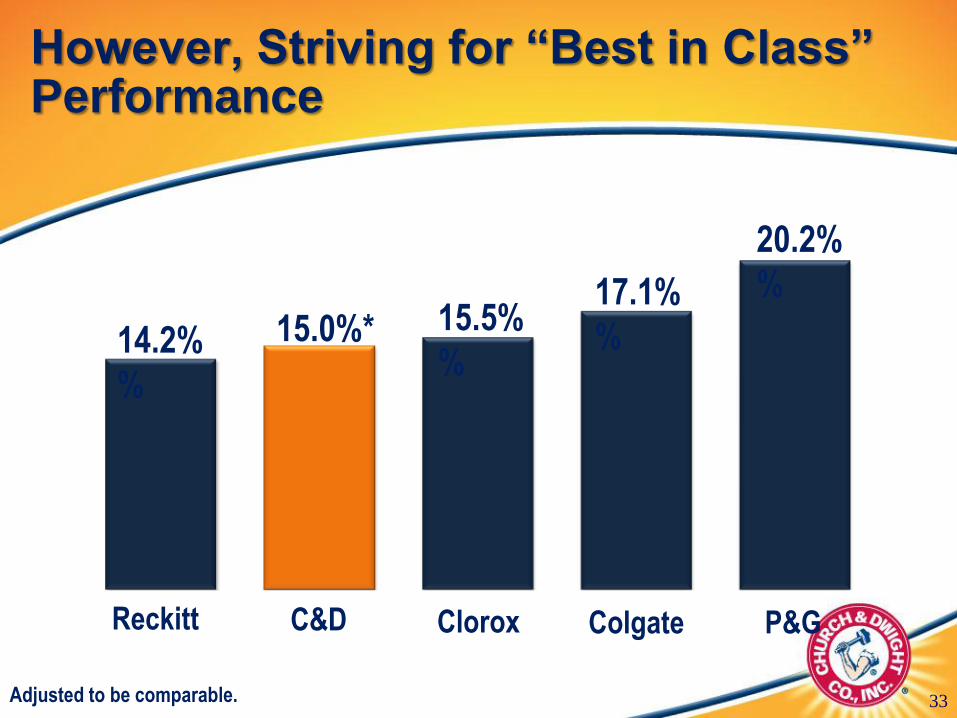
However, Striving for “Best in Class” Performance
14.2%
%
15.5%
%
17.1%
%
20.2%
%
15.0%*
* Increased 1.5% to make expenses from Marketing to SG&A for
Apples-to-Apples comparison.
Reckitt C&D Clorox Colgate P&G
Adjusted to be comparable.
34
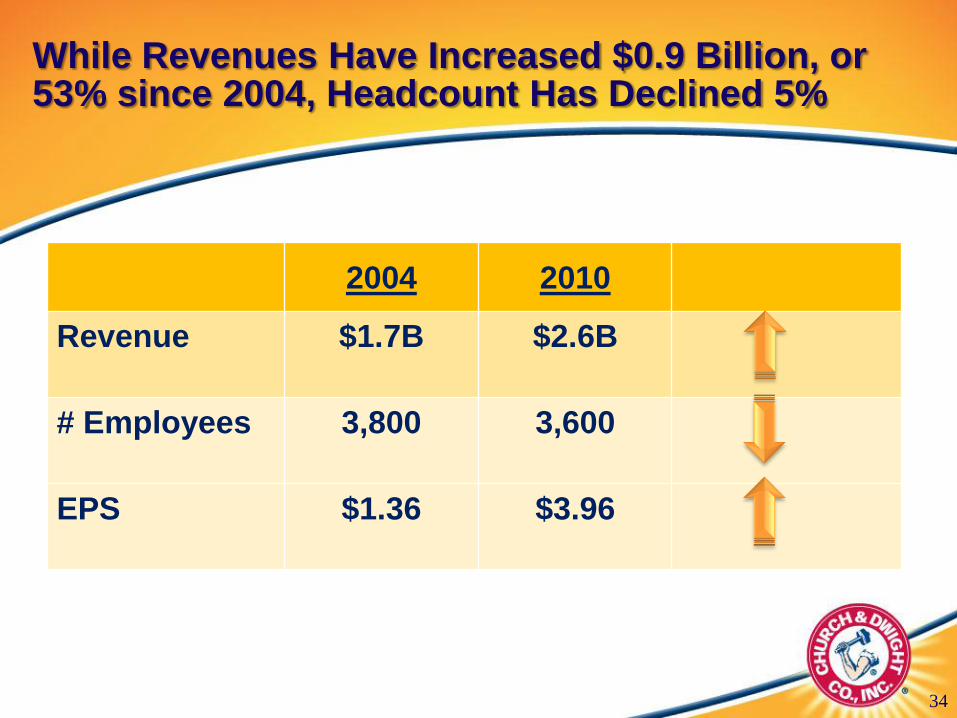
While Revenues Have Increased $0.9 Billion, or 53% since 2004, Headcount Has Declined 5%
2004 2010
Revenue $1.7B $2.6B
# Employees 3,800 3,600
EPS $1.36 $3.96
35
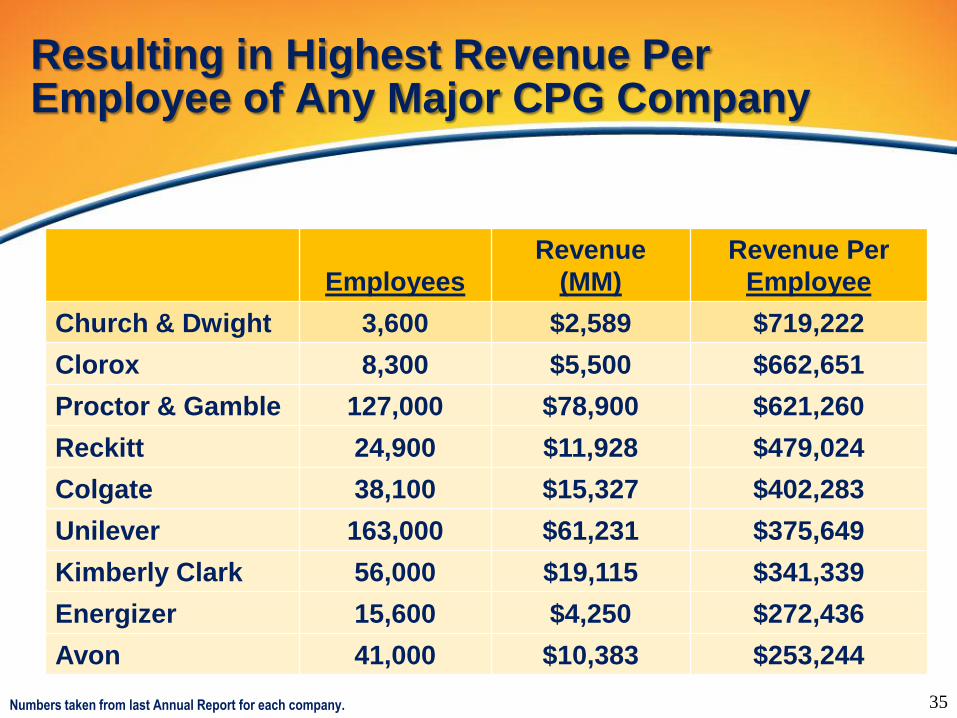
Employees
Revenue
(MM)
Revenue Per
Employee
Church & Dwight 3,600 $2,589 $719,222
Clorox 8,300 $5,500 $662,651
Proctor & Gamble 127,000 $78,900 $621,260
Reckitt 24,900 $11,928 $479,024
Colgate 38,100 $15,327 $402,283
Unilever 163,000 $61,231 $375,649
Kimberly Clark 56,000 $19,115 $341,339
Energizer 15,600 $4,250 $272,436
Avon 41,000 $10,383 $253,244
Resulting in Highest Revenue Per Employee of Any Major CPG Company
Numbers taken from last Annual Report for each company. 35
7. Expert Management
Team
36
Top 10 TSR Drivers
37
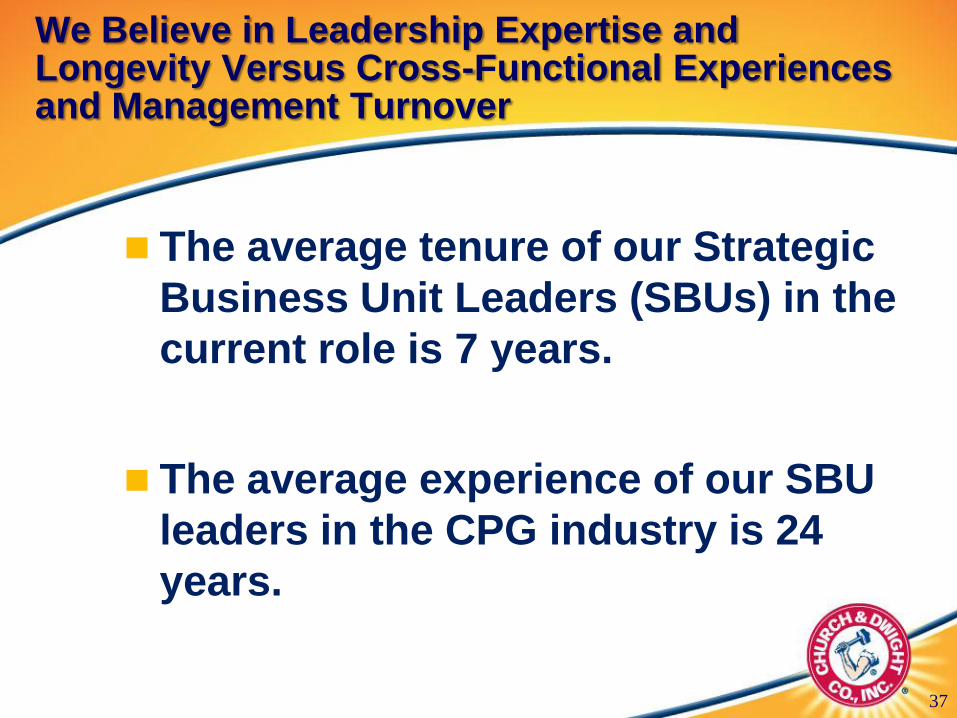
We Believe in Leadership Expertise and Longevity Versus Cross-Functional Experiences and Management Turnover
The average tenure of our Strategic
Business Unit Leaders (SBUs) in the
current role is 7 years.
The average experience of our SBU
leaders in the CPG industry is 24
years.
8. Proven Track Record on
Acquisitions
38
Top 10 TSR Drivers

We Have Tight Acquisition Guidelines to Ensure Accretive Acquisitions
Primarily #1 or #2 Share Brands
Higher Growth, Higher Margin Brands
Asset Light
Leverage CHD Capital Base in
Manufacturing, Logistics and Purchasing
Deliver Sustainable Competitive
Advantage
39
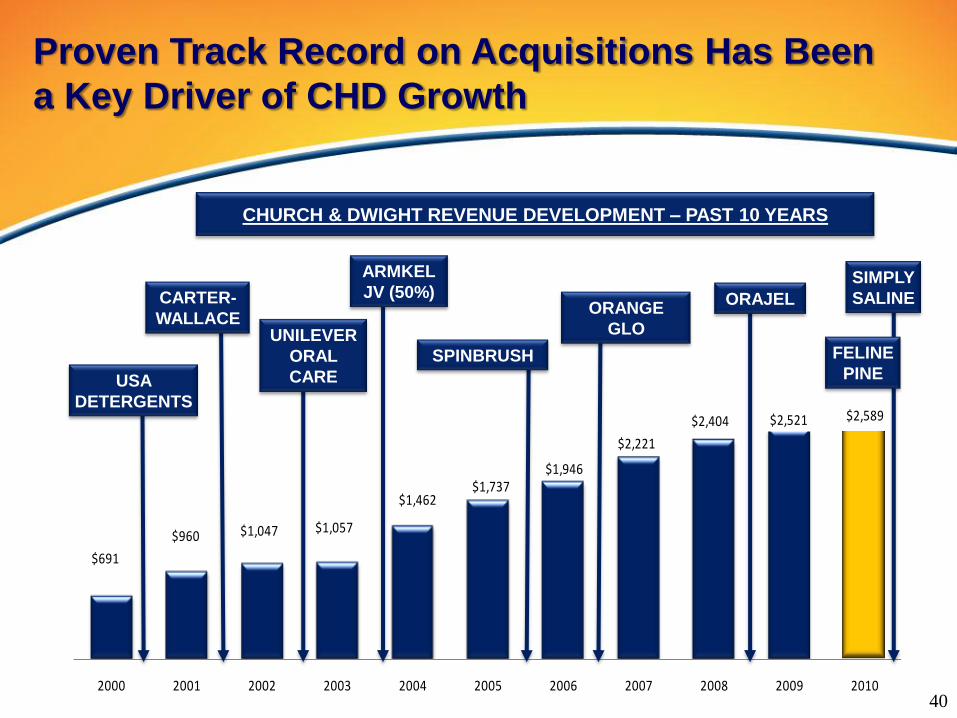
$691
$960 $1,047 $1,057
$1,462$1,737
$1,946
$2,221
$2,404 $2,521 $2,589
2000 2001 2002 2003 2004 2005 2006 2007 2008 2009 2010
SPINBRUSH
ARMKEL
JV (50%)
CHURCH & DWIGHT REVENUE DEVELOPMENT – PAST 10 YEARS
UNILEVER
ORAL
CARE
SIMPLY
SALINE
USA
DETERGENTS
CARTER-
WALLACEORANGE
GLO
ORAJEL
40
FELINE
PINE
Proven Track Record on Acquisitions Has Been
a Key Driver of CHD Growth
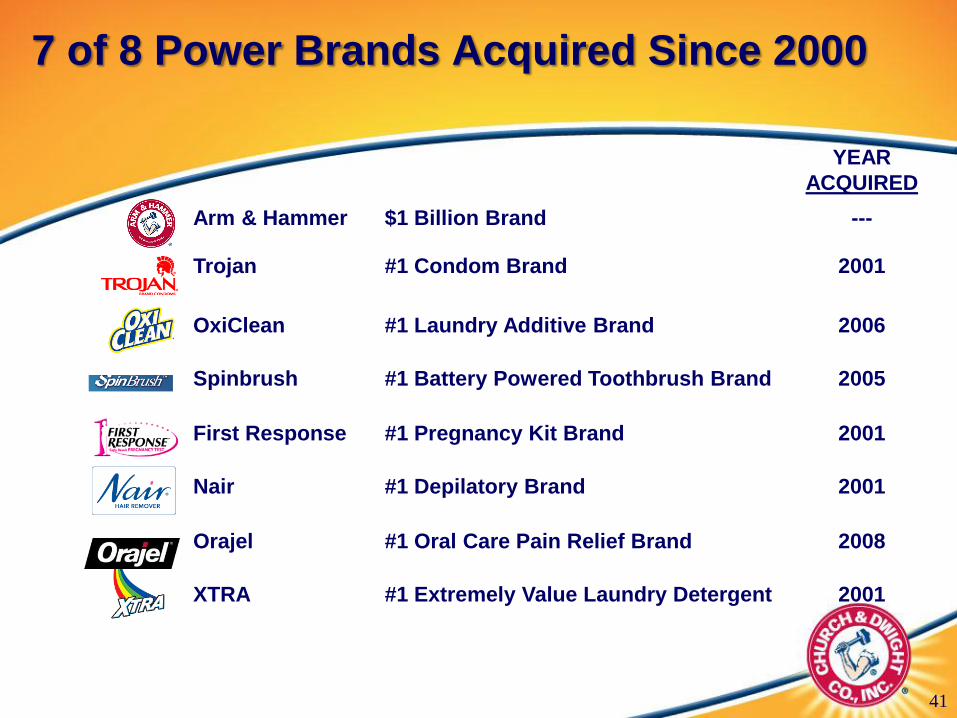
41
YEAR
ACQUIRED
Arm & Hammer $1 Billion Brand ---
Trojan #1 Condom Brand 2001
OxiClean #1 Laundry Additive Brand 2006
Spinbrush #1 Battery Powered Toothbrush Brand 2005
First Response #1 Pregnancy Kit Brand 2001
Nair #1 Depilatory Brand 2001
Orajel #1 Oral Care Pain Relief Brand 2008
XTRA #1 Extremely Value Laundry Detergent 2001
7 of 8 Power Brands Acquired Since 2000
42
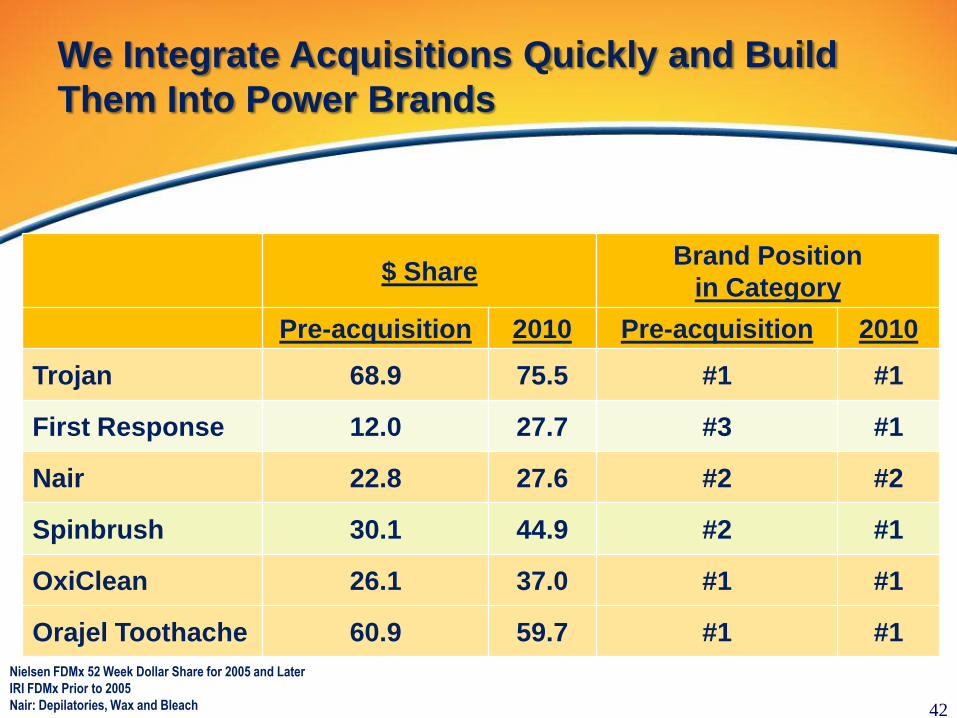
We Integrate Acquisitions Quickly and Build
Them Into Power Brands
Nielsen FDMx 52 Week Dollar Share for 2005 and Later
IRI FDMx Prior to 2005
Nair: Depilatories, Wax and Bleach
$ ShareBrand Position
in Category
Pre-acquisition 2010 Pre-acquisition 2010
Trojan 68.9 75.5 #1 #1
First Response 12.0 27.7 #3 #1
Nair 22.8 27.6 #2 #2
Spinbrush 30.1 44.9 #2 #1
OxiClean 26.1 37.0 #1 #1
Orajel Toothache 60.9 59.7 #1 #1

9. Best in Class Free
Cash Flow Conversion
43
Top 10 TSR Drivers
44
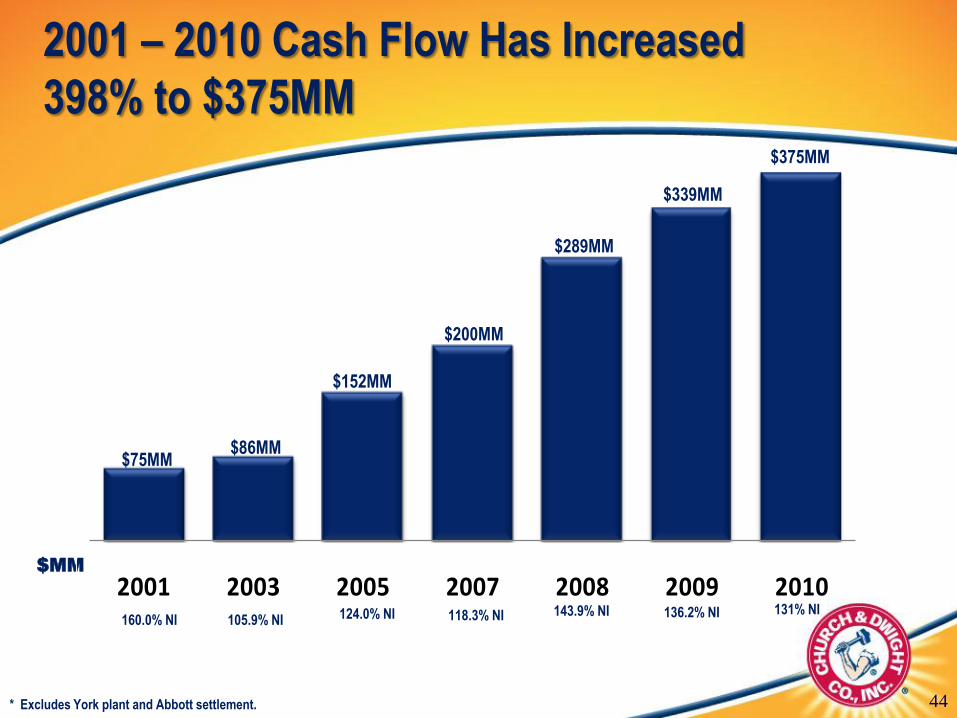
2001 2003 2005 2007 2008 2009 2010160.0% NI
$MM
105.9% NI 124.0% NI 118.3% NI 143.9% NI 131% NI
2001 – 2010 Cash Flow Has Increased
398% to $375MM
136.2% NI
* Excludes York plant and Abbott settlement.
$75MM$86MM
$152MM
$200MM
$289MM
$339MM
$375MM
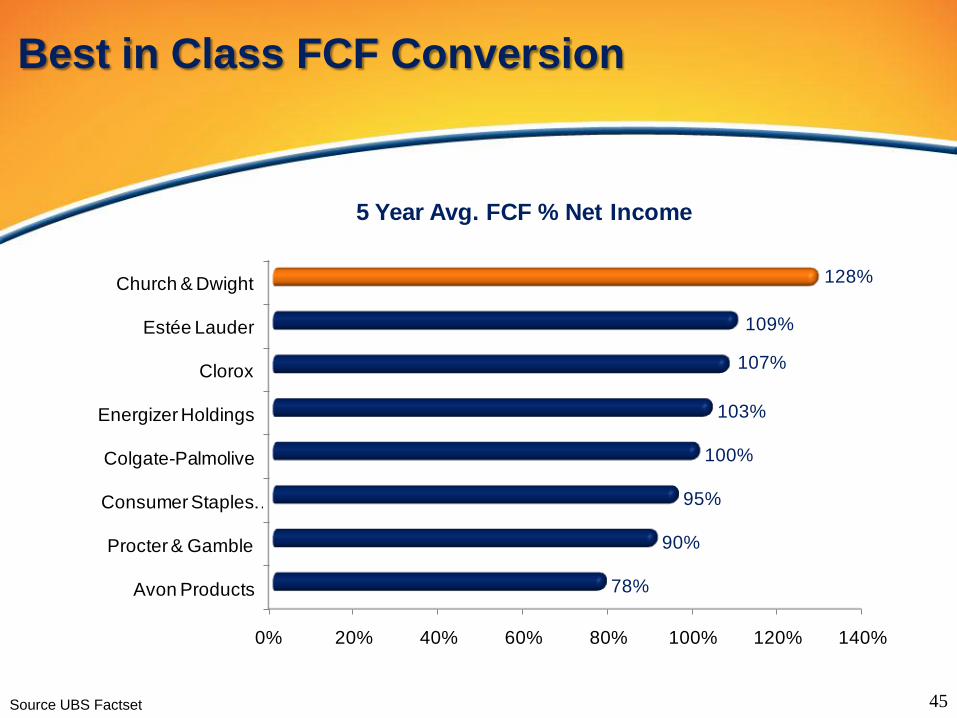
Best in Class FCF Conversion
0% 20% 40% 60% 80% 100% 120% 140%
Avon Products
Procter & Gamble
Consumer Staples …
Colgate-Palmolive
Energizer Holdings
Clorox
Estée Lauder
Church & Dwight
78%
90%
95%
100%
103%
107%
109%
128%
5 Year Avg. FCF % Net Income
Source UBS Factset 4545
10. TSR Junkies
46
Top 10 TSR Drivers
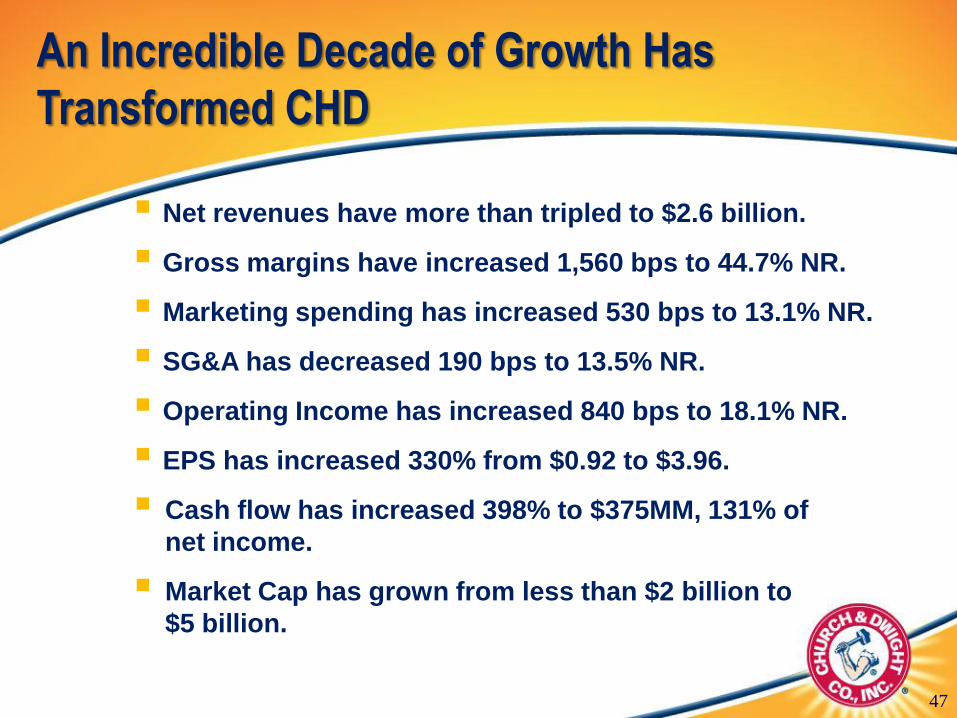
Net revenues have more than tripled to $2.6 billion.
Gross margins have increased 1,560 bps to 44.7% NR.
Marketing spending has increased 530 bps to 13.1% NR.
SG&A has decreased 190 bps to 13.5% NR.
Operating Income has increased 840 bps to 18.1% NR.
EPS has increased 330% from $0.92 to $3.96.
Cash flow has increased 398% to $375MM, 131% of
net income.
Market Cap has grown from less than $2 billion to
$5 billion.
47
An Incredible Decade of Growth Has
Transformed CHD
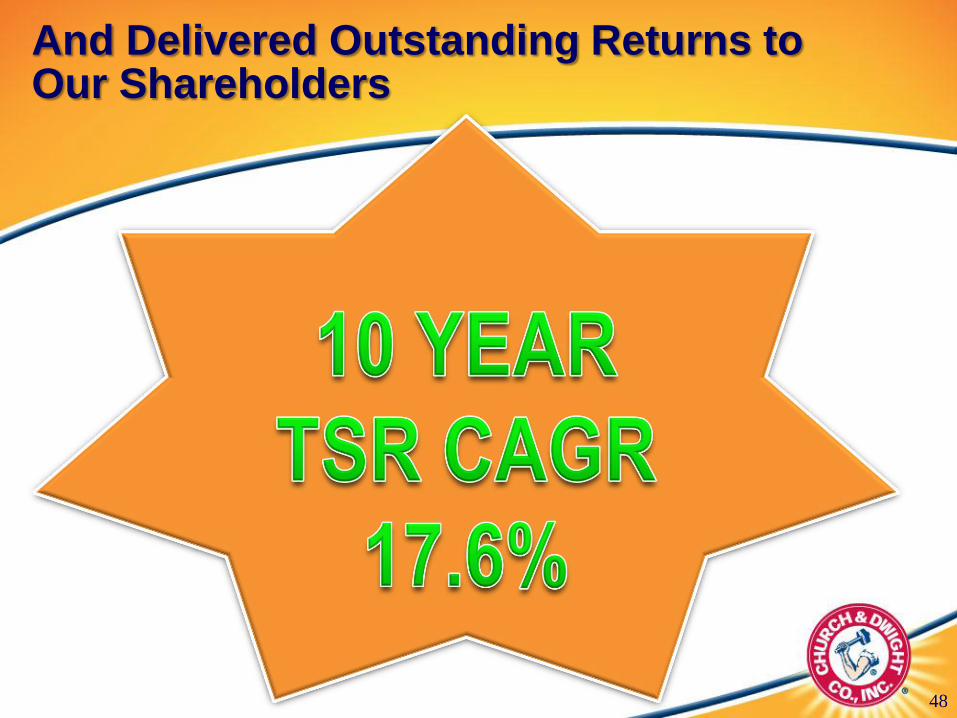
And Delivered Outstanding Returns to Our Shareholders
48
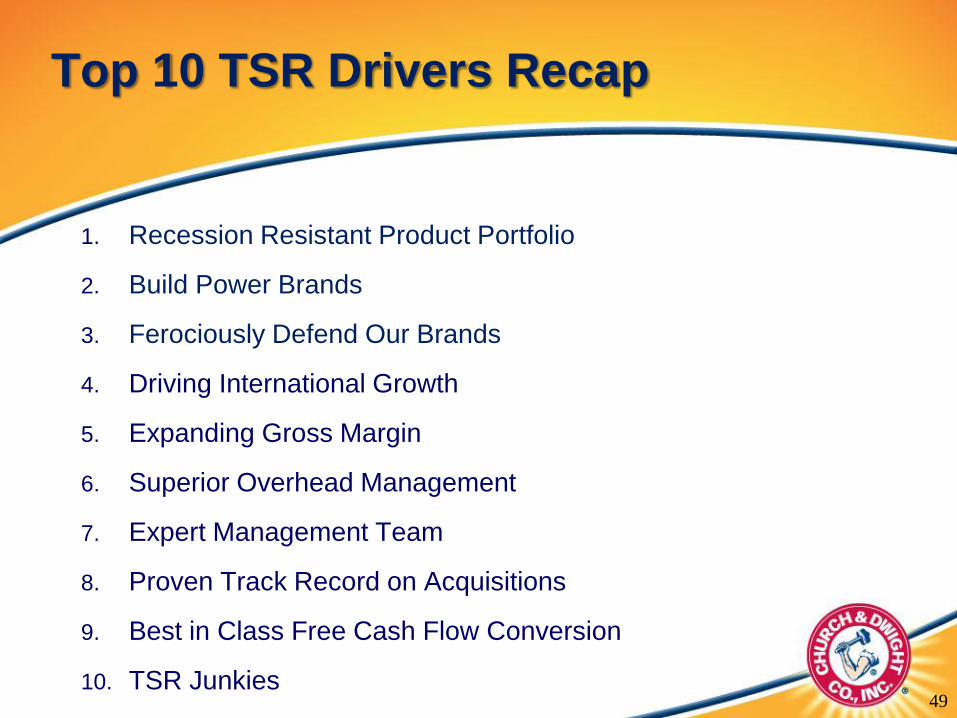
1. Recession Resistant Product Portfolio
2. Build Power Brands
3. Ferociously Defend Our Brands
4. Driving International Growth
5. Expanding Gross Margin
6. Superior Overhead Management
7. Expert Management Team
8. Proven Track Record on Acquisitions
9. Best in Class Free Cash Flow Conversion
10. TSR Junkies49
Top 10 TSR Drivers Recap
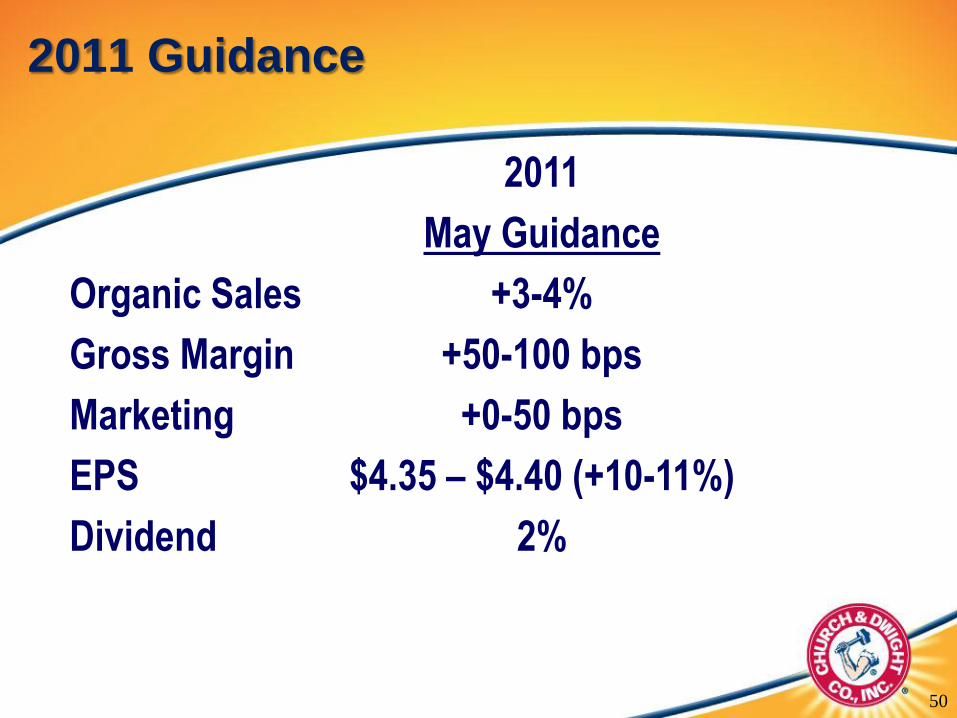
2011 Guidance
2011
May Guidance
Organic Sales +3-4%
Gross Margin +50-100 bps
Marketing +0-50 bps
EPS $4.35 – $4.40 (+10-11%)
Dividend 2%
50

Headed for “10 for 20” Club:Still Time to Get on Board
51
51
1. Top 10 TSR Drivers Jim Craigie
2. Q&A Jim Craigie
Matt Farrell
Agenda
52