Embed Size (px)
Citation preview

2016 Global Energy Conference
Goldman Sachs
Mark Smith| Sr. EVP & CFO| Miami, FL | January 6, 2016

GS Energy Conference 0116
Forward-Looking / Cautionary StatementsThis presentation contains forward-looking statements that involve risks and uncertainties that could materially affect our expected resultsof operations, liquidity, cash flows and business prospects, and reported results should not be considered an indication of futureperformance. Such statements specifically include our expectations as to our future financial position, drilling program, production,projected costs, future operations, hedging activities, capital investments and other guidance included in this presentation. Factors (but notnecessarily all the factors) that could cause results to differ include: commodity price fluctuations; the effect of our debt on our business;sufficiency of our operating cash flow to fund planned capital investments; the ability to obtain government permits and approvals;effectiveness of our capital investments; restrictions and changes in restrictions imposed by regulations including those related to our abilityto obtain, use, manage or dispose of water; risks of drilling; tax law changes; competition with larger, better funded competitors for andcosts of oilfield equipment, services, qualified personnel and acquisitions; the subjective nature of estimates of proved reserves and relatedfuture net cash flows; restriction of operations to, and concentration of exposure to events such as industrial accidents, refinery shutdowns,natural disasters and labor difficulties in, California; concerns about climate change and air quality issues; lower-than-expected productionfrom development projects or acquisitions; catastrophic events for which we may be uninsured or underinsured; cyber attacks; operationalissues that restrict market access; and uncertainties related to the spin-off and the agreements related thereto. Material risks are furtherdiscussed in “Risk Factors” in our Annual Report on Form 10-K available on our website at crc.com. Words such as "aim," "anticipate,""believe," "budget," "continue," "could," "effort," "estimate," "expect," "forecast," "goal," "guidance," "intend," "likely," "may," "might,""objective," "outlook," "plan," "potential," "predict," "project," "seek," "should," "target, "will" or "would" “or similar expressions that convey theprospective nature of events or outcomes generally indicate forward-looking statements. Any forward-looking statement speaks only as ofthe date on which such statement is made and the Company undertakes no obligation to correct or update any forward-looking statement,whether as a result of new information, future events or otherwise, except as required by applicable law.
This presentation includes financial measures that are not in accordance with United States generally accepted accounting principles(“GAAP”), including PV-10 and Adjusted EBITDAX. While management believes that such measures are useful for investors, they should notbe used as a replacement for financial measures that are in accordance with GAAP. For a reconciliation of Adjusted EBITDAX to the nearestcomparable measure in accordance with GAAP, please see the Appendix.
2

GS Energy Conference 0116
Cautionary Statements RegardingHydrocarbon Quantities
We have provided internally generated estimates for proved reserves and aggregated proved, probable and possible reserves (“3P Reserves”) as ofDecember 31, 2014 in this presentation, with each category of reserves estimated in accordance with SEC guidelines and definitions, though wehave not reported all such estimates to the SEC. As used in this presentation:
• Probable reserves. We use deterministic methods to estimate probable reserve quantities, and when deterministic methods are used, itis as likely as not that actual remaining quantities recovered will exceed the sum of estimated proved plus probable reserves.
• Possible reserves. We use deterministic methods to estimate possible reserve quantities, and when deterministic methods are used toestimate possible reserve quantities, the total quantities ultimately recovered from a project have a low probability of exceeding provedplus probable plus possible reserves.
The SEC prohibits companies from aggregating proved, probable and possible reserves estimated using deterministic estimation methods in filingswith the SEC due to the different levels of certainty associated with each reserve category.
Actual quantities that may ultimately be recovered from our interests may differ substantially from the estimates in this presentation. Factorsaffecting ultimate recovery include the scope of our ongoing drilling program, which will be directly affected by commodity prices, the availability ofcapital, regulatory approvals, drilling and production costs, availability of drilling services and equipment, drilling results, lease expirations,transportation constraints and other factors; actual drilling results, which may be affected by geological, mechanical and other factors thatdetermine recovery rates; and budgets based upon our future evaluation of risk, returns and the availability of capital.
We use the term “oil-in-place”, “net unrisked 3P resources”, “net unrisked prospective resources” and “estimated ultimate recovery” in thispresentation to describe estimates of potentially recoverable hydrocarbons remaining in the applicable reservoir. SEC guidelines restrict us fromincluding these measures in filings with the SEC. These have been estimated internally without review by independent engineers and may includeshale resources which are not considered in most older, publicly available estimates. Actual recovery of these potential resource volumes isinherently more speculative than recovery of estimated reserves and any such recovery will be dependent upon future design and implementationof a successful development plan. Management’s estimate of original hydrocarbons in place includes historical production plus estimates ofproved, probable and possible reserves and a gross resource estimate that has not been reduced by appropriate factors for potential recovery andas a result differs significantly from estimates of hydrocarbons that can potentially be recovered. Ultimate recoveries will be dependent uponnumerous factors including those noted above. In addition, we discuss “PUD-like” reserves by which we mean reserves for which our technicalevaluation indicates that we would book the reserves as proved undeveloped reserves except that we do not expect to develop them within fiveyears. These are not proved reserves in accordance with SEC regulations.
3

GS Energy Conference 01164
2015-16 Strategic Focus
• Priorities and Response
• Deleverage the Balance Sheet for Flexibility
• Protect the Base
• Defend our Margins
• Prepare for Change in Cycle

GS Energy Conference 0116
Sacramento Basin19 MMBoe Proved Reserves
7 MBoe/d production
San Joaquin Basin525 MMBoe Proved Reserves
111 MBoe/d production
Ventura Basin58 MMBoe Proved Reserves
10 MBoe/d production
Los Angeles Basin166 MMBoe Proved Reserves
33 MBoe/d production
• World-Class Resource Base In 4 of 12 largest fields in the
continental U.S.
768 MMBoe proved reserves (2014)
• Capital Structure No significant near-term debt maturities
Progressing options to reduce spin-off debt
Adjusted 2015 capital investment plan to$440mm, down 80% from 2014 level
• Positioned to Grow as Prices Increase Internally funded capital program designed to
live within cash flow and drive growth
• Low decline rate that is flattening
• Increasing crude oil mix improves margins
Operating flexibility to shift basins and drivemechanisms to optimize growth throughcommodity price cycles
CRC at a Glance
Reserves as of 12/31/14; Production figures reflect average YTD 2015 rates through 9/30/15.
5
GS Energy Conference 0116
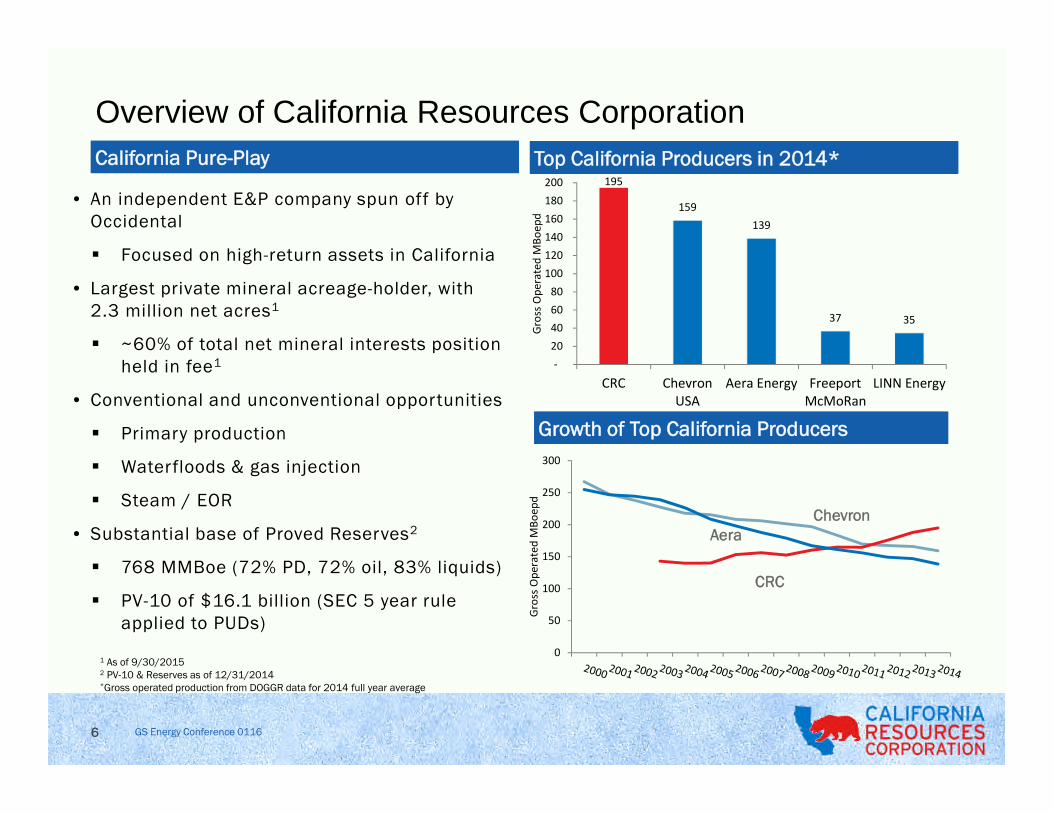
Overview of California Resources Corporation
California Pure-PlayCalifornia Pure-Play Top California Producers in 2014*Top California Producers in 2014*
• An independent E&P company spun off byOccidental
Focused on high-return assets in California
• Largest private mineral acreage-holder, with2.3 million net acres1
~60% of total net mineral interests positionheld in fee1
• Conventional and unconventional opportunities
Primary production
Waterfloods & gas injection
Steam / EOR
• Substantial base of Proved Reserves2
768 MMBoe (72% PD, 72% oil, 83% liquids)
PV-10 of $16.1 billion (SEC 5 year ruleapplied to PUDs)
1 As of 9/30/20152 PV-10 & Reserves as of 12/31/2014*Gross operated production from DOGGR data for 2014 full year average
6
0
50
100
150
200
250
300
Gro
ssO
per
ated
MB
oep
d
Growth of Top California ProducersGrowth of Top California Producers
195
159
139
37 35
-
20
40
60
80
100
120
140
160
180
200
CRC ChevronUSA
Aera Energy FreeportMcMoRan
LINN Energy
Gro
ssO
per
ated
MB
oep
dAera
Chevron
CRC

GS Energy Conference 01167
2015 - 2016 Strategic Focus
• Maintaining base production via higher margin, higher return,low decline crude oil projects
• Balancing capital spending with cash flows
• Right-sizing the capital structure
• Focusing on cash margins and controllable items such asefficiency, operating cost and overhead
• Continuing exceptional Health, Safety and Environmentalpractices
• Proactively engaging in community outreach efforts
CRC expects to ultimately emerge in a stronger position toramp-up activity when the commodity cycle improves

GS Energy Conference 01168
2015-16 Strategic Focus
• Priorities and Response
• Deleverage the Balance Sheet for Flexibility
• Protect the Base
• Defend our Margins
• Prepare for Change in Cycle

GS Energy Conference 0116
Capitalization as of 9/30/15 ($MM) –Proforma for 12/15/15 Exchange
$25
$625$466
$829
$2,250
892
$0
$500
$1,000
$1,500
$2,000
$2,500
Jan
-16
Jul-
16
Jan
-17
Jul-
17
Jan
-18
Jul-
18
Jan
-19
Jul-
19
Jan
-20
Jul-
20
Jan
-21
Jul-
21
Jan
-22
Jul-
22
Jan
-23
Jul-
23
Jan
-24
Jul-
24
Term Loan
Debt Maturities ($MM)
Focus on Balance Sheet
9
Senior Secured RCF1
481
Senior Secured Term Loan 1,000
Senior Secured Notes 2,250
Senior Unsecured Notes 2,187
Total Debt 5,918
Less cash and deferred financing costs (65)
Total Net Debt 5,853
Equity 2,355
Total Net Capitalization 8,208
Total Net Debt / Net Capitalization 71%
Total Net Debt / LTM Adjusted EBITDAX 5.2x
LTM Adjusted EBITDAX / Interest Expense 2 3.5x
PV-103
/ Total Net Debt 2.75x
Total Net Debt / Proved Reserves ($/Boe) $7.62
Total Net Debt / PD Reserves ($/Boe) $10.60
Total Net Debt / '14 Production ($/Boepd) $36,811
• Deleveraging is a priority
• November credit facility amendmentprovides additional financial flexibility
• Bond exchange offer completed
• Ratings action initiated transition tosecured borrowing base facility
• New secured borrowing base wasestablished at $3.0 billion withapproximately $1.5 billion outstanding
1 We have the ability to incur total borrowings of $2.0 billion less outstanding amounts subject tocompliance with our quarterly financial covenants which currently limit our ability to utilize the fullamount.
2 Assumes full year interest expense at indicated debt levels and current interest rates.3 PV-10 as of 12/31/14 based on SEC five-year rule applied to PUDs using SEC price deck.

GS Energy Conference 0116
• Lender group approved several amendment provisions to provide CRC additional flexibility to manageour business through the challenging commodity price environment
• Amended financial covenants that revert to original covenants once outside of the borrowing baseperiod
Consolidated First Lien Senior Secured Leverage Ratio
Consolidated Interest Expense Ratio
• Other amendment changes
Permitted second lien basket of $2.25 billion (used in recent exchange) with excess cash sweep ofamounts > $250 million
Basket carveouts for contemplated transactions which permit up to 50% of net cash proceeds topotentially repurchase junior debt; the remaining 50% is required to be used to repay outstandingterm loans.
Facility contemplates the monetization of midstream assets with no reduction to the borrowing base
Approved Credit Facility Amendment Provides AdditionalFinancial Flexibility
Consolidated leverage ratio Consolidated interest expense ratio
10
Borrowing Base Period:Maximum First Lien Leverage Ratio : 2.25x Minimum Interest Expense Ratio : 2.0x
Pathway to Investment Grade:Maximum Total Leverage Ratio: 4.50x Minimum Interest Expense Ratio : 2.5x
GS Energy Conference 011611
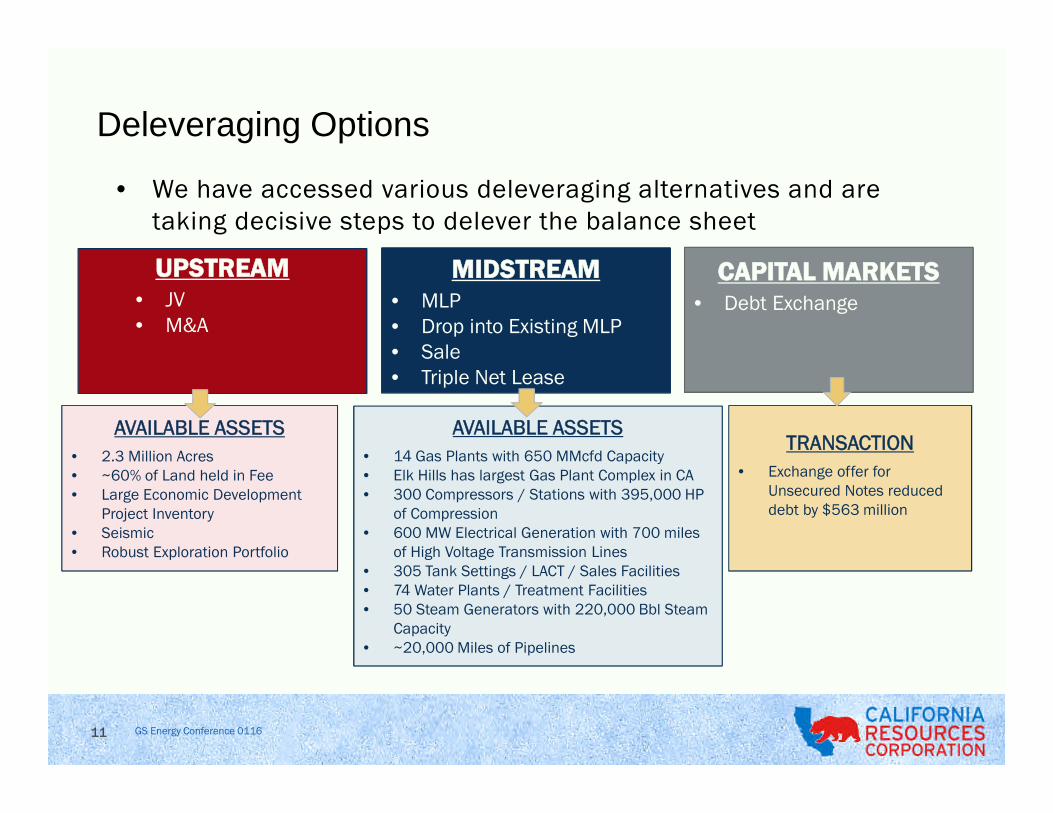
• We have accessed various deleveraging alternatives and aretaking decisive steps to delever the balance sheet
Deleveraging Options
UPSTREAM• JV• M&A
MIDSTREAM• MLP• Drop into Existing MLP• Sale• Triple Net Lease
CAPITAL MARKETS• Debt Exchange
AVAILABLE ASSETS
• 14 Gas Plants with 650 MMcfd Capacity• Elk Hills has largest Gas Plant Complex in CA• 300 Compressors / Stations with 395,000 HP
of Compression• 600 MW Electrical Generation with 700 miles
of High Voltage Transmission Lines• 305 Tank Settings / LACT / Sales Facilities• 74 Water Plants / Treatment Facilities• 50 Steam Generators with 220,000 Bbl Steam
Capacity• ~20,000 Miles of Pipelines
AVAILABLE ASSETS
• 2.3 Million Acres• ~60% of Land held in Fee• Large Economic Development
Project Inventory• Seismic• Robust Exploration Portfolio
TRANSACTION
• Exchange offer forUnsecured Notes reduceddebt by $563 million

GS Energy Conference 011612
2015-16 Strategic Focus
• Priorities and Response
• Deleverage the Balance Sheet for Flexibility
• Protect the Base
• Defend our Margins
• Prepare for Change in Cycle

GS Energy Conference 011613
Best in Class Corporate Decline Rate
Unlabeled operators include : AMXG, AREX, BBG, BCEI, CLR, CPE, CRK, CWEI, CXO, EGN, EOG, EPE, EXXI, FANG, GDP, HK, JONE, LPI, MPO, NFX, OAS, PDCE, PE, PVA, PXD, ROSE, RSPP, SFY, SM,SN, TPLM, WTI, XEC
Source: ITG IR, raw data provided by Drilling Info, Inc.
GS Energy Conference 0116
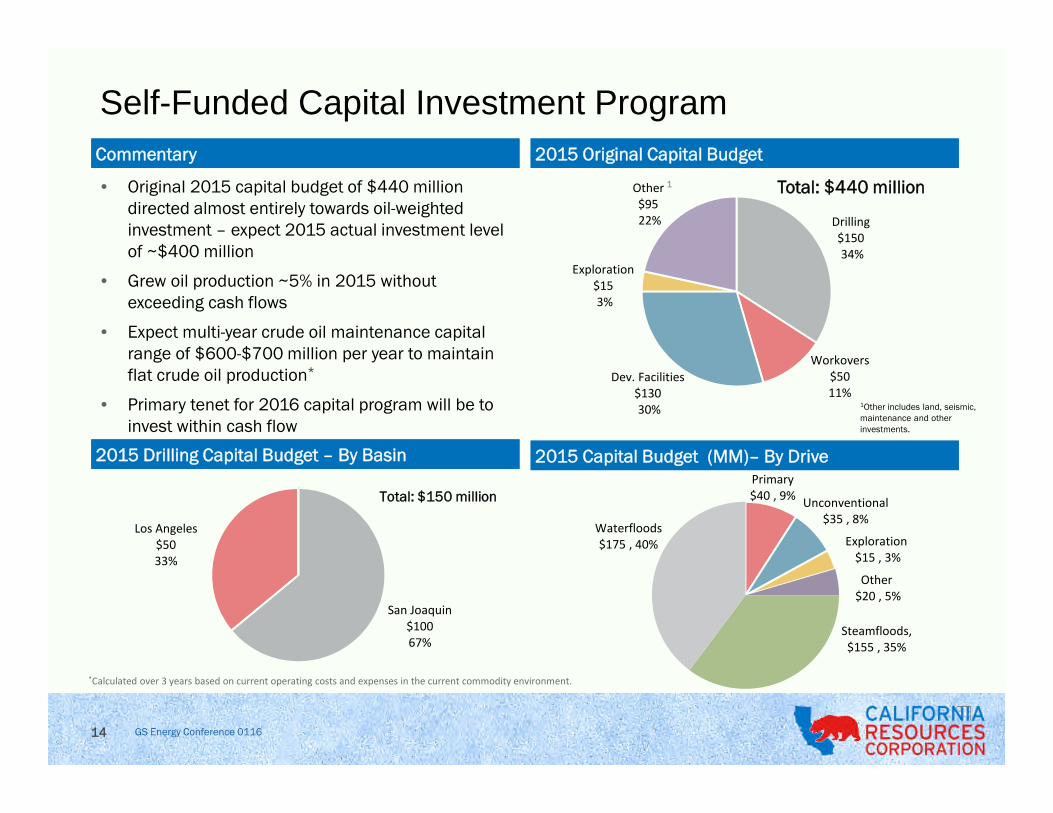
Drilling$15034%
Dev. Facilities$13030%
Workovers$5011%
Exploration$153%
Other$9522%
CommentaryCommentary
2015 Drilling Capital Budget – By Basin2015 Drilling Capital Budget – By Basin
2015 Original Capital Budget2015 Original Capital Budget
2015 Capital Budget (MM)– By Drive2015 Capital Budget (MM)– By Drive
• Original 2015 capital budget of $440 milliondirected almost entirely towards oil-weightedinvestment – expect 2015 actual investment levelof ~$400 million
• Grew oil production ~5% in 2015 withoutexceeding cash flows
• Expect multi-year crude oil maintenance capitalrange of $600-$700 million per year to maintainflat crude oil production*
• Primary tenet for 2016 capital program will be toinvest within cash flow
Total: $440 million
Total: $150 millionPrimary$40 , 9%
Unconventional$35 , 8%
Exploration$15 , 3%
Other$20 , 5%
Steamfloods,$155 , 35%
Waterfloods$175 , 40%
1Other includes land, seismic,maintenance and otherinvestments.
1
Self-Funded Capital Investment Program
14
*Calculated over 3 years based on current operating costs and expenses in the current commodity environment.
San Joaquin$10067%
Los Angeles$5033%

GS Energy Conference 0116
Resource Base Enables Resilient Production ProfileRich asset portfolio and thoughtful capital
allocation deliver high margin production and
operational flexibility through the price cycle
• Conventional assets have relatively low
decline rates, long production life
• Steamflood and waterflood investments
delivered ~5% crude oil growth in 2015
with little new investment; characterized
by single digit base decline rates
• Large inventory of conventional
development projects that are expected to
be repeatable, with low technical risk
Application of modern technologies producesgrowth opportunity in California
• Deferring many high-return project
opportunities until prices rise
• Identifying investments economically
viable through commodity price cycles
15
Production By Stream (MBoe/d)
Oil NGL Gas Guidance
AverageTotal Production
159 Mboe/d
AverageOil Production
99 MBbl/d

GS Energy Conference 011616
2015-16 Strategic Focus
• Priorities and Response
• Deleverage the Balance Sheet for Flexibility
• Protect the Base
• Defend our Margins
• Prepare for Change in Cycle

GS Energy Conference 0116
$95.12 $94.21 $97.97$93.00
$51.00
$103.80 $104.02$104.16
$92.30
$50.28
$110.90 $111.70 $108.76
$99.51
$56.61
$30
$40
$50
$60
$70
$80
$90
$100
$110
$120
2011 2012 2013 2014 YTD 3Q15
$/B
bl
WTI Realizations Brent
$4.11
$2.81
$3.66
$4.39
$2.86
$4.31
$2.94
$3.73
$4.34
$2.72
0.0
0.5
1.0
1.5
2.0
2.5
3.0
3.5
4.0
4.5
5.0
2011 2012 2013 2014 YTD 3Q15
$/M
cf
NYMEX Realizations
NGL Price Realization - % of WTINGL Price Realization - % of WTI
Realization% of WTI
109% 110% 106 % 99% 97% Realization %of NYMEX
105% 105 % 102 % 101% 92%
Oil Price Realization*Oil Price Realization* Gas Price Realization*Gas Price Realization*
• Since California imports a significant percentage of
its crude oil requirements, California refiners
typically purchase crude oil at international index-
based prices for comparable grades
• California also imports approximately 90% of its
natural gas
• Discrete California market issues have impacted
differentials
74%
56%51% 51%
39%
0%
10%
20%
30%
40%
50%
60%
70%
80%
2011 2012 2013 2014 YTD 3Q15
%o
fW
TICRC – Price Realizations
17
* Reflects realizations with hedges

GS Energy Conference 011618
Opportunistically Built Hedge Portfolio
* - As of November 3, 2015
$40
$45
$50
$55
$60
$65
$70
$75
$80
Q4 2015 Q1 2016 Q2 2016 Q3 2016 Q4 2016
40,000 Bbl/d $73.88 call
40,000 Bbl/d $61.25 put
35,500 Bbl/d $66.15 call
30,500 Bbl/d $52.38 put
3,000 Bbl/d $74.42 call
3,000 Bbl/d $50.00 put
1,000 Bbl/d $61.25 swap
2015/2016 Crude Oil Brent Hedges*2015/2016 Crude Oil Brent Hedges*
• Hedge book started at zero post spin target hedges on 50% of production• Strategy focuses on protecting cash flow for capital investments and covenant compliance• Hedge transactions completed with multiple counterparties• We also have natural gas hedges in place for 4Q15 for 40,000 MMBtu/d at $3.01 per MMBtu as well as a collar
transaction for 20,000 MMBtu/d with a weighted average floor of $2.80 per MMBtu and a ceiling of $3.17 perMMBtu.

GS Energy Conference 011619
Defending Margins Through Efficiencies and Focuson Cash Costs
3Q15 production costs were approximately 8% lower year over year. Lowerthird quarter costs reflected cost reductions across the board, particularly inwell servicing efficiency, surface operations and energy use and were alsoaided by lower natural gas and power prices.
$4.97 $5.00 $5.28 $5.57 $5.09 $5.13 $4.61
$3.74 $3.88 $3.79 $3.55 $3.65 $3.63 $2.89
$19.00 $19.03 $18.35 $16.65 $16.20 $16.59 $16.91
$2.23 $1.06 $1.69 $4.49$1.11 $0.52 $0.34
$0.00
$5.00
$10.00
$15.00
$20.00
$25.00
$30.00
$35.00
1Q14 2Q14 3Q14 4Q14 1Q15 2Q15 3Q15 4Q15E
Cash Costs $/Boe
Adj G&A* Taxes (non income) Production Costs Exploration Guidance
2014 Average = $29.572015E Average = $25.51
* Adjusted G&A expenses exclude early retirement and severance costs which amounted to $10 million in 2Q15 and $62 million in 3Q15.

GS Energy Conference 011620
2015-16 Strategic Focus
• Priorities and Response
• Deleverage the Balance Sheet for Flexibility
• Protect the Base
• Defend our Margins
• Prepare for Change in Cycle

GS Energy Conference 011621
Strong Returns Through the Commodity CycleOil Prices ↑ / Gas Prices ↓
• Invest in steam floods (above 5x Oil/Gas ratio)
• Conventional, waterflood and unconventional oilopportunities
• Gas used at the Elk Hills power plant (electricity)
• San Joaquin and Ventura Conventional (Pleito),Long Beach WF, Huntington Beach WF, BuenaVista
Oil Prices ↓ / Gas Prices ↓
• Invest in steam floods (above 5x Oil/Gas ratio)
• Oil projects down to $24.50/barrel*
• Gas projects down to ~$1.75/Mcf
• Mount Poso/Eastern Shallow Oil Zone at ElkHills; Kern Front Steamfloods, Long Beach WF,Workovers
Oil Prices ↑ / Gas Prices ↑
• Gas price is a cost for steam floods. Invest insteam floods above 5x Oil/Gas ratio
• Many projects commercial in CRC’s high-graded portfolio
• Conventional and unconventional oil and gasopportunities
• All basins work, deep drilling and exploration
Oil Prices ↓ / Gas Prices ↑
• Invest in steam floods (above 5x Oil/Gas ratio)
• Invest in Sacramento gas projects, takeadvantage of dominant position in the basin
• Oil projects down to $24.50/barrel*
• Sacramento Basin, Elk Hills, San JoaquinShales (Elk Hills 29R, Buena Vista Shales)
* Reflect 1.3 VCI projects

GS Energy Conference 011622
What is the New Normal?
Conventional/Pre-Shale
Tight Spare CapacityPolitical PremiumsNew Normal
Source: Bloomberg, WTI (1/1995 – 9/2015)WTI $/Bbl
Fre
qu
en
cy(D
ays
)
WTI Daily Price Frequency

GS Energy Conference 011623
• Capital associated with currently identified projects delivering VCI >1.3*
• Current average well cost ~$1.1 MM
• Multi-year inventory allows maintenance of flat production at different points in the price curve
Flexible High Return Inventory
Pace – Rigs/Year Years of Inventory
3 11.1 24.0 37.1
5 6.7 14.4 22.2
7 4.8 10.3 15.9
10 3.3 7.2 11.1
*Does not include injectors
$0.0
$1.0
$2.0
$3.0
$4.0
$5.0
$6.0
$7.0
55 65 75
Dri
llin
gC
apit
al($
Bn
)
Actionable Inventory at Various Price Levels
Workover
Waterflood
Unconventional
Steamflood
Primary

GS Energy Conference 0116
0
20
40
60
80
100
120
140
1998 2000 2002 2004 2006 2008 2010 2012 2014
Net
MB
oe/
d
• CRC’s flagship asset, a 100+ year-old field withexploration opportunities
• Large fee property with multiple stacked reservoirs
• Light oil from conventional and unconventionalproduction
• Largest gas and NGL producing field in CA, one of thelargest fields in the continental U.S.1, >3,000producing wells
• 7.8 billion barrels OOIP2 and cumulative productionof over 1.6 billion Boe
• YTD 3Q 2015 avg. net production of 60 MBoe/d(37% of total production)
• Less than a third of our operating costs are fixed.3
• 540 MMcf/d processing capacity
• 2 CO2 removal plants
• Over 4,200 miles of gathering lines
• 3 gas plants (including California’s largest)
• 45 MW cogeneration plant
• 550 MW power plant
OverviewOverview
Comprehensive InfrastructureComprehensive Infrastructure
Field MapField Map
Production HistoryProduction History
1 DOGGR data and U.S. Energy Information Administration.
Elk Hills
Buena
Vista
RR Gap
Elk Hills Area - Overview
2 Information based on CRC internal estimates; includes shales which are not considered in most older, publicly available estimates.
24
3 See Appendix for more information.

GS Energy Conference 011625
Progressing Inventory to VCI threshold
VCI >= 1.0 VCI >= 1.3
Plan Year 2016 to 2020 Plan Year 2016 to 2020
Recovery Mechanism
Prod Drill
Count
Inj Drill
Count WO Count Net Capex $MM Recovery Mechanism
Prod Drill
Count
Inj Drill
Count
WO
Count
Net Capex
$MM
Conventional 176 0 38 103 Conventional 0 0 38 11
Unconventional 171 0 129 457 Unconventional 10 0 125 82
Waterflood 65 29 152 154 Waterflood 41 23 146 126
Grand Total 412 29 319 714 Grand Total 51 23 309 219
Recovery Mechanism
Prod Drill
Count
Inj Drill
Count WO Count Net Capex $MM Recovery Mechanism
Prod Drill
Count
Inj Drill
Count
WO
Count
Net Capex
$MM
Conventional 176 0 38 103 Conventional 164 0 38 100
Unconventional 198 0 129 514 Unconventional 25 0 129 116
Waterflood 209 32 155 252 Waterflood 65 29 152 154
Grand Total 583 32 322 869 Grand Total 254 29 319 370
Recovery Mechanism
Prod Drill
Count
Inj Drill
Count WO Count Net Capex $MM Recovery Mechanism
Prod Drill
Count
Inj Drill
Count
WO
Count
Net Capex
$MM
Conventional 443 0 39 386 Conventional 164 0 38 100
Unconventional 223 0 129 573 Unconventional 89 0 129 273
Waterflood 209 40 185 264 Waterflood 66 29 155 157
Grand Total 875 40 353 1,223 Grand Total 319 29 322 530
@ $50 Oil, $3.00 Gas ($3.50 Gas for >= 2017) @ $50 Oil, $3.00 Gas ($3.50 Gas for >= 2017)
@ $60 Oil, $3.00 Gas ($3.50 Gas for >= 2017) @ $60 Oil, $3.00 Gas ($3.50 Gas for >= 2017)
@ $70 Oil, $3.00 Gas ($3.50 Gas for >= 2017) @ $70 Oil, $3.00 Gas ($3.50 Gas for >= 2017)
GREATER ELK HILLS AREA INVENTORY OF POTENTIAL PROJECTS 2016 -2020

GS Energy Conference 0116
-
50
100
150
200
250
2000 2001 2002 2003 2004 2005 2006 2007 2008 2009 2010 2011 2012 2013 2014
MM
Bo
e
Net Proved Reserves Production to Date
OverviewOverview Field MapField Map
Proved Reserves & Cumulative ProductionProved Reserves & Cumulative Production Structure Map & Acquisition HistoryStructure Map & Acquisition History
*
• CRC’s flagship coastal asset: acquired in 2000
• Field discovered in 1932; 3rd largest field in the U.S.
• Over 7 billion barrels OOIP (34% recovered to date)1
• Depths 2,000’ – 10,000’ (TVDSS)
• YTD 3Q 2015 avg. production of 35 MBoe/d (gross)
• Over 8,000 wells drilled to date
• Less than a third of our operating costs are fixed2
• PSC (Working Interest and NRI vary by contract)
• CRC partnering with State and City of Long Beach
*Proved reserves prior to 2009 represent previously effective SEC methodology. Proved reserves for 2009 – 2014 are based on current SEC reserve methodology and SEC pricing.1 Information based on CRC internal estimates; includes shales which are not considered in most older, publicly available estimates.
TidelandsAcquired: 2006
Belmont OffshoreAcquired: 2003
Long Beach UnitAcquired: 2000
Pico PropertiesAcquired: 2008
Wilmington Field - Overview
26
2 See Appendix for more information.

GS Energy Conference 011627
• Example of Wilmington (“maturewaterflood”)
• Growing Proven Reserves
168% Reserves Replacement since 2011
• Increased inventory of well locations
Drilled 500 wells
Additional 774 wells identified in maturefield
• Replaced 155% of wells drilled
Big Fields Continue To Get Bigger….
Replenishing Inventory - # Drilling Locations
Inventory of locations* in 2011 712
Wells drilled 2011-14 -498
Additional inventory 2011-14 774
Remaining locations 988
Large, long-life assets provide multipleopportunities to enhance productionand expand inventories.
0
25
50
75
100
125
150
2011 Entry Production Proven Adds 2014 Exit
Pro
ven
Res
erve
s(M
mb
oe)
Mature WaterfloodWilmington Proved Reserves**
* Locations – include PUDs, PUD-like locations (outside 5 year SEC rule) and other unproven locations.** Proved reserves determined at EOY SEC Reserve prices for each year.

GS Energy Conference 0116
Proven Track Record in Sensitive Environments
• Operator of choice in coastalenvironments
• Proven coexistence with sensitiveenvironments
• 2 billion gallons of reclaimed watersupplied to agriculture in 2014
• Committed to excellence in safety andmechanical integrity
28

GS Energy Conference 0116
• World-class asset base with diverse and rich resources.
• Capacity for significant production growth at higher prices as wedevelop high-return, lower-risk opportunities.
• Committed to capital budgets that live within our cash flows.
• As we bring our capital structure in line with today’s prices, we’reconsidering a wide variety of options to de-leverage.
• Legacy of safe production and commitment to regulatory andcommunity outreach in California.
Well Positioned for Growth in Recovery
29

GS Energy Conference 0116
California Resources CorporationAppendix
30

GS Energy Conference 0116
End Notes:
(1) The reserves replacement ratio is calculated for a specified period using the applicable proved oil-equivalent additions divided by oil-equivalent
production. Company- wide 76% of 2014 additions were proved undeveloped. There is no guarantee that historical sources of reserves additions will
continue as many factors fully or partially outside management’s control, including the underlying geology, commodity prices and availability of capital,
affect reserves additions. Management uses this measure to gauge results of its capital allocation. The measure is limited in that reserves may be added
and produced based on costs incurred in separate periods and other oil and gas producers may use different replacement ratios affecting comparability.
(2) Finding and Development costs for the capital program are calculated by dividing the costs incurred from the capital program (development and
exploration costs) by the amount of proved reserves added in the same year from improved recovery and extensions and discoveries (excluding
acquisitions and revisions). Our management believes that reporting our finding and development costs can aid evaluation of our ability to add proved
reserves at a reasonable cost and is not a substitute for our GAAP disclosures. Various factors, including timing differences and effects of commodity price
changes, can cause finding and development costs to reflect costs associated with particular reserves imprecisely. For example, we will need to make
more investments in order to develop the proved undeveloped reserves added during the year and any future revisions may change the actual measure
from that presented above. Our calculations of finding and development costs may not be comparable to similar measures provided by other companies.
(3) Our total production costs consist of variable costs that tend to vary depending on production levels, and fixed costs that do not vary with changes in
production levels or well counts, especially in the short term. The substantial majority of our near-term fixed costs become variable over the longer term as
they can be managed based on the field’s stage of life and operating characteristics. For example, portions of labor and material costs, energy, workovers
and maintenance expenditures correlate to well count, production and activity levels. Portions of these same costs can be relatively fixed over the near
term, however, they are managed down as fields mature in a manner that correlates to production and commodity price levels. While a certain amount of
costs for facilities, surface support, surveillance and related maintenance can be regarded as fixed in the early phases of a program, as the production
from a certain area matures, well count increases and daily per well production drops, such support costs can be reduced and consolidated over a larger
number of wells, reducing costs per operating well. Further, many of our other costs, such as property taxes and oilfield services, are variable and will
respond to activity levels and tend to correlate with commodity prices. Overall, we believe less than one-third of our operating costs are fixed over the life
cycle of our fields. We actively manage our fields to optimize production and costs. If we see growth in a field we increase capacities, and similarly if a field
were reaching the end of its economic life we would manage the costs while it remains economically viable to produce.
31
GS Energy Conference 0116
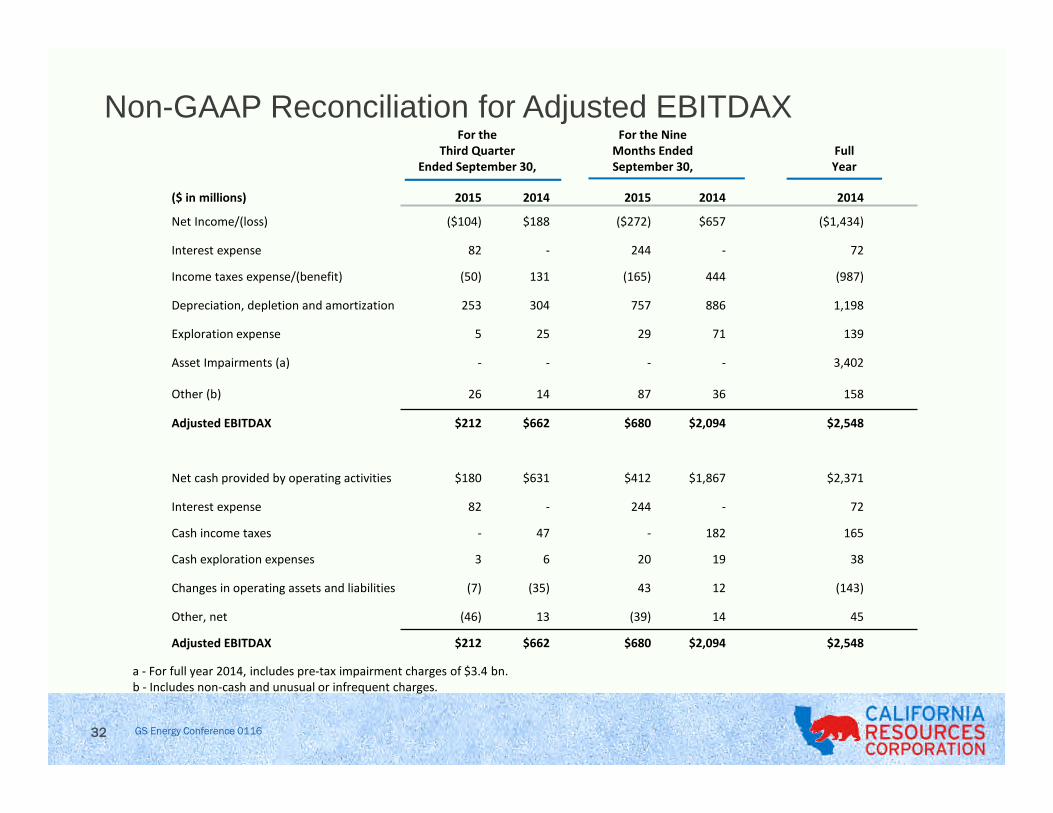
Non-GAAP Reconciliation for Adjusted EBITDAXFor the
Third QuarterEnded September 30,
For the NineMonths EndedSeptember 30,
FullYear
($ in millions) 2015 2014 2015 2014 2014
Net Income/(loss) ($104) $188 ($272) $657 ($1,434)
Interest expense 82 - 244 - 72
Income taxes expense/(benefit) (50) 131 (165) 444 (987)
Depreciation, depletion and amortization 253 304 757 886 1,198
Exploration expense 5 25 29 71 139
Asset Impairments (a) - - - - 3,402
Other (b) 26 14 87 36 158
Adjusted EBITDAX $212 $662 $680 $2,094 $2,548
Net cash provided by operating activities $180 $631 $412 $1,867 $2,371
Interest expense 82 - 244 - 72
Cash income taxes - 47 - 182 165
Cash exploration expenses 3 6 20 19 38
Changes in operating assets and liabilities (7) (35) 43 12 (143)
Other, net (46) 13 (39) 14 45
Adjusted EBITDAX $212 $662 $680 $2,094 $2,548
a - For full year 2014, includes pre-tax impairment charges of $3.4 bn.b - Includes non-cash and unusual or infrequent charges.
32
GS Energy Conference 0116
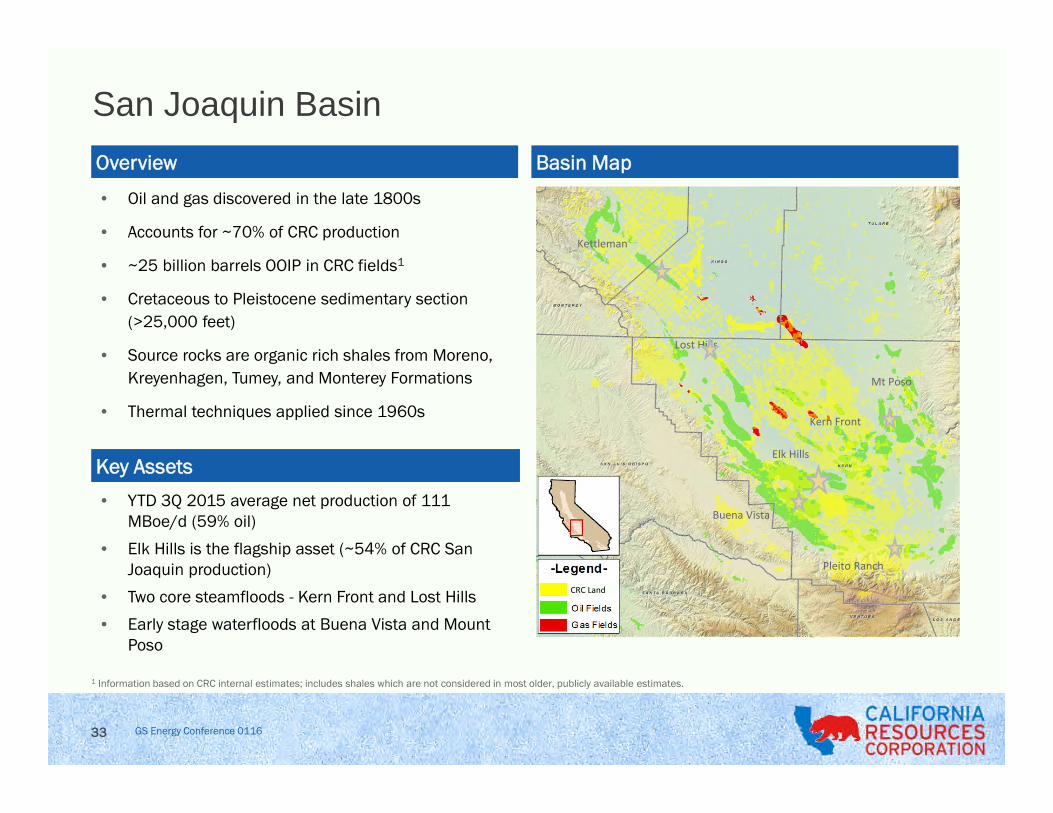
San Joaquin Basin
• Oil and gas discovered in the late 1800s
• Accounts for ~70% of CRC production
• ~25 billion barrels OOIP in CRC fields1
• Cretaceous to Pleistocene sedimentary section
(>25,000 feet)
• Source rocks are organic rich shales from Moreno,
Kreyenhagen, Tumey, and Monterey Formations
• Thermal techniques applied since 1960s
• YTD 3Q 2015 average net production of 111MBoe/d (59% oil)
• Elk Hills is the flagship asset (~54% of CRC SanJoaquin production)
• Two core steamfloods - Kern Front and Lost Hills
• Early stage waterfloods at Buena Vista and MountPoso
OverviewOverview
Key AssetsKey Assets
Basin MapBasin Map
Buena Vista
Pleito Ranch
Elk Hills
Kettleman
Lost Hills
Mt Poso
CRC Land
Kern Front
1 Information based on CRC internal estimates; includes shales which are not considered in most older, publicly available estimates.
33
GS Energy Conference 0116
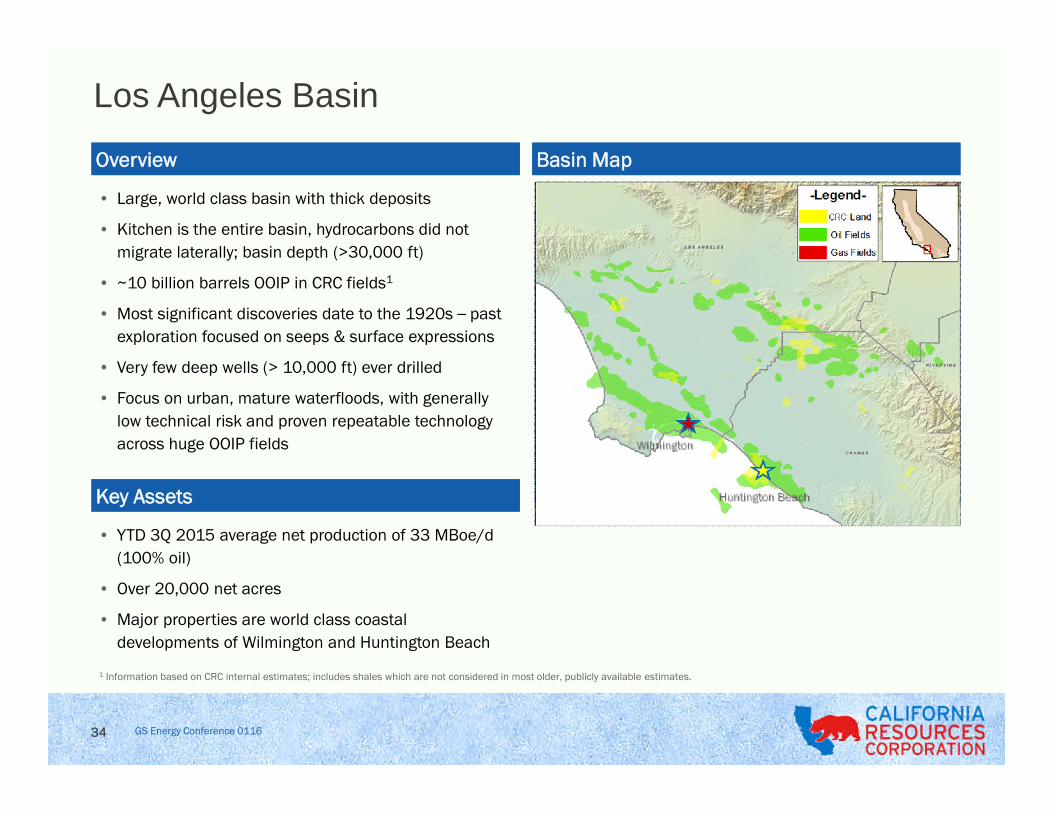
Los Angeles Basin
• Large, world class basin with thick deposits
• Kitchen is the entire basin, hydrocarbons did not
migrate laterally; basin depth (>30,000 ft)
• ~10 billion barrels OOIP in CRC fields1
• Most significant discoveries date to the 1920s – past
exploration focused on seeps & surface expressions
• Very few deep wells (> 10,000 ft) ever drilled
• Focus on urban, mature waterfloods, with generally
low technical risk and proven repeatable technology
across huge OOIP fields
• YTD 3Q 2015 average net production of 33 MBoe/d
(100% oil)
• Over 20,000 net acres
• Major properties are world class coastal
developments of Wilmington and Huntington Beach
OverviewOverview
Key AssetsKey Assets
Basin MapBasin Map
34
1 Information based on CRC internal estimates; includes shales which are not considered in most older, publicly available estimates.

GS Energy Conference 0116
Sacramento Basin
• Exploration started in 1918 and focused on seepsand topographic highs. In the 1970s the use ofmultifold 2D seismic led to largest discoveries
• Cretaceous Starkey, Winters, Forbes, Kione, andthe Eocene Domengine sands
• Most current production is less than 10,000 feet
• 3D seismic surveys in mid 1990s helped definetrapping mechanisms and reservoir geometries
• CRC has 53 active fields (consolidated into 35operating areas where we have facilities)
• YTD 3Q 2015 average net production of 7MBoe/d (100% dry gas)
• Produce 85% of basin gas with synergies of scale
• Price and volume opportunity
OverviewOverview
Key AssetsKey Assets
Basin MapBasin Map
35

GS Energy Conference 0116
Ventura Basin
• Estimated ~3.5 billion barrels OOIP in CRCfields1
• Operate 29 fields (about 40% of basin)
• ~300,000 net acres
• Multiple source rocks: Miocene (Monterey andRincon Formations), Eocene (Anita and CozyDell Formations)
• YTD 3Q 2015 average net production of 10 MBoe/d(70% oil)
• In 2013, shot 10 mi2 of 3D Seismic
> First 3D seismic acquired by any company inthe basin
OverviewOverview
Key AssetsKey Assets
Basin MapBasin Map
• CRC has four early stage waterfloods
• Ventura Avenue Field analog has >30% RF
• CRC fields have 3.5 Bn Boe in place at 14% RF
Waterflood Potential2Waterflood Potential2
1 Information based on CRC internal estimates; includes shales which are not considered in most older, publicly available estimates2 Source: USGS
36

GS Energy Conference 011637
Capital Allocation Approach
• Portfolio Management since spin-off
• Three principal drivers:o Maximize long-term value – VCI > 1.3o Oil production growth
o Financial discipline – self-funding business
• Results in combination of projects that provide quick payback (workovers),longer term value / future growth (steamfloods/waterfloods) and high IP’s(conventional/tight sands/unconventional).
PV10 pre-tax cash flowsPV10 of investments
VCI =
Value Creation Index
Measures value created per dollar investment (“Bang for the buck”)

GS Energy Conference 0116
Shale Geological Overview
Major U.S. Shale PlaysCalifornia Unconventional Potential
• Successful in upper Monterey using precise development approach
• Expanding efforts into lower Monterey and other shales
PlayDepth
(ft)Thickness(gross ft)
Porosity(%)
Permeability(mD)
TotalOrganicCarbon
(%)
Upper Monterey1 3,500' – 12,000' 250' – 3,500' 5 – 30 <0.0001 – 2 1 – 12
Lower Monterey1 9,000' – 16,000' 200' – 500' 5 – 12 <0.001 – 0.05 2 – 18
Kreyenhagen1 8,000' – 16,000' 200' – 350' 5 – 15 <0.001 – 0.1 1 – 6
Moreno1 8,000' – 16,000' 200' – 300' 5 – 10 <0.001 – 0.1 2 – 6
Bakken 3,000' – 11,000' 6' – 145' 2 – 12 0.05 8 – 21
Barnett 5,400' – 9,500' 100' – 500' 4.0 – 9.6 <0.0001 – 0.1 4 – 8
Eagle Ford 5,000' – 12,000' 100' – 250' 3.4 – 14.6 0.13 2 – 9
CRC Current Production CRC Areas of Future Development
1Reservoir characteristics were internally generated based on regional 2D seismic data, 3D seismic data, open hole and mud log data, cores and other reservoir engineering data.
38

GS Energy Conference 011639
A Net Water Supplier
• Provide more reclaimed produced water to agriculture than theamount of fresh water we purchase for operations statewide
• In 2014, we used approximately 79% of produced water inimproved or enhanced recovery operations
• 3-year goal: Increase net water supply to agriculture by > 10%above the 2014 level of 204 million gallons
94%
4% 2%WATER MANAGEDIN CRC’s 2014OPERATIONS
Produced Water
Fresh Water
Non-Fresh Water
In 2014, CRC’s steamflood operationssupplied more than 2 billion gallons – over6,200 acre-feet – of water for irrigation
This preserves fresh water for otherbeneficial uses, equivalent to the needs ofapproximately 13,700 families per year
CRC’s operations inLong Beach userecycled water forapproximately 99percent of their totalwater use

GS Energy Conference 0116
Non-GAAP Reconciliation for PV-10
($ in millions)At December 31,
2014
PV-10 $16,091
Present value of future income taxes discounted at 10% (5,263)
Standardized Measure of Discounted Future Net CashFlows
$10,828
PV-10 is a non-GAAP financial measure and represents the year-end present value of estimated future cash inflows from proved oil andnatural gas reserves, less future development and production costs, discounted at 10% per annum to reflect the timing of future cashflows and using SEC prescribed pricing assumptions for the period. PV-10 differs from Standardized Measure because StandardizedMeasure includes the effects of future income taxes on future net cash flows. Neither PV-10 nor Standardized Measure should be construedas the fair value of our oil and natural gas reserves. PV-10 and Standardized Measure are used by the industry and by our management as anasset value measure to compare against our past reserve bases and the reserve bases of other business entities because the pricing, costenvironment and discount assumptions are prescribed by the SEC and are comparable. PV-10 further facilitates the comparisons to othercompanies as it is not dependent on the tax paying status of the entity.
40