Embed Size (px)
Citation preview

ReseaRch aRticleReseaRch aRticle Authors
ISSN 1743-588910.2217/NNM.11.135 © 2012 Future Medicine Ltd Nanomedicine (2012) 7(5), 639–650
part of
ReseaRch aRticle
639
Aim: To study the feasibility of a novel nanomedical method that utilizes breath testing for identifying chronic kidney disease (CKD) and disease progression. Materials & Methods: Exhaled breath samples were collected from 62 volunteers. The breath samples were analyzed using sensors based on organically functionalized gold nanoparticles, combined with support vector machine ana lysis. Sensitivity and specificity with reference to CKD patient classification according to estimated glomerular filtration rate were determined using cross-validation. The chemical composition of the breath samples was studied using gas chromatography linked with mass spectrometry. Results: A combination of two to three gold nanoparticles sensors provided good distinction between early-stage CKD and healthy states (accuracy of 79%) and between stage 4 and 5 CKD states (accuracy of 85%). A single sensor provided a distinction between early and advanced CKD (accuracy of 76%). Several substances in the breath were identified and could be associated with CKD-related biochemical processes or with the accumulation of toxins through kidney function loss. Conclusion: Breath testing using gold nanoparticle sensors holds future potential as a cost-effective, fast and reliable diagnostic test for early detection of CKD and monitoring of disease progression.
Original submitted 4 April 2011; Revised submitted 19 July 2011; Online publication date 8 March 2012
KEYWORDS: breath n chronic kidney disease n gold nanoparticle n sensor n staging n volatile organic compound
A novel method for identifying chronic kidney disease (CKD) and disease progression was explored that utilizes breath testing. CKD depicts progressive loss of kidney function over a period of months or years [1–4]. The accurate determination of the kidney function is essential for the treatment of CKD, for identifying patients with early renal impairment and for following the course of established disease. Recent professional guidelines classify the severity of CKD in five stages according to the reduction in glomerular filtration rate (GFR), with stage 1 being a mild illness that is characterized by few symptoms and stage 5 being a severe illness that is characterized by a poor life expectancy if untreated [5–7]. Untreated CKD progresses inevitably to stage 5, which is synonymous with end-stage renal disease (ESRD). Irreversible loss of endogenous kidney function renders a patient dependent upon kidney replacement therapy by dialysis or transplantation [5,8].
‘Uremic’ toxins, which are normally excreted by the kidney, are retained as GFR diminishes [9,10]. Over 5000 potential toxins have been identified [11]. Retained urea and creatinine serve as markers of kidney failure. However, serum creatinine varies widely with age, gender, diet, muscle
mass, muscle metabolism, medications, diet and hydration status [12]. Moreover, up to 60% of the kidney function may be lost before serum creatinine begins to rise. These limitations, and the asymptomatic onset of the disease, contribute currently to delayed diagnosis and therapy of CKD.
A novel approach that overcomes many constraints of the conventional diagnostic techniques relies on the detection of volatile organic compounds (VOCs) [13–22]. This method has been explored in different fields of medicine such as respiratory medicine, urology and oncology (see reviews [23–26] and cited references). Some of the VOCs among the plasma CKD biomarkers, or their metabolic products, are transmitted to the alveolar exhaled breath through exchange via the lung, even at the very onset of the disease, causing in later stages the fishy smell characterizing the breath of these patients [17,18,20,22]. Rapid progress has been made in recent years in the field of nanotechnology and towards the standardization of breath sampling [27]. This could lead to the development of efficient and cost-effective methods for diagnostic breath testing that could eventually be introduced into standard medical practice,
Ophir Marom‡1, Farid Nakhoul‡1,2, Ulrike Tisch1, Ala Shiban1, Zaid Abassi1,3 & Hossam Haick*1
1Technion – Israel Institute of Technology, Haifa 32000, Israel 2Department of Nephrology, Rambam Health Care Campus, Haifa 31096, Israel 3Research Unit, Rambam Health Care Campus, Haifa 31096, Israel *Author for correspondence: Tel.: +972 4 829 3087 Fax: +972 4 829 5672 [email protected] ‡Authors contributed equally
Gold nanoparticle sensors for detecting chronic kidney disease and disease progression
For reprint orders, please contact: [email protected]
ReseaRch aRticle Marom, Nakhoul, Tisch, Shiban, Abassi & Haick
Nanomedicine (2012) 7(5)640 future science group
side by side with diagnostic imaging tests and conventional biomarker monitoring in blood and urine. Thus, early detection of CKD, as well as monitoring and prediction of CKD progression, could be improved even in nonspecialist settings.
Haick and coworkers have recently demon-strated the ability of an array of carbon-nanotube-based sensors to differentiate between healthy states and induced ESRD in rats via breath samples, using a model of bilateral nephrectomy, and have achieved a success rate over 95% [28]. The present study aims at the identification of early-stage CKD, before it becomes life threatening, and the monitoring of disease progression in human subjects, using sensors that are based on organically functionalized gold nanoparticles (GNPs).
Patients & methods n Study design, test population
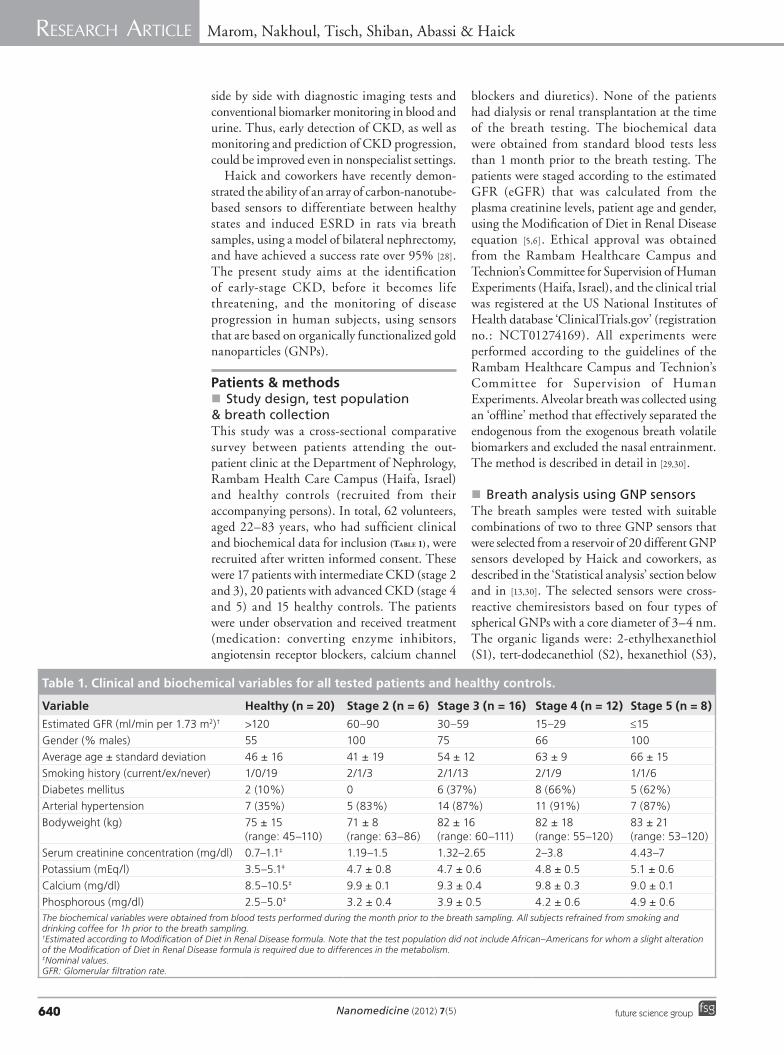
& breath collectionThis study was a cross-sectional comparative survey between patients attending the out-patient clinic at the Department of Nephrology, Rambam Health Care Campus (Haifa, Israel) and healthy controls (recruited from their accompanying persons). In total, 62 volunteers, aged 22–83 years, who had sufficient clinical and biochemical data for inclusion (Table 1), were recruited after written informed consent. These were 17 patients with intermediate CKD (stage 2 and 3), 20 patients with advanced CKD (stage 4 and 5) and 15 healthy controls. The patients were under observation and received treatment (medication: converting enzyme inhibitors, angiotensin receptor blockers, calcium channel
blockers and diuretics). None of the patients had dialysis or renal transplantation at the time of the breath testing. The biochemical data were obtained from standard blood tests less than 1 month prior to the breath testing. The patients were staged according to the estimated GFR (eGFR) that was calculated from the plasma creatinine levels, patient age and gender, using the Modification of Diet in Renal Disease equation [5,6]. Ethical approval was obtained from the Rambam Healthcare Campus and Technion’s Committee for Supervision of Human Experiments (Haifa, Israel), and the clinical trial was registered at the US National Institutes of Health database ‘ClinicalTrials.gov’ (registration no.: NCT01274169). All experiments were performed according to the guidelines of the Rambam Healthcare Campus and Technion’s Committee for Supervision of Human Experiments. Alveolar breath was collected using an ‘offline’ method that effectively separated the endogenous from the exogenous breath volatile biomarkers and excluded the nasal entrainment. The method is described in detail in [29,30].
n Breath analysis using GNP sensorsThe breath samples were tested with suitable combinations of two to three GNP sensors that were selected from a reservoir of 20 different GNP sensors developed by Haick and coworkers, as described in the ‘Statistical analysis’ section below and in [13,30]. The selected sensors were cross-reactive chemiresistors based on four types of spherical GNPs with a core diameter of 3–4 nm. The organic ligands were: 2-ethylhexanethiol (S1), tert-dodecanethiol (S2), hexanethiol (S3),
Table 1. Clinical and biochemical variables for all tested patients and healthy controls.
Variable Healthy (n = 20) Stage 2 (n = 6) Stage 3 (n = 16) Stage 4 (n = 12) Stage 5 (n = 8)
Estimated GFR (ml/min per 1.73 m2)† >120 60–90 30–59 15–29 ≤15Gender (% males) 55 100 75 66 100Average age ± standard deviation 46 ± 16 41 ± 19 54 ± 12 63 ± 9 66 ± 15Smoking history (current/ex/never) 1/0/19 2/1/3 2/1/13 2/1/9 1/1/6Diabetes mellitus 2 (10%) 0 6 (37%) 8 (66%) 5 (62%)Arterial hypertension 7 (35%) 5 (83%) 14 (87%) 11 (91%) 7 (87%)Bodyweight (kg) 75 ± 15
(range: 45–110)71 ± 8(range: 63–86)
82 ± 16(range: 60–111)
82 ± 18(range: 55–120)
83 ± 21(range: 53–120)
Serum creatinine concentration (mg/dl) 0.7–1.1‡ 1.19–1.5 1.32–2.65 2–3.8 4.43–7Potassium (mEq/l) 3.5–5.1‡ 4.7 ± 0.8 4.7 ± 0.6 4.8 ± 0.5 5.1 ± 0.6Calcium (mg/dl) 8.5–10.5‡ 9.9 ± 0.1 9.3 ± 0.4 9.8 ± 0.3 9.0 ± 0.1Phosphorous (mg/dl) 2.5–5.0‡ 3.2 ± 0.4 3.9 ± 0.5 4.2 ± 0.6 4.9 ± 0.6The biochemical variables were obtained from blood tests performed during the month prior to the breath sampling. All subjects refrained from smoking and drinking coffee for 1h prior to the breath sampling. †Estimated according to Modification of Diet in Renal Disease formula. Note that the test population did not include African–Americans for whom a slight alteration of the Modification of Diet in Renal Disease formula is required due to differences in the metabolism. ‡Nominal values.GFR: Glomerular filtration rate.

Gold nanoparticles for detecting chronic kidney disease ReseaRch aRticle
www.futuremedicine.comfuture science group 641
and dibutyl disulfide (S4). The GNPs were synthesized as described in detail in [13,26,30–34].
GNP chemiresistive layers were formed by dispersing the GNPs in chloroform and drop-casting the solution onto microelectronic transducers. While still coated with solution, the substrate was blown with dry nitrogen. This process was repeated several times to yield a resistance of approximately 1 MW. The device was dried for 2 h at ambient temperature and then baked at 50°C in a vacuum oven overnight. The microelectronic transducers consisted of ten pairs of circular interdigitated gold electrodes that were deposited by an electron-beam evaporator TFDS-870 (Vacuum Systems & Technologies, Petah-Tikva, Israel) on a piece of device quality silicon wafer capped with 300 nm thermal oxide (Silicon Quest International, USA). The outer diameter of the circular electrode area was 3 mm; the gap between two adjacent electrodes and the width of each electrode were both 20 µm.
In total, 20 different GNP sensors were mounted on a custom polytetrafluoroethylene circuit board inside a stainless steel test chamber with a volume of 100 cm3. The sampling system delivered pulses of breath to the sensors. The chamber was evacuated between exposures. An Agilent Multifunction switch 34980 was used to measure the resistance as a function of time. Typically, the sensors’ responses were recorded for 5 min in vacuum, followed by 5 min under breath exposure, followed by another 5 min in vacuum. The cycles were repeated two- to three-times to test reproducibility.
n Breath analysis with gas chromatography combined with mass spectrometryThe constituent VOCs of the collected breath were identified from a representative sub-set of the collected breath samples (five patients with stage 5 CKD; ten patients with stage 4; 15 patients with stage 3; five patients with stage 2; and seven healthy controls), using gas chromatography combined with mass spectrometry (GC-MS; QP 2010 plus; Shimadzu). The GC-MS ana lysis was preceded by solid phase microextraction (SPME) for preconcentrating the VOCs in the breath samples. A manual SPME holder with an extraction fiber was inserted into the collection bag for 30 min before being delivered to the GC-MS. Fibers with divinylbenzene/carboxen/polydimethylsiloxane coating were obtained from Sigma-Aldrich. The extracted fiber in the manual SPME holder was inserted into the injector of the GC (direct mode) for thermal desorption at 270°C. The
GC oven profile is given as supporting online information (SupplemenTary Table S1 see online: www.futuremedicine.com/doi/suppl/10.2217/nnm.12.44). A capillary column was used (RTX-624 from Restek; 6% cyanopropylphenyl; 30 m length; 0.25 mm internal diameter; 1.4 µm thickness). Helium was used as the carrier gas and was set to a constant flow rate of 40 cm/s. Data preprocessing was done using the open source XCMS package version 1.22.1 for R environment [101]. The molecular structures of the VOCs were determined by a spectral library match.
n Statistical analysisCKD-specific breath patterns were obtained from the collective response of the GNP sensors by applying support vector machine (SVM) ana-lysis as statistical pattern recognition algorithm [35,36]. SVM ana lysis is a supervized learning method that finds the best separating line between two data sets through computerized ana lysis of the sensing signal and automatic choice of the most suitable set of sensing features. It can be used for data classification and pattern recognition; applied to multidimensional data; used as a heuristic to select the most suitable sensing features; and it does not require normal distribution of the data points around the average value [35]. SVM is very suitable for treating smaller data sets. The subpopulations were compared by building a multiclass classifier based on a linear n-SVC classifier [36]. Standard principal component ana lysis [37] was applied to the multidimensional SVM results to allow the graphical representation in three dimensional principal component space.
Cross-validation was utilized to evaluate the specificity and sensitivity by randomly dividing each subpopulation into two sets, which were then used as training and test sets. Cross-validation has a training stage and a test stage – each time creating a new test set that is blinded against the model. The model is built based on the remaining samples, that is, the training set. The statistics are thus less biased towards any group that is initially selected as the test set. Cross-validation tries to remove that bias by generating all possible test sets, giving a stronger statistical result and making it superior in the case of relatively limited sample size to the choice of fixed training and test sets. All possible combinations of division into test and training sets were tested and the results were averaged. Note that the results were stable against changing the number of folds in the cross-validation.

ReseaRch aRticle Marom, Nakhoul, Tisch, Shiban, Abassi & Haick
Nanomedicine (2012) 7(5)642 future science group
Results n The choice of the GNP sensors for
the identification of early-stage CKD The feasibility of the GNP sensors for diagnosing the early-stages of CKD was tested by comparing breath samples of 17 patients with stage 2 and 3 CKD to breath samples of 15 healthy controls (Table 1).
Before the exposure to the breath samples, we examined the response of the GNP sensors to several representative VOCs found in exhaled breath, as reported in [30]. Each sensor underwent a rapid and fully reversible change in electrical resistance when exposed to the characteristic VOCs at concentrations ranging from tens of parts per billion to hundreds of parts per million, showing typical detection limits of 1–5 parts per billion [30]. The responses were unique because of the chemical diversity of the GNP ligands. The device-to-device variations between sensors based on the same type of GNP were within ± 15%, whereas the responses of different types of GNPs to the same VOC were typically several-fold different [30]. So far, we have shown that part of the GNP sensors have a very low response to water [30]. This is an important feature because otherwise a sensor’s response to the high background humidity in exhaled breath could easily mask the signal to the much lower concentrations of the breath VOCs that indicate disease [26]. Exhaled breath is composed mainly of nitrogen, oxygen, carbon dioxide, water vapor and inert gases. The VOCs that are generated by the cellular biochemical processes of the body are present in much lower amounts in exhaled breath [26], and many diseases, among them CKD, manifest themselves through very subtle changes in concentration of a multitude of these breath VOCs [13,30,38].
The exposure of the GNP sensors to the breath samples resulted in rapid and fully reversible responses. Several sensing features were read out from the time-dependent response of each sensor that related to the resistance response upon exposure (F1); the area under the response curve (F2); the sensor’s response time (F3) and the relaxation time after the end of the exposure (F4). Each sensor responded to all (or to a certain subset) of the VOCs found in the exhaled breath samples. CKD-specific breath patterns were obtained from the collective response of the GNP sensors by applying SVM ana lysis. SVM was also used as a heuristic to select the most relevant GNP sensors out of the repertoire of 20, by filtering out noncontributing sensors and/or sensing features. The reason for selecting a certain set of sensing features for a particular problem is
directly derived from their ability to discriminate between the various classification groups.
In this way, one sensing feature of sensor S1 (F1) and three independent features of sensor S2 (F1, F2 and F4) were selected through SVM for the distinction between stage 2 and 3 CKD patients and healthy controls. The sensors S1 and S2 were selected because they were the most capable sensors among the reservoir of 20 GNP sensors for discriminating between the two groups (see ‘Breath analysis using GNP sensors’ section). The number of input parameters was kept low enough to avoid over-fitting during the SVM ana lysis because using a large set of sensors and features would increase the probability for over-fitting the data.
The stage 2 and 3 CKD patients could clearly be distinguished from the healthy controls. Figure 1a visualizes the SVM results in 3D principal component space. For this purpose, principal component analysis was applied to the SVM results to reduce their dimensionality from 4D to 3D (note that principal component analysis was not applied to analyze the original data). The 3D in principal component space contains 97.5% of the variance of the data. A high classification success rate of the SVM ana lysis was obtained through cross-validation . The results in terms of correct and false classifications are represented in the table below the graph in Figure 1a.
n Monitoring CKD disease progression using the GNP sensorsSVM ana lysis determined a suitable set of five sensing features from sensors S1, S3 and S4 (see ‘Breath analysis using GNP sensors’ section) for the distinction of stage 4 and 5 CKD patients. These were three independent features of sensor S1 (F2–F4), one feature of S3 (F2) and one feature of S4 (F1). Very good separation between stage 4 and 5 CKD states was achieved with these sensing features. Figure 1b represents the SVM results in 3D principal component space, containing 99.9% of the variance of the data. The SVM classification was highly successful, as shown in terms of the correct and false classifications in the inset table of Figure 1b.
The progression from early-stage (stage 2 and 3) to late-stage (stage 4 and 5) CKD was determined using a single sensing feature of sensor S1, without the need for statistical ana lysis. Figure 2a shows the resistance response of sensor S1 (see ‘Breath analysis using GNP sensors’ section) to the exhaled breath of all tested CKD patients versus their measured plasma creatinine concentration. A negative, inverse dependence

Gold nanoparticles for detecting chronic kidney disease ReseaRch aRticle
A BP
C 3
PC 1 PC 2 PC 1 PC 2-1
0
12
3
2
0
-2-1
0
1
PC
3
6
0
1
2
10
-1-2
-3-4
-30
3
Stage 2 and 3Healthy
Classified asstage 2 and 3
Classified ashealthy
174
516
Stage 5Stage 4
Classified asstage 5
Classified asstage 4
61
211
Stages 2 and 3 Healthy controls Stage 5Stage 4
Figure 1. Identification of early-stage chronic kidney disease and disease progression using gold nanoparticle sensors. (A) Distinction between early-stage chronic kidney disease (CKD) and healthy controls based on four sensing features from two sensors (S1 and S2), through support vector machine ana lysis. The 3D visualization in principal component space contains 97.52% of the variance of the data. (B) Distinction between advanced CKD (stage 4) and end-stage renal disease (stage 5 CKD), based on five sensing features from three sensors (S1, S3 and S4). The 3D visualization in principal component space contains 99.98% of the variance of the data. The tables below the graphs show the classification success for the two cases estimated through cross-validation. PC: Principal component.
www.futuremedicine.comfuture science group 643
on creatinine concentration was observed. The inverse creatinine dependence of the eGFR values, which were calculated from the measured serum creatinine concentration, the patients’ age and gender using the Modification of Diet in Renal Disease equation, is represented in the same graph. Figure 2b shows the sensing signal of S1 versus eGFR. The transition from early-stage to late-stage CKD is marked by eGFR = 30 ml/min per 1.73 m2 (Table 1). This value corresponds to a sensing signal cut-off value of 1.33 kW for sensor S1. We determined from these two cut-off values the number of true positive, true negative, false positive and false negative patient classifications, as illustrated in Figure 2b and displayed in the inset table.
n Chemical analysis of the breath of CKD patientsThe chemical composition of the exhaled breath of CKD patients was analyzed and compared with the breath of healthy controls, using GC-MS/SPME (see ‘Breath analysis
with gas chromatography combined with mass spectrometry’ section). The VOCs that were present in >75% of the breath samples of CKD patients and healthy controls were identified and their mean abundance with experimental error (standard error of mean) was calculated. Substances identif ied in the unf iltered hospital air as typical hospital contaminants (2-methyl-2-propanol, ethanol and methyl-isobutyl-ketone [24,39]) were disregarded. The distinction between the patient subpopulations was studied via Wilcoxon/Kruskal–Wallis tests. Table 2 lists the corresponding p-values. Figure 3 shows the trends in average abundance that could be observed for nine breath VOCs showing statistically significant changes with disease progression. Note that the identification of the VOCs through spectral library match is tentative, because confirmation of identity through GC-MS ana lysis of reference substances is still in progress. However, the comparison between patients was based on compound masses and retention times.

ReseaRch aRticle Marom, Nakhoul, Tisch, Shiban, Abassi & Haick
Sensing cut-off value
A
B
eGF
R m
l/min
per
1.7
3m2
80
60
40
20
01 2 3 4 5 6 7 8
Serum creatinine concentration (mg/dl)
-0.9
-1.0
-1.1
-1.2
-1.3
-1.4
-1.5
0
eGFR (ml/min per 1.73m2)10 20 30 40 50 60 70 80
1.6
1.4
1.2
-1.0
00
90
eGFR Sensor S1: Stage 2 and 3 Stage 5Stage 4
Sensing cut-off value
-1.6
TP
FN
FP
TN
Stage 4 and 5Stage 2 and 3
Classified as stage 4 and 5
Classified as stage 2 and 3
517
155
Cut-off between stage 3 and 4
Figure 2. Distinction between early and advanced chronic kidney disease using a single gold nanoparticle sensor. (A) RS1 to exhaled patient breath (circles) versus the patients’ serum creatinine concentration. The eGFR values are shown for comparison (squares). The dotted line marks the transition between early-stage chronic kidney disease (CKD; stages 2 and 3) and late-stage CKD (stages 4 and 5) at eGFR = 30 ml/min per 1.73 m2, corresponding to the sensing cut-off value 1.33 kW. (B) Sensing signal of S1 versus eGFR. The transition from early-stage to late-stage CKD and the sensing cut-off are marked by dotted lines. The inset table gives values the number of TP, TN, FP and FN patient classifications. eGFR: Estimated glomerular filtration rate; FN: False negative; FP: False positive; RS1: Resistance of sensor S1; TN: True negative; TP: True positive.
Nanomedicine (2012) 7(5)644 future science group
Three distinct trends were observed (Table 2). The first group comprised isoprene and acetone, which are always present in exhaled breath in large quantities [23,24]. Both substances decreased during stage 2 and remained relatively constant thereafter. Ethylene glycol and acetoin made up the second group of VOCs. They remained relatively constant up to stage 3, showed a significant increase in stage 4 and a further,
subsignificant increase towards stage 5. The third group of compounds can be divided into two subgroups. Group 3a comprised the known industrial toxins styrene and toluene. Both compounds showed a significant increase during early-stage disease (stage 2), reached a plateau during stage 3 and remained relatively constant thereafter. Group 3b contained two methylated hydrocarbons and a ketone, which showed a signif icant, brief increase

Gold nanoparticles for detecting chronic kidney disease ReseaRch aRticle
www.futuremedicine.comfuture science group 645
during stage 2 CKD, before their abundance decreased again to the levels observed in healthy controls. The fourth group comprised six compounds that were present in >75% of the CKD and healthy breath samples, but showed no significant trends that could be related to the disease progression (Table 2).
Discussion n Identification of CKD & disease
progression using the GNP sensorsWe have studied the feasibility of utilizing combinations of GNP sensors and separate sensors to distinguish between:
� Early-stage CKD and healthy states
� Stage 4 and 5 CKD states
� Early-stage (stages 2 and 3) and late-stage (stages 4 and 5) CKD
Excellent distinction was achieved for the first two cases by means of SVM ana lysis of two separate sets of sensing features. A single sensing feature was sufficient for the distinc-tion between early and late stages in the third case. In principle, it would be possible to use only one sensing feature in all three cases, but scattered experimental data reduce the detection ability and reliability of the results. Only in the third case was sensor S1 so domi-nant in its capacity to discriminate the given classes that other sensors were not required. Furthermore, the optimal set of sensing fea-tures for the identification of early-stage CKD differed from the best feature set for the dis-tinction of advanced and end-stage CKD. This can be understood if one considers the observed changes in the chemical composition of the breath during CKD disease progression.
Table 2. Changes in chemical composition of the breath during chronic kidney progression.
Compound name Significance of the distinction between chronic kidney disease subpopulations (p-value)
Possible origin
Healthy vs stage 2 Stage 2 vs 3 Stage 3 vs 4 Stage 4 vs 5
Group 1
Isoprene Gradual decrease until stage 3 (healthy vs stage 3: p = 0.006)
Gradual decrease until stage 3 (healthy vs stage 3: p = 0.006)
NS NS Cholesterol cycle
Acetone Gradual decrease until stage 3 (healthy vs stage 3: p = 0.018)
Gradual decrease until stage 3 (healthy vs stage 3: p = 0.018)
0.025 (+) NS Acetone
Group 2
Ethylene glycol NS NS 0.018 (+) NS Sugar cycle metabolite or environmental toxin
Acetoin NS NS 0.005 (+) NS Sugar cycle metabolite or environmental (food additive or sweetener)
Group 3a
Styrene 0.042 (+) NS NS NS Environmental toxinsToluene 0.028 (+) NS NS NS
Group 3b
2,2,6-Trimethyl-octane 0.007 (+) 0.049 (-) NS NS Potential CKD biomakers
2-Butatone 0.028 (+) 0.013 (-) NS NS2,4-Dimethyl-heptane Subsignificant increase 0.033 (-) NS NS
Group 4
2-Ethylpentane NS NS NS NS No significanceNonanal NS NS NS NSO-Cymene NS NS NS NS2-Methylhexane NS NS NS NS2,2,3-Trimethyl-hexane NS NS NS NSM-ethyl-methyl-benzene NS NS NS NSTrends of the volatile organic compounds occurring in the breath samples of >75% of the test population. Increase or decrease in abundance are indicated by (+) and (-), respectively. The distinction between the patient subpopulations was studied via Wilcoxon/Kruskal–Wallis tests. CKD: Chronic kidney disease; NS: Nonsignificant changes.

ReseaRch aRticle Marom, Nakhoul, Tisch, Shiban, Abassi & Haick
Hea
lthy
Sta
ge 2
Sta
ge 3
Sta
ge 4
Sta
ge 5
Hea
lthy
Sta
ge 2
Sta
ge 3
Sta
ge 4
Sta
ge 5
Hea
lthy
Sta
ge 2
Sta
ge 3
Sta
ge 4
Sta
ge 5
Hea
lthy
Sta
ge 2
Sta
ge 3
Sta
ge 4
Sta
ge 5
Health
y
Sta
ge 2
Sta
ge 3
Sta
ge 4
Sta
ge 5
Health
y
Sta
ge 2
Sta
ge 3
Sta
ge 4
Sta
ge 5
Group 2: acetoin
Abu
nd
ance
(a.
u.)
Group 1: isoprene
Abu
nd
ance
(a.
u.)
Group 2: ethylene glycol
Abu
nd
ance
(a.
u.)
Group 3a: styrene
Abu
nd
ance
(a.
u.)
Abu
nd
ance
(a.
u.)
Group 3a: toluene
Abu
nd
ance
(a.
u.)
Abu
nd
ance
(a.
u.)
Abu
nd
ance
(a.
u.)
Abu
nd
ance
(a.
u.)
Group 3b: 2,2,6-trimethyl octane
Group 1: acetone
Group 3b: 2-butanone Group 3b: 2,4-dimethyl-heptane
Hea
lthy
Sta
ge 2
Sta
ge 3
Sta
ge 4
Sta
ge 5
Hea
lthy
Sta
ge 2
Sta
ge 3
Sta
ge 4
Sta
ge 5
Hea
lthy
Sta
ge 2
Sta
ge 3
Sta
ge 4
Sta
ge 5
Hea
lthy
Sta
ge 2
Sta
ge 3
Sta
ge 4
Sta
ge 5
Hea
lthy
Sta
ge 2
Sta
ge 3
Sta
ge 4
Sta
ge 5
Figure 3. Chronic kidney disease-specific trends in chemical composition of the breath. Trends of the tentatively identified volatile organic compounds that occur in >75% of the breath samples (Table 2). The columns and error bars represent the mean abundance and standard error of mean, respectively.
Nanomedicine (2012) 7(5)646 future science group
However, the sensing mechanism of chemire-sistive GNP layers is still subject of scien-tific controversy [26,40]. Therefore, no strict connection can be proposed at the present stage between the discriminative ability of
the selected sensors/sensing features and the exposure to certain VOC mixtures.
Sensors S1–S4 were based on chemiresistive layers of different types of GNPs, which differ in their ability to absorb certain classes of VOCs.
Gold nanoparticles for detecting chronic kidney disease ReseaRch aRticle
www.futuremedicine.comfuture science group 647
However, the organic ligands of the GNPs provide only a moderate chemical selectivity, so that the sensors are cross-reactive. The ligands are selected based on their ability to absorb certain (classes of) small VOCs that are typically found in exhaled breath as metabolic products. The changes in chemical composition between healthy and early-stage CKD differ from the changes in chemical composition between advanced and end-stage CKD. Hence, distinct combinations of sensing features for the different chemistries would provide the optimal results in these two cases. Note that sensors S1–S3 have been used previously for the identification of the breath VOC patterns of different types of cancer [13,30,39]. This is because metabolic breath VOCs may appear at different concentration ratios in the breath of healthy persons, CKD patients, and patients suffering from other diseases such as cancer, as discussed later. Therefore, the VOC patterns of CKD and cancer can indeed be identified with different combinations of sensing features that are read out from the same or similar sensors.
The SVM classif ication revealed 77% sensitivity, 80% specificity and 79% accuracy for the early-stage detection of CKD states. The obtained values fulfill the criteria for a good diagnostic method. The GNP breath test could be applied by general practitioners in nonspecialist settings to ensure the speedy referral of a new patient to a specialist, who would initiate an appropriate therapeutic approach. Detecting progression from stage-4 to stage-5 is equally important, because it usually marks the onset of dialysis treatment. Cross-validation (Figure 1b) showed that the progression to ESRD could be identified with high sensitivity (75%), specificity (92%) and accuracy (85%). The sensitivity, specificity and accuracy of detecting the progression from early to late-stage disease using a single sensing feature were 75, 77 and 76%, respectively. Note that these are the preliminary results of a pilot study with a limited sample size that was aimed at providing a proof-of-concept. Large-scale clinical trials are time consuming and are, therefore, often preceded by a small pilot study to test the feasibility of the studied method. An extended clinical study with a larger study population is currently underway to verify the obtained sensitivity and specificity.
Age, gender, diet, smoking habits, medication and exposure to hospital atmosphere are known to affect the chemical composition of the exhaled breath [23,24,26]. Ideally, the study population should be matched in terms of
these confounding factors. We have previously shown that the GNPs used by us have very little sensitivity to VOCs stemming from the above confounding factors [13,39]. Therefore, it is permissible to relax (at least, in part) the criteria for the compared groups. Table 1 shows that the population in the three studied cases was nevertheless relatively well matched in terms of most of the confounding factors. The compared groups are age matched in the first two cases and gender-matched in third case. Most of the volunteers were nonsmokers and the populations were well matched with respect of their smoking habits in all three cases. All CKD patients in this study were treated with calcium channel blockers, diuretics and/or a-blockers. The healthy controls did not receive these medications. Hence, the study population was matched in terms of medication in the last two cases. Finally, all volunteers, including the healthy controls, were recruited in the same hospital ward and were, therefore, exposed to the same confounding hospital atmosphere prior to the test.
n Trends in the chemical composition of the breath of CKD patientsThe observed trends with disease progression that are shown in Table 2 and Figure 3 could be explained by CKD-specific metabolic processes and/or with the accumulation of toxins due to loss of kidney function. CKD patients suffer from various types of carbohydrate metabolism disorders, which could affect the breath concentrations of the VOCs in the first two groups. The majority of CKD patients suffer from glucose intolerance, which is mainly attributed to insulin resistance [41]. Whether insulin resistance is the cause or the consequence of CKD is a subject of debate in the literature, and the lack of data from systematic studies has left the question open [41,42]. Insulin resistance has been associated with a failure in activating pyruvate dehydrogenase under induced CKD conditions [43,44]. This means that pyruvate cannot be converted into acetyl-CoA – a precursor for cholesterol that produces isoprene [24,45] and ketone bodies (such as acetone) [27,45] as byproducts. Hence, a reduction in the level of acetyl-CoA could explain the gradual decrease of isoprene during CKD advance and the rapid decrease of acetone (a recognized biomarker for diabetes [24]) in early stages (stages 2 and 3) of the CKD. The increase of acetone in the late stages (stages 4 and 5) could be related to the higher percentage of diabetic patients in those classes

ReseaRch aRticle Marom, Nakhoul, Tisch, Shiban, Abassi & Haick
Nanomedicine (2012) 7(5)648 future science group
that are characterized by higher concentrations of breath acetone.
The irregularity in the pyruvate conversion to acetyl-CoA is consistent with another observation. We have shown that acetoin increases as CKD progresses (FigureS 3 & 4). This could be attributed to a process that occurs in CKD patients, which favors the conversion of pyruvate to acetoin and 2,3-butylen glycol over the conversion to acetyl-CoA [46,47]. However, it should be noted that the amount of acetoin found was just above the detection limit of our GC-MS system, suggesting that the readings in the early stages (healthy to stage 3) might be less accurate. It is possible that the real change of acetoin over the progress of CKD is more gradual. Alternatively, acetoin could be of exogenous origin, because it is a common food additive (sweetener), and its accumulation in the breath of late-stage patients may be due to kidney-function loss [48].
The metabolic route of ethylene glycol is linked directly to glycolaldehyde, which is a short-chain aldehyde [49]. Short-chain aldehydes react with amino groups, which eventually leads to advanced glycation end products [50]. Advanced glycation end products are associated with age-related disease and could also affect kidneys function [50]. The accumulation of ethylene glycol could be an indication of an increase in advanced glycation end products, or could be related to the high percentage of diabetic patients as was the case for acetone. Still, ethylene glycol could be of exogenous origin, because it is a known environmental toxin [51], and its accumulation during late-stage CKD could be attributed to the failure of kidney function.
Group 3 comprises compounds that show significant increase in concentration in early-stage of CKD (stage 2). We assume that this is related to the continual death of kidneys nephrons, as up to 60% of the nephrons die before an accumulation of creatinine and urea could be observed. Collectively, the compounds in group 3 could be biomarkers for early-stage disease (e.g., for disease-related oxidative stress). For example, the sudden increase of styrene in stage 2 of the disease could be explained by the secretion of styrene by tubular maximum mechanism, which reaches its full capacity at stage 2. On the other hand, the compounds in group 3 could also be of exogenous origin. Styrene is an environmental toxin that causes DNA damage, and hydrocarbons are often released as environmental pollutants by the petrochemical industry [52].
The compounds in group 4 show no significant trends that could be related to the disease progression. However, it should be noted that slightly subsignificant changes in the concentration (p-values between 0.06 and 0.08) were observed, which could prove to be meaningful in a future study with an increased sample size.
Note that changes in the concentration of some of the identified compounds were also detected in the breath of cancer patients [13,30,39]. The detected small molecules are VOCs that are either metabolic products or toxins that are absorbed from the environment and are accumulated in the body due to reduced kidney function. As such, each separate compound may appear not only in the breath of healthy persons and CKD patients, but also in patients having other diseases (e.g., cancer [13,30,39]). This way, breath samples of patients suffering from distinctly different diseases may have some common constituent compounds, but at different concentration ratios.
ConclusionWe have delivered a proof-of-concept for a novel method in nanomedicine for detecting early-stage CKD and monitoring disease progression from exhaled breath of patients. Suitable combinations of GNP sensors could identify with high accuracy patients with early-stage CKD and determine disease progression from advanced CKD to ESRD. Transition from early disease (stages 2 and 3) to advanced disease (stages 4 and 5) could be identified from a single sensing feature. In the future we aim at customizing the GNP sensors to distinguish with higher resolution between CKD patients, so that the five stages of CKD progression (or their subcategories) can be identified. For this purpose a larger clinical trial will be conducted following this pilot study. GC-MS ana lysis identified three classes of VOCs in the breath that show distinctly different trends in average abundance during disease progression. The VOCs could be associated with accumulated environmental toxins, or endogenous biomarkers of CKD-related medical conditions and body processes. A biomarker-based breath test that utilizes GNP sensors could form the basis of a future cost-effective, fast and reliable (early) diagnostic test and monitoring tool for CKD.
Financial & competing interests disclosureThe authors acknowledge the financial support from the Israeli Ministry of Industry, Trade and Labor, through the NOFAR Program, and the Johnson & Johnson Services Inc.

Gold nanoparticles for detecting chronic kidney disease ReseaRch aRticle
www.futuremedicine.comfuture science group 649
All co-authors declare no competing interests related to the study. The authors have no other relevant affiliations or financial involvement with any organization or entity with a financial interest in or financial conflict with the subject matter or materials discussed in the manuscript apart from those disclosed.
No writing assistance was utilized in the production of this manuscript.
Ethical conduct of research The authors state that they have obtained appropriate insti tutional review board approval or have followed the princi ples outlined in the Declaration of Helsinki for all human or animal experimental investigations. In addi-tion, for investi gations involving human subjects, informed consent has been obtained from the participants involved.
Executive summary
� The presented study focuses on testing the feasibility of a novel method in nanomedicine for identifying early-stage chronic kidney disease (CKD) and monitoring disease progression from exhaled breath of patients.
� Sensors were reported that were based on chemiresistive layers of four types of spherical gold nanoparticles. � The results showed that combinations of the gold nanoparticle sensors could distinguish with high accuracy between the exhaled breath of:
− Early-stage CKD and healthy states; − Advanced and end-stage CKD states; − Early-stage and advanced stage CKD.
� The proposed nanodiagnostic method is based on the detection of volatile CKD biomarkers that can be found in the exhaled breath, because CKD-related changes in the blood chemistry are reflected in measurable changes to the breath through exchange via the lung, causing the fishy smell characterizing the breath of CKD patients.
� Trends in the chemical composition of the exhaled breath with disease progression could be associated with endogenous CKD-related body processes or with accumulated environmental toxins.
� Breath testing had been used to aid the diagnosis of CKD in the past, until it lost its importance in the age of medical technology. The recent advances in nanomedicine, like the one reported here, may very soon return breath ana lysis into standard medical practice. A biomarker-based breath test that utilizes combinations of gold nanoparticle sensors could form the basis of a future cost-effective, fast and reliable (early) diagnostic test for CKD and a monitoring tool for disease progression.
ReferencesPapers of special note have been highlighted as:n of interestnn of considerable interest
1 Hall YN, Chertow GM. End stage renal disease. Clin. Evid. 15, 1171–1181 (2006).
2 Schrier RW, Wang W, Poole B, Mitra A. Acute renal failure: definitions, diagnosis, pathogenesis and therapy. J. Clin. Invest. 114, 5–14 (2004).
3 Greene EL, Paller MS. Oxygen free radicals in acute renal failure. Miner. Electrolyte Metab. 17, 124–132 (1991).
4 Levey AS, Andreoli SP, DuBose T, Provenzano R, Allan J, Collins AJ. Chronic kidney disease: common, harmful and treatable – world kidney day 2007. Am. J. Nephrology 27, 108–112 (2007).
5 Levey AS, Eckardt KU, Tsukamoto Y et al. Definition and classification of chronic kidney disease: a position statement from kidney disease: improving global outcomes (KDIGO). Kidney Int. 67(6), 2089–2100 (2005).
6 Collins AJ, Li S, Gilbertson DT, Liu J, Chen SC, Herzog CA. Chronic kidney disease and cardiovascular disease in the Medicare population. Kidney Int. Suppl. 87, S24–S31 (2003).
7 Levey AS, Coresh J, Balk E et al. National Kidney Foundation practice guidelines for chronic kidney disease: evaluation,
classification, and stratification. Ann. Intern. Med. 139(2), 137–149 (2003).
8 Hirsch S. Preventing end-stage renal disease: flexible strategies to overcome obstacles. Curr. Opin. Nephrol. Hypertens. 15(5), 473–480 (2006).
9 Vanholder R, Baurmeister U, Brunet P, Cohen G, Glorieux G, Jankowski J. A bench to bedside view of uremic toxins. J. Am. Soc. Nephrol. 19(5), 863–870 (2008).
10 Jourde-Chiche N, Dou L, Cerini C, Dignat-George F, Vanholder R, Brunet P. Protein-bound toxins–update 2009. Semin. Dial. 22(4), 334–339 (2009).
11 Meyer TW, Hostetter TH. Uremia. N. Engl. J. Med. 357(13), 1316–1325 (2007).
12 Devarajan P. Review: neutrophil gelatinase-associated lipocalin: a troponin-like biomarker for human acute kidney injury. Nephrology 15(4), 419–428 (2010).
13 Peng G, Hakim M, Broza YY et al. Detection of lung, breast, colorectal, and prostate cancers from exhaled breath using a single array of nanosensors. Br. J. Cancer 103, 542–551 (2010).
n Presents a gold nanoparticle sensor array to discriminate between breath patterns of healthy states and the four most widespread cancers in the developed world.
14 Songa G, Qina T, Liua H et al. Quantitative breath ana lysis of volatile organic compounds
of lung cancer patients. Lung Cancer 67, 227–231 (2010).
15 de Gennaro G, Dragonieri S, Longobardi F et al. Chemical characterization of exhaled breath to differentiate between patients with malignant plueral mesothelioma from subjects with similar professional asbestos exposure. Anal. Bioanal. Chem. 398(7–8), 3043–3050 (2010).
16 Natale CD, Mantini A, Macagnano A, Antuzzi D, Paolesse R, D’Amico A. Electronic nose ana lysis of urine samples containing blood. Physiol. Meas. 20, 377–384 (1999).
17 Moorhead KT, Hill JV, Chase JG et al. Modelling acute renal failure using blood and breath biomarkers in rats. Comput. Methods Programs Biomed. 101(2), 173–182 (2011).
18 Lin Y-J, Guo H-R, Chang Y-H, Kao M-T, Wang H-H, Hong R-I. Application of the electronic nose for uremia diagnosis. Sens. Actuators B 76(1), 177–180 (2001).
19 Fend R, Bessant C, Williams AJ, Woodman AC. Monitoring haemodialysis using electronic nose and chemometrics. Biosens. Bioelectron. 19(12), 1581–1590 (2004).
20 Voss A, Baier V, Reisch R et al. Smelling renal dysfunction via electronic nose. Ann. Biomed. Eng. 33(5), 656–660 (2005).
21 Wang P, Tan Y, Xie H, Shen F. A novel method for diabetes diagnosis based on electronic nose. Biosens. Bioelectron. 12(9–10), 1031–1036 (1997).

ReseaRch aRticle Marom, Nakhoul, Tisch, Shiban, Abassi & Haick
Nanomedicine (2012) 7(5)650 future science group
22 Simenhoff ML, Burke JF, Saukkonen JJ, Ordinario AT, Doty R. Biochemical profile or uremic breath. N. Engl. J. Med. 297(3), 132–135 (1977).
n First ana lysis of uremic breath.
23 Amann A, Poupart G, Telser S, Ledochowski M, Schmid A, Mechtcheriakov S. Applications of breath gas ana lysis in medicine. Int. J. Mass. Spectrom. 239(2–3), 227–233 (2004).
24 Buszewski B, Kesy M, Ligor T, Amann A. Human exhaled air analytics: biomarkers of diseases. Biomed. Chromatogr. 21(6), 553–566 (2007).
nn Excellent review of breath biomarkers of different diseases and of confounding breath compounds.
25 Mazzone P. Progress in the development of a diagnostic test for lung cancer through the ana lysis of breath volatiles. J. Breath. Res. 2(3), 037014. (2008).
26 Tisch U, Haick H. Arrays of chemisensitive monolayer-capped metallic nanoparticles for diagnostic breath testing. Rev. Chem. Eng. 26, 171–179 (2011).
nn Discusses the application of chemiresistive gold nanoparticle layers for breath testing.
27 Amann A, Miekisch W, Pleil J, Risby T, Schubert J. Chapter 7: Methodological Issues of Sample Collection and Ana lysis of Exhaled Breath. Maney Publishing, Leeds, UK, 49, 96–114 (2010).
nn Detailed review of state-of-the art methods for breath sample collection and breath ana lysis. Proposes standardization.
28 Haick H, Hakim M, Patrascu M et al. Sniffing chronic renal failure in rat model by an array of random networks of single-walled carbon nanotubes. ACS Nano 3(5), 1258–1266 (2009).
29 Peng G, Trock E, Haick H. Detecting simulated patterns of lung cancer biomarkers by random network of single-walled carbon nanotubes coated with nonpolymeric organic materials. Nano. Lett. 8(11), 3631–3635 (2008).
30 Peng G, Tisch U, Adams O et al. Diagnosing lung cancer in exhaled breath using gold
nanoparticles. Nat. Nanotechnol. 4(10), 669–673 (2009).
31 Dovgolevsky E, Haick H. Direct observation of the transition point between quasi-spherical and cubic nanoparticles in two-step seed-mediated growth method. Small 4(11), 2059–2066 (2008).
32 Dovgolevsky E, Tisch U, Haick H. Chemically sensitive resistors based on monolayer-capped cubic nanoparticles: towards configurable nanoporous sensors. Small 5(10), 1158–1161 (2009).
33 Dovgolevsky E, Konvalina G, Tisch U, Haick H. Monolayer-capped cubic platinum nanoparticles for sensing nonpolar analytes in highly humid atmospheres. J. Phys. Chem. C 114(33), 14042–14049 (2010).
34 Haick H. Chemical sensors based on molecularly modified metallic nanoparticles. J. Phys. D 40, 7173–7186 (2007).
35 Cortes C, Vapnik V. Support-vector networks. Machine Learning 30(3), 273–297 (1995).
36 Hall M, Frank E, Holmes G, Pfahringer B, Reutemann P, Witten IH. The WEKA data mining software: an update. SIGKDD Explorations 11(1), 10–18 (2009).
37 Rock F, Barsan N, Weimar U. Electronic nose: current status and future trends. Chem. Rev. 108(2), 705–725 (2008).
38 Amann A, Spanel P, Smith D. Breath ana lysis: the approach towards clinical applications. Mini Rev. Med. Chem. 7(2), 115–129 (2007).
39 Hakim M, Billan S, Tisch U et al. Diagnosis of head-and-neck-cancer from exhaled breath. Br. J. Cancer 104, 1649–1655 (2011).
40 Tisch U, Haick H. Nanomaterials for cross-reactive sensor arrays – an invited review. MRS Bull. (35), 797–803 (2010).
41 Rigalleau V, Gin H. Carbohydrate metabolism in uraemia. Curr. Opin. Clin. Nutr. Metab. Care 8(4), 463–469 (2005).
42 Mak RH. Insulin and its role in chronic kidney disease. Pediatr. Nephrol. 23(3), 355–362 (2008).
43 Contreras I, Caro J, Aveledo L, Diaz K, Durrego P, Weisinger J. In chronic uremia,
insulin activates receptor kinase but not pyruvate dehydrogenase. Nephron 61(1), 77–81 (1992).
44 Folli F, Sinha MK, Brancaccio D, Caro JF. Insulin resistance in uremia: in vitro model in the rat liver using human serum to study mechanisms. Metabolism 35(11), 989–998 (1986).
45 Murray RK, Bender DA, Botham KM, Kenellu PJ, Rodwell VW, Weil PA. Harper’s Illustrated Biochemistry. The McGraw-Hill Companies, NY, USA (2009).
46 Galloway R, Morgan J. Serum pyruvate and lactate in uremia. Metabolism 13, 818–822 (1964).
47 Thölen H, Bigler F, Staub H. Pathogenesis of the uremic syndrome. Pharmacological studies on acetoin and 2, 3-butylene glycol. Cell. Mol. Life Sci. 17(8), 359–360 (1961).
48 Heierli C, Thölen H. Metabolites of glucose in the blood of patients with renal failure. Klin. Wochenschr. 59(9), 431–436 (1981).
49 Lockley DJ, Howes D, Williams FM. Cutaneous metabolism of glycol ethers. Arch. Toxicol. 79(3), 160–168 (2005).
50 Lorenzi R, Andrades ME, Bortolin RC, Nagai R, Dal-Pizzol F, Moreira JCF. Circulating glycolaldehyde induces oxidative damage in the kidney of rats. Diabetes Res. Clin. Pract. 89(3), 262–267 (2010).
51 Jacobsen D, McMartin KE. Methanol and ethylene glycol poisonings. Mechanism of toxicity, clinical course, diagnosis and treatment. Med. Toxicol. 1(5), 309–334 (1986).
52 Terre’Blanche G, Heyer N, Bergh JJ, Mienie LJ, van der Schyf CJ, Harvey BH. The styrene metabolite, phenylglyoxylic acid, induces striatal-motor toxicity in the rat: influence of dose escalation/reduction over time. Neurotox. Res. 20(1), 97–101 (2011).
n Website101 Scripps Centre for Metabolomics.
http://metlin.scripps.edu/download/ (Accessed 2 April 2011)


![Detecting Carbon Monoxide Poisoning Detecting Carbon ...2].pdf · Detecting Carbon Monoxide Poisoning Detecting Carbon Monoxide Poisoning. Detecting Carbon Monoxide Poisoning C arbon](https://img.dokumen.tips/doc/110x75/5f551747b859172cd56bb119/detecting-carbon-monoxide-poisoning-detecting-carbon-2pdf-detecting-carbon.jpg)