Embed Size (px)
Citation preview

Going Loopy:Writing and Understanding
Batch Scripts and Functions in Matlab
Jason TaylorSkills Seminar
18 November 2008

I'm Not a Matlab Evangelist, but...
There are distinct advantages to analysing your data using scripts and functions:
- Leave data in its original format- Retain a complete record of everything you've done- Hard work for the first subject, easy sailing for the rest- Easily modify your pathway and re-run analyses
Alternatives to Matlab:- Octave (free!)- S-Plus (not free) or R (free!)- Yes, you can script Excel and SPSS too

My Syntax:
In black, I'll give definitions or talk about something. Blah blah. Blah.
% This is a comment about the following command:> command(<variable>,[<optional variable>]);
% Example: Get the mean of the values in a variable:> m = mean(<mydata>,[<dimension>])
% e.g.> rt = [553 620 601 576];> mrt = mean(rt);
Note that commands with variables in <angle brackets> aren't copy-and-paste-able into matlab. But other commands are (without the leading '>')
matlab ignoreslines that startwith '%'
matlab will print the result of every command UNLESS the line ends with ';'
helpful points show up in red boxes
'>' indicates type at the command line

Starting Matlab
There are many ways...
% Start matlab (default options):> matlab
% Start matlab with no desktop, no java virtual machine, no ‘splash’:> matlab -nodesktop -nojvm -nosplash
% Start SPM for fMRI analysis (opens a matlab window):> spm fmri
% Start SPM for EEG, open matlab window on l39, no desktop, splash:> spm eeg nodesktop nosplash l39
Startup file:/home/<user>/matlab/startup.me.g., addpath /imaging/local/spm_eeglab/

Path
Functions and scripts will be executable if they reside in one of the directories in the 'Path' (top=priority).
% Report the contents of path:> path
% Add a directory to your path (prepend):> addpath <path/to/directory>
% e.g.,> addpath /imaging/jt03/demo/scripts/
% or, append:> addpath /imaging/jt03/demo/scripts/ -END

A Two-Page Matlab Primer
% Scalar values:> x = 42
% Vectors:> xvec = [1 2 3 4 5 6]> xvec = 1:6 % equivalent
% Matrices:> xmat = [1 2 3; 4 5 6; 7 8 9]
% N-dimensional arrays:> x3d = cat(3,xmat,xmat+10)
% Get length of each dimension:> size(xmat)
% Indexing:> xmat(:,[2 3]) % <- all rows, columns 2 and 3
% Maths/logic:> y = x + 10> y = x * 5> y = xvec .* [10 100 1000 10 100 1000]> y = sqrt(x^3)> xvec > 3> xvec(find(xvec>3 & xvec~=6))> xvec'

A Two-Page Matlab Primer
% Strings:> mystring = 'hello'> xstr = '42' % not the same as x = 42
% Cell arrays (may mix types, sizes):> xcell = {[42]; [1:6]; mystring}> xcell(2)> xcell{2}
% Structures:> S.subj = 's01';> S.sex = 'male';> S.age = 27;> S.data = [1 2 3 4 5 6];S> isfield(S,'age')
% Loops:> for i = 1:15> if i>3> disp(sprintf('subject %d',i))> end> end
% TIPS: <up> for last command … <tab> to complete … <ctrl+c> stop command

The Workspace
Workspace = Variables that are currently active and accessible to you (and to functions as input).
% Two ways to get the mean of three numbers:> mean([4 5 6])
% or,> x = [4 5 6];> mx=mean(x)
'x' is now a variable in the workspace

Some Workspace Commands
% List names of all variables in the workspace:> who
% List names, size, class of all variables in the workspace:> whos
% List ... of a subset of variables in the workspace:> whos [<variablenamelist>]
% eg., > whos x y z> whos *x*
% Clear (all or subset of) variables out of workspace:> clear [<variablenames>]
% Useless but kinda fun... try it:> why
'*' is a wildcard;variables listed: x, mx

Functions vs. Batch Scripts
Function:- General (usually applies to
any data, project)- Run as command- Variables do not stay in
workspace (except input/output arguments)
- Can get help by typing:> help <function>
Batch Script:- 'Hack and Run' (customise
to your data, project)- Copy & paste or command- Variables stay in workspace
You may start writing a batch script, then later find it useful to convert sections of it into functions.

Writing a Batch Script – Top Tips
COMMENTS! - At top: What the script does, when created (updated)?- In body: Write an outline using comments - ... then fill in with increasingly specific comments (as necessary)
and the commands themselves.

Writing a Batch Script – An Example
At top: What the script does, when created (updated)?
% This is a batch script to get the median of each subject's RT data,% plot the grand mean and standard error for the two conditions. % % by Jason Taylor (17/11/2008)% updated (jt 17/11/2008): added error bars%
This helps you when you come back to the script later...and helps others if you share it!

Writing a Batch Script – An Example
In body: Write an outline using comments
%-- (1) Define directory, filename, subject parameters
%-- (2) Get each subject's median RT
%-- (3) Compute grand mean, standard error
%-- (4) Plot bar graph with error bars
Give a plain-English description of what you plan to do

Writing a Batch Script – An Example
... then fill in with increasingly specific comments (as necessary) & commands
%-- (1) Define directory, filename, subject parameters:
% Project directory:projdir = '/imaging/jt03/demo/rtdata/subjects/';
% Working directory:wkdir = '/imaging/jt03/demo/rtdata/ga15/';
% Subjects:subjects=[1:15];
You may find yourself omitting these comments as you become more advanced (and your scripting becomes consistent)

Writing a Batch Script – An Example%-- (2) Get each subject's median RT:
% Initialise variable to collect median RTs:mdrt=[];
% Loop over subjects:for i = 1:length(subjects)
% Get current subject label:subj = sprintf('s%02d',subjects(i));
% Go to subject's directory, load data:cd([projdir subj])load('word_nonword.mat');
% Put median RT for each condition into summary matrix:mdrt(i,1) = median(D.rt(find(D.event==1)));mdrt(i,2) = median(D.rt(find(D.event==2)));
end % i subjects
produces:'s01', 's02',..., 's05'
indent your loops!
label 'end' of loopsand end indent

Writing a Batch Script – An Example%-- (3) Compute grand mean, standard error:
% Compute mean (collapsing over rows):gm = mean(mdrt,1);
% Get standard error:se = std(mdrt)/sqrt(size(mdrt,1));
% Save it as a .mat file in working directory:cd(wkdir)save rtdata.mat gm se
mean(x,1) collapses over rows
mean(x,2) collapses over columns
mean(x,n) collapses over the nth dimension
(also true of some other commands)

Writing a Batch Script – An Example%-- (4) Plot:
% Open a figure, make background white:fig = figure;set(fig, 'color', [1 1 1])
% Plot means:bar(gm);
% Rescale:ymax = ceil(max(gm+se));set(gca, 'ylim', [0 ymax]);
% Plot and format error bars:ebar1 = line([1 1],[gm(1) gm(1)+se(1)]);ebar2 = line([2 2],[gm(2) gm(2)+se(2)]);set([ebar1 ebar2], 'linewidth', 6);
gray is drab :)
round(x) rounds to the nearest integer,ceil(x) rounds up,floor(x) rounds down
try:> help round(see also)

Writing a Batch Script – An Example% (4) Plot continued…
% Apply title, labels, etc.:title('Grand Mean of Median RTs');xlabel('Stimulus Type');ylabel('RT + SEM (ms)');set(gca, 'xticklab', {'word', 'nonword'});
% End gracefully:disp('done!')
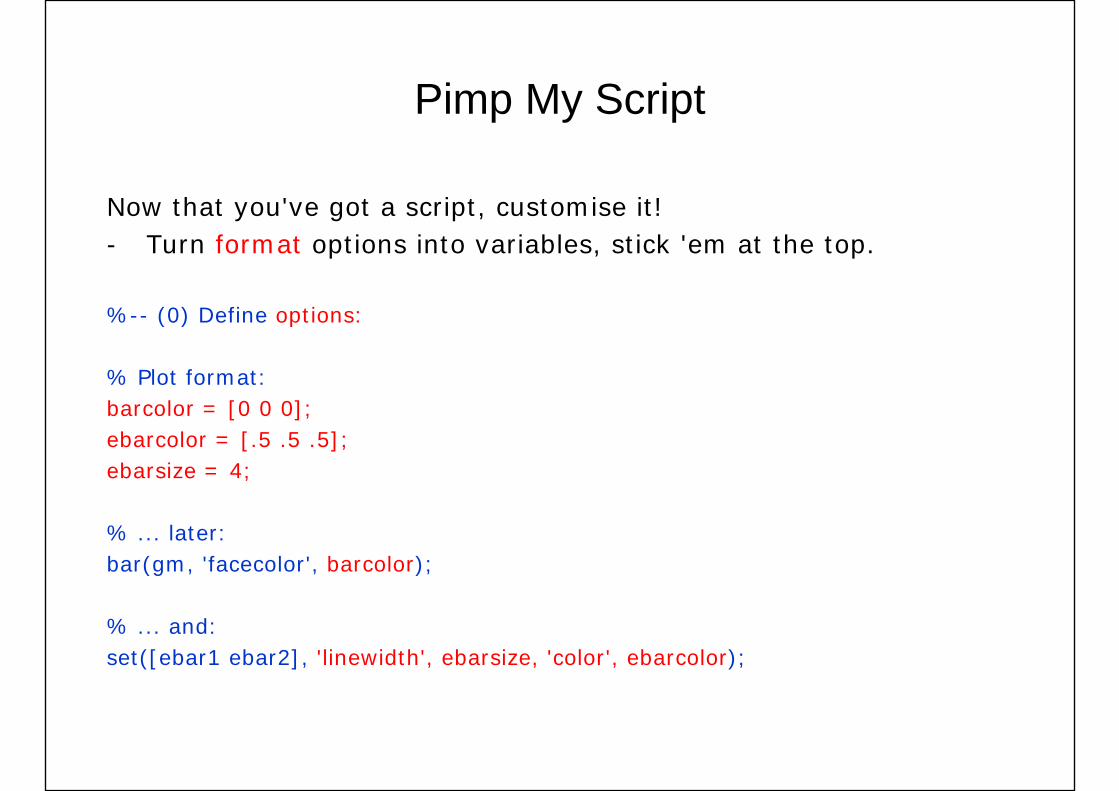
Pimp My Script
Now that you've got a script, customise it! - Turn format options into variables, stick 'em at the top.
%-- (0) Define options:
% Plot format:barcolor = [0 0 0];ebarcolor = [.5 .5 .5];ebarsize = 4;
% ... later:bar(gm, 'facecolor', barcolor);
% ... and:set([ebar1 ebar2], 'linewidth', ebarsize, 'color', ebarcolor);

Pimp My Script
Now that you've got a script, customise it! - Turn data options into variables, stick 'em at the top.
%-- (0) Define options:
% Conditions:conds=[1 2];condlabs={'word', 'nonword'};
% ... later:mdrt(i,1) = median(D.rt(find(D.event==conds(1))));mdrt(i,2) = median(D.rt(find(D.event==conds(2))));
% ... and:set(gca, 'xticklab', condlabs);

Pimp My Script
Now that you've got a script, customise it! - Better yet – make it general and loop through data options:
%-- (0) Define options:
% Conditions:conds=[1 2];condlabs={'word', 'nonword'};
% ... later:for i = 1:length(subjects)
for j = 1:length(conds)mdrt(i,j) = median(D.rt(find(D.event==conds(j))));
end % j in condsend % i in subjects

Pimp My Script
Now that you've got a script, customise it! - Add processing flags and if...then loops:
% Processing options:dosave = 0; % save grandmean data?doplot = 1; % plot data?
% ... later:if dosave
% Save it as a .mat file in working directory:cd(wkdir)save rtdata.mat gm se
end % if dosave
if doplot...
end % if doplot

Pimp My Script
Now that you've got a script, customise it! - Add processing options and switch-case variables:
% Processing options:plotvar = 'mean' % 'median', 'mean', 'trim<N>' (N% trimmed mean)?
% ... later:rt = D.rt(find(D.event==conds(j)));
switch plotvarcase 'median'
mdrt(i,j) = median(rt);case 'mean'
mdrt(i,j) = mean(rt);otherwise % trim<N>
trimpct = str2num(plotvar(5:end));rt = rt(rt>prctile(rt,trimpct/2) & rt<prctile(rt,100-(trimpct/2)));mdrt(i,j) = mean(rt);
end % switch

Some Helpful Commands (re: Scripts)
% sprintf – write formatted data to a string; disp – display value of a variable> myname = 'Jason';> txt = sprintf('Hello there, my name is %s', myname);> disp(txt)
% eval – evaluate a text string> mycmd = 'x = 10;';> eval(mycmd)
% unix, '!' – evaluate unix command string> fname = 'foo.txt'; newfname = 'foo2.txt';> mycmd = sprintf('cp %s %s',fname,newfname);> unix(mycmd); > eval([ '! ' mycmd]); % equivalent
% Matlab editor: % - F9 to execute selected line;% - Insert breakpoints: pause any run, allow access to variables

Some Helpful Commands (re: Scripts)
% try...catch...end – try to execute command; if fails, execute alternate command% - particularly helpful for implementing 'default' values
> try doplot = S.doplot;> catch doplot = 1;> end
% input – prompt user for input> try subj = S.subject;> catch subj = input('Which subject?: ','s');> end
% find – get indices of variable at which condition is satisfied> x = 21:30;> indx = find(x>25)> x(indx)
% strcmp (strcmpi, strncmp) – compare strings (ignore case, 1:n)> strncmpi(datestr(now), '18-November',6)

Scripts -> Functions
At some point you'll become annoyed at typing the same set of commands over and over and over again.
For example, matlab has no 'standard error' function. Remember, we just computed it for our data:
% Get standard error:se = std(mdrt)/sqrt(size(mdrt,1));
So why not write your own function?

Writing a Function
Let's look at matlab's 'mean' function
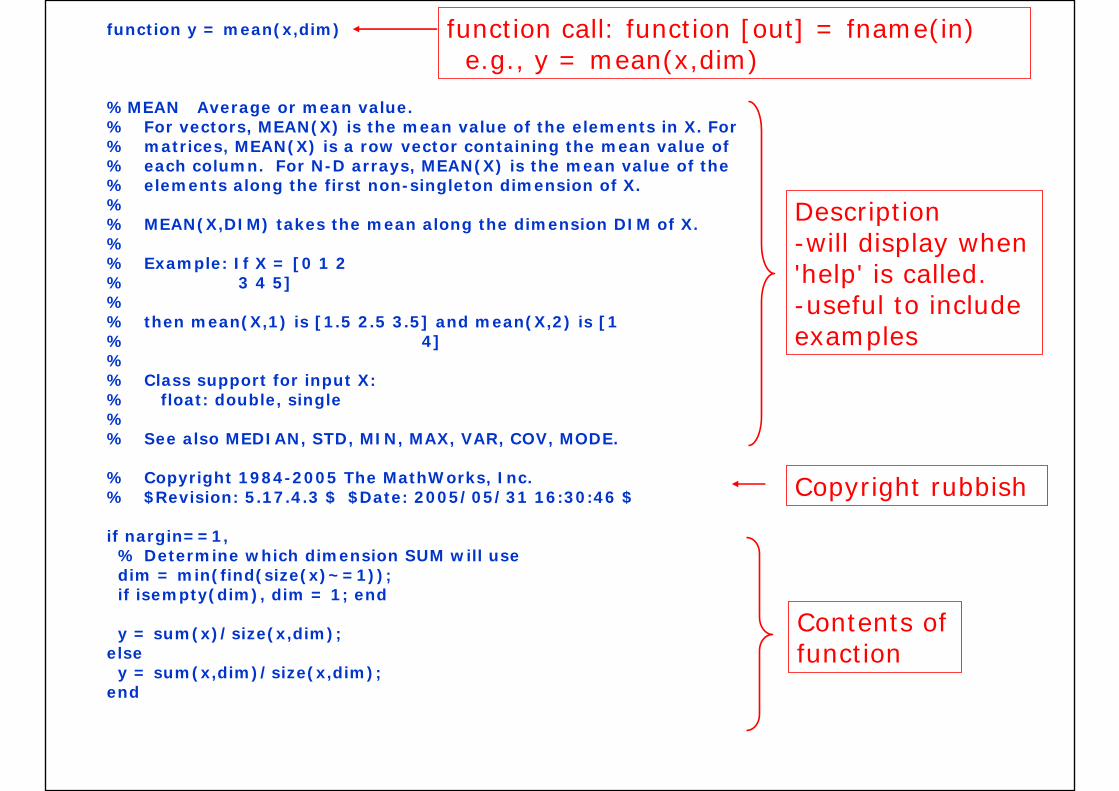
function y = mean(x,dim)
%MEAN Average or mean value.% For vectors, MEAN(X) is the mean value of the elements in X. For% matrices, MEAN(X) is a row vector containing the mean value of% each column. For N-D arrays, MEAN(X) is the mean value of the% elements along the first non-singleton dimension of X.%% MEAN(X,DIM) takes the mean along the dimension DIM of X. %% Example: If X = [0 1 2% 3 4 5]%% then mean(X,1) is [1.5 2.5 3.5] and mean(X,2) is [1% 4]%% Class support for input X:% float: double, single%% See also MEDIAN, STD, MIN, MAX, VAR, COV, MODE.
% Copyright 1984-2005 The MathWorks, Inc. % $Revision: 5.17.4.3 $ $Date: 2005/05/31 16:30:46 $
if nargin==1, % Determine which dimension SUM will usedim = min(find(size(x)~=1));if isempty(dim), dim = 1; end
y = sum(x)/size(x,dim);elsey = sum(x,dim)/size(x,dim);
end
function call: function [out] = fname(in)e.g., y = mean(x,dim)
Description -will display when 'help' is called.-useful to include examples
Copyright rubbish
Contents of function

Writing a Function
Compute standard error of the mean (sem.m)
function [y] = sem(x)
% Computes standard error (standard deviation % divided by square root of the sample size) of a vector.%% USAGE: y = sem(x)%% by Jason Taylor (18/11/2008)% - note: should be modified to handle matrices
% Compute SEM:y = std(x)/sqrt(length(x));
Save as 'sem.m' in a directory in your Path.
Give it a unique name; try:> which sem
Describe it... and how to use it
Take credit/blame
Note modifications, limitations, bugs
Do it!

Writing a Function
Helpful additions:
% Check that input is a vector:if nargin~=1
help semerror('No input!')
elseif sum(size(x)>1)>1help semerror('Input must be a vector!')
end
% Compute SEM:y = std(x)/sqrt(length(x));
'error' stops processing, displays message
'nargin' returns the number of input arguments

Some Helpful Commands (re: Functions)
% Get help on function 'funcname':> help <funcname>
% Find where funcname's m-file resides:> which <funcname>
% View the contents of funcname:> type <funcname>
% Edit a function:> edit <funcname> % note: may be read-only, but you can save-as
% Edit a function in your favourite non-matlab editor (e.g., 'nedit'):> mpath = which('<funcname>');> eval(sprintf('! nedit %s',mpath))

Where to Find More Help
Obviously, > help [<funcname>]
For pretty help, > doc [<funcname>]
Look at the function! > type <funcname>> edit <funcname>
Online: Matlab Centralhttp://www.mathworks.com/matlabcentral/
And the user file exchangehttp://www.mathworks.com/matlabcentral/fileexchange/
On the imaging wiki:http://imaging.mrc-cbu.cam.ac.uk/imaging/LearningMatlab

%% Introductory notes on the demo dataset.% % The demo dataset contains the response time (RT) data from 15 subjects% in a word/nonword (lexical decision) task. % % by Jason Taylor, 18/11/2008% % If you have access to the /imaging/ directory, you should be able to see: ls /imaging/jt03/demo/scripts/ls /imaging/jt03/demo/rtdata/subjects/ % Which contain the scripts and subject directories, respectively. % In rtdata/subjects, you'll find the directories s01, s02, ... , s15, % and ga15. Each subject's directory contains a file called % word_nonword.mat which contains a structure ('D'). %If you try, eg.: cd /imaging/jt03/demo/rtdata/subjects/s01/load word_nonword.matwhos D % You should see that D is now in your workspace, and it contains the % fields 'fname','subj', etc. To see s01's trial-by-trial data, try: subjdata = [ D.trial D.event D.rt D.acc ] % The variable 'subjdata' now contains 480 rows (trials) and 4 columns % (trial index, event type, RT, accuracy). For a more useful summary, % try the command 'grpstats', which gives a summary statistic ('mean') % for some data (subjdata(:,3), the RT data) at the levels of another % (subjdata(:,2), the event type): grpstats(subjdata(:,3),subjdata(:,2),{'mean'}) % One useful bit I could have added to the script is to filter out % incorrect trials. So, for example: filt = subjdata(:,4);grpstats(subjdata(find(filt),3),subjdata((find(filt)),2),{'mean'}) % Or, on line 60 of demo_script_final.m, we could change:rt = D.rt(find(D.event==conds(j)));% to:rt = D.rt(find(D.event==conds(j) & D.acc==1)); % If you want to be really fancy, you can put a processing flag at the % top of the script, e.g.: do_accfilt = 1; % filter based on accuracy % ... then put an if-else-end loop around the former line 60:if do_accfilt rt = D.rt(find(D.event==conds(j) & D.acc==1));else rt = D.rt(find(D.event==conds(j)));end % Right. Have fun. Let me know if you have any questions!% - Jason.

%% This is a batch script to get the median of each subject's RT data,% plot the grand mean and standard error for the two conditions. % % (simple version)% % by Jason Taylor (17/11/2008)% updated (jt 17/11/2008): added error bars% %-- (1) Define directory, filename, subject parameters: % Project directory:projdir = '/imaging/jt03/demo/rtdata/subjects/'; % Working directory:wkdir = '/imaging/jt03/demo/rtdata/ga15/'; % Subjects:subjects=[1:15]; %-- (2) Get each subject's mean RT: % Initialise variable to collect median RTs:mdrt=[]; % Loop over subjects:for i = 1:length(subjects) % Get current subject label: subj = sprintf('s%02d',subjects(i)); % Go to subject's directory, load data: cd([projdir subj]) x = load('rt.mat'); % Put median RT for each condition into mdrt: mdrt(i,1) = median(x.rt(find(x.cond==1))); mdrt(i,2) = median(x.rt(find(x.cond==2))); end % i subjects %-- (3) Compute grand mean, standard error: % Compute mean (collapsing over rows):gm = mean(mdrt,1); % Get standard error:se = std(mdrt)/sqrt(size(mdrt,1)); % Save it as a .mat file in working directory:cd(wkdir)save rtdata.mat gm se %-- (4) Plot: % Open a figure, make background white:fig = figure;set(fig, 'color', [1 1 1]) % Plot means:bar(gm); % Rescale:

ymax = ceil(max(gm+se));set(gca, 'ylim', [0 ymax]); % Plot and format error bars:ebar1 = line([1 1],[gm(1) gm(1)+se(1)]);ebar2 = line([2 2],[gm(2) gm(2)+se(2)]);set([ebar1 ebar2], 'linewidth', 6); % Apply title, labels, etc.:title('Grand Mean of Median RTs');xlabel('Stimulus Type');ylabel('RT + SEM (ms)');set(gca, 'xticklab', {'word', 'nonword'}); % End gracefully:disp('done!')

%% This is a batch script to get the median (mean, trimmed mean) % of each subject's RT data, plot the grand mean and standard error % for selected conditions. % % by Jason Taylor (17/11/2008)% updated (jt 17/11/2008): added error bars% updated (jt 17/11/2008): added plotvar, options, conds loop% %-- (0) Define options: % Plot format:barcolor = [.5 .5 .5];ebarcolor = [0 0 0];ebarsize = 3; % Processing options:plotvar = 'trim10'; % 'median', 'mean', 'trim<N>' (N%-trimmed mean)dosave = 0; % save grandmean data?doplot = 1; % plot grandmean data? % Data options:conds = [1 2];condlabs = {'word', 'nonword'}; %-- (1) Define directory, filename, subject parameters: % Project directory:projdir = '/imaging/jt03/demo/rtdata/subjects/'; % Working directory:wkdir = '/imaging/jt03/demo/rtdata/subjects/ga15/'; % Filename:fname = 'word_nonword.mat'; % Subjects:subjects=[1:15]; %-- (2) Get each subject's median/mean/trimmed mean RT: % Initialise variable to collect md/m/tm RTs:mrt=[]; % Loop over subjects:for i = 1:length(subjects) % Loop over conditions for j = 1:length(conds) % Get current subject label: subj = sprintf('s%02d',subjects(i)); % Go to subject's directory, load data: cd([projdir subj]) load(fname); rt = D.rt(find(D.event==conds(j))); switch plotvar case 'median' mrt(i,j) = median(rt); case 'mean' mrt(i,j) = mean(rt); otherwise % trim<N> trimpct = str2num(plotvar(5:end));

rt = rt(rt>prctile(rt,trimpct/2) & rt<prctile(rt,100-(trimpct/2))); mrt(i,j) = mean(rt); end % switch end % j in conds end % i in subjects %-- (3) Compute grand mean, standard error: % Compute mean (collapsing over rows):gm = mean(mrt,1); % Get standard error:se = std(mrt)/sqrt(size(mrt,1)); % Save it as a .mat file in working directory:if dosave cd(wkdir) save rtdata.mat mrt gm seend % if dosave %-- (4) Plot: if doplot % Open a figure, make background white: fig = figure; set(fig, 'color', [1 1 1]) % Plot means: bar(gm, 'facecolor', barcolor); % Rescale: ymax = 50*(ceil((max(gm+se)/50))); ymin = 50*(floor((min(gm-se)/50))); set(gca, 'ylim', [ymin ymax]); % Plot and format error bars: for j = 1:length(conds) ebar1 = line([j j],[gm(j) gm(j)+se(j)]); ebar2 = line([j j],[gm(j) gm(j)-se(j)]); set([ebar1 ebar2], 'linewidth', ebarsize, 'color', ebarcolor); end % Apply title, labels, etc.: title(sprintf('Grand Mean of %s RTs',plotvar)); xlabel('Stimulus Type'); ylabel('RT + SEM (ms)'); set(gca, 'xticklab', condlabs); end % if doplot % End gracefully:disp(sprintf('\n done! \n'))

% Here's some more stuff you can try with % the RT data: % T-test[H,P,CI,STATS] = ttest(mrt(:,1),mrt(:,2),.05,'both') % Histogramhist(rt,12) % Scatter plotplot(mrt(:,1),mrt(:,2),'bo') % Correlationcorr(mrt(:,1),mrt(:,2))

function y = sem(x) % Computes standard error (standard deviation divided by % square root of N) of a vector.%% by Jason Taylor (18/11/2008)% note: should be modified to handle matrices% % Check that input is a vector:if nargin~=1 help sem error('No input!')elseif sum(size(x)>1)>1 help sem error('Input must be a vector!')end % Compute SEM:y = std(x)/sqrt(length(x)); return