Embed Size (px)
Citation preview

Going Global: The ChangingPattern of U.S. InvestmentAbroad
By Marcela Meirelles Aurélio
Investors typically allocate only a small share of their portfolios toforeign assets. This pattern of investment behavior, known as “homebias,” is puzzling because it causes investors to miss opportunities to
diversify risks. During downturns in the U.S. economy, many domesticassets perform poorly, precisely when asset returns are most valuable. Bypurchasing foreign assets that are only partly affected by the U.S. busi-ness cycle, however, investors are able to hedge against adversefluctuations in domestic income.
Recent evidence suggests that home bias might actually be declining.Over the past decade, U.S. holdings of foreign financial assets—stocks andbonds—have grown remarkably. At the same time, foreign physical assets,such as foreign direct investment in production plants, have also become farmore common. Overall, the share of U.S. investments allocated to foreignassets swelled from 40 percent of GDP in 1990 to 89 percent in 2005.
This article investigates the recent behavior of U.S. foreign investmentand the factors driving the change in its fastest growing category—namely,international equity investment. Home bias in U.S. equity investment hasindeed declined during the last decade. However, the propensity to invest
Marcela Meirelles Aurélio is an economist at the Federal Reserve Bank of Kansas City.Elisha J. Wiseman, a research associate at the bank, helped prepare the article.Thisarticle is on the bank’s website at www.KansasCityFed.org.
5

abroad has varied significantly across assets from different foreigneconomies. Specifically, U.S. investors tend to prefer investing in otherindustrial countries rather than in emerging markets. This pattern haslikely developed because the assets of industrial countries provide abetter hedge during downturns in the U.S. business cycle.
The first section of the article provides an overview of the recenttrends in U.S. investment abroad. The second section discusses a theo-retical framework that sheds light on why diversifying a portfolio withforeign assets can simultaneously increase the average return on invest-ment and reduce the volatility of returns. The third section analyzestrends in the geographic allocation of cross-border investment. It alsoshows that U.S. investors have become more likely to favor investing inother industrial countries. The fourth section investigates the factorsthat could be driving this behavior.
I. RECENT CHANGES IN U.S. FOREIGN INVESTMENT
Since the early 1990s, the U.S. foreign investment position haschanged dramatically, suggesting that home bias may be weakening. Thesechanges can be summarized along three dimensions: the magnitude of thestock of foreign assets held in U.S. portfolios, the composition of invest-ments abroad, and finally the geographic allocation of foreign investment.
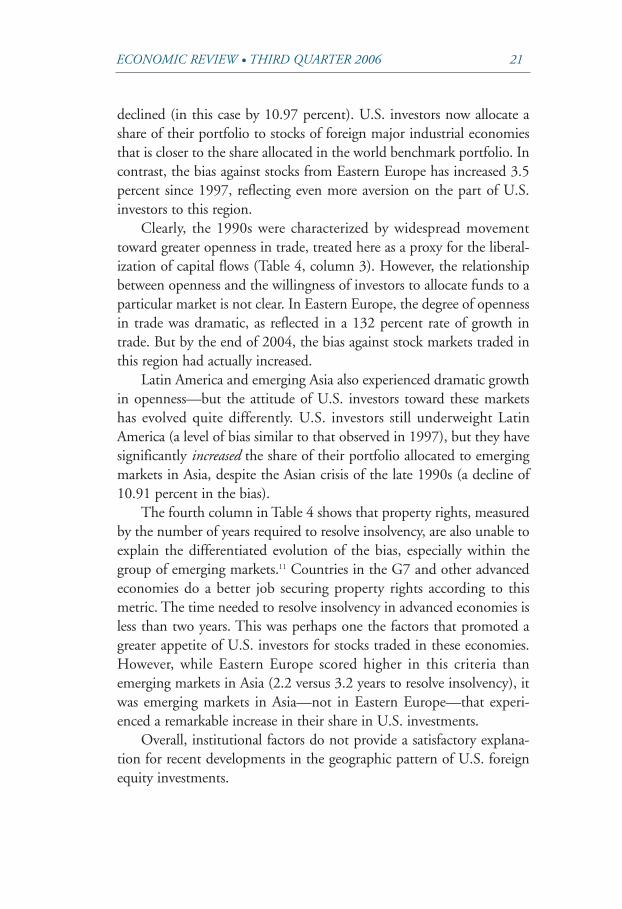
The first dimension, the magnitude of investment abroad, began toevolve significantly more than a decade ago. In the early 1990s, the end-of-the-year market value of all types of foreign investments turnedupward (Chart 1). By 2005, these investments, which range fromforeign direct investment, to stocks and bonds, to government andprivate sector investments, had soared to 89 percent of U.S. GDP.
Of course, the change in investment behavior is due partly to agrowing pool of funds available to fund foreign investment. But thechange also depends on other factors. Specifically, the market value ofthe stock of these assets depends on new flows of investment, on capitalgains (an increase in the price of foreign assets), and on exchange ratemovements. For example, the rising value of the euro has increased thedollar value of assets whose price is denominated in euros. The year-over-year change in the stock of foreign assets partly reflects these
6 FEDERAL RESERVE BANK OF KANSAS CITY
ECONOMIC REVIEW • THIRD QUARTER 2006 7
“valuation adjustments,” which are implicit in their dollar market price.The decline in the foreign asset position of U.S. investments from 1999to 2002 was due in large part to the fall in the price of foreign assets,especially stocks, during that period (Chart 1).
How much of the growth in the stock of foreign assets can beattributed to new flows of investment abroad rather than to asset priceand exchange rate changes? Chart 1 helps answer this question. Thedotted line in the chart shows the evolution of the ratio of U.S. foreignassets to GDP, excluding from the end-of-year position the growth dueto capital gains and to exchange rate fluctuations. The line shows amore gradual increase, confirming that the appreciation of foreign cur-rencies against the dollar and capital gains (especially in the stockmarket) played a role increasing the market value of U.S. investmentabroad. Still, even excluding these factors, a pronounced and steadyincrease in the ratio of foreign assets to GDP appears after 1994. Thus,new flows of investment clearly played a fundamental role in thegrowth of the foreign asset position.
Larger flows of funds being allocated to foreign assets does not nec-essarily imply, however, that the propensity to invest abroad has alsoincreased. The pool of funds available for investment has grown signifi-cantly. In particular, wealth in the United States (measured by
Chart 1U.S. OWNED ASSETS ABROAD HAVE INCREASED WITHAND WITHOUT VALUATION ADJUSTMENTS
30
35
40
45
50
55
60
65
70
75
80
85
90
95
1990 1992 1994 1996 1998 2000 2002 200430
35
40
45
50
55
60
65
70
75
80
85
90
95
U.S. owned assets abroad with valuation adjustments
U.S. owned assets abroad without valuation adjustments
Percent of GDP
Source: Bureau of Economic Analysis

household’s net worth) has increased much faster than GDP in the lastdecade. Hence, a large, and perhaps growing, share of U.S. wealthmight also be flowing to investments in domestic assets.
The evidence shows that the stock of foreign assets abroad has infact outpaced household net worth (Chart 2). From 1982 to the early1990s, both the stock of foreign assets and household net worthroughly doubled. By 1994, however, investment in foreign assets beganto grow substantially faster.
The second dimension of foreign investment is the composition offlows, or the type of foreign assets that U.S. investors purchase. As withmagnitude, significant changes in the composition of investments havealso occurred (Chart 3).
The share of the aggregate composed by U.S. private bank loans,bonds, and other miscellaneous investments in the private sector port-folio of foreign assets declined substantially during the 1980s and1990s.1 This process was in large part due to the decline in importancein U.S. bank loans as a source of financing of foreign institutions.
8 FEDERAL RESERVE BANK OF KANSAS CITY
Chart 2U.S. OWNED ASSETS ABROAD HAVE GROWN FASTERTHAN HOUSEHOLD NET WORTH
0
100
200
300
400
500
600
700
800
900
1000
1100
1200
0
100
200
300
400
500
600
700
800
900
1000
1100
1200
U.S. owned assets abroad
Household net worth
Index (1982=100)
1982 1984 1986 1988 1990 1992 1994 1996 1998 2000 2002 2004
Source: Bureau of Economic Analysis and Board of Govenors of the Federal Reserve System

ECONOMIC REVIEW • THIRD QUARTER 2006 9
Meanwhile, the participation of foreign direct investment (FDI) intotal private investment abroad has been fairly stable. The increase inthe volume of FDI was large, but only sufficient to maintain its share inthe private foreign investment portfolio. By the end of 2005, themarket value of the stock of FDI was more than three times its 1994level, reaching $3.5 trillion, which corresponds to 33 percent of thestock of private foreign investments.
In contrast, investment in the stocks of corporations listed inforeign exchanges has soared. The share of foreign stocks in private-sector foreign assets has more than doubled since the early 1990s,reaching 28 percent by the end of 2005, with a market capitalization ofalmost $3.1 trillion.
The third dimension of foreign investment is geographic alloca-tion, described in Charts 4 and 5. The figures correspond toinvestments in foreign securities (stocks and bonds).2 Most U.S. foreigninvestments in securities are still allocated to European markets, whoseshare in the U.S. securities portfolio grew from 46 to 53 percent (Chart
Chart 3THE COMPOSITION OF PRIVATE U.S. OWNED ASSETSABROAD HAS CHANGED
0
5
10
15
20
25
30
35
40
45
50
55
60
65
70
1982 1984 1986 1988 1990 1992 1994 1996 1998 2000 2002 20040
5
10
15
20
25
30
35
40
45
50
55
60
65
70
U.S. bank loans, bonds and other
Foreign direct investment
Corporate stocks
Percent of private U.S. owned assets abroad
Source: Bureau of Economic Analysis

10 FEDERAL RESERVE BANK OF KANSAS CITY
4). The distribution of U.S. foreign securities holdings by foreign eco-nomic development reveals the growth of the participation of emergingmarkets (Chart 5). The growth was concentrated in emerging marketsin Asia, an issue that will be discussed in greater detail later in thisarticle. The share of advanced economies has not changed much in theperiod 1994-2004 and still corresponds to 80 percent of the U.S. secu-rities portfolio.
II. A FRAMEWORK FOR ANALYSIS OF THE GAINSFROM INTERNATIONAL DIVERSIFICATION
In theory, the growing willingness to invest abroad has allowed U.S.investors to diversify their portfolios, thereby reducing the volatility ofinvestment returns. But in reality, does international diversificationoffer actual gains? And if it does, are U.S. investors exploiting thesepotential gains—or is home bias still inhibiting them despite theincrease in investment abroad?
This section presents a framework to address these questions. Theanalysis will focus on investments in equity markets. As discussedearlier, the growth in the foreign asset position has been in large partfueled by investment in foreign corporate stocks.
When discussing the gains that diversification might achieve, it isimportant to recognize some basic characteristics of investor preferences.Investors naturally prefer high returns, yet they dislike the uncertaintyassociated with the volatility that often accompanies high returns. Ana-lysts argue that investing abroad helps diversify portfolios and hencereduces the volatility of returns, because when some stocks performpoorly, others might be performing well. Foreign stocks are typicallyinfluenced by factors other than those at work in U.S. equity markets. Inshort, the view is that foreign stocks typically depend far less on the upsand downs of the U.S. business cycle.
Given the remarkable increase in the willingness to invest abroadover the last decade, the question remains: Are cross-border equityinvestments helping U.S. investors diversify their portfolios? And, if so,could U.S. investors do even better?

ECONOMIC REVIEW • THIRD QUARTER 2006 11
Chart 4GEOGRAPHIC DISTRIBUTION OF U.S. HOLDINGS OFFOREIGN SECURITIES
Chart 5DISTRIBUTION OF U.S. HOLDINGS OF FOREIGNSECURITIES, BY ECONOMIC DEVELOPMENT
0
10
20
30
40
50
60
Europe Americas Asia Australia and Oceania
Africa InternationalOrganizations
0
10
20
30
40
50
60
1994
2004
Holdings in region as percent of total foreign securities holdings
0
10
20
30
40
50
60
70
80
90
Advanced Economies Caribbean Financial Centers Emerging Markets0
10
20
30
40
50
60
70
80
90
1994
2004
Holdings in region as percent of total foreign securities holdings
Source: United States Treasury International Capital System
Source: United States Treasury International Capital System

12 FEDERAL RESERVE BANK OF KANSAS CITY
Chart 6 helps answer these questions. The elliptical curve in thechart shows the return-volatility trade-off for portfolios holding stocksfrom the United States and other industrialized countries over the pastthree and a half decades.3 The returns are based on the MSCI equityindex for the United States and the MSCI EAFE index, a weightedaggregate of stock market returns of industrial countries in Europe,Australia, and the Far East. Both indexes were prepared by MorganStanley and both measure returns in U.S. dollars.
Each point along the trade-off curve corresponds to a hypotheticalU.S. portfolio comprising a different mix of domestic and foreignstocks. Each portfolio would yield a specific level of average returns andvolatility (as measured by the standard deviation of returns). Forexample, point A in the curve is a hypothetic portfolio comprised exclu-sively of U.S. stocks held from January 1970 until March 2006. Thestocks in portfolio A would have earned an average annual nominalreturn of 10.25 percent, with a volatility of 15.1 percent. Table 1 sum-marizes information on average returns and volatility corresponding toportfolio A and to the remaining portfolios that will be described next.
Moving left, upward, and then right along the curve from point Areflects an increasing share of foreign stocks in the portfolio. Point B, atthe far end of the curve, represents a portfolio comprised exclusively offoreign stocks. From 1970 to 2006, portfolio B would have earned anaverage annual nominal return of 10.74 percent, with a volatility of16.4 percent.
This return-volatility trade-off curve reveals some interestingpoints. A portfolio at point C on the curve would hold 41 percent of itsassets in foreign stocks and would minimize the volatility of returns totheir lowest possible level. In other words, if 41 cents of every dollarinvested in the stock market between 1970 and March 2006 had beenallocated to stocks from foreign industrial countries, the overall returnof these investments would have reached their lowest level of volatility.
The 41 percent share of foreign stocks required to minimize thevolatility of investment returns is much larger than the shares that U.S.investors actually held in 1997 (point D, 8 percent) and in 2004 (pointE, 12 percent).4

ECONOMIC REVIEW • THIRD QUARTER 2006 13
Table 1MEAN AND STANDARD DEVIATION OF STOCKRETURNS, JANUARY 1970-MARCH 2006
Chart 6AVERAGE RETURNS AND VOLATILITY OF RETURNS OFINVESTMENTS IN U.S. STOCKS AND IN FOREIGNINDUSTRIAL COUNTRIES’ STOCKS, 1970-2006
Portfolios Share of Average Standard deviationforeign equity Annualized of returns
(percent) return (percent) (percent)
100% U.S. (point A in Chart 6) 0 10.24 15.12
1997 U.S. stocks allocation (point D) 8 10.28 14.67
2004 U.S. stocks allocation (point E) 12 10.30 14.47
Minimum variance portfolio (point C) 41 10.44 13.78
100% foreign industrial countries(point B) 100 10.74 16.35
Source: Author’s calculations, based on MSCI equity returns available in Datastream
Source: Morgan Stanley MSCI indexes, Datastream, and author’s calculations
10.10
10.15
10.20
10.25
10.30
10.35
10.40
10.45
10.50
10.55
10.60
10.65
10.70
10.75
10.80
13.5 13.75 14 14.25 14.5 14.75 15 15.25 15.5 15.75 16 16.25 16.5
Standard deviation of portfolio returns (percent)
10.10
10.15
10.20
10.25
10.30
10.35
10.40
10.45
10.50
10.55
10.60
10.65
10.70
10.75
10.80
(A) 100% U.S.
(B) 100% Foreign
Mean return (percent)
(D) U.S. portfolio 1996(E) U.S. Portfolio 2004
(C) Minimum variance portfolio

14 FEDERAL RESERVE BANK OF KANSAS CITY
From 1997 to 2004, U.S. investors clearly showed a growing will-ingness to buy foreign stocks. Still, by 2004 home bias remained afeature of U.S. stock investment, a behavior that cannot be explained bymore attractive domestic returns or volatility. As the trade-off curveshows, U.S. investors could have earned higher returns with less volatil-ity by moving along the curve from point E to point C—in otherwords, simply by increasing their share of foreign stocks.
In the absence of home bias, the share of international stocks in theU.S. stock portfolio could have easily been even larger than 41 percent,the point associated with a minimum volatility of returns. Investors aretypically willing to accept more volatile gains, provided that they arecompensated in the form of higher returns. The only factor that wouldjustify an allocation close to the point of minimum volatility would beunrealistically high levels of risk aversion. In fact, using levels of riskaversion typically used in the literature, the share of foreign stocks in theU.S. portfolio should range from 50 to 65 percent.
Some analysts, however, argue that the home bias evident in Chart6 might actually be a sign of rational behavior. The optimal weight offoreign securities in the portfolio reflects data on average returns thatcan vary a lot, depending on the sample being used (Britten-Jones1999). Other authors point out that the uncertainty regarding futurereturns at the moment that investment decisions are made can be con-siderable and the past behavior of stocks can only serve as a rough guideto form expectations about the return-volatility trade-off. They alsosuggest that the large asymmetry of information on domestic and inter-national stocks makes investors’ reluctance to invest abroad appearrational (Ahearne, Griever, and Warnock 2004).
Analysts further argue that when investors purchase stocks of U.S.multinationals with large sales abroad, they are implicitly diversifyingtheir portfolios. In this way, investors increase the share of stocks whosereturn is, at least in principle, less dependent on domestic economicconditions (Cai and Warnock 2006).
The methodology used to construct Chart 6 clearly does not takethese elements into account. These limitations notwithstanding,however, the historical time series of returns and their volatility providesrobust evidence of the benefits of higher portfolio diversification.

ECONOMIC REVIEW • THIRD QUARTER 2006 15
Summing up, the analysis in this section showed that the increasedwillingness of U.S. investors to purchase foreign stocks is a welcome devel-opment: Increasing the share of foreign industrial countries’ stocks (up toa level around 40 percent) can potentially lead to higher average returnsthat would also be less volatile. The evidence shows, however, that homebias in equity investment—that is, the bias against investing in foreignindustrial countries’ equity markets—persists, although it has declined.
The next two sections examine the persistence of the bias and itsevolution across different foreign markets. Section III discusses trendsin the geographic allocation of cross-border equity investment and pro-vides a region-specific measure of the bias in U.S. allocations. SectionIV investigates the factors that could be driving this geographic patternof U.S. foreign stockholdings and the preferences that they reveal.
III. CHANGES IN INVESTMENT BIAS AND THE GEOGRAPHIC PATTERN OF U.S. FOREIGN STOCKHOLDINGS
While home bias in U.S. equity investments has apparently less-ened, it still persists. The reason for this behavior might lie in theevolution of bias toward investments in certain countries or regions ofthe world. This section analyzes recent trends in the geographic alloca-tion of cross-border equity investment. The analysis compares abenchmark portfolio of world stocks to the U.S. portfolio, providing aregion-specific measure of U.S. bias in investment allocation observedby the end of 2004 (the last year for which country-specific data of U.S.foreign investments are available at the time of this writing).5
A benchmark portfolio is one that represents the performance ofthe overall market. The S&P 500, for example, is a benchmark portfo-lio. It represents the performance of stocks of 500 U.S. corporations,representing 80 percent of the total U.S. stock market. The S&P 500returns are measured by an aggregate index, with each stock weightedby its degree of market capitalization—that is, by the amount of sharesoutstanding times the price of each share. A greater market capitaliza-tion gives a company’s stock a greater weight in the index.

16 FEDERAL RESERVE BANK OF KANSAS CITY
The benchmark portfolio also represents the weight investors assignto specific stocks. If investors believe a stock will perform poorly, theymay decide to underweight the stock—or allocate a smaller share oftheir portfolio to this stock—compared to the S&P 500 benchmark.The same type of reasoning reveals the geographic pattern of foreignstockholdings in U.S. investments. The U.S. domestic and interna-tional equity allocation can be thought of as an investment strategy,which possibly deviates from the world benchmark portfolio. In thiscontext, the world benchmark portfolio represents the performance andallocation of the world stock market, just as the S&P 500 benchmarkrepresents the U.S. stock market. The larger the market capitalization ofa country’s stock market, the higher the weight of that market in theworld index. The MSCI world stock market composite is such a bench-mark index.
As with the S&P 500, the world benchmark portfolio reveals theweights assigned to each of its components—in this case, to eachcountry’s stock market. The weights are also given by the share of eachcomponent in the total market capitalization. For instance, by the endof 2004, the stock market in the UK represented almost 8 percent ofthe world capitalization. That is, for each dollar invested in stockmarkets across the globe, 8 cents were allocated to UK stocks. In con-trast, U.S. investors underweighted the UK market by choosing toallocate only 3 percent of every dollar to UK investments.
In Table 2, the extent to which U.S. investors underweight foreignstocks is summarized by grouping individual foreign stock markets bythe level of economic development of the economies to which theybelong.6 The group of emerging markets is further classified accordingto geographic origin (Table 3). Table 2 shows, for instance, that whilethe world as a whole allocated to major industrial countries (excludingthe U.S.) 31 cents of every dollar invested in the world stock market(column B), U.S. investors allocated to this same group of countriesonly 8 cents of each dollar they invested in stocks (column A).
In fact, U.S. investors continue to underweight all the entire port-folio of foreign stocks, a consequence of home bias in investmentdecisions. By the end of 2004, for every dollar allocated by U.S.investors in stock markets, 84 cents were invested in the domesticmarket (column A, Table 2). In contrast, the world as a whole invested

ECONOMIC REVIEW • THIRD QUARTER 2006 17
Reg
ion
(A)
(B)
Shar
e in
U.S
.Sh
are
in w
orld
(C)
= (A
)/(B
)eq
uity
por
tfol
iom
arke
t ca
pita
lizat
ion
Rel
ativ
e w
eigh
t in
B
ias
= 1-
(C)
Bia
s(p
erce
nt, e
nd o
f 20
04)
(per
cent
, end
of
2004
)U
.S. p
ortf
olio
(200
4)(1
997)
Uni
ted
Stat
es83
.56
42.4
71.
97
Maj
or f
orei
gn in
dust
rial
cou
ntri
es8.
4331
.22
0.27
0.73
0.82
Oth
er a
dvan
ced
econ
omie
s4.
1614
.05
0.30
0.70
0.76
Lati
n A
mer
ica
0.55
1.99
0.28
0.72
0.72
Em
ergi
ng A
sia
1.01
5.87
0.17
0.83
0.93
Eas
tern
Eur
ope
0.13
1.08
0.12
0.88
0.85
Oth
er d
evel
opin
g co
untr
ies
0.18
1.07
0.17
0.83
0.90
Sour
ces:
Uni
ted
Stat
es T
reas
ury
Inte
rnat
iona
l Cap
ital
Sys
tem
; Blo
ombe
rg; A
hear
ne, G
riev
er, a
nd W
arno
ck (
2004
)
Tabl
e 2
DIS
TR
IBU
TIO
N O
F U
.S. E
QU
ITY
PO
RT
FOLI
O, B
EN
CH
MA
RK
WO
RLD
ALL
OC
ATIO
N,
AN
D T
HE
BIA
S IN
U.S
. IN
VE
STM
EN
TS

18 FEDERAL RESERVE BANK OF KANSAS CITY
only 42 cents of every dollar in the U.S. stock market (column B, Table2). Interestingly, the analysis in the previous section showed that, underreasonable assumptions regarding risk aversion, the share of domesticstocks in the U.S portfolio should be around 40 percent. The actualweight of the domestic market in the U.S. portfolio is more thandouble that. Thus, it appears safe to say that home bias continues toinfluence U.S. investment decisions.
A natural measure of bias can be constructed based on the figures inTable 2.7 The first step is to compute the relative weight of a givenforeign market in the U.S. portfolio by dividing the weight in the U.S.portfolio (column A) by the weight in the world portfolio (column B).The relative weight is displayed in column C. The bias is described bythe following expression:
Table 3COUNTRIES INCLUDED IN GROUP CLASSIFICATIONSOF FOREIGN STOCK MARKETS USED IN TABLES 2, 4,AND 5
Major foreign industrial countries Emerging markets:Canada Latin AmericaFrance ArgentinaGermany BrazilItaly ChileJapan MexicoUnited Kingdom PeruOther advanced economies VenezuelaAustralia Emerging AsiaAustria ChinaBelgium IndiaDenmark IndonesiaFinland KoreaHong Kong MalaysiaIreland PhilippinesIsrael TaiwanNetherlands ThailandNew Zealand Eastern EuropeNorway Czech RepublicPortugal HungarySingapore PolandSpain RussiaSweden Other developing countriesSwitzerland Egypt
South Africa Turkey
Note: The sum of the capitalization of the U.S stock market and of the stock market of the countries listed abovecorresponds to 97 percent of the world stock market capitalization.
Bias =1-Share of foreign stock market in U.S. portfolio
Share of foreign stock market in world market capitalization

ECONOMIC REVIEW • THIRD QUARTER 2006 19
By definition, bias is zero when the share of a given regional stockmarket in the U.S. portfolio is equal to its share or weight in the worldmarket capitalization. The closer this indicator is to one, the larger thebias will be. In the U.S. stock market, the formula produces a negativenumber for U.S. stocks, -0.97, or a negative bias. In other words, U.S.investment still displays home bias because it favors domestic stocks.
The results regarding the levels of bias in 1997 and 2004 revealsome interesting features.8 As the table shows, the bias in U.S. equityinvestment overall clearly declined from 1997 to 2004. There is,however, a clear geographic pattern in the evolution of the bias, andinvestors have become even more reluctant to invest in certain foreignregions. Major industrial countries experienced the greatest percentagedecline in bias (-10.97 percent), followed closely by the Asian emergingmarkets (-10.91). In contrast, the bias toward stocks in Latin Americaremained constant, and the bias toward stocks in Eastern Europeincreased by 3.5 percent.9
In short, bias in U.S. investment has declined with respect to someregions but not to others. The next obvious question is, why?
IV. DETERMINANTS OF THE GEOGRAPHIC PATTERNOF U.S. INTERNATIONAL EQUITY INVESTMENT
This section examines three factors that can potentially explain whyU.S. investors have become more inclined to invest in some foreignmarkets but not others. The first factor is a broad category of institu-tional elements, ranging from regulatory issues to property rights. Thesecond factor is the level of returns provided by foreign markets. Thethird factor is the opportunity of risk diversification, or the extent towhich certain foreign stocks can be seen as a good hedge against adversefluctuations in the domestic business cycle. Diversifying risks has likelyplayed a key role in changing the geographic pattern of U.S. invest-ments in foreign stocks.

20 FEDERAL RESERVE BANK OF KANSAS CITY
The influence of institutional factors
Institutional factors can be broadly defined as the set of issues thatcharacterize a business environment. They relate to the regulatoryframework and law enforcement, and how the two react with oneanother. As U.S. foreign equity investment surged during the 1990s,institutional factors in many foreign economies were also changing dra-matically—suggesting a potential link between the two trends.
Two elements were especially important in the evolution of institu-tional factors during the 1990s. First, many countries liberalized capitalflows. Some countries significantly eased restrictions caused by taxationand limits on repatriation of capital. Many countries cut restrictions onforeign ownership of companies operating in sectors previously consid-ered “strategic,” such as mining, energy, and telecommunications. Untilrecently, strategic sectors could only receive investments funded bydomestic capital.
The second important institutional factor is property rights. Theyinfluence capital flows through a set of rules that secure the privateownership of assets and that guide a lawful and efficient resolution ofbusiness issues such as insolvency. Property rights have been improvingsteadily in many emerging markets, particularly in economies that havebeen moving toward market-oriented economic systems.
Measuring the degree of capital liberalization and of property rightsis not a straightforward task due to data limitations and the lack of con-sensus regarding a methodology to measure these variables. Thisanalysis uses the degree of openness in trade as a proxy for the highermobility of capital flows (Penn World Tables). The analysis uses WorldBank data on the number of years required to resolve insolvency as aproxy for property rights. Resolving insolvency begins with filing forinsolvency in court and ends with the resolution of distressed assets.10
Is there a link between these institutional factors and changes inU.S. investment bias? In other words, are changing institutional factorspartly responsible for the tendency of U.S. investors to change the waythey weight a given foreign market? Table 4 sheds light on the issue.The second column in the table reports the percentage change in thebias of U.S. equity investments from 1997 to 2004. A negative number,as in the case of major industrial economies, means the bias has
ECONOMIC REVIEW • THIRD QUARTER 2006 21
declined (in this case by 10.97 percent). U.S. investors now allocate ashare of their portfolio to stocks of foreign major industrial economiesthat is closer to the share allocated in the world benchmark portfolio. Incontrast, the bias against stocks from Eastern Europe has increased 3.5percent since 1997, reflecting even more aversion on the part of U.S.investors to this region.
Clearly, the 1990s were characterized by widespread movementtoward greater openness in trade, treated here as a proxy for the liberal-ization of capital flows (Table 4, column 3). However, the relationshipbetween openness and the willingness of investors to allocate funds to aparticular market is not clear. In Eastern Europe, the degree of opennessin trade was dramatic, as reflected in a 132 percent rate of growth intrade. But by the end of 2004, the bias against stock markets traded inthis region had actually increased.
Latin America and emerging Asia also experienced dramatic growthin openness—but the attitude of U.S. investors toward these marketshas evolved quite differently. U.S. investors still underweight LatinAmerica (a level of bias similar to that observed in 1997), but they havesignificantly increased the share of their portfolio allocated to emergingmarkets in Asia, despite the Asian crisis of the late 1990s (a decline of10.91 percent in the bias).
The fourth column in Table 4 shows that property rights, measuredby the number of years required to resolve insolvency, are also unable toexplain the differentiated evolution of the bias, especially within thegroup of emerging markets.11 Countries in the G7 and other advancedeconomies do a better job securing property rights according to thismetric. The time needed to resolve insolvency in advanced economies isless than two years. This was perhaps one the factors that promoted agreater appetite of U.S. investors for stocks traded in these economies.However, while Eastern Europe scored higher in this criteria thanemerging markets in Asia (2.2 versus 3.2 years to resolve insolvency), itwas emerging markets in Asia—not in Eastern Europe—that experi-enced a remarkable increase in their share in U.S. investments.
Overall, institutional factors do not provide a satisfactory explana-tion for recent developments in the geographic pattern of U.S. foreignequity investments.

22 FEDERAL RESERVE BANK OF KANSAS CITY
The role of returns
A second factor might shed light on this issue—the level of returnsof foreign stocks. In principle, markets offering higher average returnsare more attractive than other markets and thus might explain thegreater success of certain foreign markets in attracting U.S. capital.12
However, as discussed in Section II, in addition to caring aboutexpected gains, investors are also wary of the volatility of returns.
Ideally, this analysis should focus on an indicator that takes intoaccount both elements—the level of returns and their volatility. TheSharpe ratio is an indicator of expected returns, which is frequentlyused in investment analysis to compare the performance of portfolios.The Sharpe ratio is defined as the expected return R in excess of thereturn Rf , which would be earned by investing in a safe, risk-free asset,for each percentage point of the total return volatility σ:
In this analysis, a country-specific Sharpe ratio for stock marketreturns is computed using average returns as a proxy for expectedreturns. The average U.S. federal funds effective rate is used as a proxyfor the risk free rate Rf . Stock market returns are based on the MSCIindex that includes reinvested dividends, and the computation uses
Table 4CHANGE IN BIAS AND INSTITUTIONAL FACTORS
Region Change in bias between Change in Time to resolve1997 and 2004 openness during 1990’s insolvency in
(percent) (percent) 2004 (years)
Major foreign industrial countries -10.97 19.94 1.0
Other advanced economies -7.37 31.30 1.8
Latin America 0.42 45.76 6.1
Emerging Asia -10.91 53.84 3.2
Eastern Europe 3.50 132.10 2.2
Other developing countries -7.82 37.21 2.4
Sources: Penn World Tables, World Bank, and author’s calculations
Sr=R-R f
σ

ECONOMIC REVIEW • THIRD QUARTER 2006 23
monthly data corresponding to the period from January 1993 toDecember 2004. The focus on this more recent sample allows the use ofMSCI data on emerging market returns. The regional Sharpe ratio is aweighted average of each country’s stock market Sharpe ratio.13
If returns drive investment allocations, then one would expect toobserve a decline in the bias toward those regions with a higher Sharperatio. In other words, everything else equal, higher returns (adjusted fortheir volatility) would lead U.S. investors to increase the weight of thatparticular regional stock market in their portfolio. However, there is noconclusive evidence on the influence of these volatility-adjusted expectedreturns, as captured by the Sharpe ratio. The second and third columnsin Table 5 illustrate this point. The second column reproduces the levelof change in the bias in investment allocations, and the third columndisplays the Sharpe ratio corresponding to each group of countries.
It is clear that a high Sharpe ratio might have played a role in thedecline in the bias toward stocks of the other advanced economies: Thebias declined by 7.4 percent, and investors were rewarded with thehighest Sharpe ratio in the sample during the period (equal to 0.4).Emerging markets in Asia, however, provide a remarkable counterexample. U.S. investors increased their exposure to stocks traded in thisregion (resulting in a decline in the bias of 10.9 percent) but were notrewarded with higher returns. They extracted on average a negative
Table 5CHANGE IN BIAS, RETURNS, AND RISK
Region Change in bias between Return adjusted1997 and 2004 for volatility
(percent) (Sharpe ratio) Betas
Major foreign industrial countries -10.97 0.21 1.01
Other advanced economies -7.37 0.40 1.06
Latin America 0.42 0.19 1.38
Emerging Asia -10.91 -0.07 1.06
Eastern Europe 3.50 0.24 1.84
Other developing countries -7.82 0.28 1.18
Source: Author’s calculations

24 FEDERAL RESERVE BANK OF KANSAS CITY
excess return (Sharpe ratio equal to -0.07). In fact, they would havebeen better off investing in a risk-free asset with a certain return equalto the effective federal funds rate.
The way the Sharpe ratio is constructed might explain its failure toprovide a clear diagnostic of the role played by returns. The statistics aresupposed to capture expected returns, whereas average observed returnsare being used as a proxy. Therefore, this indicator is only a rough guidefor investors’ expectations at the beginning of the period under consid-eration, 1993-2004. However, by 2004 a vast amount of newinformation had been revealed. For instance, the Asian crisis hadalready occurred. The data show that even after taking this informationinto account, U.S. investors were still willing to increase the stocks ofemerging Asia in their portfolio.
There is yet another issue that might shed light on the limitedability of the Sharpe ratio to explain the evolution of regional prefer-ences in investment allocation. Stock markets in major foreignindustrial economies and in Eastern Europe have delivered similarreturns adjusted by the volatility (they have roughly identical Sharperatios). However, investor perceptions about these markets might stillbe fundamentally different. The issue is that stock markets in EasternEurope are likely considered more risky, but this aspect is not being cap-tured by the data on average observed returns used to construct theSharpe ratio. Specifically, investors might have anticipated that EasternEuropean markets would perform poorly—worse than stocks in majorindustrial countries—precisely during downturns in the U.S. businesscycle. The objective of risk diversification might be playing a role in thedifferentiated preferences of U.S. investors toward assets in industrialcountries and in emerging markets.
Summing up, neither institutional factors nor returns, as measuredby the Sharpe ratio, can tell us why bias in U.S. investment has declinedfor some regions but not for others. A more compelling explanationmay lie in risk diversification.

ECONOMIC REVIEW • THIRD QUARTER 2006 25
The importance of risk diversification
A third factor that could be driving the geographic pattern in U.S.foreign equity allocations is risk diversification. One would expect thatthe more important risk diversification is in investor behavior, the moreattractive less risky assets will seem. Put differently, assets are more attrac-tive to risk-averse investors if they are perceived as a good hedge againstthe consequences of adverse business cycle fluctuations. Therefore, oneshould observe a decline in the bias—and an increase in the weight in theU.S. portfolio—toward stock markets that offer such protection.
To understand the role of risk diversification, it is useful to returnto the concept of a benchmark world portfolio, which was discussed inSection III. In this benchmark, the weight received by the stock marketin each individual country is precisely its share in the world market cap-italization. The returns of this world portfolio can be measured by theMSCI world stock market index.14 As in the case of the benchmarkmarket returns captured by the S&P 500, the returns on this worldbenchmark portfolio are uncertain. Hence, even in the case of this fullydiversified portfolio, there is some risk exposure because returns can benegatively affected during bad times in the world economy.
The crucial point is that some foreign stock markets are riskier thanthe world benchmark portfolio. These riskier markets will still attractfunds from investors who are less risk averse and who design theirinvestment strategy to “beat” the market. Alternatively, more risk-averseinvestors will underweight risky assets and increase the share of saferassets in their portfolio.
To investigate whether the distinction between risky and safer assetscan explain the geographic pattern in the growth of U.S. foreign stocks,it is necessary to look at indicators that measure the amount of risk ineach foreign stock market. This can be accomplished by examiningexcess returns—that is, that part of the return that is above the return ofa safe, risk-free asset—which can be interpreted as a compensation forrisk. The riskier the asset, the larger is the expected return or compensa-tion from holding that asset.
A relative measure of risk can then be devised by looking at therelationship between an individual market’s excess returns and theexcess returns in the world benchmark portfolio. For instance, if the

26 FEDERAL RESERVE BANK OF KANSAS CITY
excess return of an individual market is, on average, twice that of theworld benchmark, then we can say that investors in that particularmarket are exposed to twice as much risk.
The factor that scales the amount of risk is what financial analystscall the beta of the asset or of a given equity market.15 A beta equal toone means that by investing in a particular foreign stock marketinvestors are exposed to the same amount of risk they would face byspreading their investments across a variety of markets, assigning thesame weights as in the world benchmark allocation. A beta higher thanone means that investors are deviating from the fully diversified bench-mark and thus are exposing themselves to more risk by investing in thatgiven market.
The betas of each country’s stock market i are calculated by runningthe following ordinary least squares regression of the country-specificstock market return on the world stock market return (in both casessubtracting the risk-free rate):
R i,t - R f,t = αi + βi (RWt - Rf,t ) + εi,t ,
where εi,t is a random term with mean zero and uncorrelated with theworld excess return RW
t - R f,t . With each country-specific beta in hand,weighted group-specific averages are computed and results are providedin column 4 of Table 5.
If risk diversification is an important factor driving investmentdecisions, then one would expect that the willingness to invest abroadshould become particularly strong toward those markets with lowerbetas. A decline in the bias toward these safer markets should beobserved. In fact, the data suggest a relationship between the evolutionof the geographic bias and the level of betas, precisely along the linesdescribed above. Specifically, the decline in the bias in U.S. investmentwas typically observed in those foreign stock markets with low quanti-ties of risk or low betas.
There are some interesting points regarding the group-specific betas,as reported in column 4, Table 5. The betas of the groups of majorforeign industrial countries (= 1.01), other advanced economies (= 1.06)and emerging Asia (= 1.06) are very close to one and in fact are not sta-tistically significantly different than one. Therefore, by investing in thesethree markets, U.S. investors are achieving levels of risk diversificationsimilar to that of the world benchmark, a fully diversified portfolio.

ECONOMIC REVIEW • THIRD QUARTER 2006 27
These results corroborate the interpretation that investors will favorforeign equity markets that offer better opportunities of risk diversifica-tion, captured by low betas. In particular, the findings provide at least apartial explanation for the conclusion that U.S. investors have increasedthe weight of Asian emerging markets in their portfolio, despite disap-pointing returns up to 2004. In the 1993-2004 period, the returns ofthese stocks were quite volatile but not exceptionally risky. They did nottend to perform more poorly than the global market as a whole duringbad times of the world economy, precisely what is being captured by alow beta.
In contrast, regions like Latin America and especially EasternEurope have very large betas (1.38 and 1.84, respectively). Investingexclusively in each of these regions’ stock markets would be an invest-ment strategy that is significantly riskier than diversifying according tothe world benchmark portfolio. This feature provides some rationale forthe evolution in the bias in U.S. investment toward these regions.Investors have either maintained the extent to which they underweightstocks (Latin America) or have decreased even further the share of thesestocks in their foreign investment (Eastern Europe, an increase of 3.5percent of the bias).
Summing up, the bias in U.S. foreign stockholdings—the extent towhich the U.S. portfolio underweights foreign stocks—has declined forforeign markets that offer better opportunities of risk diversification,specifically for countries in the G7, other advanced economies, andAsian emerging markets. Thus, risk diversification may well explain theincreased shares of major industrial countries, advanced economies, andemerging Asia stocks in the U.S. portfolio of foreign equity—as well asthe decline in bias toward these groups of countries.
V. CONCLUSIONS
This article discussed the recent trends in U.S. investment abroad,focusing on its fastest growing category, investments in foreign corpo-rate stocks. Despite the increased willingness to invest in foreign assets,U.S. investors continue to underweight foreign stocks in their portfolio.Thus, there is still a bias against investing abroad. While home bias isnot necessarily a sign of irrational behavior, strong empirical evidencesuggests that investors would benefit from a further decline in bias. The

28 FEDERAL RESERVE BANK OF KANSAS CITY
past performance of both domestic and foreign stock markets indicatesthat greater international portfolio diversification can lead to higheraverage returns that are less volatile.
Overall, the bias toward foreign markets has declined. But in somecases bias has remained stable (Latin America) or become even stronger(Eastern Europe). This article analyzed several factors that could helpexplain investor preferences and why their evolution has not beenuniform across different regions.
Neither institutional factors nor the level of returns shed much lighton the issue. Rather, the explanation seems related to the objective ofdiversifying risks. The recent trends in the geographic allocation of U.S.foreign equity investment can be at least partly explained by investorssearching for assets that provide a good hedge against adverse turns inthe U.S. business cycle. The empirical investigation showed that theforeign markets that offer better opportunities for risk diversification arein three economic regions of the world: major industrial countries (G7),other advanced economies, and emerging Asian markets.
It is perhaps a little surprising that foreign industrial economies areamong those gaining the favor of U.S. investors because they providegood opportunities of risk diversification. After all, the business cyclesof these countries are more synchronized with the U.S. business cyclethan those of emerging markets. Hence, during bad times in the U.Seconomy, stock markets in other industrial countries would most likelyalso perform poorly—and thus would not function properly as a hedgeagainst adverse fluctuations in income.
The data show, however, that stock markets in industrial countriesare quite resilient to adverse turns in the U.S. and world business cycles.More precisely, their relative performance during these events is betterthan that of emerging markets. In that sense, industrial countries assetsdo provide good opportunities for risk diversification.
These observations leave an open question: Why do emergingmarkets, despite their more differentiated economies, contribute less torisk diversification? The explanation could lie on the insufficient level ofdevelopment of their domestic capital market. Or perhaps investorsregard these assets as a source of short-term gain—hence their returnsare negatively affected by the intrinsic volatility of capital flows to theseregions. These issues deserve further research.

ECONOMIC REVIEW • THIRD QUARTER 2006 29
APPENDIX
TABLE A.1 - COUNTRIES INCLUDED IN GEOGRAPHICREGIONS IN CHART 4AfricaAlgeriaAngolaAscension IslandBeninBotswanaBurkinaBurundiCameroonCape VerdeCentral African RepublicChadComorosCongo (Brazzaville)Congo (Kinshasa)Cote d'IvoireDjiboutiEgyptEquatorial GuineaEritreaEthiopiaGabonGambiaGhanaGuineaGuinea-BissauKenyaLesothoLiberiaLibyaMadagascarMalawiMaliMauritaniaMauritiusMoroccoMozambiqueNamibiaNiger NigeriaReunionRwandaSao Tome and PrincipeSenegalSeychellesSierra LeoneSomaliaSouth AfricaSt. HelenaSudanSwazilandTanzaniaTogoTristan da Cunha IslandTunisiaUgandaWestern SaharaZambiaZimbabwe
AsiaAfghanistanBahrainBangladeshBhutanBruneiBurmaCambodiaChinaEast TimorHong KongIndiaIndonesiaIran IraqIsraelJapanJordanKoreaKuwaitLaosLebanonMacauMalaysiaMaldivesMongoliaNepalNorth KoreaOmanPakistanPhilippinesQatarSaudi ArabiaSingaporeSri LankaSyriaTaiwanThailandUnited Arab EmiratesVietnamYemen
Australia and OceaniaAustraliaBritish Indian Ocean Territory
Federated States of Micronesia
FijiFrench PolynesiaKiribatiMarshall IslandsNauruNew CaledoniaNew ZealandPalauPapua New GuineaSamoaSolomon Islands
St. Pierre and MiquelonTongaTuvaluVanuatu
AmericasCanada
CaribbeanAnguillaAntigua and BarbudaArubaBahamas BarbadosBermudaBritish Virgin IslandsCayman IslandsCubaDominicaDominican RepublicFrench GuianaFrench West IndiesGrenadaHaitiJamaicaMontserratNetherlands AntillesSt. Kitts and NevisSt. LuciaSt. Vincent and theGrenadinesTrinidad and TobagoTurks and Caicos Islands
Central AmericaBelizeCosta RicaEl SalvadorGuatemalaHondurasMexicoNicaraguaPanama
South AmericaArgentinaBoliviaBrazilChile ColombiaEcuadorFalkland IslandsGuyanaParaguayPeruSurinameUruguayVenezuela
EuropeAlbaniaArmeniaAustriaAzerbaijanBelarusBelgiumBosnia and HerzegovinaBulgariaChannel Islands and Isleof ManCroatiaCyprusCzech RepublicDenmarkEstoniaFinlandFranceGeorgiaGermanyGibraltarGreece Hungary IcelandIrelandItalyKazakhstanKyrgyzstanLatviaLithuaniaLuxembourgMacedoniaMaltaMoldovaMonacoNetherlandsNorwayPoland PortugalRomaniaRussiaSerbia and MontenegroSlovakiaSloveniaSpainSwedenSwitzerlandTajikistanTurkeyTurkmenistanUkraineUnited KingdomUzbekistanVatican City
Note: Geographic regions are defined by the U.S. Treasury International Capital System.

30 FEDERAL RESERVE BANK OF KANSAS CITY
APPENDIX (cont.)
Table A.2 COUNTRIES INCLUDED IN REGIONS BY ECONOMICDEVELOPMENT IN CHART 5
Advanced economies Caribbean financial centersAustralia Italy BahamasAustria Japan BermudaBelgium Luxembourg British Virgin IslandsCanada Netherlands Cayman IslandsDenmark New Zealand Netherlands AntillesFinland Norway PanamaFrance SingaporeGermany Spain Emerging marketsHong Kong Sweden All other countries for which data is availableIceland SwitzerlandIreland United Kingdom
Note: Cyprus, Greece, Israel, Portugal, South Korea, and Taiwan are included in advanced economies in2004, as defined by the U.S. Treasury International Capital System.

ECONOMIC REVIEW • THIRD QUARTER 2006 31
ENDNOTES
1By the end of 2004, private investment corresponded to 97 percent of thetotal U.S. foreign asset position.
2The countries included in each classification are listed in the appendix,Tables A.1 and A.2. A detailed description of cross-border investment in securi-ties is available in Bertaut and Griever (2004).
3Lewis (1999) uses this methodology to examine home bias in equity invest-ment using data that cover the period 1970-96.
4Notice that the average share of foreign stocks in the U.S. portfolio since 1970is probably even lower than 12 percent, since investment in foreign stocks displayedsluggish growth until the 1990s. The computation of the actual average share is notpossible due to lack of historic data on regional investment allocations.
5Karolyi and Stulz (2003) discuss the theoretical framework that underliesthis approach.
6For example, in Table 2 the group of “major industrial countries” is the G7,excluding the U.S. The corresponding regional market capitalization—which bythe end of 2004 reached 31 percent of the world market capitalization—is thesum of the market capitalization of Canada, France, Germany, Italy, Japan, andthe UK. Likewise, the amount of funds that U.S. investors allocate to this groupof countries is the sum of each individual country’s volume of U.S. investment intheir stock market. The same methodology is used for the other regions.
7A similar approach is followed by Swiston (2005).8The source of data for bias in 1997 is Ahearne, Griever, and Warnock
(2004), who use the same methodology to compute the bias.9Interestingly, by 2004 the level of bias toward stock markets in major for-
eign industrial countries (G7 excluding U.S.) was still larger than the bias towardemerging markets. In other words, according to this metric U.S. investors stillunderweight stocks in major foreign industrial countries by a larger amount thanthey underweight emerging market’s stocks.
10These statistics are weighted averages of data for individual countries. Theweights are given by the share of each country in the market capitalization of theregion to which it belongs.
11Data refer to 2004. Ideally, the change in the quality of property rightswould be presented, but lack of time series data prevented this calculation.
12Bohn and Tesar (1996) investigate this issue.13As in the case of institutional factors, the country weights are given by the
share of each country in the market capitalization of the region to which it belongs.14As explained before, this index is constructed as a weighted average of indi-
vidual market returns, with stock markets with larger market capitalization (relativeto the world capitalization) receiving a larger weight.
15For a detailed derivation and discussion of assets’ betas, refer to Cochrane (2001).

32 FEDERAL RESERVE BANK OF KANSAS CITY
REFERENCES
Ahearne, A., Griever, W., and F. Warnock. 2004. “Information Costs and HomeBias: An Analysis of U.S. Holdings of Foreign Equities,” Journal ofInternational Economics 62, pp. 313-36.
Bertaut, C., and W. Griever. 2004. “Recent Developments in Cross-BorderInvestment in Securities,” Federal Reserve Bulletin, Winter.
Bohn, H., and L. Tesar. 1996. “U.S. Equity Investment in Foreign Markets:Portfolio Rebalancing or Return Chasing?” American Economic Review: Papersand Proceedings, May, pp. 77-81.
Britten-Jones, M. 1999. “The Sampling Error in Estimates of Mean-VarianceEfficient Portfolio Weights,” Journal of Finance 54, pp. 655 -71.
Cai, F., and F. Warnock. 2006. “International Diversification at Home andAbroad,” NBER Working Paper Series no. 12220, May.
Cochrane, J. H. 2001. Asset Pricing. Princeton University Press: Princeton, New Jersey.Karolyi, G.A., and R. Stulz. 2003. “Are Financial Assets Priced Locally or
Globally?” in Handbook of Economics of Finance, G. Constantinides, M.Harris, and R. Stulz, eds. North-Holland, Amsterdam.
Lewis, K. 1999. “Trying to Explain Home Bias in Equities and Consumption,”Journal of Economic Literature 37, pp. 571-608.
Swiston, A. 2005. “A Global View of the U.S. Investment Position,” IMF WorkingPaper 181.