Embed Size (px)
Citation preview

Going from data to analysisGoing from data to analysis
Dr. Nancy Mayo

Getting it rightGetting it right
Research is about getting the right Research is about getting the right answer, not just an answeranswer, not just an answer
An answer is easyAn answer is easy
The right answer is hard to findThe right answer is hard to find

© Nancy E. Mayo© Nancy E. Mayo
Types of QuestionsTypes of Questions
About hypothesesAbout hypothesesIs treatment A better than treatment B?Is treatment A better than treatment B?
Answer: Yes or NoAnswer: Yes or No
About parameters About parameters What is the extent to which treatment A improves What is the extent to which treatment A improves outcome in comparison to treatment B?outcome in comparison to treatment B?
Answer: A number / value (parameter)Answer: A number / value (parameter)

Research is about relationshipsResearch is about relationships
Links one variable or factor to anotherLinks one variable or factor to another
One is thought or supposed One is thought or supposed (hypothesized) to be the “cause” of the (hypothesized) to be the “cause” of the second variablesecond variable

What’s in a name?What’s in a name?
Discipline Cause Effect
Epidemiology Exposure Outcome
Medical/clinical Risk factor Disease
Psychology Independent Dependent
Statistical Stimulus Response
Mathematical X y

Why do I need statistics?Why do I need statistics?
Reduce dataReduce data
Define relationshipsDefine relationships
Make inferences from your sample to Make inferences from your sample to the populationthe population

61103120112311111211111112121111222 62102231222221222221211122233333333 63203229112221122111111111111121111 64103241111111133111111111121122233 65203220111331332312211112111121212 66214141122321321221221211221122232 67103241111111111111111111122911123 68103220111211111111111111111111111 69203220121321324421113412342244213 70102241122211232111121111222222333 71202431111111133311111111111111111 72103141111311122211111111133332232 73113120111321111111111111111113312 74203441133421422212233313441244443 75104341111211112211121211311113223 76202441111111111211111111131114224 77202141112421311213411211131111113 78103220111111122111112111221111222 79112240221221211211111112221111121 80113241111411244121111111211111234 81112120211111111111111111133323334 82101120111111111111191111111111111 83102320211221122111111212132333942

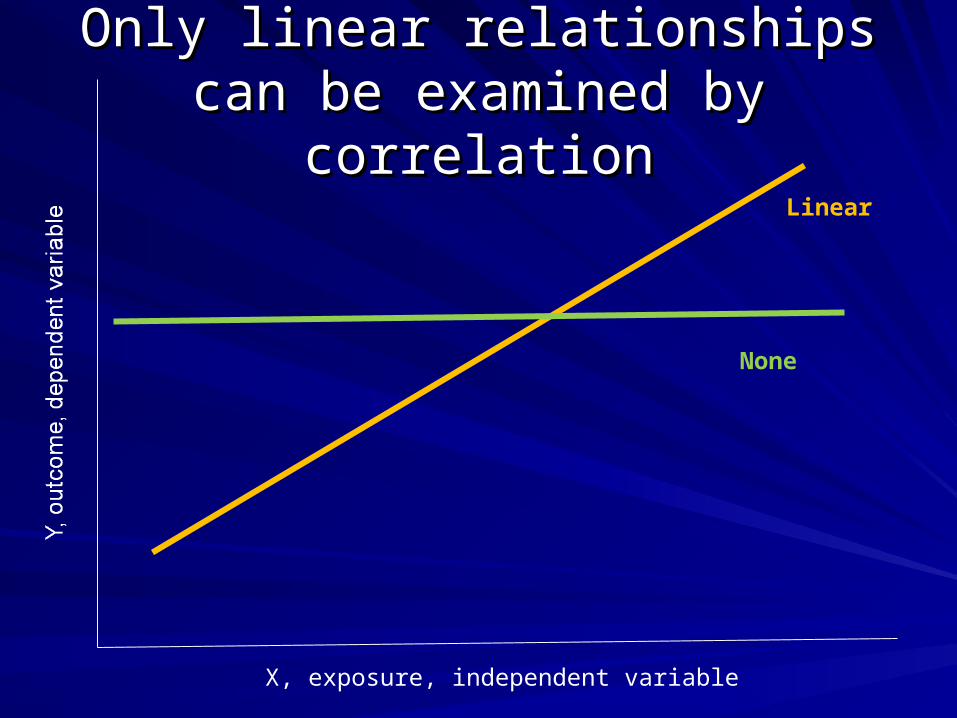
X, exposure, independent variable
Linear
None

X, exposure, independent variable
Linear
None
X, exposure, independent variable
Linear
None
Only linear relationships can be Only linear relationships can be examined by correlationexamined by correlation

©Nancy E. Mayo 2004©Nancy E. Mayo 2004
PopulationTarget
Available
Inference from Sample to Population
Sample
Need stats

What kind of statistics do I What kind of statistics do I need?need?

Depends on your DATADepends on your DATA
MeasuredMeasured
CountedCounted

Only 2 kinds of dataOnly 2 kinds of data
Measured = ContinuousMeasured = Continuous– can take on any value the precision of which depends can take on any value the precision of which depends
upon the calibration of your measurement deviceupon the calibration of your measurement device– Distribution is expected to be normalDistribution is expected to be normal
Counted = Categorical Counted = Categorical (values are fixed) (values are fixed)
– Binary (dichotomous) PolychotomousBinary (dichotomous) Polychotomous– Ordinal Ordinal
ranked (need for assistance)ranked (need for assistance)
interval (categories are equally spaced: falls)interval (categories are equally spaced: falls)
ratio (there is a natural 0 )ratio (there is a natural 0 )
– Nominal – named values, no order (diagnosis)Nominal – named values, no order (diagnosis)

Your JobYour Job
When reading an article (later doing your When reading an article (later doing your own research)own research)
IDENTIFY THESE VARIABLESIDENTIFY THESE VARIABLES
IDENTIFY WHAT SCALE THEY ARE IDENTIFY WHAT SCALE THEY ARE MEASURED ONMEASURED ON
MATCH DATA TO ANALYSISMATCH DATA TO ANALYSIS

Quantitative Research Quantitative Research
The answer to the question is The answer to the question is found in the tables found in the tables

What tables should I find in an What tables should I find in an articlearticle
Table 1 – basic characteristics sample Table 1 – basic characteristics sample
Table 2 – outcomes / exposures Table 2 – outcomes / exposures
Table 3 - answer the main question Table 3 - answer the main question – Relationship between exposure and outcomeRelationship between exposure and outcome
Table 4 – interesting subgroup Table 4 – interesting subgroup

What tables should I find in an What tables should I find in an articlearticle
Table 1 – characteristics of the sample on Table 1 – characteristics of the sample on features relating to target and available features relating to target and available populationpopulation
Table 2 – distribution of the sample on Table 2 – distribution of the sample on exposure and outcome variablesexposure and outcome variables
Table 3 - relationship between the Table 3 - relationship between the exposure and outcomeexposure and outcome
Table 4 – interesting sub-groupsTable 4 – interesting sub-groups

What kind of statistics should What kind of statistics should I find in these Tables?I find in these Tables?

What kind of statistics are What kind of statistics are there?there?
Depends on your DATADepends on your DATA
Depends on your QUESTIONDepends on your QUESTION

DataDataUses Continuous CategoricalReduce Data (Descriptive)
Means (SD) medians (percentiles, range)
Proportions
Define relationships Scatter plot HistogramLinear (Pearson correlation)
Correlation (Spearman ranked )Relative risk
Make inferences(Simple univariate (bivariate)
t-test independentpaired t-test
Chi-square testMcNemar’s test
Multivariate ANOVAmultiple linear regression
Logistic regression

Standard Normal DistributionStandard Normal DistributionShowing the proportion of the population that
lies within 1, 2 and 3 SD (Wikipedia)

QuestionsQuestionsHYPOTHESIS PARAMETER
Question Questions is answered by YES or NO
Question demands a numeric response
Test or parameter Value of the test has no meaning (t-test, F test)
Difference between two means, rate or a risk
Significance P –value (probability that what you observed occurred by chance alone)
95% confidence intervals (with studies of this nature, 95% of the time the mean will lie within this interval)

Uses Continuous CategoricalReduce Data (Descriptive)
Means (SD) medians (percentiles, range)
Proportions
Lets look at Table 1

DataData
Uses Continuous CategoricalDefine relationships Scatter plot Histogram
Linear (Pearson correlation)
Correlation (Spearman ranked )Relative risk
Go to internet: scatter plotGot to internet: histogram

ProbabilityProbability
Degree of likelihood that something will happen. Degree of likelihood that something will happen.
Statistical probabilities are expressed as as Statistical probabilities are expressed as as decimals 0.5, 0.25, 0.75 between 0 and 1. decimals 0.5, 0.25, 0.75 between 0 and 1.
For example, a probability of 0 means that For example, a probability of 0 means that something can never happen; a probability of 1 something can never happen; a probability of 1 means that something will means that something will alwaysalways happen. happen.
The probability of an event is calculated as follows: The probability of an event is calculated as follows: – n favourable outcomes / n of all possible outcomn favourable outcomes / n of all possible outcomeses
The probability of getting heads in one toss is: The probability of getting heads in one toss is: pp(heads) = 1/(1 + 1) = 1⁄2.(heads) = 1/(1 + 1) = 1⁄2.

Statistical probabilityStatistical probability
Probability that what you observed could Probability that what you observed could have occurred by chancehave occurred by chance
Wish that to be a very small numberWish that to be a very small number
By convention: p < 0.05 is considered very By convention: p < 0.05 is considered very unlikely to have occurred by chanceunlikely to have occurred by chance
Means that in studies like this, an Means that in studies like this, an observation this extreme or more extreme observation this extreme or more extreme would occur by chance alone only in 5 of would occur by chance alone only in 5 of 100 studies100 studies

Remember: one study is only a Remember: one study is only a sample sample
Likely to occurred by chance; unlikely to be because of anything that was done in the study
Unlikely to have occurred by chance, the assumption is that it occurred because of something done in the study

When you start a study, there When you start a study, there are risks are risks
Probability that you are one of the yellow Probability that you are one of the yellow studies studies
You conclude that there was an effect when You conclude that there was an effect when there was notthere was not
Type I or alpha errorType I or alpha error
By convention, we set this risk at 5 chances out By convention, we set this risk at 5 chances out of 100 or p=0.05of 100 or p=0.05
Any finding that has a p value associated with it Any finding that has a p value associated with it of <0.05 is considered statistically significant of <0.05 is considered statistically significant (unlikely to have occurred by chance alone)(unlikely to have occurred by chance alone)

CorrelationCorrelation
>0.8 strong>0.8 strong
0.5 to 0.8 moderate0.5 to 0.8 moderate
<0.5 weak <0.5 weak

CorrelationCorrelation
What proportion of outcome is explained What proportion of outcome is explained by the exposure?by the exposure?
ANSWER: rANSWER: r22
r = 0.5 (moderate) rr = 0.5 (moderate) r22 = 0.25 (not much) = 0.25 (not much)
r = 0.9 (strong) rr = 0.9 (strong) r22 = 0.81 (still a lot) = 0.81 (still a lot)
r = 0.3 (weak) rr = 0.3 (weak) r22 = 0.09 (almost nothing) = 0.09 (almost nothing)

Measuring EffectsMeasuring EffectsEffect
Post-only Groups similar at baseline so effect of I will be observed at t=post. Assumes pre value unimportant; event dara (eg. Falls)
Change pre to post
Assumes pre value unimportant; reduces variability as a change value can occur in different ways; analyses based on explaining variability
Change pre to follow up
Often addresses maintenance of effects
Growth Longitudinal change; good for interventions over long term or with multiple measurements (4 or more ideal); pre-value is considered
c Nancy E. Mayo (Nov c Nancy E. Mayo (Nov 2005)2005)

RCT’s are Longitudinal DesignsRCT’s are Longitudinal Designs
Analyses of post only or change are cross-Analyses of post only or change are cross-sectionalsectional
Time may be importantTime may be important
Effect of intervention may depend on timeEffect of intervention may depend on time
c Nancy E. Mayo (Nov c Nancy E. Mayo (Nov 2005)2005)

c Nancy E. Mayo (Nov c Nancy E. Mayo (Nov 2005)2005)
Estimating EffectsEstimating Effects
Time: pre / postTime: pre / post
Time effect = impact of time averaged over group Time effect = impact of time averaged over group
Group: Intervention ControlGroup: Intervention Control
At baseline, groups are equalAt baseline, groups are equal
Group effect= effect of group averaged over time, Group effect= effect of group averaged over time, as baseline is equal, group effect can only be due as baseline is equal, group effect can only be due to post-scoreto post-score
Group * Time: does the effect of group depend on Group * Time: does the effect of group depend on timetime

c Nancy E. Mayo (Nov c Nancy E. Mayo (Nov 2005)2005)
Main Effect of GroupMain Effect of Group
Time
Eff
ect
X X XX
}
Group effect (averaged over time)

c Nancy E. Mayo (Nov c Nancy E. Mayo (Nov 2005)2005)
Main Effect of TimeMain Effect of Time
Time
Eff
ect
X X XX
Time effect (averaged over group)
aa a

c Nancy E. Mayo (Nov c Nancy E. Mayo (Nov 2005)2005)
Group*Time EffectGroup*Time Effect
Time
Eff
ect
X X XX
The effect of group depended on the time: same at baseline but increasingly different over time
} } }

95% CI95% CIMean ± 1.96 X SEMean ± 1.96 X SE
SE = SD / sqrt N (number of subjects)SE = SD / sqrt N (number of subjects)
1.96 is the area under the curve of a standard normal 1.96 is the area under the curve of a standard normal (mean of 0 and sd 1) distribution that is outside of the (mean of 0 and sd 1) distribution that is outside of the 95% range 95% range

Interpretation of 95% CIInterpretation of 95% CI
With 100 studies like this oneWith 100 studies like this one
The mean change in PPT will lieThe mean change in PPT will lie
Between the 95% confidence boundsBetween the 95% confidence bounds
95 times out of 10095 times out of 100
Likely that a gain will be between 4 and 8 Likely that a gain will be between 4 and 8 units of change units of change

Linking Data to StatisticsLinking Data to Statistics