Embed Size (px)
Citation preview

Going for the Green: A Simulation Study of Qualifying Success
Probabilities in Professional Golf1
Robert A. Connolly and Richard J. Rendleman, Jr.
September 20, 2010
1Robert A. Connolly is Associate Professor, Kenan-Flagler Business School, University of North Car-olina, Chapel Hill. Richard J. Rendleman, Jr. is Visiting Professor, Tuck School of Business at Dartmouthand Professor Emeritus, Kenan-Flagler Business School, University of North Carolina, Chapel Hill. Theauthors wish to acknowledge with gratitude Max Grender-Jones, who provided invaluable assistance in thecollection of data, Kelli Anderson of the PGA TOUR, who helped to clarify many of the rules regardingQ-School competition and PGA TOUR eligibility requirements, Ben Rosen who provided helpful comments,and Kin Lo, Steven Nahmias and other participants in the “Hole in One: Using Operations Research toAnalyze Golf II” session of the 2009 INFORMS conference. Please address comments to Robert Con-nolly (email: Robert [email protected]; phone: (919) 962-0053) or to Richard J. Rendleman, Jr. (e-mail:Richard [email protected]; phone: (919) 962-3188).

Going for the Green: A Simulation Study of Qualifying Success
Probabilities in Professional Golf
Abstract
Each year, over 1,300 golfers attempt to qualify for the PGA TOUR through Q-School. Us-
ing simulation, we estimate the probabilities that Q-School correctly identifies high-skill golfers.
We show that players with skill equivalent to the very best on the PGA TOUR would have high
probabilities of qualifying, but others, equal in skill to many active PGA TOUR members, would
have low odds of qualifying. We explore the impact of variations in Q-school structure on qual-
ifying probabilities for players with different skill levels, but most of the variations that improve
tournament efficiency are largely impractical.

1. Introduction
Each fall the PGA TOUR conducts the PGA TOUR Qualifying Tournament – better known as
Q-School – to identify a group of players to participate on the TOUR the following season who
would otherwise be ineligible. Q-School consists of four stages, Pre-qualifying, which started in
2006, and Stages 1-3. Except for the final stage, each stage of Q-School is broken into a number
of competitions conducted at different tournament sites, with a portion of the field at each site
continuing on to the next stage. Those who do not advance from early-stage competition are
eliminated and have no opportunity to re-enter the competition until the following year. Although
many professionally-untested golfers must begin Q-School in Pre-qualifying, a number of golfers
enter Q-School in its later stages based on their success in prior Q-School competitions and/or
positions on the PGA TOUR and affiliated Nationwide Tour money lists.
The problem that the PGA TOUR is attempting to solve through its annual Q-School compe-
tition is not unlike the problems of talent selection and employee performance evaluation routinely
faced by business organizations and academic institutions, among others. But unlike the promo-
tional and talent selection practices of most organizations, the rules of Q-School are unambiguous.
Both those who are being evaluated and those doing the evaluation know the “rules of the game.”
Once a player is evaluated, the TOUR cannot change the outcome based on subjective or political
criteria. We are unaware of any set of rules for identifying the relative rankings of high skill in-
dividuals for entry into or promotion within an organization that is cleaner and more transparent
than Q-School. The question we study here is whether Q-School itself is effective in identifying the
most highly skilled among its entrants.
Although it is unlikely that “the next Tiger Woods” will enter Q-School on an annual basis, one
would expect a regular flow of new TOUR-capable players to enter the professional golfing talent
pool; otherwise the TOUR could not sustain itself over the long run.1 As part of the “regular flow,”
we estimate that players with scoring characteristics comparable to well-known professional golfers
would have substantially less than a 50% chance of qualifying for the PGA TOUR through Q-School1We compiled two lists of players, one for 1999 and the other for 2009, who played in at least 15 PGA TOUR
events as rough proxies for TOUR membership in the two years. Both lists consisted of 203 players. Only 64 playersappeared on both lists, implying that 139 players who played in at least 15 events in 1999 were not among thoseplaying 15 or more events in 2009. This suggests a turnover of approximately 14 TOUR-capable players per yearbetween 1999 and 2009.
1

if they had to start at the beginning in Pre-qualifying. Moreover, our results show that a player
starting in pre-qualifying with the scoring characteristics of Phil Mickelson, generally regarded as
the second-best player of the modern era, would have only an 88% chance of qualifying. At the
same time, players of much lower skill can make it through Q-School and qualify for the TOUR by
simply having a run of favorable random variation in their scoring.
The effectiveness of Q-School in selecting the most highly skilled players to participate on the
PGA TOUR depends in large part on its ability to resolve the inherent random variation in scoring
to reveal, or efficiently estimate, true player skill. Ideally, Q-School would select the most highly
skilled among its participants, and luck would play a minimum role in determining those who
qualify for the TOUR.
In Connolly and Rendleman (2008 and 2009), we show that golfers who win PGA TOUR events
generally experience substantial favorable random variation in scoring (‘good luck’) relative to their
levels of skill. We estimate that it takes approximately 10 strokes of cumulative abnormally favor-
able performance over four rounds of play to win a typical PGA TOUR event. Moreover, almost
all who finish among the lowest scoring 25 to 30 experience some degree of favorable abnormal
performance. If ‘luck’ plays a role in regular PGA TOUR competition, then clearly it should also
play a role in determining those among Q-School participants who are successful and unsuccessful
qualifying for the TOUR.
Although no practical qualifying mechanism that the PGA TOUR could devise could eliminate
the luck factor entirely, it is instructive to know just how well the current structure works. In this
study we employ simulation to help answer this question. Our simulations suggest that among
the most highly skilled players in a given year’s Q-School competition, many will not succeed in
qualifying for the TOUR due to unfavorable random variation in scoring (Type I errors), and
many players of substantially lower skill will qualify (Type II errors) due to favorable random
variation. Of course, the tradeoff between Type I and II errors is what drives the design of all
organizational promotion activities. Unlike Q-School, however, quantifying these potential errors
in other organizations is particularly difficult, especially when the rules of promotion are less clear
and subject to manipulation in many forms. Moreover, it may be easy to identify Type II error
rates in a business organization, that is, identify those who were promoted who turned out to be low
skill, but identifying Type I error rates associated with high skill individuals who were incorrectly
2

identified as low skill and forced to leave an organization can be much more problematic. In our
study, however, we are able to estimate both types of error rates associated with the process used
by the PGA TOUR to select high-skill golfers to join the PGA TOUR.
From a statistical standpoint, determining the relative skill rankings of professional golfers
could be thought of as a problem in rank statistics. However, the complexity of the statistical
problem suggests that an analytical evaluation of Q-School efficiency using rank order statistics
is likely to be intractable. Q-School is conducted over four stages with new participants entering
the competition in later stages based on prior performance on the PGA TOUR, on the affiliated
Nationwide Tour and in previous Q-School competitions. Also, all but the final stage is conducted
over multiple tournament sites, with those advancing to the next stage being determined based
on players’ relative rankings at the sites where they participate. Taken together, this structure
suggests a simulation-based approach may be best suited to evaluate the selection efficiency of
Q-School.
Although we conduct simulations of some obvious alternative tournament structures, such as
assigning all players in a given stage to the same course and extending the number of rounds of
competition, from a practical standpoint, some of these structures are not feasible. For example,
it would be physically impossible to fit 900-1,000 Stage 1 participants on the same golf course at
the same time. However, these alternative structures do provide insight into the extent to which
limited rounds of competition over numerous tournament sites contribute to Type I and II errors.
In no sense do we attempt to find optimal alternatives to Q-School.
The remainder of our paper is organized as follows. In the next section we review the literature
of tournaments relevant to our study of Q-School selection efficiency. In Section 3, we describe the
Q-School qualification process. We provide evidence on the success rates of golfers who qualify for
the PGA TOUR through Q-School and the Nationwide Tour in Section 4 and find that those who
have qualified for the PGA TOUR via the Nationwide Tour have been more successful.
In Section 5 we summarize observed qualifying characteristics of Q-School competition and
variation in scoring, which, in turn, serve as the basis for the calibration of our Q-School simulation
model. We discuss how we model individual golfer skill in Section 6. In Sections 7 and 8, we
explain the general structure of our Q-school simulation model our method of simulating Q-School
scoring. In Section 9, we discuss the simulation results, and in Section 10, compare the potential
3

performance of hypothetical alternative Q-School structures. A final section presents a summary
of the paper and our conclusions.
2. Related Work
Two approaches to the study of tournament structure embody very different interpretations of
the stochastic element in measured tournament performance. According to tournament theory,
both the level of effort competitors choose to exert and the degree of risk they choose to bear
reflect the performance characteristics of others in the competition, the tournament’s competitive
design and the structure of tournament prizes.2 Tournament theory predicts that deviations from
one’s “best efforts” level of performance reflect both a random component and an endogenous
component, which, in turn, reflects the design characteristics of the tournament. Much of the focus
in the theoretical literature of tournaments is on designing ‘tournaments,’ such as corporate and
academic promotion rules, that will maximize the overall level of output of an organization over
the long run.
The second line of tournament study, which draws on the statistical decision theory literature
(for example, Gibbons, Olkin and Sobel (1977), Narayana (1979) and David (1988)), concerns the
ability of a given tournament structure to identify the most highly skilled among its competitors.
In this line of work, characterized by the recent papers of Ryvkin and Ortmann (2008) and Ryvkin
(2010), players’ efforts and risk-taking levels are not choice variables; tournament participants are
assumed to play their best. As such, deviations of performance from a competitor’s “best efforts”
output are due to exogenous random factors alone. As noted by Ryvkin (2010, p. 668), “this
assumption is realistic for an important class of selection situations involving human subjects, such
as the final stages of recruitment tournaments and other environments where stakes are high, and
significant prior investment has already been made by competitors.” Examples cited by Ryvkin
include formation of Olympic teams, innovation races, elections, and high level sports tournaments.
And, most certainly, Q-School would also fit this characterization. In many cases, those participat-
ing in Q-School have spent years investing both time and money in skill development. For those2The seminal paper on tournaments is Lazear and Rosen (1981). Useful surveys include McLaughlin (1988) and
Prendergast (1999). Frick (2003) provides a summary of how tournament theory, as developed by Lazear and Rosen(1981) and Rosen (1986), applies in sports settings. Hvide and Kristiansen (2003) study contests where participantschoose how much risk to take rather than the amount of effort to exert.
4

involved, the stakes couldn’t be higher – being chosen as one of 25 participants from a pool of over
1,300 competitors to participate on the following year’s PGA TOUR.3 Moreover, unlike promotion
tournaments in commonly-studied theoretical models applied to the promotion process in firms,
many in Q-School have no baseline income from playing professional golf to fall back on in the
event they do not qualify for the TOUR. For a golfer, earning the right to play on the tour is like
finding the proverbial pot of gold at the end of the rainbow.
In an important set of papers, Ryvkin and Ortmann (2009) and Ryvkin (2010) study the selec-
tion efficiency of multiple tournament formats, contests, knockout tournaments, and round-robin
tournaments. They explore the interaction of tournament structures, the distribution of player
skills, and the level of noise in designing efficient tournaments. In their work, the tournament
selection efficiency criterion is generally focused on identifying the ‘best’ player, not a group of the
most highly skilled, as in Q-School. Based on their analytical and simulation results involving con-
tests, binary tournaments, and round-robin tournaments, several predictions emerge. Of particular
relevance to our work is the following finding: when players have similar skill levels and the random
component in scoring is substantial, the optimal length of the tournament is much longer than in
a setting with low noise and diverse abilities. Put in statistical terms, the sample size has to be
very large before the distribution centers on the ‘right’ outcome.4,5
We now turn to a description of Q-School structure. Understanding this structure is critical
to understanding our simulation design. Moreover, the structure should make it clear that an
evaluation of Q-School selection efficiency could not be formulated analytically.3At the end of the 2009 PGA TOUR season, average and median prize money for players who competed in 15 or
more tournaments, a rough estimate of PGA TOUR membership, was $1,216,074 and $820,011, respectively, with91 players earning over $1 million. It should be noted that a large portion of a PGA TOUR player’s income cancome from endorsements which, in turn, reflect success in tournament competition. Sirak (2008) provides an analysisof 2007 on-course and estimated off-course income for 50 professional golfers, 42 of which were active PGA TOURmembers. Among the 42, the estimated off-course income for 27 golfers exceed their tournament prize winnings, andwithin this group, we compute a median ratio of off-course to on-course income of 1.72.
4We show that the error rates observed for the Q-School qualifying scheme could be reduced substantially byincreasing the number of 18-hole rounds in the competition. However, the number of rounds required to bring areasonable level of efficiency to the qualifying scheme is too high to be implemented in practice.
5Other studies on selection efficiency focus on algorithms for organizing and conducting particular tournamentformats (knockout vs. contest vs. round-robin, to name a few) that will yield desired outcomes. For example,McGarry and Schutz (1997) use Monte Carlo methods to study the ability of knockout and round-robin tournamentformats to put the ith player in the ith rank at the end of the tournament. Other examples of research on optimaltournament structure in this vein include Appleton (1995) and Clarke, Norman, and Stride (2009).
5

3. Q-School Structure
Figure 1 illustrates the various stages of Q-School competition as structured in 2008, how Q-
School feeds the PGA and Nationwide Tours and how these two tours, in turn, feed subsequent
Q-School competitions. In 2008, 433 players participated in four 18-hole rounds of pre-qualifying
competition at six different tournament sites, and 238 of the 433 advanced to Stage 1. In Stage
1, the 238 were joined for four 18-hole rounds of play across 12 tournament sites by 713 golfers
whose eligibility to begin in Stage 1 was based primarily on their success in previous Q-School
competitions or their placing 71st or worse on the 2008 Nationwide Tour Money List. Of the 951
Stage 1 participants, 308 advanced to Stage 2. They, in turn, were joined for four rounds of play
across six tournament sites by 154 players whose eligibility to begin Q-School competition in Stage
2 was based on performance on the 2008 PGA and Nationwide Tours and various miscellaneous
exemptions. Of the 462 participants in Stage 2, 124 advanced to the final stage, a competition
at a single tournament site consisting of six 18-hole rounds, three each on two different courses.
These players were joined by those in positions 126-150 on the 2008 PGA TOUR Money List and
in positions 26-40 on the Nationwide Tour Money List along with a few others players who were
given miscellaneous exemptions, bringing the total number of Stage 3 competitors to 161. The
lowest scoring 25 players and ties (28 total) earned 2009 PGA TOUR cards. Those in positions
29 to 70 in the final stage (the next closest to 50) earned fully-exempt playing privileges on the
2009 Nationwide Tour.6 All remaining players earned partially-exempt status on the Nationwide
Tour, with initial preference given to those with the best scores in the final stage of Q-School
competition.7 As it turns out, only six of the 433 participants in Pre-qualifying made it to Stage
3, and among the six, the two best finishers, Joseph Sykora and Martin Piller, earned fully-exempt
status on the Nationwide Tour.
Figure 1 shows that in addition to the (approximately) 50 annual PGA TOUR qualifiers from
Q-School and the Nationwide Tour, the top 125 players on the PGA TOUR Money List get to
return to the PGA TOUR the following year. The players in positions 126-150 on the Official6The term, “fully exempt player,” as it is applied to the PGA TOUR or Nationwide Tour, is a player who has
earned the right to play on the tour without restriction, other than being subject to tournament priority lists basedon past performance.
7A “partially exempt player” on the PGA TOUR or Nationwide Tour is one who is allowed to fill out a tournamentfield after all fully-exempt players have been given the opportunity to participate.
6
PGA TOUR Money List advance immediately to Stage 3 of 2008 Q-School. Even if they had not
qualified for the 2009 PGA TOUR through 2008 Q-School competition, they would have received
partially-exempt status on the 2009 PGA TOUR. PGA TOUR players in positions 151 and higher
on the 2008 Official PGA TOUR Money List advance immediately to Stage 2 of Q-School, while the
first 50 players in this group also receive partially-exempt status on the following year’s Nationwide
Tour. It should be noted that no official PGA TOUR member can do any worse than returning
to Stage 2 of Q-School. This is a key characterization of Q-School competition in structuring our
simulations.
Figure 1 also shows that players in positions 26-60 on the 2008 Official Money List of the
Nationwide Tour were able to return to the Nationwide Tour in 2009 as fully-exempt members.
The first 15 players in this group advanced immediately to Stage 3 of 2008 Q-School. Nationwide
players in positions 61-100 earned the right to return to the Nationwide Tour in 2009 as partially
exempt members. We leave the remaining observations about the relationships among Q-School,
PGA TOUR and Nationwide Tour qualification to the reader. We note, however, that there are
other ways of making the PGA and Nationwide Tours, which are not included in Figure 1, such
as winning a PGA TOUR event during the past two years or being a non-PGA TOUR member
who earns as much official prize money as the 125th player on the Official PGA TOUR Money List.
Figure 1 is intended to illustrate the interconnections among Q-School, PGA TOUR qualification
and Nationwide Tour qualification only.
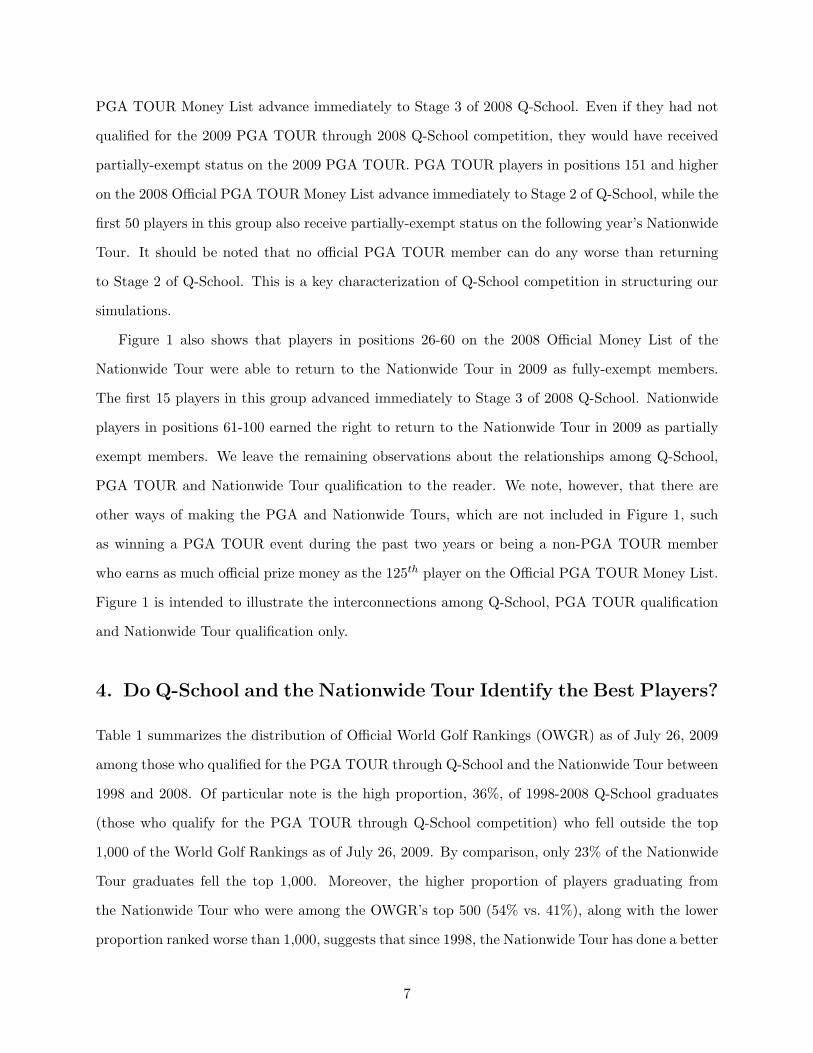
4. Do Q-School and the Nationwide Tour Identify the Best Players?
Table 1 summarizes the distribution of Official World Golf Rankings (OWGR) as of July 26, 2009
among those who qualified for the PGA TOUR through Q-School and the Nationwide Tour between
1998 and 2008. Of particular note is the high proportion, 36%, of 1998-2008 Q-School graduates
(those who qualify for the PGA TOUR through Q-School competition) who fell outside the top
1,000 of the World Golf Rankings as of July 26, 2009. By comparison, only 23% of the Nationwide
Tour graduates fell the top 1,000. Moreover, the higher proportion of players graduating from
the Nationwide Tour who were among the OWGR’s top 500 (54% vs. 41%), along with the lower
proportion ranked worse than 1,000, suggests that since 1998, the Nationwide Tour has done a better
7

job identifying the most highly-skilled players as of July 2009, despite the fact that Nationwide
Tour participants did not perform as well in Q-School to begin with.
These findings suggest a non-negligible ‘luck’ factor associated with making it onto the PGA
TOUR via Q-School, implying a relatively high Type II error rate among players identified through
Q-School as highly skilled. By contrast, Nationwide Tour competition extends presently over 29
tournaments, and, therefore, it is less likely that relatively weak players will qualify for the PGA
TOUR through Nationwide competition. Moreover, since favorable random variation in scoring
tends to play a substantial role in qualifying for the PGA TOUR through Q-School, many highly-
skilled players in Stage 3 who do not finish among those who qualify for the PGA TOUR but go on
to the Nationwide Tour could be as skilled, if not more skilled, than many of the Stage 3 players
who actually qualify for the TOUR. With 29 additional tournaments to be played the following year
on the Nationwide Tour, many who qualify for the PGA TOUR through Nationwide competition
are likely to end up being more successful in the long run than some who qualified for the PGA
TOUR from Q-School ahead of them.
5. Properties of Q-School Competition and Scoring
In this section we describe general properties of Q-School qualifying success rates and scoring which,
in turn, serve as the basis for calibrating our simulations of Q-School competition. Although we
draw some general inferences from the data, none are supported by tests of statistical significance,
since the inferences drawn are not the primary focus of this study.
5.1. Qualifying Success Rates
Table 2 shows how the players who participated in Q-School from 2006 to 2008 advanced through
its various stages. All values within the table, as well as Tables 3 - 6, reflect the combined 2006-2008
data. Over this period, 1,191 players entered Q-School at the Pre-qualifying stage.8 Only 13 of the
1,191 reached Stage 3, but none qualified for the PGA TOUR, and very few who entered in Stage
1 earned their TOUR cards (25 of 2,099).
Table 3, derived from the entries in Table 2, shows qualifying success rates by stage of play,8If a player entered Q-School in Pre-qualifying in each year, 2006-2008, he is counted as three players.
8

conditional upon Q-School entry stage. By design, 53.7% of the participants in Pre-qualifying
advanced successfully to Stage 1. Stage 1 participants, in turn, consist of two groups, those who
started in Pre-qualifying and those who started in Stage 1. Among the Stage 1 participants who
started in Pre-qualifying, 21.0% (134 of 639) advanced to Stage 2, while 38.6% of the Stage 1
participants who started Q-School in Stage 1 advanced to the next stage. We note that one of our
main objectives in structuring simulations of Q-School competition is to produce qualifying success
rates in simulated data that closely approximate those shown in Table 3.
The entries in Table 3 suggest that the level of skill among those who participated in a given
stage of Q-School is an increasing function of entry stage. For example, only 9.7% of the Stage 2
participants who began Q-School in Pre-qualifying advanced to Stage 3. By contrast, 24.2% of the
Stage 2 participants who started in Stage 1 advanced to Stage 3, and 36.6% of those who entered
Q-School in Stage 2 advanced to the final stage. There is one notable exceptions to this pattern –
in Stage 3 – where those who began Q-School competition in Stage 2 were more successful earning
their TOUR cards than those who entered in Stage 3 (27.1% vs. 20.0%).
5.2. Mean Scoring of Q-School Participants
Table 4 summarizes mean 18-hole scores, conditional upon Q-School entry stage, normalized to
mean scores in Stage 3 for players who entered Q-School in Stage 3. Without exception, in each
playing stage mean scores are the lowest among players who entered Q-School in the later stages.
Consistent with the qualifying success rates summarized in Table 3, this suggests that, on average,
players who are allowed to bypass early-stage competition and enter Q-School in the later stages
are more highly skilled than the players against whom they are competing who entered Q-School
in earlier stages.
Also, players who advance in Q-School competition tend to record lower scores on average in
advanced-stage competition than all players in their same entry group scored in earlier competition.
This suggests that players who advance in Q-School are more highly skilled as a group than those
in their same entry group who do not advance. However, differences in average scores from one
stage to the next for a given entry group could also reflect the relative difficulty of courses rather
than differences in skill.
9
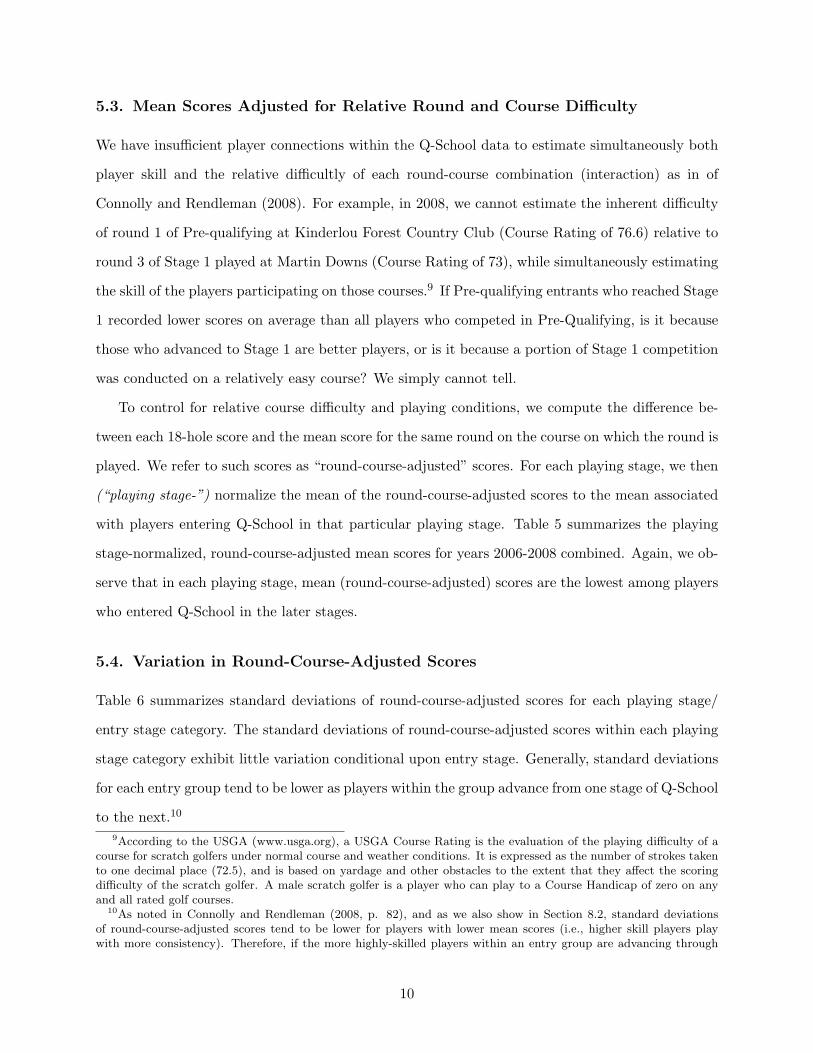
5.3. Mean Scores Adjusted for Relative Round and Course Difficulty
We have insufficient player connections within the Q-School data to estimate simultaneously both
player skill and the relative difficultly of each round-course combination (interaction) as in of
Connolly and Rendleman (2008). For example, in 2008, we cannot estimate the inherent difficulty
of round 1 of Pre-qualifying at Kinderlou Forest Country Club (Course Rating of 76.6) relative to
round 3 of Stage 1 played at Martin Downs (Course Rating of 73), while simultaneously estimating
the skill of the players participating on those courses.9 If Pre-qualifying entrants who reached Stage
1 recorded lower scores on average than all players who competed in Pre-Qualifying, is it because
those who advanced to Stage 1 are better players, or is it because a portion of Stage 1 competition
was conducted on a relatively easy course? We simply cannot tell.
To control for relative course difficulty and playing conditions, we compute the difference be-
tween each 18-hole score and the mean score for the same round on the course on which the round is
played. We refer to such scores as “round-course-adjusted” scores. For each playing stage, we then
(“playing stage-”) normalize the mean of the round-course-adjusted scores to the mean associated
with players entering Q-School in that particular playing stage. Table 5 summarizes the playing
stage-normalized, round-course-adjusted mean scores for years 2006-2008 combined. Again, we ob-
serve that in each playing stage, mean (round-course-adjusted) scores are the lowest among players
who entered Q-School in the later stages.
5.4. Variation in Round-Course-Adjusted Scores
Table 6 summarizes standard deviations of round-course-adjusted scores for each playing stage/
entry stage category. The standard deviations of round-course-adjusted scores within each playing
stage category exhibit little variation conditional upon entry stage. Generally, standard deviations
for each entry group tend to be lower as players within the group advance from one stage of Q-School
to the next.10
9According to the USGA (www.usga.org), a USGA Course Rating is the evaluation of the playing difficulty of acourse for scratch golfers under normal course and weather conditions. It is expressed as the number of strokes takento one decimal place (72.5), and is based on yardage and other obstacles to the extent that they affect the scoringdifficulty of the scratch golfer. A male scratch golfer is a player who can play to a Course Handicap of zero on anyand all rated golf courses.
10As noted in Connolly and Rendleman (2008, p. 82), and as we also show in Section 8.2, standard deviationsof round-course-adjusted scores tend to be lower for players with lower mean scores (i.e., higher skill players playwith more consistency). Therefore, if the more highly-skilled players within an entry group are advancing through
10
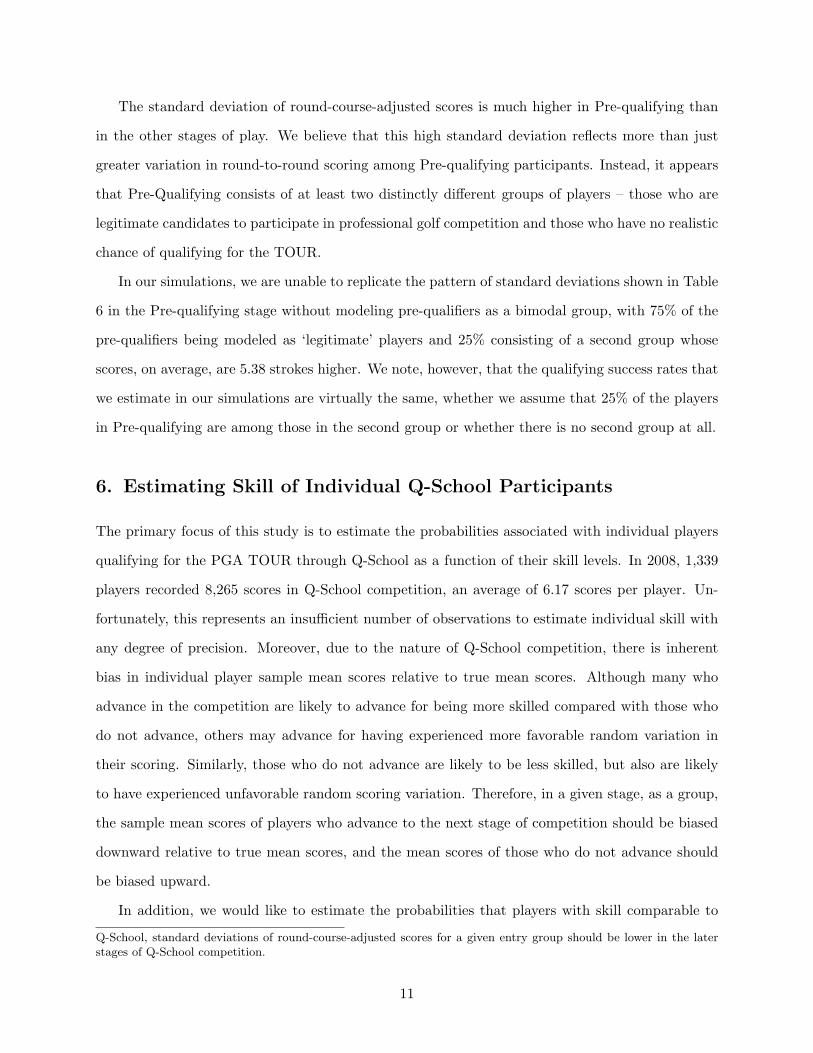
The standard deviation of round-course-adjusted scores is much higher in Pre-qualifying than
in the other stages of play. We believe that this high standard deviation reflects more than just
greater variation in round-to-round scoring among Pre-qualifying participants. Instead, it appears
that Pre-Qualifying consists of at least two distinctly different groups of players – those who are
legitimate candidates to participate in professional golf competition and those who have no realistic
chance of qualifying for the TOUR.
In our simulations, we are unable to replicate the pattern of standard deviations shown in Table
6 in the Pre-qualifying stage without modeling pre-qualifiers as a bimodal group, with 75% of the
pre-qualifiers being modeled as ‘legitimate’ players and 25% consisting of a second group whose
scores, on average, are 5.38 strokes higher. We note, however, that the qualifying success rates that
we estimate in our simulations are virtually the same, whether we assume that 25% of the players
in Pre-qualifying are among those in the second group or whether there is no second group at all.
6. Estimating Skill of Individual Q-School Participants
The primary focus of this study is to estimate the probabilities associated with individual players
qualifying for the PGA TOUR through Q-School as a function of their skill levels. In 2008, 1,339
players recorded 8,265 scores in Q-School competition, an average of 6.17 scores per player. Un-
fortunately, this represents an insufficient number of observations to estimate individual skill with
any degree of precision. Moreover, due to the nature of Q-School competition, there is inherent
bias in individual player sample mean scores relative to true mean scores. Although many who
advance in the competition are likely to advance for being more skilled compared with those who
do not advance, others may advance for having experienced more favorable random variation in
their scoring. Similarly, those who do not advance are likely to be less skilled, but also are likely
to have experienced unfavorable random scoring variation. Therefore, in a given stage, as a group,
the sample mean scores of players who advance to the next stage of competition should be biased
downward relative to true mean scores, and the mean scores of those who do not advance should
be biased upward.
In addition, we would like to estimate the probabilities that players with skill comparable to
Q-School, standard deviations of round-course-adjusted scores for a given entry group should be lower in the laterstages of Q-School competition.
11

successful PGA TOUR players would make it through Q-School if they had to begin Q-School
competition in Pre-qualifying. There is simply no way to draw such inferences by studying the
2006-2008 Q-School data in isolation without also connecting the Q-School data to scoring data
characteristic of regular players on the TOUR.
The key to making this connection is through the regular PGA TOUR players who participate
in Q-School after unsuccessful PGA TOUR seasons. Defining a regular PGA TOUR player as one
who participated in at least 15 events during the PGA TOUR season immediately preceding entry
to Q-School, we find that 40, 33, and 47 such players entered Stage 2 of Q-School in years 2006-2008,
respectively, and 21, 20, and 16, respectively, entered Stage 3.11 Using the statistical methodology
of Connolly and Rendleman (2008) to estimate the scoring characteristics of regular TOUR players
over the 2004-2008 PGA TOUR seasons, including those who had to go back to Q-School, we can
link the scoring characteristics of Q-School participants coming off the PGA TOUR to those of
more successful TOUR players such as Tiger Woods and Phil Mickelson who do not participate in
Q-School.
Using the Connolly and Rendleman (2008) model, we estimate cubic spline-based time-varying
skill functions for a group of professional golfers representative of active PGA TOUR participants
during the five-year period 2004-2008. Simultaneously, the model accounts for random variation
in scoring due to differences in relative round difficulty (round-course effects) and the propensities
of individual players to perform better or worse on certain courses (player-course effects). (To
conserve space, we refer the reader directly to Connolly and Rendleman (2008) for a description of
the statistical methodology, its relationship to previous literature on performance measurement in
golf and other athletic contests, and its efficiency relative to alternative modeling structures.) We
note that the model does not take account of specific information about playing conditions (e.g.,
adverse weather as in Brown (2010), pin placements, morning or afternoon starting times, etc.) or,
in general, the particular conditions that could make scoring for all players more or less difficult,
when estimating random round-course effects. Nevertheless, if such conditions combine to produce
abnormally high or low scores in a given 18-hole round, the effects of these conditions should be11We are not concerned with whether a player was an official member of the PGA TOUR during the PGA TOUR
season immediately preceding his entry to Q-School but, instead, whether the statistical properties of his play werecharacteristic of those of regular TOUR players who entered Q-School. Therefore, some players so identified mightnot have been official members of the TOUR, while others who participated in less than 15 events could have actuallybeen official PGA TOUR members.
12

reflected in the estimated round-course-related random effects.12
To fit the model, we collected individual 18-hole scores from the golf section of Yahoo! Sports
for every player in every stroke play event on the PGA TOUR for years 2004-2008, a total of
96,264 scores distributed among 1,432 players. After limiting our sample to players who recorded
more than 90 scores, as in Connolly and Rendleman (2008), the resulting sample consists of 83,823
18-hole golf scores for 303 active PGA TOUR players over 231 stroke-play events. Most of these
omitted players were not regular PGA TOUR players. For example, 528 of the omitted players
recorded only two 18-hole scores, and 906 of the 1,432 players in the sample recorded 10 or fewer
scores. By excluding these players, we maximize the power of the statistical model and minimize
potential distortions in estimating the statistical properties of golf scores of regular players on the
TOUR.
Estimated random round-course effects in the 2004-2008 PGA Tour sample range from -3.76 to
7.82 strokes per round (compared with -3.92 to 6.95 strokes per round in the 1998-2001 sample),
implying almost a 12-stroke difference between the relative difficulty of the most difficult and easiest
rounds played on the Tour during the 2004-2008 period. Estimated random player-course effects
range from -0.197 to 0.166 in the 2004-2008 sample and from -0.065 to 0.044 strokes per round
in the 1998-2001 sample, too small to have a meaningful impact on the overall scores in a typical
72-hole PGA Tour event.
We have identified the players among the 303 who participated in Stages 2 and 3 of Q-School
during the 2004-2008 period. Using the estimated skill functions for these players during the PGA
TOUR seasons immediately preceding their entry to Q-School, we are able to build scoring distri-
butions characteristic of regular PGA TOUR players who entered Q-School in Stages 2 and 3. We
limit these skill functions to the portions of individual player splines estimated over the PGA TOUR
seasons immediately preceding Q-School entry, since sub-standard single-season performance is the
determining factor in a PGA TOUR player having to return to Q-School. Inasmuch as skill func-
tions for these players are estimated simultaneously with those of the remaining players in the
303-player sample, we are able to connect the scoring characteristics of those among the 303 who12Round-course effects, with similar justification, are also estimated in Berry, Reese and Larkey (1999) and Berry
(2001). A similar approach is taken by Caulkins et. al (1993) in estimating on-time performance of airlines, whereempirically observed on-time performance rates reflect “not just the difficulty of flying into [a given airport], but alsothe skill of the airlines that serve it.” (pg. 713)
13

entered Q-School between 2004 and 2008 to those of Tiger Woods and other highly-skilled players
on the TOUR.
From this point forward, we will refer to two separate 18-hole scoring samples. The first, the
“2006-2008 Q-School sample,” is the sample of scores in Q-School competition covering the 2006-
2008 period whose properties are summarized in Tables 2 through 6. The second is the separate
sample of scores associated with 303 players in regular PGA TOUR competition, some of whom
also participated in Q-School, which we will refer to as the “2004-2008 PGA TOUR sample.”
7. Q-School Simulation Structure
7.1. Creating a Prototypical 2006-2008 Q-School Structure
In our simulations, we employ a Q-School structure that reflects the number of total and successful
participants by stage of play observed in actual Q-School competition over the 2006-2008 period.
Each simulation consists of 1,000 trials, with each trial representing the simulation of a single
Q-School competition.
Although not shown in the Table 2, during 2007 and 2008, Pre-qualifying was conducted at
six different tournament sites, Stage 1 was conducted at 12 sites, Stage 2 was conducted at six
sites, and only one site was used for the final stage, although competition in the final stage was
conducted on two courses, with each competitor playing half of his rounds on each course. We
will refer to this as a 6-12-6-1 venue structure. The venue structure in 2006 was slightly different.
Pre-qualifying competition was conducted at four tournament sites, and Stage 1 was conducted at
11, but, otherwise, the structure was the same.
In our simulations, we employ a prototypical Q-School structure that reflects the average number
of total and successful participants by stage of play in the 2006-2008 data, spread over a 6-12-6-1
venue structure. We then attempt to calibrate the parameters of assumed scoring distributions
employed in the simulations so that the simulations produce qualifying success rates and standard
deviations of round-course-adjusted scores by playing stage/entry stage that closely match those
same properties as observed in the 2006-2008 empirical Q-School sample.
Table 7 summarizes the Q-School structure used in calibrating our simulations. Pre-qualifying
is spread over six tournament sites, with approximately 66 players participating at each site and
14

35 qualifying for Stage 1 competition. In stage 1, approximately 26 of 76 participants per venue
advance to Stage 2. Stage 2 is comprised of approximately 78 players per venue, with approximately
21 per venue advancing to Stage 3. The single tournament site in Stage 3 hosts 163 players, and
31 advance to the PGA TOUR. We do not spread the Stage 3 players over two different courses,
as is the case in actual Q-School competition.
7.2. Player Groups
Although not shown in Table 7, an average of 40 players per year who entered Q-School in Stage 2
were regular PGA TOUR players (defined in our study as having participated in at least 15 PGA
TOUR events during the season immediately preceding their entry to Q-School), and an average
of 19 regular PGA TOUR players entered Stage 3. Therefore, in our simulations, we assume that
40 Stage-2 entrants and 19 Stage-3 entrants come directly from the TOUR. We assume further
that all remaining players in Q-School competition are non-PGA TOUR players. This results in
the following six distinctly different player groups, with an indication of the number of players per
group employed in the simulations:
1. Non-PGA TOUR players entering Q-School competition in Pre-qualifying (397 players, seeTable 7)
2. Non-PGA TOUR players entering Q-School competition in Stage 1 (700 players)
3. Players entering Q-School competition in Stage 2 coming directly from the PGA TOUR (40players)
4. Non-PGA TOUR players entering Q-School competition in Stage 2 (151− 40 = 111 players)
5. Players entering Q-School competition in Stage 3 coming directly from the PGA TOUR (19players)
6. Non-PGA TOUR players entering Q-School competition in Stage 3 (38− 19 = 19 players)
As described in Section 8, the statistical properties of scoring for the two groups of players
coming directly from the PGA TOUR (groups 3 and 5, above) reflect the scoring characteristics
of players of this type as estimated in the 2004-2008 PGA TOUR sample during the PGA TOUR
seasons immediately preceding their Q-School entry without alteration. The statistical properties
of scoring for non-PGA TOUR players entering Stage 3 are based on a potential modification
(described in Section A of the Appendix) of the scoring properties of Stage 3 players coming
15

directly from the TOUR. The statistical properties of all other non-PGA TOUR player groups are
based on potential modifications of scoring distributions associated with Stage 2 players coming
from the TOUR (also described in Section A of the Appendix).
7.3. Simulation of Q-School Competition
If a player enters Q-School in Pre-Qualifying and makes it to Stage 3, he will have participated in
18 rounds of golf, four rounds each in Pre-qualifying through Stage 2 and six rounds in Stage 3.
Using the procedure described in Section 8, we generate 18 random 18-hole scores for each player
in simulated Q-School competition but use only the portion of the scores so generated that are
relevant to a player’s stage of play. For example, if a player enters Q-School in Stage 3, we would
use only the last six of his 18 randomly generated scores.
The following steps, which reflect the prototype Q-School structure summarized in Table 7,
describe the structure of simulated Q-School competition:
1. Select 397 players at random for Pre-qualifying and generate 18 random 18-hole scores foreach player using the procedures described in Section 8.
2. Randomly assign each of the 397 players to each of six pre-qualifying venues, with approxi-mately 66 players assigned to each venue.
3. Compute the total of the first four randomly generated scores for each player and rank eachplayer from lowest total score to highest total within each venue.
4. From each ranked list, select the (approximately) 36 players with the lowest total scores fromeach venue as venue winners who move on to Stage 1 (213 total).
5. Combine the 213 Pre-qualifying winners with 700 new Stage 1 entrants to produce a pool of913 players for competition in Stage 1.
6. Distribute the 913 players randomly across 12 venues of approximately 76 players each.
7. Generate 18 random 18-hole scores for each new player entering Q-School in Stage 1.
8. Compute the total of scores 5-8 for each of the 913 Stage 1 players and determine venuewinners who move on to Stage 2 (315 total).
9. Proceed in likewise fashion through Stage 3, using the number of new stage entrants, venuesand venue winners as indicated in Table 7.
10. The lowest scoring 31 players in Stage 3 qualify for the PGA TOUR.
We explore variations on this general simulation structure in Section 9.
16

8. Simulated Scoring Distributions for Q-School Participants
8.1. Simulated Scoring Distributions for PGA TOUR Players Entering Q-School
When estimating cubic spline-based skill functions for each of the 303 players, we also obtain sets
of player-specific residual scoring errors, denoted as θ and η. The θ errors represent potentially
autocorrelated differences between a player’s actual 18-hole scores, reduced by estimated random
round-course and player-course effects, and his spline-predicted scores. The η errors represent θ
errors adjusted for estimated first-order autocorrelation, and are assumed to be white noise.
We recognize that a player’s official money winnings in a given PGA TOUR season, which, in
turn, reflect his scoring, determines whether he must participate in Q-School at the season’s end
to qualify for PGA TOUR play the following year. Therefore, in building the simulated scoring
distribution for a regular PGA TOUR player entering Q-School in Stage 2 or 3, we include only the
portion (or those portions) of his fitted spline associated with the PGA TOUR season(s) in which
his performance over 2004-2008 was sufficiently poor to require him to enter Q-School competition
at the end of a season. Using this procedure for constructing simulated scoring distributions
characteristic of players entering Q-School in Stages 2 and 3, 161 player-year combinations are
represented in the Stage 2 group, and 86 are represented in the scoring distributions for Stage 3.
We do not include a player in our scoring distributions for Stages 2 or 3 if he recorded fewer
than 40 scores on the PGA TOUR during the season immediately preceding his entry to Q-School.
The 40-score minimum provides an indirect way of determining whether the player was a ‘regular’
on the TOUR. We refer to these two groups, respectively, as our Stage 2 and Stage 3 PGA TOUR
samples.13
In each simulation trial, we assume that 40 regular PGA TOUR players enter Q-School in13Even though a player’s loss of PGA TOUR playing privileges is based on money winnings, not average score, the
two are clearly related. In addition to playing poorly, some players could come up short on money winnings by simplynot having played in a sufficient number of tournaments. Not every PGA TOUR player, or player in our sample,is eligible to participate in the majors. Some of the better “invitationals” on the PGA TOUR, such as the ArnoldPalmer Invitational (formerly Bay Hill) and the Memorial Tournament, and the several World Golf Championshipevents on the TOUR employ eligibility requirements that restrict competition to only select groups of top players.Moreover, since tournament payoffs are highly non-linear, two players with identical average scores across the sameset of tournaments could end up with substantially different money winnings. So it is possible that some regularPGA TOUR players who are required to go back to Q-School at the end of an unsuccessful PGA TOUR season aremore highly skilled, and may have actually performed better in terms of scoring, than other players who are able toretain their TOUR cards. Our Stage 2 and Stage 3 PGA TOUR samples reflect this potential heterogeneity in skillamong players required to “go back to school,” since the two samples consist of players who actually participated inQ-School after coming off the TOUR (for whatever reason).
17

Stage 2 and that 19 enter in Stage 3. In simulating the scoring in Q-School of each of the 40
regular TOUR players, indexed by i, who enter Stage 2, we select a player, k, at random, with
replacement, among those included in the 161-player Stage 2 PGA TOUR sample. (Throughout
this section and the next, the index i always refers to a Q-School participant, and the index k
always refers to a randomly selected player in the Stage 2 or Stage 3 PGA TOUR sample upon
whom player i ’s scoring distribution is based.) We then select a point at random on the portion of
player k ’s estimated cubic spline covering the PGA TOUR season immediately preceding his entry
to Q-School as an estimate of player i ’s mean skill level.
To simulate random variation in scoring for Q-School participant i, we select a starting θ error at
random from the entire distribution of player k ’s θ errors estimated over the 2004-2008 PGA TOUR
sample period. We then select 28 η errors at random (with replacement) from player k ’s entire
distribution of η errors. Using the initial θ error, the vector of 28 randomly-selected η errors, and
player k ’s first-order autocorrelation coefficient as estimated in the Connolly-Rendleman model, we
compute a sequence of 28 estimated θ errors. We apply the last 18 estimated θ errors to Q-School
player i ’s randomly selected mean score, yielding a sequence of 18 simulated 18-hole scores for
player i. We do not employ the first ten simulated θ errors in our simulated scores in order to
give the autocorrelated component of residual scoring errors time to ‘burn in.’ Simulated scores
for the 19 PGA TOUR players who enter Q-School in Stage 3 are produced in similar fashion.
By construction, all of these simulated scores are ‘neutral’ with respect to variation in scoring due
to relative round-course difficulty and a player’s propensity to score better on some courses than
others.
The two right-most histograms in the bottom section of Figure 2 show distributions of mean
skill levels, based on 1,000 simulation trials, for PGA TOUR players entering Q-School in Stages 2
and 3, respectively. Histograms in corresponding positions in Figure 3 show distributions of actual
18-hole scores for both groups. Simulated 18-hole scores range from 60.92 to 87.53 among those
shown in the Stage 2 histogram (720,000 scores total) and from 60.81 to 85.24 among those shown
in the histogram for Stage 3 (342,000 scores total).
Note from Figure 3 that there is a 72.04 − 71.57 = 0.47 stroke-per-round average scoring
difference between the scoring distribution of PGA TOUR players entering Q-School in Stages 2
and 3. Therefore, in our simulations, PGA TOUR players who enter in Stage 3 have a built-in
18

mean 0.47 stroke-per-round advantage over those who enter in Stage 2.
8.2. Simulated Scoring Distributions for Non-PGA TOUR Players Competingin Q-School
As described in Section 7.2, we build simulated distributions of scoring for all Stage 3 entrants not
coming from the PGA TOUR by modifying simulated scores that would otherwise be associated
with Stage 3 entrants coming directly from the TOUR. Similarly, we build simulated distributions
of scoring for all Pre-qualifying and Stage 1 entrants and for those entering Q-School in Stage 2
who are not coming from the PGA TOUR by modifying simulated scores that would otherwise be
associated with Stage 2 entrants coming directly from the TOUR.
The modified distributions are ‘parameterized’ to produce simulated qualifying success rates
per playing stage/entry stage category that closely approximate those observed empirically, as
summarized in Table 3, and simulated standard deviations of ‘neutral’ scores per playing stage/entry
stage category that closely approximate the empirically-observed standard deviations of round-
course-adjusted scores summarized in Table 6. We summarize the modification process and the
sensitivity of our results to parameter selection in Sections A and B of the Appendix.
Panels A and B of Table 8 show how well qualifying success rates and standard deviations
in the simulated data match those observed in the 2006-2008 Q-School sample. Note that there
is very little difference between the simulated and empirical qualifying proportions and standard
deviations.
In Panel C of Table 8, we also show playing stage-adjusted, round-course-adjusted mean scores
per playing stage/entry stage category for both the simulated and empirical data. We make no
attempt to match these values in selecting our simulation parameters. Although some of the
differences appear to be large, they are well within the bounds of year-to-year variation underlying
the entries in Table 5. Therefore, we believe that the simulations, calibrated with the parameters
summarized in Table 8, reproduce the properties of the 2006-2008 Q-School sample in its most
important dimensions.
The center section of Figure 2 shows simulated distributions of mean skill for all player groups
derived from the Stage 2 PGA TOUR sample, while the right-most section shows scoring distri-
butions based on the Stage 3 sample. Corresponding sections of Figure 3 show distributions of
19

simulated 18-hole scores. One striking observation from the distributions is the higher average
score of non-PGA TOUR players entering Stage 3 compared with Stage 2. However, from Table 3,
we can see that once having reached Stage 3, those who entered Q-School in Stage 2 have tended
to be more successful than players who began Q-School play in Stage 3. In order for our simulated
Q-School results to have this same property, non-TOUR players who enter Q-School in Stage 3
must be less skilled, on average, than those who enter in Stage 2.
9. Simulation Results
9.1. Qualifying Success Rates
We split Q-School participants into groups of 25 players based on mean skill and estimate the
frequency of success in Q-School for each player group across 1,000 trials of the simulation. We
place the 25 most highly-skilled players per simulation trial in group 1, the next 25 most highly-
skilled players in group 2, etc. through group 20. We then lump all the remaining players, those
ranked 501 to 1,286, into group 21.
We break participants into groups of 25 since, as of 2008, the lowest 25 finishers and ties at the
conclusion of play in Stage 3 qualify for the PGA TOUR. (In 2007 the number of qualifiers was 30
and ties.) The remainder of players in Stage 3 are eligible for Nationwide Tour membership. The
next number of finishers closest to 50 qualify as “fully-exempt” members of the Nationwide Tour,
eligible to play in any Nationwide Tour event the following year. The remaining Stage 3 participants
become partially-exempt Nationwide players. Ideally, the 25 most highly skilled players among the
1,286 would have high probability of qualifying for the TOUR.
As shown in Table 9, which provides qualifying success rates for each of the 21 player groups,
this is not the case. Only 33.0% of the 25 most highly-skilled Q-School participants finish Stage
3 among the 25 lowest scoring players. Among those finishing among the lowest-scoring 25, only
eight players would have come from skill group 1.
By finishing among the lowest-scoring 75, 59.9% of the players in group 1 would have done no
worse than earning fully-exempt Nationwide status, and by participating in Stage 3, 72.7% would
have done no worse than earning a partial exemption on the Nationwide Tour. The remaining
27.3% would have earned nothing more than the right to enter Q-School the following year in Stage
20

1 (see Figure 1).
As one would expect, the qualifying success rates fall monotonically by skill group. Taking
groups 1-3 together, only 35.5/75 = 47.3% of the 75 most highly-skilled players in Q-School com-
petition would have finished among the 75 lowest-scoring players at the end of Stage 3.
Although the qualifying success rates in individual skill categories 4-21 are not high, collectively
we see that many players of low skill finish among the lowest scoring 25 who would have qualified
for the TOUR, many would have earned no worse than fully-exempt Nationwide status, and at least
12.1% in each of skill groups 1-20 would have done no worse than earn partially-exempt Nationwide
status. In fact, 3.4% of the players ranked 501 to 1,286 (those in skill group 21) would have earned
the right to play on the Nationwide Tour in some capacity, while 100%− 72.7% = 27.3% of the 25
most highly-skilled players would not have earned that right.
Note that 0.1% of the players in group 21 finish among the lowest 25 scoring players in Stage
3, equivalent to almost one player per year. Moreover, 27.0 players among the 163 Stage 3 players
who, by participating in Stage 3, would earn no worse than partially-exempt Nationwide status
(16.7%), would have come from those ranked 501 or worse.
9.2. Success Rates for ‘The Next Tiger Woods’ and Five Other Highly-SkilledPlayers
It is interesting to consider how well players of skill comparable to that of Tiger Woods and other
high-skilled PGA TOUR professionals, as estimated over the 2003-2009 period, would fare if they
had to begin Q-School in Pre-qualifying. To address this question, we replace six randomly-selected
players in Pre-qualifying with scoring characteristics comparable to Tiger Woods and five other
“good” players. In each simulation trial, the first “good” player is a player whose simulated score
is drawn from the distribution of Tiger Wood’s scores from the 2004-2008 PGA TOUR sample.
The second good player is a player with scoring characteristics identical to that of a player selected
randomly from skill positions 2-21 among the 303 players in the 2004-2008 PGA TOUR sample. In
determining these skill positions, a player’s skill is defined as the average value of his spline-based
mean 18-hole score as estimated over the entire 2004-2008 PGA TOUR sample period. The third
good player is selected randomly from skill positions 22-41, etc., with the sixth selected randomly
from positions 82-101. While it is unrealistic to assume that a ‘Tiger Woods’ will come along every
21

year, it is not unrealistic to assume that players like those in quintiles 1-5 will enter Pre-qualifying
on a regular basis. Otherwise, there would be no permanent talent pool on the TOUR. Simulated
mean skill levels and variation in scoring among the six good players are determined using the same
sampling procedure described in Section 8.1 for PGA TOUR players entering Q-School in Stages 2
and 3, except that skill levels for these players are drawn from their entire estimated splines rather
than from smaller spline segments.
Histograms showing the distributions of skill and 18-hole scores for the “good” player group
are shown on the far left of Figures 2 and 3. Note that the skill distribution clearly is bimodal,
reflecting that players with Tiger Woods’ scoring characteristics are substantially more skilled than
the other “good” players. Also note that as a group, the mean score in the “good” player group is
71.58 − 70.14 = 1.44 strokes less than that of players in the next-most highly-skilled group, PGA
TOUR players entering Q-School in Stage 3.
If Q-School is working properly, we believe that a player of Tiger Wood’s ability who enters
Q-School in the Pre-qualifying stage should almost always qualify to play on the PGA TOUR.
Moreover, one would hope that players of skill comparable to those in skill positions 2-101 on the
PGA TOUR should have little trouble qualifying. Panel A of Table 10 summarizes the probabilities
of making it through the four stages of Q-School for players of Tiger’s Wood’s ability and for
randomly selected players from quintiles 1-5. In Table 10, “making it to the next stage” from
Stage 3 refers to finishing among the lowest scoring 31, the average number of qualifiers over the
2006-2008 period.
Not surprisingly, a player with skill comparable to that of Tiger Woods would earn his TOUR
card 99.3% of the time. However, the qualifying success rate for those in quintile 1 is only 68.8%.
Moreover, less than half of the players in quintiles 3-5 earn TOUR cards, with those in quintile 5
qualifying for the TOUR only 28.7% of the time.
It should be noted that all of the success rates shown in Table 10 are conditional upon a
Tiger-type player and players in all five quintile groups playing simultaneously in the Q-School
competition. Therefore, the success rates for each of the six player groups should be lower than
if no other groups were included. However, the estimated success rates are not much lower. For
example, with all six groups in the competition, 68.8% of the players in quintile 1 earn TOUR
cards. Although not shown in the table, if players in quintile 1 are the only “good” players in
22

Q-School competition, their success rate increases to 71.1%.
Note that among players comparable to Tiger Woods and the players in the various quintile
groups, very few are eliminated from Q-School competition in Pre-qualifying. However, starting in
Stage 1, many players other than the Tiger-type player start to get knocked out. In fact, by the end
of Stage 1, about 15% of the players in quintiles 4 and 5 are eliminated from Q-School. Generally,
these players are being eliminated by lesser-skilled players who have experienced favorable random
variation in their performance.
The tendency for favorable variation to be a determining factor in Q-School qualifying success
could be reduced if the number of rounds of play per stage of Q-School were increased. Panel B of
Table 10 summarizes success rates for a player comparable to Tiger Woods and players in quintiles
1-5, assuming that the number of rounds per stage is doubled. Here we observe higher qualifying
success rates (e.g., 83.0% vs. 68.8% for quintile 1 and 42.3% vs. 28.7% for quintile 5), but rates
that are lower than what we believe most would consider to be acceptable.
9.3. Success Rates for the Top 25 Players in the 2004-2008 PGA TOUR Sample
We now conduct a number of separate simulations where, in each simulation, we replace a single
randomly selected player in pre-qualifying with a player whose scoring profile is identical to that of
one of the 25 most highly-skilled players in the PGA TOUR sample. For the purposes of identifying
the 25 players, a player’s skill is defined as the average value of his spline-based mean 18-hole score
as estimated over the 2004-2008 period. We also show simulation results for Q-School participants
with scoring profiles equivalent to eight well-known players who are not as highly ranked.
Table 11 summarizes estimated success rates for each of the 33 players in each stage of Q-School,
listed in the order of mean spline-based estimated skill. The standard deviation of η errors for each
player is shown along with the first-order autocorrelation coefficient associated with his θ errors,
denoted as ρ.
Among those entering Q-School in Pre-qualifying with skill comparable to a top-25 player, the
median qualifying rate is only 64.1%. Individual qualifying success rates are not strictly monotonic
with average spline values. For example, a player with Darren Clarke’s scoring characteristics, the
16th ranked player, has the lowest qualifying success rate, 48.5%, among the top 25. As such, the
rates of qualifying success among the 33 players reflect a combination of mean skill, round-to-round
23

variation in scoring, autocorrelation in θ errors, and variation in mean skill within each player’s
spline-based skill function. Generally, it appears that higher standard deviations of η errors and
higher first-order autocorrelation in residual θ errors are associated with lower qualifying success
rates.
We believe that most who follow golf would find it disturbing that a player with Phil Mickelson’s
scoring characteristics would have only an 87.8% chance of earning his TOUR card and that the
next Ernie Els’ would have only an 80.5% of qualifying for the TOUR. If a player like Mike Weir,
the last listed among the top 25, enters Q-School in Pre-Qualifying, his qualifying success rate is
estimated to be only 53.5%.
Players entering Pre-qualifying with scoring characteristics comparable to lesser-ranked players
Camilo Vilegas, Boo Weekley, Chad Campbell, Lucas Glover, Sean O’Hair, and Brian Gay would
have no more than a 43% chance of qualifying for the TOUR. But we believe these estimated
success rates are quite realistic. For example, it took Sean O’Hair, ranked 15th in the Official
World Golf Rankings as of July 26, 2009 and 7th in the Rankings among American golfers, six tries
in Q-School between 1999 and 2004 before qualifying for the PGA TOUR. Since earning his TOUR
card, O’Hair has won three PGA TOUR events. Similarly, Zach Johnson, ranked 23rd and 10th
among American golfers, spent five years in Q-School between 1998 and 2002, with his best finish
coming in 2002, a tie for 94th in Stage 3. This earned Johnson a partial exemption on the 2003
Nationwide Tour, where he finished in first place, thereby earning the right to play on the PGA
TOUR starting in 2004. Since then, he has won seven times on the PGA TOUR, including the
2007 Masters Tournament. Among highly-ranked young American golfers, including Lucas Glover,
who spent two years in Q-School and one on the Nationwide Tour before joining the PGA TOUR
in 2004 and winning the 2009 U.S. Open, Anthony Kim is the only player to have earned his TOUR
card on his first attempt in Q-School.
10. Alternative Q-School Structures
Except for stage 3, each stage of Q-School is conducted in separate competitions, with winners
at each competition site advancing to the next stage. For example, in our prototypical Q-School
structure, summarized in Table 7, Pre-qualifying is conducted at six separate tournament sites,
24

with a total of 397 players competing for 213 spots in Stage 1 competition. (In the literature of
contest design, such a structure is known as a “subcontest”(Fu and Lu (2009), p. 147)). However,
since the 213 winning players are determined in six separate Pre-qualifying competitions, the 213
players who played the best in Pre-qualifying do not necessarily qualify for Stage 1. In our first
test of alternative Q-School structure, we estimate the probabilities that highly-skilled players are
eliminated in Q-School competition because they happened to have been assigned to tournament
sites for which they had lower chances of advancing.
To do so, we restructure our simulations into a series of “grand contests,” so that each stage
of Q-School is conducted at a single tournament site. Such a structure guarantees that the lowest-
scoring players in each stage earn next-stage qualifying positions, although it does not guarantee
that the most highly-skilled players in each stage get to advance. We run the simulations two ways,
first without seeding Pre-qualifying with any special players with scoring characteristics comparable
to specific PGA TOUR players and second, by including ‘Tiger Woods’ and players from quintiles
1-5, as in Table 10. As it turns out, the qualifying success rates are essentially the same as those
obtained when Q-School is conducted using the prototype structure. Therefore, we conclude that
using a number of separate tournament sites for stage qualifying is not a significant factor in strong
players being eliminated in Q-School competition.
We also consider a Q-School structure in which all players compete in a single stage in multiple
rounds on the same course. Such a structure would solve the problem of strong players being elim-
inated from competition prior to Stage 3 and also the minor problem, addressed above, associated
with conducting Pre-qualifying through Stage 2 at multiple tournament sites.
Panel A of Table 12 shows qualifying success rates for skill groups 1-6 when Q-School is con-
ducted with the prototypical structure summarized in Table 7. Throughout the table, success rates
are shown with and without the inclusion of ‘the next Tiger Woods’ and players from quintiles
1-5. Panel B shows success rates when Q-School is conducted in a single stage on a single course
over 18 rounds, the same number of total rounds in the prototype structure. In the single-stage
structure, the equivalent to reaching Stage 3 is finishing among the lowest scoring 163 players, the
same number of Stage 3 players in the prototype structure.
Comparing Panels A and B, we see that conducting Q-School over 18 rounds of play at a
single tournament site, rather than over 18 rounds in four stages of single elimination competition,
25

increases the probability that the 25 most highly-skilled players in Q-School will end up among
the 25 players with the lowest scores. For example, when ‘the next Tiger Woods’ and players
from quintiles 1-5 are not included, the probability of finishing among the lowest scoring 25 players
increases from 33.0% to 43.2% for players in skill group 1. When ‘Tiger’ and his five counterparts
are included, the probability increases from 38.0% to 49.3%.
We also consider the effects of doubling the number of tournament rounds from 18 to 36 (Panel
C) and, again, from 36 to 72 (Panel D). With 72 rounds of play, 65.3% of those in skill group 1
finish among the lowest scoring 25 when ‘Tiger’ and counterparts are not competing, and 70.5%
finish among the lowest scoring 25 when the Tiger group is competing. With or without the Tiger
group, almost all players in group 1 finish among the lowest scoring 163, meaning that they would
at least earn partially-exempt status on the Nationwide Tour.
Although qualifying success rates are improved when the number of rounds of tournament play
rises, less than 2/3 of the players in skill group 1, the 25 most highly-skilled players in Q-School
competition, would finish among the lowest scoring 25 after 72 rounds of play when ‘Tiger’ and
counterparts are not included in the competition. Thus, even after 72 rounds of competition, it
would not be possible to identify the 25 most highly skilled players with a high level of precision.
There is no practical way to conduct Q-School for 72 rounds on a single course. However,
competition for a full year on the Nationwide Tour roughly approximates such a scenario, albeit
with fewer competitors. In 2008, the 75 leading money winners on the Nationwide Tour averaged
74 18-hole rounds of play over the 2008 season, approximately the same as the 72 rounds in our
alternative Q-School structure. PGA TOUR cards are awarded to the 25 leading money winners on
the Nationwide Tour, which is not exactly the same as the 25 players with the lowest total scores
over 72 rounds. Moreover, not all Nationwide players participate in the same events, they often
miss cuts and are eliminated from individual tournaments, and money winnings are highly non-
linear in scoring. Nevertheless, we believe that Nationwide competition is much closer in structure
to our 72-round single-stage structure than regular Q-School structure conducted in four stages at
multiple tournament sites. In this respect, it is not surprising that players who have earned their
TOUR cards through Nationwide competition have tended to be more successful than those who
earned their cards through Q-School.
26

11. Summary and Conclusions
This study uses simulation to estimate Type I and Type II error rates associated with the Q-School
qualifying mechanism employed by the PGA TOUR to identify golfers of high skill to join the
TOUR. We calibrate the simulations to reproduce success rates of golfers and standard deviations
of scoring actually observed in the various stages of the Q-School qualifying process.
From simulation, we estimate that the current Q-School qualifying structure lead to high Type
I and II errors. For example, we find that the median estimated qualifying success rate for golfers of
skill comparable to that of the 25 most highly skilled players on the PGA TOUR is only 64.1%, but
that many players of substantially less skill could qualify for the TOUR in a given year. Although
skill plays a substantial role in determining qualifying success rates, for example, a player of Tiger
Woods’ ability, as estimated over the 2003-2009 period, would get through virtually all the time,
random variation in scoring also plays a substantial role. This suggests that in any given year, one
would expect a portion of those who play in the final stage of Q-School and end up qualifying for
the TOUR would be less skilled relative to final stage participants who only qualify to play on the
Nationwide Tour. This helps to explain why the long-term success of golfers who qualify for the
PGA TOUR through Q-School is not as high as that of golfers who qualify for the Tour through
the Nationwide Tour.
We explore the impact of alternative Q-School structures on the efficiency of the Q-School
qualifying process. We find that a single-stage tournament conducted with substantially more
rounds than the 18 in the current structure would be a more efficient mechanism for identifying
high-skill golfers. Although impractical, this finding is consistent with the prediction in Ryvkin and
Ortmann (2008) that a longer tournament should be the most efficient. This alternative structure
resembles reasonably well the current Nationwide Tour, where the top 25 money winners over a
season of nearly 30 tournaments automatically qualify to play the next season on the PGA TOUR.
The existing PGA TOUR qualification process has some features that we have not explored
in detail here. As we noted in the introduction, the PGA TOUR seems to have recognized that
Q-School and the Nationwide Tour both play an important role in identifying high-skill golfers for
participation on the TOUR. Over the past few years, the PGA TOUR has changed the allocation
of TOUR cards among Q-School and Nationwide qualifiers. Although the optimal allocation of
27

TOUR cards to each qualifying mechanism isn’t known, an extension of the simulation framework
developed in this study could prove useful for making this assessment.
Finally, it seems to us that through Q-School, and partially through the Nationwide Tour, the
PGA TOUR is attempting to solve the general problem of human performance evaluation, given
limited track records, that faces virtually all organizations. These evaluation activities are typically
constrained by time, money, and other resources. But unlike Q-School and the Nationwide Tour,
the systems of performance evaluation found in organizations may be far more complex and am-
biguous. Compared with human performance evaluation activities found in academic departments,
professional service firms, internship programs and other settings, the fixed set of rules associated
with the Q-School selection metric provides a level of simplicity not likely to be found in the afore-
mentioned settings. To the extent that our findings generalize into such settings, our results raise
serious questions as to whether typical tournament-style selection mechanisms generate the right
outcomes in noisy and ambiguous environments. We believe that further study of these issues is
both intellectually challenging and of immense practical value.
28

Appendix
A. Scoring Distribution Modification Process for Non-PGA TourPlayers
We summarize the process by which we produce scoring distributions for non-PGA Tour players inQ-School in (1) through (6) below.
hi,j = µj + κj
(hi,j,k(i,j) − µj
)+ φj (1)
µj =
{µ∗2, for j = 0, 1, 2µ∗3, for j = 3
(2)
σ̂i,j,k(i,j) = −1.5169 + 0.0599hi,j,k(i,j) (3)
σ̂i,j = αj + βjhi,j (4)
ξi,j = σ̂i,j/σ̂i,j,k(i,j) (5)
θi,j = θi,j,k(i,j)ξi,j (6)
In (1) through (6), the subscript i denotes a player in a simulation trial who enters Q-Schoolin Stage j = 0, ..., 3, with Stage 0 denoting Pre-qualifying. If the player’s entry stage is 0, 1, or2, his level of skill and variation in scoring is based on that of a randomly drawn player (withreplacement) among 161 in the sample of Stage 2 players coming from the Tour, denoted as playerk(i,j ). The population mean of possible spline values that could be drawn from this group is µ∗2.If the player enters Q-School in Stage 3, his level of skill and variation in scoring is based on thatof a randomly drawn player among 86 in the sample of Stage 3 players coming from the Tour, alsodenoted as player k(i,j ). The population mean of possible spline values that could be drawn fromthis group is µ∗3. For expositional convenience, henceforth we will refer to the appropriate Stage 2or Stage 3 PGA Tour sample as player i ’s “base sample.”
In (1), hi,j,k(i,j) denotes a mean skill level drawn randomly from the spline of the k(i,j )th playerin the i th competitor’s base sample. This becomes the base skill level from which Q-School player i ’smean skill level and variation in scoring is derived. When κj > 1, the µj +κj
(hi,j,k(i,j) − µj
)portion
of (1) has the effect of widening the distribution of potential mean skill levels drawn initially fromthe base sample while preserving the population mean of the base sample from which the randomskill level is drawn. Similarly, when κj < 1, the effect is to narrow the distribution of potential meanskill levels. The idea in using this spreading device is that for some entry stages, the distributionof mean skill levels might be more disperse than that associated with PGA Tour players enteringQ-School in the stage from which the skill level of the i th Q-School competitor is derived. We alsoinclude a mean displacement parameter, φj , which allows the overall population mean score forQ-School participants in a given entry stage to be higher or lower than that of its associated basesample.
The coefficients −1.5169 and 0.0599 in (3) are the intercepts and slopes of a least squares
29

regression of the standard deviation of η errors on mean spline-based skill levels across the 303players in the 2004-2008 PGA Tour sample, with adjusted R2 = 0.055 and p < 0.0001. Consistentwith this relationship, when a Q-School participant’s simulated mean skill level is higher than themean skill level drawn randomly from the spline of the k(i,j )th player in the i th competitor’s basesample (i.e., when hi,j > hi,j,k(i,j)), the θ and η errors which drive the random component associatedwith player i ’s simulated score should be more disperse than those of player k(i,j ). In (3) through(6) we adjust both η and θ errors in our simulations (since η errors are the primitives of θ errors) tocapture this general relationship, while allowing the slope and intercept describing the relationshipbetween the standard deviation of η errors and mean skill to vary by entry stage.
To simulate random variation in scoring for Q-School participant i, we select a starting θ errorat random from the distribution of player k(i,j )’s θ errors estimated over the entire 2004-2008 PGATour sample period. We then select 28 of player k(i,j )’s η errors at random (with replacement).Using the initial θ error, the 28 randomly-selected modified η errors, and player k(i,j )’s first-orderautocorrelation coefficient as estimated in connection with the Connolly-Rendleman (2008) model,we compute a sequence of 28 estimated θ errors. We then multiply the 28 θ errors by ξi,j , as in (6),to obtain a set of modified θ errors. We apply the last 18 modified θ errors to player i ’s randomlyselected mean skill level, yielding a sequence of 18 simulated 18-hole scores for player i.
We model Pre-qualifying entrants as a bimodal group. The proportion γ of Pre-qualifyingentrants is assumed to come from a group of lesser-skilled players who have only a minimal chanceof qualifying for the Tour, while the proportion 1− γ of Pre-qualifying entrants are assumed to be‘legitimate’ players. In our simulations, both groups can have their own unique values of simulationparameters φ0, α0 and β0. We assume that κ0 is the same for both groups.
We calibrate our simulations by choosing a value of the parameter γ, together with parametervalues κj , φj , αj and βj for entry stages 0,...,3, including separate parameter values of φ0, α0 andβ0 for the two groups of Pre-qualifying entrants, to produce simulated qualifying success rates andsimulated standard deviations of ‘neutral’ scores per playing stage/entry stage category that closelyapproximate those observed empirically. Simulated scores are neutral with respect to both randomround-course and player-course effects, which are very small, while the empirical distribution ofQ-School scoring is neutral only with respect to round-course effects. Appendix Table 1 provides asummary of parameter values employed in the simulations.
Appendix Table 1: Parameters of Calibrated Simulation Model
Entry StagePre-Qualifying
Parameter Legitimate Lesser-Skilled Stage 1 Stage 2 Stage 3φ 1.92 7.30 0.99 0.18 1.20κ 1.16 1.16 1.225 1.50 1.10α -63.20 -67.71 -31.85 15.84 -1.52β 0.8982 0.8982 0.4791 -0.1796 0.0599γ n/a 0.25 n/a n/a n/a
30

B. Sensitivity to Parameter Selection
In this section we explore the sensitivity of qualifying success rates to the selection of simulationparameters. Appendix Table 2 summarizes qualifying success rates for skill groups 1-6 for eightdifferent parametrization schemes. In the simulations underlying Appendix Table 2, we employthe prototype Q-School structure summarized in Table 7 of the main paper and do not seed Pre-qualifying with any highly-skilled players from the PGA Tour such as Tiger Woods and playersfrom quintiles 1-5.
Panel A of Appendix Table 2 shows the same success rates for skill groups 1-6 as reported inTable 10 of the main paper. In Panel B, all κ values are set to 1.0, which has the effect of notspreading the distributions of mean scores for non-PGA Tour players relative to those of the basePGA Tour samples from which they are drawn. β values are all set to 0.0597 and α values set to−1.5056, which has the effect of basing the relationship between the standard deviation of η errorsand mean player skill on the least-squares regression, Equation 4, without modification. Althoughnot shown in the table, this alternative parametrization substantially reduces the standard deviationof round-course-adjusted scores. Nevertheless, the qualifying success rates are hardly any differentfrom those associated with the calibrated parameters.
In Panel C, the qualifying success rates reflect the calibrated parametrization, except that Pre-qualifying does not include a group of players who have no realistic chance of qualifying for theTour. Again, the qualifying success rates are essentially the same as those associated with thecalibrated parameters.
In Panel D, the qualifying success rates reflect the calibrated parametrization, except that allα values are increased by 1.0. This has the effect of increasing the standard deviation of round-course-adjusted scores. Here, the qualifying success rates are generally lower than those associatedwith the standard parametrization, since more lesser-skilled players can ‘luck out’ and qualify forthe Tour.
In Panel E, the qualifying success rates reflect the calibrated parametrization, except that allmean displacement values, φ, are doubled. This creates a greater difference in skill among playergroups, thereby increasing the success rates of the most highly-skilled players. Nevertheless, thesesuccess rates are not so much higher that we would change the basic conclusions of this study.
In Panel F, the qualifying success rates reflect the calibrated parametrization, except that allmean displacement values, φ, are halved. This creates a smaller difference in skill among playergroups, thereby decreasing the qualifying success rates of the most highly-skilled players.
In Panel G, the qualifying success rates reflect the calibrated parametrization, except that all κvalues are doubled. This has the effect of creating a significant amount of spread in the distributionsof mean scores for non-PGA Tour players relative to those of the base PGA Tour samples fromwhich they are drawn, thereby creating substantially greater differences in skill between highly-skilled and lesser-skilled players. As a result, qualifying success rates are substantially higher thanthose associated with the standard parametrization. But again, we do not believe that these successrates so high that we would change the basic conclusions of this study.
Finally, in Panel H, the qualifying success rates reflect the standard parametrization, exceptthat all κ values are halved. This has the effect of creating substantially less spread betweenthe distributions of mean scores for non-PGA Tour players relative to those of the base PGA Toursamples from which they are drawn. Here, the qualifying success rates are not qualitatively differentfrom those of the base case.
Taken as a whole, our general conclusion that many highly-skilled players would not qualify forthe PGA Tour through Q-School appears to be relatively insensitive to the calibration parametersemployed in our simulations.
31
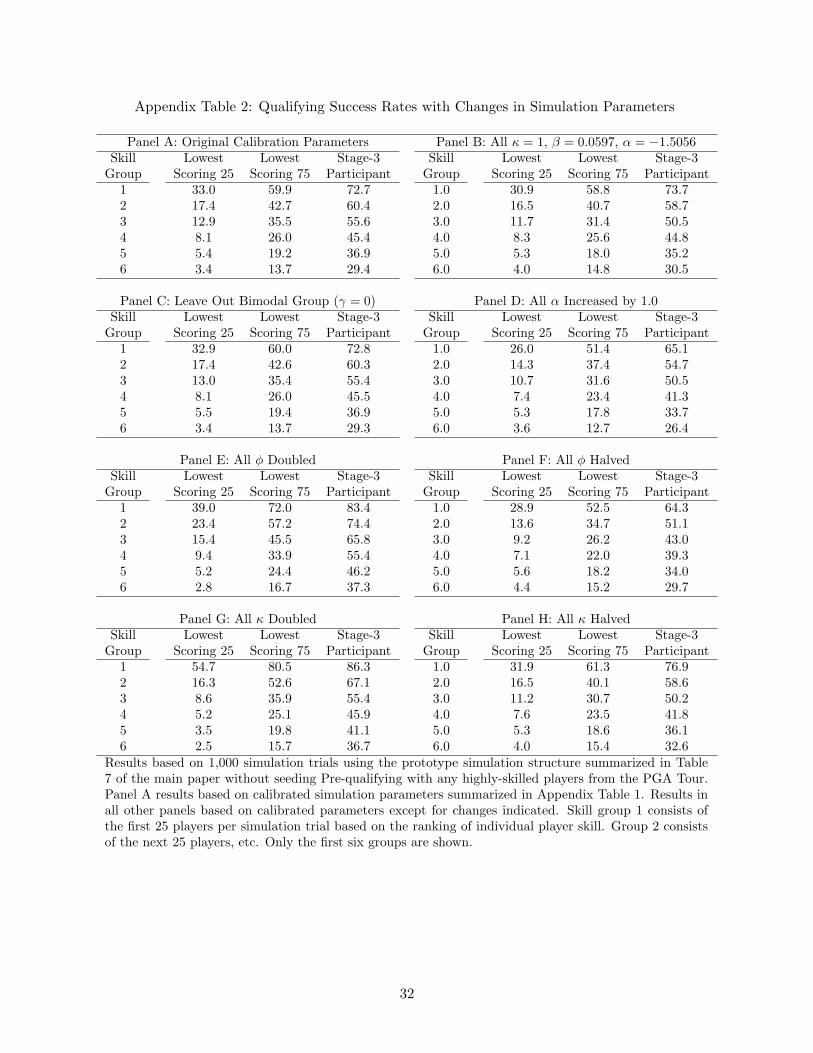
Appendix Table 2: Qualifying Success Rates with Changes in Simulation Parameters
Panel A: Original Calibration Parameters Panel B: All κ = 1, β = 0.0597, α = −1.5056Skill Lowest Lowest Stage-3 Skill Lowest Lowest Stage-3
Group Scoring 25 Scoring 75 Participant Group Scoring 25 Scoring 75 Participant1 33.0 59.9 72.7 1.0 30.9 58.8 73.72 17.4 42.7 60.4 2.0 16.5 40.7 58.73 12.9 35.5 55.6 3.0 11.7 31.4 50.54 8.1 26.0 45.4 4.0 8.3 25.6 44.85 5.4 19.2 36.9 5.0 5.3 18.0 35.26 3.4 13.7 29.4 6.0 4.0 14.8 30.5
Panel C: Leave Out Bimodal Group (γ = 0) Panel D: All α Increased by 1.0Skill Lowest Lowest Stage-3 Skill Lowest Lowest Stage-3
Group Scoring 25 Scoring 75 Participant Group Scoring 25 Scoring 75 Participant1 32.9 60.0 72.8 1.0 26.0 51.4 65.12 17.4 42.6 60.3 2.0 14.3 37.4 54.73 13.0 35.4 55.4 3.0 10.7 31.6 50.54 8.1 26.0 45.5 4.0 7.4 23.4 41.35 5.5 19.4 36.9 5.0 5.3 17.8 33.76 3.4 13.7 29.3 6.0 3.6 12.7 26.4
Panel E: All φ Doubled Panel F: All φ HalvedSkill Lowest Lowest Stage-3 Skill Lowest Lowest Stage-3
Group Scoring 25 Scoring 75 Participant Group Scoring 25 Scoring 75 Participant1 39.0 72.0 83.4 1.0 28.9 52.5 64.32 23.4 57.2 74.4 2.0 13.6 34.7 51.13 15.4 45.5 65.8 3.0 9.2 26.2 43.04 9.4 33.9 55.4 4.0 7.1 22.0 39.35 5.2 24.4 46.2 5.0 5.6 18.2 34.06 2.8 16.7 37.3 6.0 4.4 15.2 29.7
Panel G: All κ Doubled Panel H: All κ HalvedSkill Lowest Lowest Stage-3 Skill Lowest Lowest Stage-3
Group Scoring 25 Scoring 75 Participant Group Scoring 25 Scoring 75 Participant1 54.7 80.5 86.3 1.0 31.9 61.3 76.92 16.3 52.6 67.1 2.0 16.5 40.1 58.63 8.6 35.9 55.4 3.0 11.2 30.7 50.24 5.2 25.1 45.9 4.0 7.6 23.5 41.85 3.5 19.8 41.1 5.0 5.3 18.6 36.16 2.5 15.7 36.7 6.0 4.0 15.4 32.6
Results based on 1,000 simulation trials using the prototype simulation structure summarized in Table7 of the main paper without seeding Pre-qualifying with any highly-skilled players from the PGA Tour.Panel A results based on calibrated simulation parameters summarized in Appendix Table 1. Results inall other panels based on calibrated parameters except for changes indicated. Skill group 1 consists ofthe first 25 players per simulation trial based on the ranking of individual player skill. Group 2 consistsof the next 25 players, etc. Only the first six groups are shown.
32
References
Appleton, David R., 1995, May the Best Man Win? The Statistician 44, no. 4:529 - 538.
Berry, Scott M. 2001. How Ferocious is Tiger. Chance 14, no. 3:51-56.
Berry, Scott M., C. Shane Reese and Patrick D. Larkey. 1999. Bridging Different Eras in Sports.Journal of the American Statistical Association 94, no. 447:661-676.
Birkinshaw, Julian. 2001. Strategies for Managing Internal Competition. California ManagementReview 44, no. 1:21 - 38.
Brown, Jennifer. 2010. Quitters Never Win: The (Adverse) Incentive Effects of Competing withSuperstars. Unpublished manuscript, Kellogg Graduate School of Management, Northwestern Uni-versity, Evanston, IL.
Caulkins, Jonathan P., Arnold Barnett, Patrick D. Larkey, Yuehong Yuan, Jesse Goranson. 1993.The On-Time Machines: Some Analyses of Airline Punctuality. Operations Research 41, no. 4:710-720.
Clarke, S. R., J. M. Norman, and C. B. Stride. 2009. Criteria for a Tournament: the WorldProfessional Snooker Championship. Journal of the Operational Research Society 60, no. 12:1670- 1673.
Connolly, Robert A. and Richard J. Rendleman, Jr.. 2008. Skill, Luck and Streaky Play on thePGA Tour. The Journal of The American Statistical Association 103, no. 1:74-88.
Connolly, Robert A. and Richard J. Rendleman. 2009. Dominance, Intimidation and ‘Choking’ onthe PGA Tour. Journal of Quantitative Analysis in Sports 5, no. 3:1-32.
Davenport, Thomas H. and John C. Beck. 2000. Getting the Attention You Need. HarvardBusiness Review 78, no. 5:118 - 126.
David, H. A. 1998. The Method of Paired Comparisons. Oxford Press, New York.
Frick, Bernd. 2003. Contest Theory and Sport. Oxford Review of Economic Policy 19, no. 4:512 -529.
Gibbons, Jean Dickinson, Ingram Olkin, and Milton Sobel. 1977. Selecting and Ordering Popula-tions: A New Statistical Methodology. Wiley, New York.
Fu, Qiang and Jingfeng Lu. 2009. The Beauty of Bigness: On Optimal Design of Multi-WinnerContests. Games and Economic Behavior 66, no. 1:146-161.
Hvide Hans K. and Eirik G. Kristiansen. 2003. Risk Taking in Selection Contests. Games andEconomic Behavior 42, no. 1:172 - 179.
Lazear, Edward P. and Sherwin Rosen. 1981. Rank-Order Tournaments as Optimum Labor Con-tracts. Journal of Political Economy 89, no. 5:841-864.
Ljung, G. M. and Box, G. E. P. 1978. On a Measure of Lack of Fit in Time Series Models.Biometrika 65, no. 2:297-303.
McGarry, T. and R. W. Schutz. 1997. Efficacy of Traditional Sport Tournament Structures.Journal of the Operational Research Society 48, no. 1:65 - 74.

McLaughlin, Kenneth J. 1988. Aspects of Tournament Models: A Survey. Research in LaborEconomics 9, no. 1:225 - 256.
Narayana, T. V., 1979, Lattice Path Combinatorics with Statistical Applications. University ofToronto Press, Toronto.
Prendergrast, Canice. 1999. The Provision of Incentives in Firms. Journal of Economic Literature37, no. 1:7 - 63.
PGA TOUR. 2008. Application to Enter 2008 PGA TOUR Qualifying Tournament (for the PGATOUR and Nationwide Tour) Conducted by the PGA TOUR.
Rosen, Sherwin. 1986. Prizes and Incentives in Elimination Tournaments. American EconomicReview 76, no. 4:701 - 715.
Ryvkin, Dmitry. 2010. The Selection Efficiency of Tournaments. European Journal of OperationalResearch 206, no. 3:667 - 675.
Ryvkin, Dmitry. and Andreas Ortmann. 2008. The Predictive Power of Three Prominent Tourna-ment Formats. Management Science 54, no. 3:492-504.
Sirak, Ron. 2008. The Rich get Richer: The Money on Tour gets another Boost. No WonderTiger’s Approaching $1 billion. Golf Digest 59, no. 2:96-100.
Wang, Y., 1998, Smoothing Spline Models with Correlated Random Errors. The Journal of TheAmerican Statistical Association 93, no. 1:341-348.

Table 1: World Golf Rankings of 1998-2008 PGA TOUR Qualifiers from Q-School and NationwideTour (7-26-2009 )
World Golf Q-School NW TourRanking N % N %
1-100 29 10.10 20 11.43101-200 24 8.36 20 11.43201-300 25 8.71 17 9.71301-400 22 7.67 26 14.86401-500 18 6.27 12 6.86501-600 16 5.57 10 5.71601-700 14 4.88 11 6.29701-800 16 5.57 8 4.57801-900 10 3.48 4 2.29901-1000 9 3.14 7 4.00
Over 1000 104 36.24 40 22.86
Total 287 100.00 175 100.00
Table 2: Performance of Q-School Entrants, 2006-2008 Combined
Final Stage Reached in 2006Initial Pre- Stage 3Stage Qual Stage 1 Stage 2 NW (PE) NW (FE) PGA TOUR Total
Pre-qual 552 505 121 9 4 0 1,191Stage 1 0 1,288 615 114 57 25 2,099Stage 2 0 0 288 72 49 45 454Stage 3 0 0 0 48 43 24 115Total 552 1,793 1,024 243 153 94 3,859
NW (PE) = Qualified for partially-exempt status on Nationwide Tour, NW (FE) = Qualifiedfor fully-exempt status on Nationwide Tour, PGA TOUR = Qualified for fully-exempt statuson PGA TOUR.

Table 3: Q-School Qualifying Success Rates by Playing Stage/Entry Stage
Playing Stage 2006-2008 CombinedEntry Pre-Stage Qual Stage 1 Stage 2 Stage 3
Pre-qual 0.537 0.210 0.097 0.000Stage 1 0.386 0.242 0.128Stage 2 0.366 0.271Stage 3 0.209
Values in the table represent proportions of participantsplaying in a given stage who qualified for the next stage.The proportions shown advancing from Stage 3 are thosewho earned fully-exempt status on the PGA TOUR byfinishing in the lowest scoring 40, 26 and 28 in 2006-2008,respectively.
Table 4: Normalized Mean Raw Scores by Playing Stage/Entry Stage
Playing Stage 2006-2008 CombinedEntry Pre-Stage Qual Stage 1 Stage 2 Stage 3
Pre-qual 3.457 2.444 2.215 0.749Stage 1 1.496 1.265 0.482Stage 2 0.790 0.054Stage 3 0.000
In each panel, mean scores in each category are normal-ized relative to mean scores in Stage 3 for players whoentered Q-School in Stage 3.

Table 5: Playing-Stage-Normalized Mean Round-Course-Adjusted Scores by Playing Stage/EntryStage
Playing Stage 2006-2008 CombinedEntry Pre-Stage Qual Stage 1 Stage 2 Stage 3
Pre-qual 0.000 0.948 1.482 0.924Stage 1 0.000 0.574 0.368Stage 2 0.000 0.054Stage 3 0.000
In each panel, mean scores in each category are normal-ized relative to mean scores in the category’s playingstage for players who entered Q-School in the same stage.
Table 6: Standard Deviations of Round-Course-Adjusted Scores by Playing Stage/Entry Stage
Playing Stage 2006-2008 CombinedEntry Pre-Stage Qual Stage 1 Stage 2 Stage 3
Pre-qual 4.112 3.175 3.021 2.870Stage 1 3.190 3.039 2.927Stage 2 2.908 2.914Stage 3 2.908
Table 7: 2006-2008 Prototype Q-School Structure Employed in Simulation Calibrations
Qualifiers
Pre-qual Stage 1 Stage 2 Stage 3Total next-stagequalifiers 2006-2008 639 945 375 94
Qualifiers/year* 213 315 125 31Tournament sites 6 12 6 1Qualifiers/tournament site 35.5 26.25 20.83 31
Participants
Pre-qual Stage 1 Stage 2 Stage 3Total participants 2006-2008 1,191 2,738 1,399 490
New entrants/year 397 700 151 38Qualifiers/year from previous stage 0 213 315 125Total participants/year* 397 913 466 163Tournament sites 6 12 6 1Participants/tournament site 66.17 76.08 77.67 163
*Values in first row of panel divided by 3, rounded to the nearest digit.

Tab
le8:
Cal
ibra
tion
:Si
mul
atio
nR
esul
tsvs
.C
hara
cter
isti
csof
Q-S
choo
lSa
mpl
e
Pan
elA
:Q
ualif
ying
Succ
ess
Rat
espe
rP
layi
ngSt
age/
Ent
rySt
age
Sim
ulat
ion
2006
-200
8Q
-Sch
ool
Sam
ple
Sim
ulat
ion
Min
usQ
-Sch
ool
Sam
ple
Ent
ryP
re-
Stag
eQ
ual
Stag
e1
Stag
e2
Stag
e3
Pre
-Qua
lSt
age
1St
age
2St
age
3P
re-Q
ual
Stag
e1
Stag
e2
Stag
e3
Pre
-qua
l0.
537
0.20
90.
096
0.03
70.
537
0.21
00.
097
0.00
00.
000
-0.0
01-0
.001
0.03
7St
age
10.
386
0.24
10.
125
0.38
60.
242
0.12
80.
000
-0.0
01-0
.003
Stag
e2
0.36
80.
269
0.36
60.
271
0.00
2-0
.002
Stag
e3
0.20
40.
209
-0.0
05
Pan
elB
:St
anda
rdD
evia
tion
ofR
ound
-Cou
rse-
Adj
uste
dSc
ores
per
Pla
ying
Stag
e/E
ntry
Stag
eSi
mul
atio
n20
06-2
008
Q-S
choo
lSa
mpl
eSi
mul
atio
nM
inus
Q-S
choo
lSa
mpl
eE
ntry
Pre
-St
age
Qua
lSt
age
1St
age
2St
age
3P
re-Q
ual
Stag
e1
Stag
e2
Stag
e3
Pre
-Qua
lSt
age
1St
age
2St
age
3P
re-q
ual
4.09
73.
176
3.01
62.
874
4.11
23.
175
3.02
12.
870
-0.0
150.
000
-0.0
050.
005
Stag
e1
3.16
93.
046
2.94
03.
190
3.03
92.
927
-0.0
220.
007
0.01
3St
age
22.
900
2.91
52.
908
2.91
4-0
.008
0.00
1St
age
32.
909
2.90
80.
001
Pan
elC
:P
layi
ng-S
tage
-Nor
mal
ized
Rou
nd-C
ours
e-A
djus
ted
Mea
nSc
ores
per
Pla
ying
stag
e/E
ntry
stag
eSi
mul
atio
n20
06-2
008
Q-S
choo
lSa
mpl
eSi
mul
atio
nM
inus
Q-S
choo
lSa
mpl
eE
ntry
Pre
-St
age
Qua
lSt
age
1St
age
2St
age
3P
re-Q
ual
Stag
e1
Stag
e2
Stag
e3
Pre
-Qua
lSt
age
1St
age
2St
age
3P
re-q
ual
0.00
00.
813
1.43
01.
140
0.00
00.
948
1.48
20.
924
0.00
0-0
.135
-0.0
520.
216
Stag
e1
0.00
00.
612
0.35
80.
000
0.57
40.
368
0.00
00.
038
-0.0
10St
age
20.
000
-0.3
410.
000
0.05
40.
000
-0.3
94St
age
30.
000
0.00
00.
000
Res
ults
base
don
1,00
0si
mul
atio
ntr
ials
,us
ing
the
sim
ulat
ion
para
met
ers
sum
mar
ized
inA
ppen
dix
Tab
le1.

Tab
le9:
Qua
lifyi
ngSu
cces
sR
ates
bySk
illG
roup
Per
cent
ages
per
Cat
egor
yby
Skill
Gro
upN
umbe
rof
Pla
yers
per
Cat
egor
yby
Skill
Gro
upSk
illL
owes
tL
owes
tSt
age
3L
owes
t-Sc
orin
g25
Low
est-
Scor
ing
75St
age
3P
arti
cipa
ntG
roup
Scor
ing
25Sc
orin
g75
Par
tici
pant
Pla
yers
Cum
ul.
Pla
yers
Cum
ul.
Pla
yers
Cum
ul.
133
.059
.972
.78.
28.
215
.015
.018
.218
.22
17.4
42.7
60.4
4.3
12.6
10.7
25.7
15.1
33.3
312
.935
.555
.63.
215
.88.
934
.513
.947
.24
8.1
26.0
45.4
2.0
17.8
6.5
41.0
11.4
58.5
55.
419
.236
.91.
419
.24.
845
.89.
267
.86
3.4
13.7
29.4
0.9
20.0
3.4
49.3
7.3
75.1
72.
711
.826
.70.
720
.73.
052
.26.
781
.88
1.9
9.8
22.9
0.5
21.2
2.5
54.7
5.7
87.5
91.
78.
622
.10.
421
.62.
156
.85.
593
.010
1.7
8.0
20.8
0.4
22.0
2.0
58.8
5.2
98.2
111.
46.
718
.10.
422
.41.
760
.54.
510
2.8
121.
26.
318
.00.
322
.71.
662
.14.
510
7.3
131.
25.
616
.70.
323
.01.
463
.54.
211
1.4
141.
04.
815
.50.
223
.21.
264
.73.
911
5.3
150.
94.
615
.00.
223
.51.
265
.83.
711
9.1
160.
94.
414
.80.
223
.71.
166
.93.
712
2.8
170.
84.
014
.20.
223
.91.
067
.93.
612
6.3
180.
64.
014
.30.
224
.01.
068
.93.
612
9.9
190.
63.
312
.70.
124
.20.
869
.73.
213
3.1
200.
52.
711
.90.
124
.30.
770
.43.
013
6.0
210.
10.
63.
40.
725
.04.
675
.027
.016
3.0
Res
ults
base
don
1,00
0si
mul
atio
ntr
ials
,us
ing
the
sim
ulat
ion
para
met
ers
sum
mar
ized
inA
ppen
dix
Tab
le1.
Skill
grou
p1
cons
ists
ofth
efir
st25
play
ers
per
sim
ulat
ion
tria
lbas
edon
the
rank
ing
ofin
divi
dual
play
ersk
ill.
Gro
up2
cons
ists
ofth
ene
xt25
play
ers,
etc.
,w
ith
grou
p20
cons
isti
ngof
play
ers
rank
ed47
6-50
0.G
roup
21co
nsis
tsof
the
last
1,28
6−
500
=78
6pl
ayer
s.

Table 10: Estimated Probabilities of Success at Each Stage of Q-School when ‘Tiger’ and QuintilePlayers Enter Q-School in Pre-Qualifying
Panel A: Standard Q-School StructureStage
Player Pre-Q 1 2 3Tiger 1.000 1.000 0.995 0.993
Quintile 1 0.998 0.952 0.846 0.688Quintile 2 0.998 0.920 0.740 0.497Quintile 3 0.997 0.899 0.643 0.408Quintile 4 0.996 0.875 0.622 0.357Quintile 5 0.994 0.838 0.579 0.287
Panel B: Number of Roundsin Each Stage of Q-School is Doubled
StagePlayer Pre-Q 1 2 3Tiger 1.000 1.000 1.000 1.000
Quintile 1 1.000 0.988 0.924 0.830Quintile 2 0.999 0.975 0.861 0.693Quintile 3 1.000 0.962 0.817 0.566Quintile 4 1.000 0.941 0.762 0.493Quintile 5 0.999 0.943 0.743 0.423Results based on 1,000 simulation trials, usingthe simulation parameters summarized in Ap-pendix Table 1.

Tab
le11
:E
stim
ated
Pro
babi
litie
sof
Succ
ess
atE
ach
Stag
eof
Q-S
choo
lfo
rSe
lect
edP
laye
rsfr
omth
e20
04-2
008
PG
AT
OU
RSa
mpl
e
Skill
Aver
age
Sta
ndard
Est
imate
dP
robabilit
ies
of
Succ
ess
Rank
Pla
yer
Spline
Dev
iati
on
ηρ
Pre
-QSta
ge
1Sta
ge
2Sta
ge
31
Tig
erW
oods
68.0
72
2.4
94
0.0
09
1.0
00
1.0
00
0.9
96
0.9
95
2P
hil
Mic
kel
son
69.1
86
2.6
72
0.0
04
1.0
00
0.9
85
0.9
35
0.8
78
3V
ijay
Sin
gh
69.2
12
2.5
86
0.0
52
1.0
00
0.9
84
0.9
22
0.8
58
4E
rnie
Els
69.3
77
2.6
82
0.0
76
1.0
00
0.9
69
0.9
00
0.8
05
5Jim
Fury
k69.4
74
2.2
86
-0.0
09
1.0
00
0.9
93
0.9
31
0.8
64
6Ser
gio
Garc
ia69.6
09
2.5
06
0.0
22
0.9
99
0.9
82
0.9
23
0.8
32
7L
uke
Donald
69.6
69
2.6
34
0.0
21
1.0
00
0.9
82
0.8
94
0.7
99
8A
dam
Sco
tt69.7
03
3.0
37
0.0
55
0.9
95
0.9
40
0.8
29
0.7
06
9R
etie
fG
oose
n69.9
17
2.7
33
0.0
10
0.9
99
0.9
54
0.8
38
0.6
76
10
Ste
wart
Cin
k69.9
36
2.4
41
-0.0
04
0.9
99
0.9
74
0.8
80
0.7
42
11
Padra
igH
arr
ingto
n70.0
32
2.8
45
0.0
92
1.0
00
0.9
43
0.7
60
0.5
90
12
Dav
idT
om
s70.0
75
2.5
75
0.1
40
0.9
98
0.9
45
0.7
95
0.6
36
13
K.J
.C
hoi
70.1
37
2.6
05
0.0
16
0.9
99
0.9
49
0.8
10
0.6
41
14
Ste
phen
Am
es70.1
45
2.6
69
-0.0
33
0.9
99
0.9
58
0.8
06
0.6
15
15
Sco
ttV
erpla
nk
70.1
57
2.5
16
0.0
48
0.9
98
0.9
45
0.8
18
0.6
48
16
Darr
enC
lark
e70.1
65
3.2
67
0.1
94
0.9
87
0.8
47
0.6
54
0.4
85
17
Stu
art
Apple
by
70.1
85
2.8
25
-0.0
15
0.9
98
0.9
46
0.7
92
0.5
94
18
Anth
ony
Kim
70.1
95
2.7
91
-0.0
36
1.0
00
0.9
35
0.7
86
0.6
16
19
Geo
ffO
gilvy
70.2
00
2.7
21
-0.0
17
0.9
98
0.9
37
0.7
98
0.6
19
20
Rob
ert
Allen
by
70.2
09
2.5
61
-0.0
43
0.9
99
0.9
56
0.8
32
0.6
35
21
Jay
Haas
70.2
27
2.5
81
-0.0
22
0.9
98
0.9
24
0.7
57
0.5
78
22
Just
inR
ose
70.2
28
2.7
97
-0.0
42
1.0
00
0.9
42
0.7
87
0.6
02
23
Lore
nR
ob
erts
70.2
49
2.5
73
-0.2
07
0.9
99
0.9
68
0.8
68
0.6
76
24
Ken
ny
Per
ry70.2
86
2.7
31
0.0
10
0.9
98
0.9
35
0.7
48
0.5
55
25
Mik
eW
eir
70.2
90
2.6
13
0.1
72
1.0
00
0.9
21
0.7
28
0.5
35
26
Zach
Johnso
n70.2
92
2.5
83
-0.0
09
1.0
00
0.9
49
0.7
75
0.5
80
36
Ian
Poult
er70.5
25
2.5
61
-0.0
69
1.0
00
0.9
40
0.7
53
0.5
39
41
Cam
ilo
Ville
gas
70.6
13
2.7
56
0.0
70
0.9
96
0.8
73
0.6
49
0.4
24
45
Boo
Wee
kle
y70.6
20
2.8
08
0.0
36
1.0
00
0.8
93
0.6
68
0.4
27
51
Chad
Cam
pb
ell
70.6
56
2.7
75
0.0
33
0.9
99
0.8
92
0.6
70
0.4
30
59
Luca
sG
lover
70.7
57
2.7
30
0.0
86
0.9
93
0.8
84
0.6
57
0.3
97
62
Sea
nO
’Hair
70.7
74
2.7
35
0.1
43
0.9
96
0.8
65
0.6
20
0.3
69
88
Bri
an
Gay
70.9
69
2.5
80
0.0
16
0.9
98
0.8
55
0.5
51
0.2
91
Res
ult
sbase
don
1,0
00
sim
ula
tion
tria
ls,
usi
ng
the
sim
ula
tion
para
met
ers
sum
mari
zed
inA
pp
endix
Table
1.
ρden
ote
sth
ees
tim
ate
dfirs
t-ord
erauto
corr
elati
on
coeffi
cien
tass
oci
ate
dea
chpla
yer
’sre
sidualθ
erro
rs.
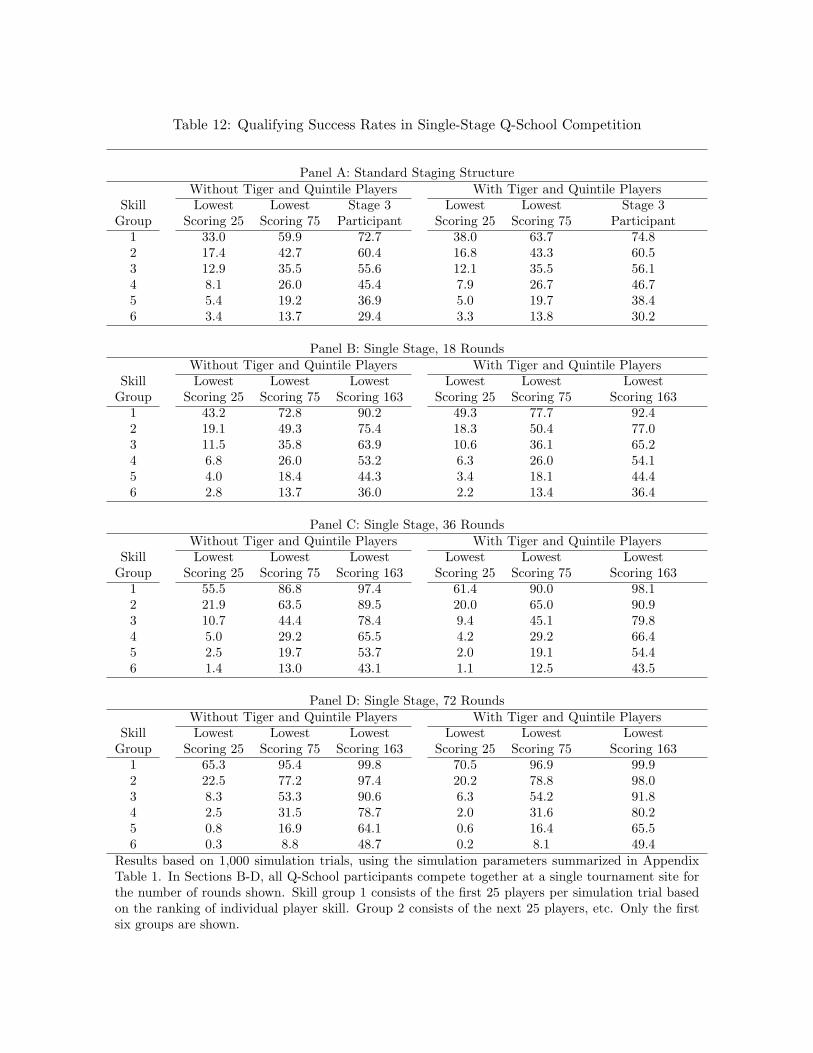
Table 12: Qualifying Success Rates in Single-Stage Q-School Competition
Panel A: Standard Staging StructureWithout Tiger and Quintile Players With Tiger and Quintile Players
Skill Lowest Lowest Stage 3 Lowest Lowest Stage 3Group Scoring 25 Scoring 75 Participant Scoring 25 Scoring 75 Participant
1 33.0 59.9 72.7 38.0 63.7 74.82 17.4 42.7 60.4 16.8 43.3 60.53 12.9 35.5 55.6 12.1 35.5 56.14 8.1 26.0 45.4 7.9 26.7 46.75 5.4 19.2 36.9 5.0 19.7 38.46 3.4 13.7 29.4 3.3 13.8 30.2
Panel B: Single Stage, 18 RoundsWithout Tiger and Quintile Players With Tiger and Quintile Players
Skill Lowest Lowest Lowest Lowest Lowest LowestGroup Scoring 25 Scoring 75 Scoring 163 Scoring 25 Scoring 75 Scoring 163
1 43.2 72.8 90.2 49.3 77.7 92.42 19.1 49.3 75.4 18.3 50.4 77.03 11.5 35.8 63.9 10.6 36.1 65.24 6.8 26.0 53.2 6.3 26.0 54.15 4.0 18.4 44.3 3.4 18.1 44.46 2.8 13.7 36.0 2.2 13.4 36.4
Panel C: Single Stage, 36 RoundsWithout Tiger and Quintile Players With Tiger and Quintile Players
Skill Lowest Lowest Lowest Lowest Lowest LowestGroup Scoring 25 Scoring 75 Scoring 163 Scoring 25 Scoring 75 Scoring 163
1 55.5 86.8 97.4 61.4 90.0 98.12 21.9 63.5 89.5 20.0 65.0 90.93 10.7 44.4 78.4 9.4 45.1 79.84 5.0 29.2 65.5 4.2 29.2 66.45 2.5 19.7 53.7 2.0 19.1 54.46 1.4 13.0 43.1 1.1 12.5 43.5
Panel D: Single Stage, 72 RoundsWithout Tiger and Quintile Players With Tiger and Quintile Players
Skill Lowest Lowest Lowest Lowest Lowest LowestGroup Scoring 25 Scoring 75 Scoring 163 Scoring 25 Scoring 75 Scoring 163
1 65.3 95.4 99.8 70.5 96.9 99.92 22.5 77.2 97.4 20.2 78.8 98.03 8.3 53.3 90.6 6.3 54.2 91.84 2.5 31.5 78.7 2.0 31.6 80.25 0.8 16.9 64.1 0.6 16.4 65.56 0.3 8.8 48.7 0.2 8.1 49.4
Results based on 1,000 simulation trials, using the simulation parameters summarized in AppendixTable 1. In Sections B-D, all Q-School participants compete together at a single tournament site forthe number of rounds shown. Skill group 1 consists of the first 25 players per simulation trial basedon the ranking of individual player skill. Group 2 consists of the next 25 players, etc. Only the firstsix groups are shown.

Fig
ure
1:R
elat
ions
hip
amon
gQ
-Sch
ool,
Nat
ionw
ide
Tou
ran
dP
GA
TO
UR
atth
een
dof
the
2008
seas
on.
Dar
kfr
amed
boxe
sin
dica
teQ
-Sch
ool
qual
ifyin
gst
ages
.W
ithi
nth
ese
boxe
sN/M
indi
cate
sth
atN
play
ers
out
ofa
tota
lof
Mpa
rtic
ipan
tsqu
alifi
edfo
rth
ene
xtst
age
ofQ
-Sch
ool.
Q-S
choo
lP
re-q
ualif
ying
and
stag
es1
and
2co
nsis
tof
four
18-h
ole
roun
ds.
Stag
e3
cons
ists
ofsi
x18
-hol
ero
unds
.P
osit
ions
for
the
PG
Aan
dN
atio
nwid
eT
ours
are
base
don
2008
Offi
cial
Mon
eyw
inni
ngs.
Pos
itio
nsfo
rQ
-Sch
oola
reba
sed
onto
tals
core
.
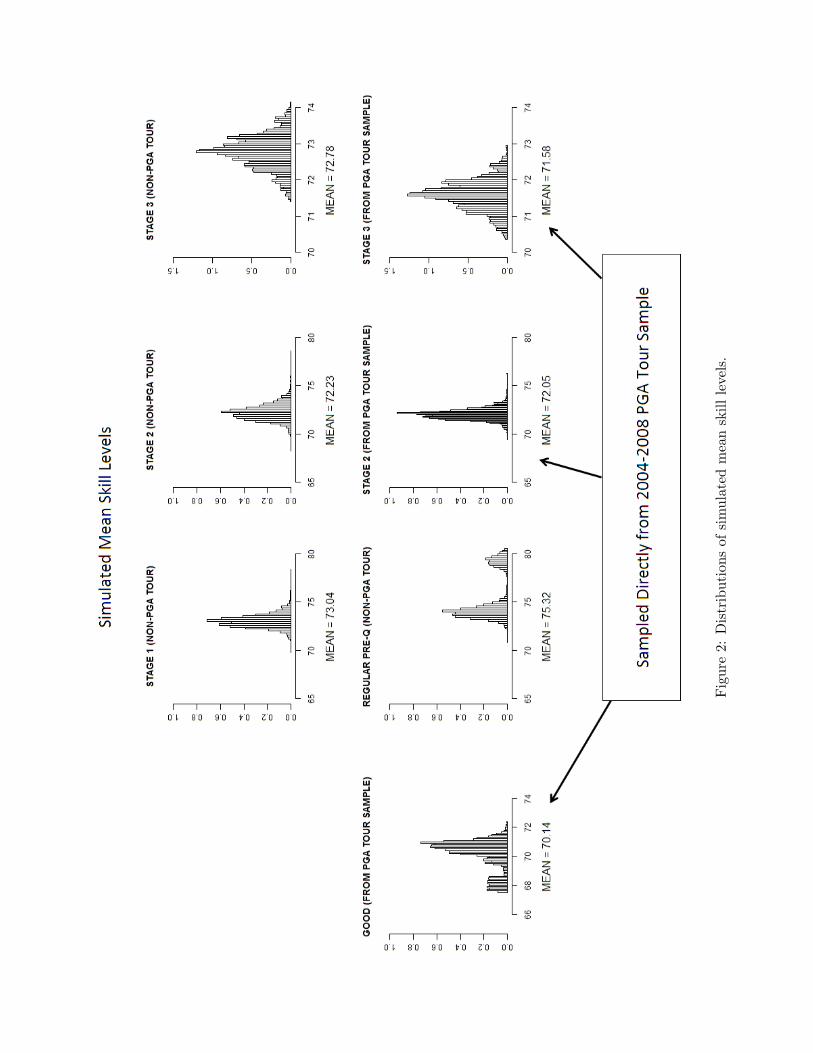
Fig
ure
2:D
istr
ibut
ions
ofsi
mul
ated
mea
nsk
illle
vels
.

Fig
ure
3:D
istr
ibut
ions
ofsi
mul
ated
18-h
ole
scor
es.


![INDEX [ ] · PDF file2003 Qualifying examination for ... The attention is focalized on developing integrated decision ... Society for Computer Simulation](https://img.dokumen.tips/doc/110x75/5a9e55a17f8b9a7f2e8b79d3/index-qualifying-examination-for-the-attention-is-focalized-on-developing.jpg)