Embed Size (px)
Citation preview

1
Goblej Plant ( Near Ahmedabad) Gujarat, India
1 All the numbers are represented are masked considering business confidentiality
• Coca-Cola was formulated in 1886 by John F Pemberton • We Operate In more countries than UN • Its most Recognized word after “OK” • One of the Most value Brands in the world
To Refresh the World Inspire moments of optimism and happiness Create value and make a difference
Mis
sio
n
THE COCA-COLA COMPANY (TCCC)
2

2
HCCBPL is the largest bottling partner of The Coca-Cola Company in India. It is a part of The Coca-Cola Company’s Bottling Investments Group (BIG) and responsible for the manufacture, package, sale and distribution of beverages under the trademarks of The Coca-Cola Company.
Introduction…
3
OPERATIONAL EXCELLENCE MODEL
4

3
HCCB - OE Strategic Roadmap – Picture of Success
5
1 2 3 4 5
OPERATION EXCELLENCE – STRATEGIC DEPLOYMENT
6

4
Zones
Andhra Pradesh
Maharashtra, Goa
Gujarat, Rajasthan , MP
Delhi, UP, Jammu
East Zone
Karnataka
Tamil Nadu, Kerala
HCCB IS ORGANIZED INTO 8 OPERATING ZONES
Plant – Goblej Ahmedabad, Gujarat,
India
COMPANY PROFILE - HCCBPL
7
Category Goblej
Sparkling PET HS PET Sparkling- 2 Lines
Juice PET HS HF PET Juice -1 Line
Sparkling RGB RGB Sparkling - 2 Lines
Juice RGB RGB Juice- 1 Line
Water HS Water- 1 Line
Sparkling PET SS PET Sparkling- 1 Line
Tertrapak Tetra Brik Aseptic-1 Line
Bag in Box Bulk Pack for Institutions
• First Greenfield Plant set up in 1998 over approx. 52 acres of land
• Capacity of approx. 200k physical cases per day
• Annual production volume 40 MM Physical Cases
10 14
18 21
28 34 37
0
10
20
30
40
2009 2010 2011 2012 2013 2014 2015
Volume( MM‘ Cases)
MORE THAN 3.5 TIMES
INCREASE IN PRODUCTION
IN 5 YEARS
We are The Largest Manufacturing Operations of HCCBPL – 10 Lines with 4 HS
600 BPM Lines
Goblej Plant
FACTORY PROFILE - GOBLEJ
8

5
RGB Sparkling
RGB Juice
PET Sparkling
PET Juices PET Water
Tetra Juices
OUR MAIN PRODUCTS
9
International Beverage 2012 Award (Environment) Water Digest Award-Water Reuse POY -2012 CII National Award for “Excellence in Energy Management” IWA 2012 Award for Water for Future : Global Category Certificate for “Strong Commitment in Food Safety” by CII
Golden Peacock Sustainability Award from Institute of Directors
Platinum award on Lean Six Sigma from CBE F&S Economic Times – IMEA Gold Award POY 2013 – Power Yield Improvement
TPM Excellence Award from JIPM in Category-A Award for “ Freight Cost Optimization – Gujarat “ in Pune POY 2015 – Co2 Yield Improvement & P2 Pressure reduction
JIPM Excellence
PLANT MILESTONE ACHIEVED
10

6
01
Section : 1 Project & Team Selection
11 All the numbers are represented are masked considering business confidentiality
1.1.1 Who was responsible for selecting the Project ? (1/2)
HCCBPL - National Steering Committee
Global Vision 2020
Business Diagnostic
Improvement Opportunities Identification
Project Execution – Training and
OE tool usage
Leadership Report Out
Certification, R&R
Voice of Customer
Voice of Business
Profit & Loss Analysis
KPI Trend & Benchmarking
Project selection Committee
Supply Chain Transformation Defining the Performance Gaps – Big “Y’s”
Idea Generation workshop
SCOR Model
PlanPlan PlanCustomer Channel &
Product Line Reqm’ts ComponentsComponents
Components
Laurel, MS
Components
Laurel, MS
Interior Doors:
Haleyville, AL
Interior Doors:
Haleyville, AL
Specialty:
Brampton, Ont.
Specialty:
Brampton, Ont.
Exterior Doors
Dickson, TN
Exterior Doors
Dickson, TN
DorFab:
Lawrenceville, GA
DorFab:
Lawrenceville, GA
Door GroupDoor GroupSuppliersSuppliers CustomersCustomers
Cohesive Supply Chain View Eliminates Disconnects
Retail• Home Depot
• Lowes
Competitors• ??
• ??
Distribution: 1-Stepper• ??
• ??
Distribution: 2-Stepper• ??
• ??
Internal
Suppliers• ??
• ??
External
Suppliers• ??
• ??
12

7
1.1.1 What Background Information of the Company or those who selected the
project is needed to better Understand the context of the project? (2/2)
Raw Syrup
Sugar
Water
Ready Syrup
Carbonated Beverages
CO2
Raw Materials
QSPECS Executive Summary review
- Monthly in National Steering
Committee
Low Yield
Concentrate
(Dissolved CO2)
Material Loss
Internal benchmarking
(VA) 13
1.2.1 How was the Gap or Opportunity brought to the attention of the project
Identification group? (1/3)
Raw Material / PM Yield
Gap : 22%
Cost Loss Matrix
Yield Loss
Co2
Global Bmnechmark-90%
India Bmnechmark-85% Gap / Opportunity
14

8
0.880.800.720.640.560.48
LSL Target
LSL 0.85
Target 0.9
USL *
Sample Mean 0.682538
Sample N 27
StDev (Within) 0.0765319
StDev (O v erall) 0.08694
Process Data
C p *
C PL -0.73
C PU *
C pk -0.73
Pp *
PPL -0.64
PPU *
Ppk -0.64
C pm 0.07
O v erall C apability
Potential (Within) C apability
PPM < LSL 962962.96
PPM > USL *
PPM Total 962962.96
O bserv ed Performance
PPM < LSL 985670.16
PPM > USL *
PPM Total 985670.16
Exp. Within Performance
PPM < LSL 972959.09
PPM > USL *
PPM Total 972959.09
Exp. O v erall Performance
Within
Overall
Process Capability of Co2 Yield
1.2.1 What is the Gap ( Problem Solving )? ( 2/3 )
Mean: 78 %
Range : 30 %
Current Mean Yield : 68% Target Yield : 90 %
Opportunity : 22%
Current range : 30% Target Range : 5%
Day wise Yield variation
Co2 Yield = ------------------------------------------------------ X 100 No of Bottle OK produced * GV*Density
Total CO2 used from receiving in tank
15
1.2.1 What area of the organization had the gap or the opportunity? ( 3/3 )
Loss : Gap / Opportunity
• Daily Routine • Shop floor involvement • Routine Inspection & Tagging
Zero Leak Approach – TPM
• Statistical Analysis skill • Technical skills • Cross Functional Team
Process Optimization – Six Sigma & Innovation
16

9
1.2.2 What data was generated to help select the project? ( 1/3 )
Financial reporting
QSPECS Summary (Tier 1 KPIs)
Cost Loss in RM Yield & Trends
Benchmark Data ( India & Global )
Row Labels Sum of BOM Quantity Sum of Qty Reqd after Scrap Sum of Revised QTY issued Sum of Usage Variance for Material
BIB BAG 10,909 10,931 10,950 935
Carton 125,657 125,908 125,868 (17,172)
Closure 25,723,095 25,916,018 25,877,962 (13,616)
CO2 73,456 95,493 181,287 1,143,246
Conc 13,165 13,165 13,064 (301,414)
Crown 10,340,784 10,418,340 10,408,492 (3,106)
Label 10,884 10,938 10,700 (95,245)
Laminate 3,960 3,980 107,480 164,310
Preform 25,723,095 25,903,157 26,031,076 528,363
Pulp 677,987 680,786 719,461 650,907
Raw Syrup 1,424,267 1,424,267 1,432,843 222,369
Ready Syrup 4,992,168 5,007,144 5,088,826 1,074,756
Shrink 75,569 75,721 55,002 (2,983,701)
Sleeve 1,943,634 1,953,352 2,001,283 44,271
Straw 3,960 3,980 3,980 0
Sugar 1,169,128 1,174,974 1,174,990 504
Tray 88 88 250 583
Grand Total 72,311,806 72,818,241 73,243,513 415,989
Gain / Loss in INR
Global Dashboard
17
1.2.2 What method and /or tool were used to assess or prioritize the need for
the Project? ( 2/3 )
B PROJECT LIST:
SCORE RANK
CO2 Yield Improvement 1881
Leakage and Breakages reduction 153
2
SLE Improvement147
3
OEM's OEM & Localisations - Local Vendor in place of IR145
4
Yield Improvement in Mz Juice 137
5
Productivity/Process Improvement135
6
Breakdown Cost125
7
1 ton Sugar and 1.2 Ton Pulp Contribution to be increased to 100%122
8
Mixer Temperature Optimization121
9
PROJECT NAME
JDI / Kaizen Workshop DMAIC
Project Evaluated as per Strategic Criteria Methods / tools
Brainstorming
Pareto Chart
SOWT
Project
Oth
er
Red
uction in Plant G
& A
( Employe
e trav
el &
ren
t lea
se )
N2 Yield Im
p rovem
ent
FL Buying
Rep
air & M
ainten
ance
Cos
t red
uctio
n in B
hopal
OEM
's OEM
& Loc
alisations
- Loc
al V
endo
r in place
of IR
War
ehou
se F
G Lo ss
Red
uctio
n
Neg
o tiatio
n with
OEM
Misc
Con
sumab
les cos
t red
uctio
n
Brea
kdown C
ost
AOH T
O P
M T
rans
it ion
- T
etra
CMC
Sto ra
ge A
rea Cons
olidation +
Uns
ortin
g at D
C
Leak
age an
d Br
eaka
ges red
uctio
n
Mixer
Tem
peratur
e Optim
izatio
n
Use
of O
wn veh
icle
Can
teen
/ C
afeter
ia / C
aptiv
e Con
sumptio
n
S td. M
anning
CPW
D Impr
ovem
ent
Red
uction in
OFM
E Line
in Bhop
al
Slud
ge Disp
o sal
1 ton Su
gar an
d 1.2 Ton
Pulp C
ontribu tio
n to be increa
sed to 100
%
CO2 Yield
impr
ovem
ent
Power Yield Imp ro
vem
ent
Yield Impr
ove
men
t In CO2 -P
T-20
Pro du
ctivity
/Pro
cess Impr
ovem
ent
SLE
Impr
ovem
ent
Yield Impr
ovem
ent in M
z Ju
ice
Upsiz
e Gain in
Gujara
t
Sugar Sto
rage
in H
ouse
One
way
Imp ro
vem
ent
9080706050403020100
100
80
60
40
20
0YTD
Ta
rge
t 2
01
6
Pe
rce
nt
Pareto Chart of Project
Quick win / Replications Simple in nature Complicated 3-4 months
18
10
1.2.2 Why these methods / tools are used to select the project? ( 3/3 )
Methods / tools
Brainstorming
Pareto Chart
SOWT
Project
Oth
er
Red
uction in Plant G
& A
( Employe
e trav
el &
ren
t lea
se )
N2 Yield Im
p rovem
ent
FL Buying
Rep
air & M
ainten
ance
Cos
t red
uctio
n in B
hopal
OEM
's OEM
& Loc
alisations
- Loc
al V
endo
r in place
of IR
War
ehou
se F
G Lo ss
Red
uctio
n
Neg
o tiatio
n with
OEM
Misc
Con
sumab
les cos
t red
uctio
n
Brea
kdown C
ost
AOH T
O P
M T
rans
it ion
- T
etra
CMC
Sto ra
ge A
rea Cons
olidation +
Uns
ortin
g at D
C
Leak
age an
d Br
eaka
ges red
uctio
n
Mixer
Tem
peratur
e Optim
izatio
n
Use
of O
wn veh
icle
Can
teen
/ C
afeter
ia / C
aptiv
e Con
sumptio
n
S td. M
anning
CPW
D Impr
ovem
ent
Red
uction in
OFM
E Line
in Bhop
al
Slud
ge Disp
o sal
1 ton Su
gar an
d 1.2 Ton
Pulp C
ontribu tio
n to be increa
sed to 100
%
CO2 Yield
impr
ovem
ent
Power Yield Imp ro
vem
ent
Yield Impr
ove
men
t In CO2 -P
T-20
Pro du
ctivity
/Pro
cess Impr
ovem
ent
SLE
Impr
ovem
ent
Yield Impr
ovem
ent in M
z Ju
ice
Upsiz
e Gain in
Gujara
t
Sugar Sto
rage
in H
ouse
One
way
Imp ro
vem
ent
9080706050403020100
100
80
60
40
20
0YTD
Ta
rge
t 2
01
6
Pe
rce
nt
Pareto Chart of Project
Understand the internal Customer pain area Indirect impact on our own people may be
much higher than cost impact
Why?
Based on the impact on Business Replicable across the organization quickly
Understand the future Risk & requirements Proactive actions to be more competetive
19
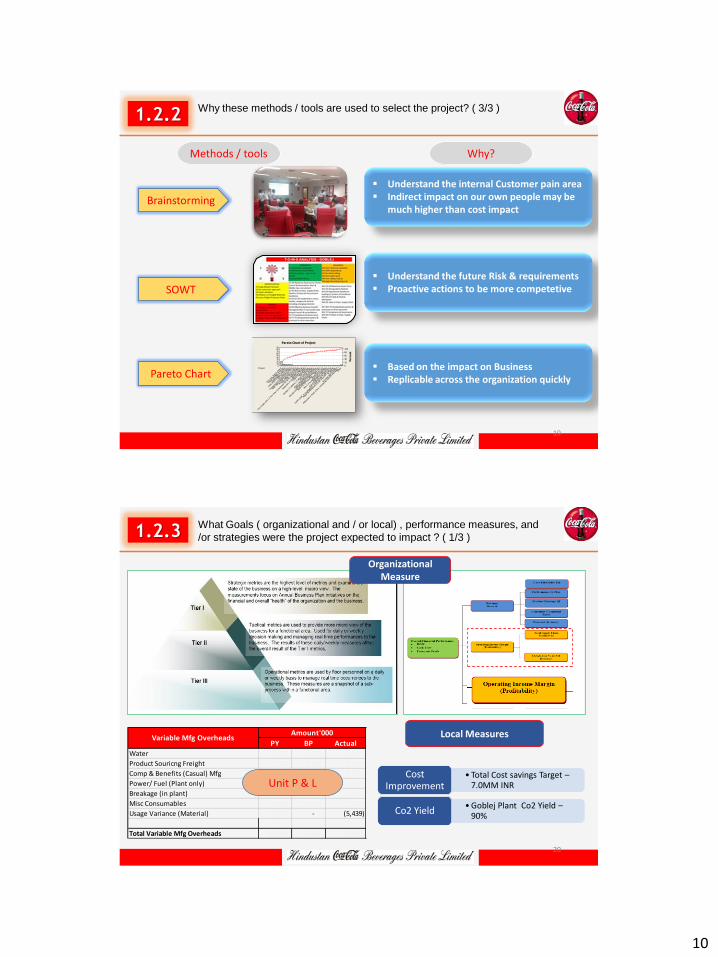
1.2.3 What Goals ( organizational and / or local) , performance measures, and
/or strategies were the project expected to impact ? ( 1/3 )
PY BP Actual
Water 1,755 1,755 1,540
Product Souricng Freight 1,837 3,359 5,145
Comp & Benefits (Casual) Mfg 6,505 6,950 5,983
Power/ Fuel (Plant only) 28,401 35,175 24,422
Breakage (in plant) 3,071 3,598 3,436
Misc Consumables 9,148 10,626 10,403
Usage Variance (Material) 2,274 - (5,439)
Total Variable Mfg Overheads 52,990 61,464 45,490
Variable Mfg OverheadsAmount'000
Unit P & L
Organizational Measure
Local Measures
• Total Cost savings Target – 7.0MM INR
Cost Improvement
• Goblej Plant Co2 Yield – 90%
Co2 Yield
20

11
1.2.3 What was the relationship between the stated measure & perceived gap
in 1.2.1 ? ( 2/3 )
1.2.1
Storage & Evaporation
Distribution Loss
Carbonation process Loss
Filling process Loss
• Short Quantity receive • Leakage Loss from joint
• Pressure drop in long pipe • Leakage Loss in Pipe
• Excess use of Co2 • Leakage • Loss due to wrong
process parameters
• Loss due to wrong process parameters
• Venting in air in Snifting
Areas Perceived Gap Stated Measure
CO2 Yield (VA Qty /
Total Usage)
21
1.2.3 What was the problem / project objective statement that express where
the organization want to be at the end of the project ( 3/3 )
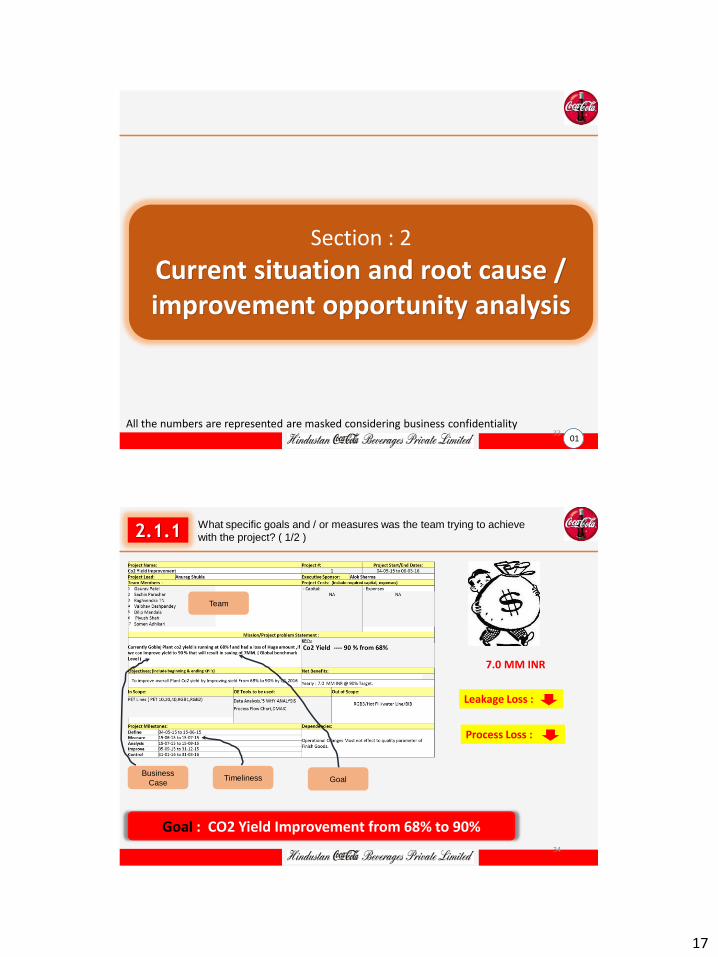
Project Name: Project #: Project Start/End Dates: Co2 Yield Improvement 1 04-05-15 to 31-03-16 Project Lead: Anurag Shukla Executive Sponsor: Alok Sharma Team Members : Project Costs: (include required capital, expenses)
1 Gaurav Patel Mr Sanjay Sharma Mr Kunal Sharma Mr Rajesh Nair Mahesh Kore
- Capital: - Expenses 2 Sachin Parashar NA NA 3 Raghvendra TN 4 Vaibhav Deshpandey 5 Dilip Mandala 6 Piyush Shah 7 Somen Adhikari
Mission/Project problem Statement :
Currently Goblej Plant co2 yield is running at 68% f and had a loss of Huge amount ,if we can improve yield to 90 % that will result in saving of 7MM. ( Global benchmark Level )
KPI's:
Co2 Yield ---- 90 % from 68%
Objectives: (include beginning & ending KPI's) Net Benefits:
To improve overall Plant Co2 yield by Improving yield From 68% to 90% by Q1 2016
Yearly : 7.0 MM INR @ 90% Target.
In Scope: OE Tools to be used: Out of Scope:
PET Lines ( PET 10,20,40,RGB1,RGB2) Data Analysis,'5 WHY ANALYSIS RGB3/Hot Fill/water Line/BIB
Process Flow Chart,DMAIC
Project Milestones: Dependencies: Define 04-05-15 to 15-06-15
Operational Changes Must not effect to quality parameter of Finish Goods.
Measure 15-06-15 to 15-07-15 Analysis 15-07-15 to 15-09-15 Improve 05-09-15 to 31-12-15 Control 31-01-16 to 31-03-16
22

12
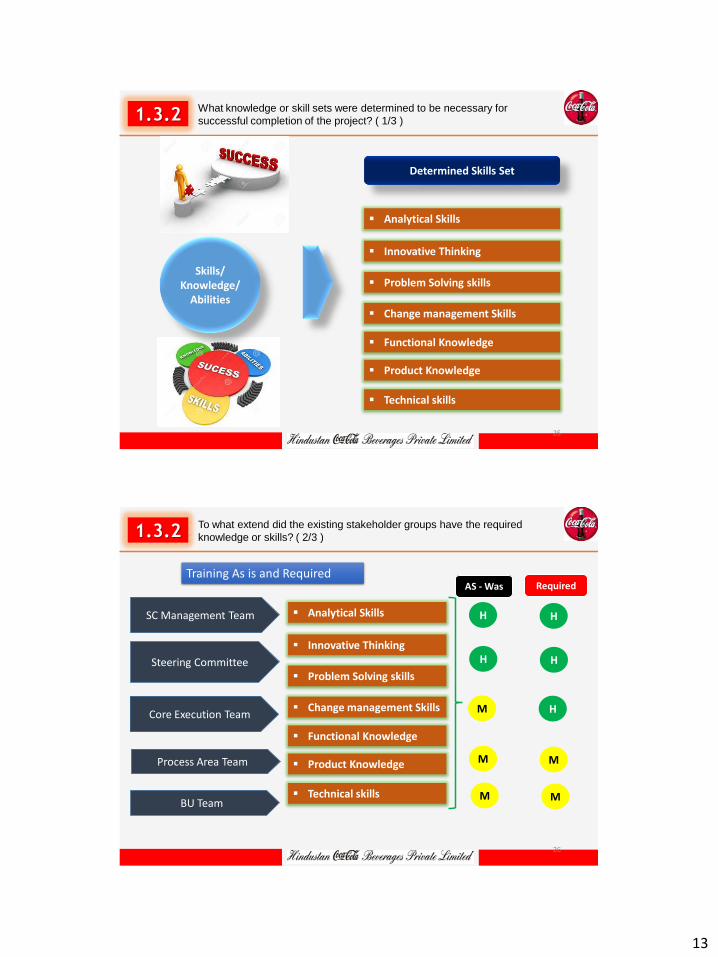
1.3.1 How were the stakeholder groups identified? ( 1/2 )
Core Team & Support Team
(BU)
23
1.3.1 What or who were the stakeholder group? ( 2/2 )
SC - Director SC Management Team
Core Execution Team
Steering Committee
Process Area Team
Stakeholder groups Designations Roles
Zonal Vice President Zonal Supply Chain Head Zonal Finance Head
Factory Manager Plant Manager OE Manager QA Manager Production Mgrs Optech
Production Team ( CSD Line )
BU Team Quality Assurance Team
I
I
E
E
E
I- Influencer E - Executer
24
13
1.3.2 What knowledge or skill sets were determined to be necessary for
successful completion of the project? ( 1/3 )
Skills/ Knowledge/
Abilities
Determined Skills Set
Analytical Skills
Innovative Thinking
Problem Solving skills
Change management Skills
Functional Knowledge
Product Knowledge
Technical skills
25
1.3.2
Training As is and Required
SC Management Team
Core Execution Team
Steering Committee
Process Area Team
BU Team
Analytical Skills
Innovative Thinking
Problem Solving skills
Change management Skills
Functional Knowledge
Product Knowledge
Technical skills
To what extend did the existing stakeholder groups have the required
knowledge or skills? ( 2/3 )
AS - Was Required
H
H
M
M
H
H
M
H
M M
26

14
1.3.2 What additional knowledge and skills were brought to make the project
successful ? ( 3/3 )
Training Organized at Zonal Level
SC Management Team
Core Execution Team
Steering Committee
Process Area Team
BU Team
Analytical Skills
Innovative Thinking
Problem Solving skills
Change management Skills
Functional Knowledge
Product Knowledge
Technical skills – Leak detection
Additional Knowledge & Skills
Beverages Filling
Process
Statistical analysis
Leak Test – Process
27
1.3.3 Before the Project started, what specific training was done? ( 1/2 )
Six Sigma Training Yellow belt Green Belt
DOE Co2 Leak Test Training
Process Training by OEM • Carbonation process
• Filling Process
Training
TPM Training • JH Pillar • PM Pillar • KK Pillar
28

15
1.3.3 Before project started what was done to prepare the team to work
together as a team? ( 2/2 )
“I” became “ WE”
Understand with each other Removed confliction & resolve
difference Develop trust & Communication Improve collaboration Goal clarity & Agreement Clear Roles & Responsibility
Team Building Exercise
29
1.3.4 What roles & expectations were determined ahead of the project? ( 1/3 )
Project Leader
Leakage Arrest Team
Operational Excellence
Process Area Team
BU Team
Core Teams Roles Expectations
Lead Project Coordinate with members
Develop Project team Plan & Execute Training
Coordinate for Leak test & Arrest
Improve the process parameters
Check & Verify
Deliver anticipated result
Develop team for Execution
Zero Leakage across the plant
Optimize & Reduce Process Loss
Validate & Approve changes
30

16
1.3.4 What deadlines & deliverables did the team have to consider ahead of
actually starting the project? ( 2/3 )
Core Teams Deliverables Deadlines
Project Leader
Leakage Arrest Team
Operational Excellence
Process Area Team
Create the Project Charter
Deliver Training & workshop
Training on Measurement system
Understand the Filling process by OEM
15-May- 15
07-Jun-15
30-May-15
10-Jun-15
31
1.3.4 Before the project started, what team routines, including communications
, were established? ( 3/3 )
SC Management Team 1/ M
1/3M
Meeting
Kunal Sharma
Steering Committee 1/M
1/W
Meeting
Sukumar
Core Execution Team 1/W Meeting Somen / Piyush
Process Area Team 1/W Notice Board /Email
Gaurav / Dileep
BU Team 1/W Email Mahesh ( QA)
Stakeholder Message Frequency Media Responsibility
Team Meeting
Site Steering review
Zonal Steering Review
National Steering Review
Weekly / Tuesday – 11am to 12noon Project Leader Status Update
1/ 2 Weeks Factory Manager Status Update
1/ Month ZVP / ZSCM Status Update
1/ 3 Month SC Director Status Update
• Financial update • KPI Update • Project status
• Financial update • KPI Update • Project status
• KPI Update • Project status
• KPI Update • Project status
• KPI Update • Project status
Routines
Communication Plan
32
17
01
Section : 2
Current situation and root cause / improvement opportunity analysis
33 All the numbers are represented are masked considering business confidentiality
2.1.1 What specific goals and / or measures was the team trying to achieve
with the project? ( 1/2 )
Goal : CO2 Yield Improvement from 68% to 90%
7.0 MM INR
Leakage Loss :
Process Loss :
Business
Case Goal Timeliness
Team
34

18
2.1.1 What additional potential benefit, other than specific goals and /or
measures, was the project expected to impact? ( 2/2 )
Potential Benefits
Benefits
$ 0.7MM INR
Additional Benefits
Clean Environment
Optimum Resource usage
Reduce Carbon footprint
% Loss / Yield
Measures
Financial Benefit
35
2.2.1 What method and /or tools were used to identify possible root causes /
improvement opportunities? ( 1/3 )
1
2
3
4
5
DEFINE
MEASURE
ANALYZE
IMPROVE
CONTROL
Method : DMAIC
Leak Test
Pareto Chart
Loss Waterfall
Detail SIPOC
High Level SIPOC
• High Level SIPOC • Detail Process
Mapping • Brainstorming • Pareto Chart • Why-Why analysis • FMEA C & E Matrix • Loss Measurement • Loss Waterfall
Tools
36

19
2.2.1 Why were these methods and /or tolls selected ( to identify possible root
causes / improvement opportunities )? ( 2/3 )
High Level SIPOC
Loss Waterfall analysis
Detail Process Map
Pareto chart
Tools Used
Brainstorming
To understand the understanding, Inputs variables from suppliers which can be Possible Cause
Why Tools Used
To Understand the details of Process Inputs ( Man, Machine, Method, Measurement – Pressure, temp )
To Measure & understand the Leakage Loss & Process Loss to make the Focus area Clear
Prioritize the high opportunity area to analyze further
Identify the inputs which comes from experiences
37
2.2.1 How was the team prepared to use these methods and/or tools ( to
identify possible root causes / improvement opportunities )? ( 3/3 )
Special Team formed for Arresting Leak
Training
• I know but I cant do 1 - Commoner
• I can do but I need support
2- Learner
• I can do independently
3 - Practitioner
• I can teach others 4 – Expert
• SIPOC • Process Map • Cause & Effect • FMEA • Pareto Chart
38

20
2.2.2 What data was generated and how was the data analyzed to identify the
possible root cause/improvement opportunities? ( 1/2 )
Leak test & Loss Measurement
High Priority Area
39
2.2.2 What were possible root cause/improvement opportunities? ( 2/2 )
C & E Matrix FMEA
Inputs parameters / Potential X’s Total 32 Points were identified
X1 Run Speed
X2 Flavor
X3 sku
X4 GV
X5 Snifting Pressure
X6 Return Gas Pressure
X7 Bowl Pressure
X8 Pressurization
X9 Becalm
X10 Co2 Ratio
X11 Paramix Pressure
X12 Flow RATE (T/h)
X13 Temperature at PHE
X14 Product Temperature At filler
X15 Booster Pump
X 16 Bowl Level
40

21
2.3.1 What methods and /or tools were used to identify the final root cause(s)/
improvement opportunity (ies)? ( 1/3 )
Method / Tools
ANOVA Analysis 2 sample t - test
Regression Analysis
Multi Regression with VIF
X3 Impact of SKU size
ThuSpriteSodaLimcaFantaCoke
90.00%
80.00%
70.00%
60.00%
50.00%
40.00%
Flavour 1
Da
ily C
o2
Yie
ld
72.31%
69.55%69.53%
62.02%63.57%
57.73%
Boxplot of Daily Co2 Yield
X2 Impact of Flavor
onOff
90.00%
85.00%
80.00%
75.00%
70.00%
Booster Pump
Co
2 Y
ield
74.81%
78.14%
Boxplot of Co2 YieldImpact of Booster Pump
X15
120.00%100.00%80.00%60.00%40.00%20.00%
90.00%
80.00%
70.00%
60.00%
50.00%
40.00%
30.00%
SLE
Yie
ld
S 0.0712509
R-Sq 82.4%
R-Sq(adj) 81.0%
Fitted Line PlotYield = 0.2958 + 0.4733 SLE
Impact of SLE
41
2.3.1 What methods and /or tools were used to identify the final root cause(s)/
improvement opportunity (ies)? ( 1/3 )
Method / Tools Screening DOE – Main Effect Study
BC
C
ACD
ABCD
ABD
ABC
BD
AD
CD
D
AC
BCD
AB
B
A
0.090.080.070.060.050.040.030.020.010.00
Te
rm
Effect
0.01270
A Bow l F iller Lev el
B Snifting Pressure
C Bow l Pressure
D Paramix Pressure
Factor Name
Pareto Chart of the Effects(response is Yield, Alpha = 0.05)
Lenth's PSE = 0.00494087
Full factorial DOE
42

22
2.3.1 Why were these methods and /or tools selected ( to identify the final root
cause(s) / Opportunity ( ies)? ( 2/3 )
Method / Tools WHY ?
• By variation of SKU size • By variation of Different Flavors • Change Booster pump On/OFF
Impact on Co2 Yield
• By Change in Snifting pressure • By Change in Bowl Pressure • By Change in Pressurization • By Change in Paramix pressure. • By change Temperature at PHE • By Change in Bowl Level
• Screening of Significant Causes
• To understand the interaction impact of significant Causes
43
2.3.1 How was the team prepared to use these methods and /or tools ( to
identify the final root cause(s) / Opportunity ( ies)? ( 3/3 )
Method / Tools Team Preparedness
SPC & Capability (1 day )
Process Area Team
Six Sigma GB ( 4 days )
Core Execution Team Steering Committee
DOE ( 1 day ) Core Execution Team Steering Committee
All Experiments are supported & Guided by Zonal OE / National OE Team
44

23
2.3.2 What data was generated and how was the data analyzed in order to
identify the final root cause(s) / Opportunity ( ies)? ( 1/3 )
Design of Experiment & Data collection
Process Out put input data Collections without any change in setting
22501250750600
90.00%
80.00%
70.00%
60.00%
50.00%
40.00%
SKU1
Da
ily C
o2
Yie
ld
Boxplot of Daily Co2 Yield
ANOVA
8045
0.84
0.82
0.80
0.78
0.76
1.80.8
5.14.4
0.84
0.82
0.80
0.78
0.76
6.55.8
Bowl Filler Level
Me
an
Snifting Pressure
Bowl Pressure Paramix Pressure
Main Effects Plot for YieldData Means
1.80.8 5.14.4 6.55.8
0.84
0.78
0.72
0.84
0.78
0.72
0.84
0.78
0.72
Bowl Filler Level
Snifting Pressure
Bowl Pressure
Paramix Pressure
45
80
Level
Filler
Bowl
0.8
1.8
Pressure
Snifting
4.4
5.1
Pressure
Bowl
Interaction Plot for YieldData Means
Statistical Analysis through Minitab
45
2.3.2 What are specific examples of data analysis that led to the final root
causes? ( 2/3 )
Analysis of SKU size
BC
C
ACD
ABCD
ABD
ABC
BD
AD
CD
D
AC
BCD
AB
B
A
0.090.080.070.060.050.040.030.020.010.00
Te
rm
Effect
0.01270
A Bow l F iller Lev el
B Snifting Pressure
C Bow l Pressure
D Paramix Pressure
Factor Name
Pareto Chart of the Effects(response is Yield, Alpha = 0.05)
Lenth's PSE = 0.00494087
Statistically Significant
Process Parameters
1.80.8 5.14.4 6.55.8
0.84
0.78
0.72
0.84
0.78
0.72
0.84
0.78
0.72
Bowl Filler Level
Snifting Pressure
Bowl Pressure
Paramix Pressure
45
80
Level
Filler
Bowl
0.8
1.8
Pressure
Snifting
4.4
5.1
Pressure
Bowl
Interaction Plot for YieldData Means
Statistically Significant
46

24
2.3.2 What was (were) the final root cause(s) / improvement opportunity (ies) ?
( 3/3 )
Final Root
Causes
Inputs parameters / Potential X’s Significant X’s ( )
S
S
S
S
S
S
47
2.3.3 How was (were) the final root cause(s) / improvement opportunity (ies)
validated? ( 1/2 )
Filler Bowl Level
Root Causes
Snifting Pressure
Paramix Pressure
Filler Bowl Pressure
SKU Size
Validation
Trial Conducted with Sterile Air Unit & Checked
Result
Trial Conducted & Result Check
ANOVA : for Filler Bowl Level ( 3 level )
2-sample t-test for Bowl Level ( 2 Level)
2-sample t-test for Paramix Pressure( 2 Level)
DOE with all significant Parameters
48

25
2.3.3 What evidence showed that the final root cause(s) / Opportunity (ies)
were validated prior to solution development ? ( 2/2 )
Filler Bowl Level
Root Causes
Snifting Pressure
Paramix Pressure
Filler Bowl Pressure
SKU Size
Validation
Trial Conducted with Sterile Air Unit & Checked
Result
Trial Conducted & Result Check
ANOVA : for Filler Bowl Level ( 3 level )
2-sample t-test for Bowl Level ( 2 Level)
2-sample t-test for Paramix Pressure( 2 Level)
DOE with all significant Parameters
8045
0.84
0.82
0.80
0.78
0.76
1.80.8
5.14.4
0.84
0.82
0.80
0.78
0.76
6.55.8
Bowl Filler Level
Me
an
Snifting Pressure
Bowl Pressure Paramix Pressure
Main Effects Plot for YieldData Means
CurHigh
Low0.00000D
New
d = 0.00000
Maximum
Yield
y = 0.8599
0.00000
Desirability
Composite
5.80
6.50
4.40
5.10
0.80
1.80
45.0
80.0Snifting Bowl Pre Paramix Bowl Fil
[80.0] [1.80] [4.40] [5.8053]
BC
C
ACD
ABCD
ABD
ABC
BD
AD
CD
D
AC
BCD
AB
B
A
0.090.080.070.060.050.040.030.020.010.00
Te
rm
Effect
0.01270
A Bow l F iller Lev el
B Snifting Pressure
C Bow l Pressure
D Paramix Pressure
Factor Name
Pareto Chart of the Effects(response is Yield, Alpha = 0.05)
Lenth's PSE = 0.00494087
49
2.4.1 How was the correctness of the initial project scope, deliverables, and
Training Confirmed (or what changes were made )? ( 1/4)
Project Name: Project #: Project Start/End Dates: Co2 Yield Improvement 1 04-05-15 to 06-03-16 Project Lead: Anurag Shukla Executive Sponsor: Alok Sharma Team Members : Project Costs: (include required capital, expenses)
1 Gaurav Patel
- Capital: - Expenses 2 Sachin Parashar 1.2 MM INR 3 Raghvendra TN 4 Vaibhav Deshpandey 5 Dilip Mandala 6 Piyush Shah 7 Somen Adhikari
Mission/Project problem Statement :
Currently Goblej Plant co2 yield is running at 68% f and had a loss of Huge amount ,if we can improve yield to 90 % that will result in saving of 7MM. ( Global benchmark Level )
KPI's:
Co2 Yield ---- 90 % from 68%
Objectives: (include beginning & ending KPI's) Net Benefits:
To improve overall Plant Co2 yield by Improving yield From 68% to 90% by Q1 2016
Yearly : 7.0 MM INR @ 90% Target.
In Scope: OE Tools to be used: Out of Scope:
PET Lines ( PET 10,20,40,RGB1,RGB2) Data Analysis,'5 WHY ANALYSIS RGB3/Hot Fill/water Line/BIB
Process Flow Chart,DMAIC
Project Milestones: Dependencies: Define 04-05-15 to 15-06-15
Operational Changes Must not effect to quality parameter of Finish Goods.
Measure 15-06-15 to 15-07-15 Analysis 15-07-15 to 15-09-15 Improve 05-09-15 to 31-12-15 Control 31-01-16 to 31-03-16
( Sterile Filters included in Scope )
( As Future is in small size SKUs)
50

26
2.4.1 How were stakeholder involved and /or communicated with during the
root cause / improvement opportunity phase of the project? ( 2/4)
SC Management Team
Core Execution Team
Steering Committee
Process Area Team
Stakeholder groups
BU Team
Who
SC - Director
Zonal Vice President Zonal Supply Chain Head Zonal Finance Head
Factory Manager Plant Manager OE Manager QA Manager Production Mgrs Optech
Production Team ( CSD Line )
Quality Assurance Team
Involvement / Communication
Communicated through National review meeting
Communicated through Zonal review meeting Involve in experiment Approved Budget for Sterile Air
• Involved the in the all root causes identification, data collection & validation.
• Statistical analysis done • Detailed reviewed in site
Steering Committee
Informed through planned communication meeting
Involvement in sterile air trial Other information through email
51
2.4.1 What stakeholder resistance was identified and/or addressed in this
phase of the project? ( 3/4)
SC Management Team
Core Execution Team
Steering Committee
Process Area Team
Stakeholder groups
BU Team
Resistance Impact Addressed
None
None
• Can we take this Very Challenging Target ??
• Additional responsibility ??
None
M
M
None
None
• Motivated to Team by Top Leadership
• Additional Budget support
• Motivate to Break the Ice • Communication &
discussion thinking barrier
None
52

27
2.4.1 How was the appropriateness of the initial team membership and
management routines confirmed ( or what changes were made)? ( 4/4)
Core Execution Team
Factory Manager Plant Manager OE Manager QA Manager Production Mgrs Optech
Engineering Team Sterile Air Vendor Procurement Team Air Testing Lab Team
Initial Team Added Team
Team Meeting
Site Steering review
Zonal Steering Review
National Steering Review
Routines
53
01
Section : 3
Solution / Improvement Development
54 All the numbers are represented are masked considering business confidentiality

28
3.1.1 What methods and /or tools were used to identify the possible solutions /
improvements? ( 1/3)
Method - DMAIC
Innovation methodology for NVA use of Co2
Kaizen – Zero Leak approach
55
3.1.1 Why were these methods and/ or tools selected ( to identify possible
solutions / improvements )? ( 2/3) How was the team prepared ? ( 3/3)
TPM- JH Kaizen – Zero Leak Approach
DMAIC – DOE Main Effect Interaction Effect Response Optimizer
Innovation methodology ECRS ( Replace )
Method / Tools WHY ?
Autonomous Corrections & Eliminate Leakage Loss
• Identify the Full Opportunity
• Understand the combination setting
• Find the Best combination
• Eliminate the Non Value use of CO2 ( Replace with equivalent low cost gas)
Team Preparedness
SPC & Capability (1 day )
Six Sigma GB ( 4 days )
DOE ( 1 day )
Training done ( 2.3.1 )
Workshop on Sterile Air use in place
of CO2
56

29
3.1.2 What data was generated and how was the data analyzed to determine
the possible solutions / improvements? ( 1/3)
Experiment & Data collection
6.55.8
5.1
4.4
1.8
0.8
8045
Paramix Pressure
Bow l Pressure
Snifting Pressure
Bow l F iller Lev el
0.85000
0.810000.70653
0.81000
0.85000
0.841620.72000
0.79000
0.83000
0.832990.72000
0.78000
0.86000
0.810000.68000
0.76849
Cube Plot (data means) for Yield
CurHigh
Low0.00000D
New
d = 0.00000
Maximum
Yield
y = 0.8599
0.00000
Desirability
Composite
5.80
6.50
4.40
5.10
0.80
1.80
45.0
80.0Snifting Bowl Pre Paramix Bowl Fil
[80.0] [1.80] [4.40] [5.8053]
Response Optimizer
8045
0.84
0.82
0.80
0.78
0.76
1.80.8
5.14.4
0.84
0.82
0.80
0.78
0.76
6.55.8
Bowl Filler Level
Me
an
Snifting Pressure
Bowl Pressure Paramix Pressure
Main Effects Plot for YieldData MeansTrial data with Sterile Air
DOE data
Global Benchmarking
57
3.1.2 What are the possible solutions / improvements? ( 2/3)
Significant X’s ( )
S
S
S
S
S
S X’s Possible solutions Remarks
X3 Produce only Higher size SKUs Replace with N2 gas Innovative solution in filling process ( Stop Co2 venting in filling process Replace with Sterile Air
Depends upon Consumer requirements ( low SKU size demand is high ( 200/250ml ) Low cost than Co2 Using in Global Coca-Cola Plant
X5 Snifting Pressure to be increased to reduce the venting Co2 in air
Change from 0.8bar to 1.8bar
X7 Bowl pressure to be reduced to reduce loss
Reduce pressure from 4.3 bar to 4.0 bar
X11 Paramix Pressure to be reduced to reduce loss in Paramix
Reduce pressure from 6.2 to 5.8 bar
X17 Filler Bowl Level to be increased to get higher Yield
Increase from 55% to 80% level in Filler bowl
Leakage Loss
Change the Snifting spring Material Reduce Co2 Loss due the damage of the spring in Snifting valve
58

30
3.1.2 What evidence showed that the solutions / improvements identified were
possible instead of final? ( 3/3)
X’s Possible solutions
X3 Replace with N2 gas Replace with Sterile Air
X5 Snifting Pressure to be increased to reduce the venting Co2 in air
X7 Bowl pressure to be reduced to reduce loss
X11 Paramix Pressure to be reduced to reduce loss in Paramix
X17 Filler Bowl Level to be increased to get higher Yield
Leakage Loss
Change the Snifting spring Material
Start up Middle End
Before
breakdown
period
After
breakdown
period
1 Fanta Orange 750 ml C20A1C21 11:52 13:12 15:38 15:38 13:13
2 Limca 750 ml C20A1C2-2 18:40 19:18 20:31 19:18 19:33
3 Sprite 750 ml C20A1C2-3 23:30 23:52 0:40 23:53 0:05
4 Coca Cola 600 ml C21A1C2-1 11:17 12:14 16:55 14:50 14:36
Sample Type and timings
N2 counter pressure N2 counter pressure
S.NO. Flavour SKU Batch No.
Sample Type and timings
Trial data with N2 as Counter Pressure
Result is OK but again costly
Trial data sterile Air
OEM’s designed rejected. Designed & developed by Optech
Trial conducted at recommended change
59
3.2.1 What method and / or tools were used to identify the final solution(s) /
improvement(s)? ( 1/3) Why were these method and / or tools were selected? ( 2/3) How was the team prepared ? ( 3/3)
X’s Possible solutions
X3 Replace with N2 gas Replace with Sterile Air
X5 Snifting Pressure to be increased to reduce the venting Co2 in air
X7 Bowl pressure to be reduced to reduce loss
X11 Paramix Pressure to be reduced to reduce loss in Paramix
X17 Filler Bowl Level to be increased to get higher Yield
Leakage Loss
Change the Snifting spring Material / design
Method / Tools
Cost Benefit Analysis for N2 & Sterile Air
DOE Output . So Final recommendation based
on the Full Factorial experiments
Re- engineering ( Designed based on
requirements )
WHY ?
Cost Effective solution
Statistical Analysis is best
as it gives solution based on long term
New design against weak
design
Team Preparedness
SPC & Capability (1 day )
Six Sigma GB ( 4 days )
DOE ( 1 day )
Training done ( 2.3.1 )
Workshop on : Filling
Valve Design by OEM
60

31
3.2.2 How were the methods and / or tools used to determine the final
solution(s) / Improvement(s)? ( 1/2)
Cost – Benefit Analysis
No Fixed Cost Variable Cost is High ( as N2 = 12/Kg )
Total cost of Operation is …..5 X
Fixed Cost is 0.15 MM Variable cost ( Air use )
Total Cost Of operation ……X
N2 Use in Filling Operation Sterile Air Use in Filling Operation
DOE Output
Final recommended Solution
Re-engineering Broken spring every 15 days
interval
New Design requirement
by Own
Zero Break & Zero Loss
61
3.2.2 What was (were) the final solution(s) / Improvement(s)? ( 2/2)
X’s Final solutions
Leakage Loss
Change the Snifting spring Material / design
X5 Snifting Pressure to be increased from 0.8 to 1.2 bar
X7 Bowl pressure reduced to from 4.3 to 4.0 bar
X11 Paramix Pressure reduced from 6.2 bar to 5.8 bar
X17 Filler Bowl Level Increased from 55% to 70%
X3 Fillings process Co2 replace with Sterile Air
Next page
62

32
3.2.2 What was (were) the final solution(s) / Improvement(s)? ( 2/2)
X’s Final solutions
X3 Fillings process Co2 replace with Sterile Air
NVA- Co2 Before
After
Zero Loss of Co2
63
3.2.3 How were the final solution(s) / Improvement(s) validated ? ( 1/2)
Final Solutions validated through Pilot Trial & Approvals
Design Validation Installation Validation
Operational Validation
Performance Validation
Sample testing
Risk Assessment
Product Validation
Solution Validation
Pilot Trial Approval
Pilot Result Analysis
SOP & Documentation
Pilot & Long Run trial approval
64

33
3.2.3 What evidence showed that the validation was performed prior to
implementation ? ( 2/2)
0 day 15 days 80 days 0 day 15 days 80 days
coke 600ml K21A1C2-1 21.11.2015 11:17 4.17 3.71 2.7 3.37
coke 600ml K21A1C2-1 21.11.2015 12:14 3.82 2.86 3.4
coke 600ml K21A1C2-1 21.11.2015 16:55 3.75 2.39 3.56
coke 600ml K21A1C2-1 21.11.2015 17:24 3.8 2.88 3.48
coke 600ml K21A1C2-1 21.11.2015 17:25 3.72 2.85 3.46
coke 600ml K21A1C2-1 21.11.2015 18:02 3.76 2.88 3.66
coke 600ml K21A1C2-1 21.11.2015 18:01 3.85 2.94 3.64
coke 600ml K21A1C2-1 21.11.2015 18:01 3.78 2.77 3.59
coke 600ml K21A1C2-1 21.11.2015 18:01 3.85 2.96 3.62
coke 600ml K21A1C2-1 21.11.2015 18:01 3.83 2.92 3.6
coke 600ml K21A1C2-1 21.11.2015 18:02 3.79 2.92 3.55
coke 600ml K21A1C2-1 21.11.2015 18:02 3.75 2.85 3.63
STERILE AIR COUNTER PRESSURE - INTERNAL TEST REPORT
Sterile Air Counter pressure CO2 Counter pressure
Results (Gas Volume)General Data
Flavour SKU Batch No. D.O.P Time
Product Validation
Result Validation
PILOT Trial
65
3.2.4 What additional potential benefits were anticipated from the final
solution(s) / improvement(s) ? ( 1/2)
Were the additional potential benefit anticipated prior to implementation ? ( 2/2)
Potential Benefits
Benefits
$ 0.7MM INR
Additional Benefits
Clean Environment
Optimum Resource usage
Reduce Carbon footprint
% Yield Loss
Measures
Financial Benefit
Market share Increase in small pack
(No variation of Yield in SKU size)
I am Happy to produce any small
packs
Not Anticipated 66

34
3.2.5 What data was generated and how was the data analyzed to justify why the
chosen final solution(s) / improvement(s) should be implemented?( 1/2)
12.02.2016
Flavour SKU Batch No. D.O.P D.O.Analysis Time G.V Brix Sensory Torque Total container wt. Net content
fanta 750ml K20A1C21 20.11.2015 12.02.2016 11:51 2.49 13.32 IN 10 815 740.4
fanta 750ml K20A1C21 20.11.2015 12.02.2016 17:40 2.57 13.34 IN 10 818 743.6
limca 750ml K20A1C22 20.11.2015 12.02.2016 22:07 3.85 10.56 IN 11 810 743.5
coke 600ml K21A1C21 21.11.2015 12.02.2016 18:21 3.37 10.41 IN 13 652 597.9
CO2 COUNTER PRESSURE - INTERNAL TEST REPORT
General Data Results Net content data
Yield is > 90%
Product is meeting
Spec.
67
3.2.5 What evidence showed that justification was performed prior to
implementation ?( 2/2)
Sterile Air Approval
Based on Pilot Trial Result we received Conditional Approval from
BU. We have received approval final implementation based on 90
days result
12.02.2016
Flavour SKU Batch No. D.O.P D.O.Analysis Time G.V Brix Sensory Torque Total container wt. Net content
fanta 750ml K20A1C21 20.11.2015 12.02.2016 11:51 2.49 13.32 IN 10 815 740.4
fanta 750ml K20A1C21 20.11.2015 12.02.2016 17:40 2.57 13.34 IN 10 818 743.6
limca 750ml K20A1C22 20.11.2015 12.02.2016 22:07 3.85 10.56 IN 11 810 743.5
coke 600ml K21A1C21 21.11.2015 12.02.2016 18:21 3.37 10.41 IN 13 652 597.9
CO2 COUNTER PRESSURE - INTERNAL TEST REPORT
General Data Results Net content data
Pilot Trial was done well before the Final Implementation 68

35
3.3.1
01
How was the correctness of the initial or updated project scope,
deliverables, and timing confirmed (or what changes were made)?( 1/4)
Project Name: Project #: Project Start/End Dates: Co2 Yield Improvement 1 04-05-15 to 06-03-16 Project Lead: Anurag Shukla Executive Sponsor: Alok Sharma Team Members : Project Costs: (include required capital, expenses)
1 Gaurav Patel
- Capital: - Expenses 2 Sachin Parashar 1.2 MM INR 3 Raghvendra TN 4 Vaibhav Deshpandey 5 Dilip Mandala 6 Piyush Shah 7 Somen Adhikari
Mission/Project problem Statement :
Currently Goblej Plant co2 yield is running at 68% f and had a loss of Huge amount ,if we can improve yield to 90 % that will result in saving of 7MM. ( Global benchmark Level )
KPI's:
Co2 Yield ---- 90 % from 68%
Objectives: (include beginning & ending KPI's) Net Benefits:
To improve overall Plant Co2 yield by Improving yield From 68% to 90% by Q1 2016
Yearly : 7.0 MM INR @ 90% Target.
In Scope: OE Tools to be used: Out of Scope:
PET Lines ( PET 10,20,40,RGB1,RGB2) Data Analysis,'5 WHY ANALYSIS RGB3/Hot Fill/water Line/BIB
Process Flow Chart,DMAIC
Project Milestones: Dependencies: Define 04-05-15 to 15-06-15
Operational Changes Must not effect to quality parameter of Finish Goods.
Measure 15-06-15 to 15-07-15 Analysis 15-07-15 to 15-09-15 Improve 05-09-15 to 31-12-15 Control 31-01-16 to 31-03-16
( Sterile Filters included in Scope )
( As Future is in small size SKUs)
No Change
69
3.3.1 How were stakeholders involved and /or communicated with during the
solution / improvement phase of the project ?( 2/4 )
SC Management Team
Core Execution Team
Steering Committee
Process Area Team
Stakeholder groups
BU Team
Who
SC - Director
Zonal Vice President Zonal Supply Chain Head Zonal Finance Head
Factory Manager Plant Manager OE Manager QA Manager Production Mgrs Optech
Production Team ( CSD Line )
Quality Assurance Team
Involvement / Communication
Communicated through National review meeting . Pilot approval
Communicated through Zonal review meeting Supported in Sterile Air Execution Approved the Change in process Approved the Spring Locally designed
• Involved in Process Change • Involve to finally design Spring • Executed the sterile Filter
installation, Trial & Validation • Detailed reviewed in site
Steering Committee
Informed through planned communication meeting
Validation done by BU Team Other information through email
70

36
3.3.1 What stakeholder resistance was identified and /or addressed in this phase
of the project ? ( 3/4 )
SC Management Team
Core Execution Team
Steering Committee
Process Area Team
Stakeholder groups
BU Team
Resistance Impact Addressed
None
None
• None
• No resistance with sterile Air
None
None
None
• Very Happy . Expected good result with sterile air
• Were happy . As it’s a Bullet proofing solution
• Feel healthy environment as no Co2 in local area
None
71
3.3.1
01
How was the appropriateness of the initial or updated team membership
and management routines confirmed (or what changes were made)? ( 4/4 )
Core Execution Team
Factory Manager Plant Manager OE Manager QA Manager Production Mgrs Optech
Engineering Team Sterile Air Vendor Procurement Team Air Testing Lab Team
Initial Team Added Team
Team Meeting
Site Steering review
Zonal Steering Review
National Steering Review
Routines
No change in Team
Weekly / Tuesday
1/ 2 Weeks Factory Manager Status Update
1/ Month ZVP / ZSCM Status Update
1/ 3 Month SC Director Status Update
All meeting happened with attendance more than 90% 72

37
01
Section : 4
Implementation and Result Verification
73 All the numbers are represented are masked considering business confidentiality
4.1.1 How were stakeholder involved in planning the solution / improvement
implementation ? ( 1/2 )
SC Management Team
Core Execution Team
Steering Committee
Process Area Team
Stakeholder groups
BU Team
Who
SC - Director
Zonal Vice President Zonal Supply Chain Head Zonal Finance Head
Factory Manager Plant Manager OE Manager QA Manager Production Mgrs Optech
Production Team ( CSD Line )
Quality Assurance Team
Planning approval & alignment with Corporate Team
Align & Planned from PR to PO Team Align the time schedule of Engg Team
• Prepare the Gantt Chart for Execution of Sterile Air
• Support to Optech team to develop the Local spring
• Align with BU team to finish on Target
Supported by Planning Production schedule for doing trials
Planned the testing & validation process
Involvement
74

38
4.1.1 How were stakeholder involved in implementing the solution / improvement
implementation ? ( 2/2 )
SC Management Team
Core Execution Team
Steering Committee
Process Area Team
Stakeholder groups
BU Team
Who
SC - Director
Zonal Vice President Zonal Supply Chain Head Zonal Finance Head
Factory Manager Plant Manager OE Manager QA Manager Production Mgrs Optech
Production Team ( CSD Line )
Involvement
Review Meeting for progress of Sterile Air Implementation
PR Approved in very short time PO Prepared & Approve Quickly
Aligned for Installation & Commissioned Conducting all required Trials Collecting data & Analysis for verification
Well supported for doing trial in Lines
Validated quick shortest possible time Quality Assurance Team
75
4.1.2 What was done to anticipate resistance before it occurred ? ( 1/3 )
Store Team
Maintenance Team
Production Team
Line Optech
MTD Optech
Quality Team
N S C
Z S C
S S C
B U Team
Name
Strongly
Against
(-2)
Moderately
Against
(-1)
Neutral
(0)
Moderately
Supportive
(+1)
Strongly
Supportive
(+2)
Stake holder analysis
All Stake Holder were very Happy with the solution
What types of resistance were actually encountered ? ( 2/3 ) How was the actual resistance identified? ( 3/3 )
Change E ( Effectiveness ) = Q ( Quality of Solution ) *
A(Acceptability)
76

39
4.1.3 How was the actual resistance addressed? ( 1/2 ) How did the team know it was successful in addressing the resistance ?( 2/2 )
There were no Resistance to implement Solutions
Snifting Spring Design Change
Process Parameter Optimization Filler Bowl Level Snifting Pressure Paramix Pressure reduction Filler Bowl Pressure reduction
Sterile Air System Implementation
How Communications
Engagement Skill Up gradation
77
4.1.4 What was the evidence of stakeholder group buy-in? ( 1/2 )
What evidence showed that buy-in was obtained prior to Implementation?(2/2)
SC Management Team
Core Execution Team
Steering Committee
Process Area Team
Stakeholder groups
BU Team
Who
SC - Director
Zonal Vice President Zonal Supply Chain Head Zonal Finance Head
Factory Manager Plant Manager OE Manager QA Manager Production Mgrs Optech
Production Team ( CSD Line )
Buy – In
By Obtaining the Approval in each stage
By approving & Guiding for implementation
By designing the New Spring Conducting the trial & proactive solution
By designing the New Spring
Quality Assurance Team By providing Protocol for Pilot Assured Pilot Trial result
Approvals done in Sept 15
Pilot Trial Nov 15
Full scale from Mar 16
78
40
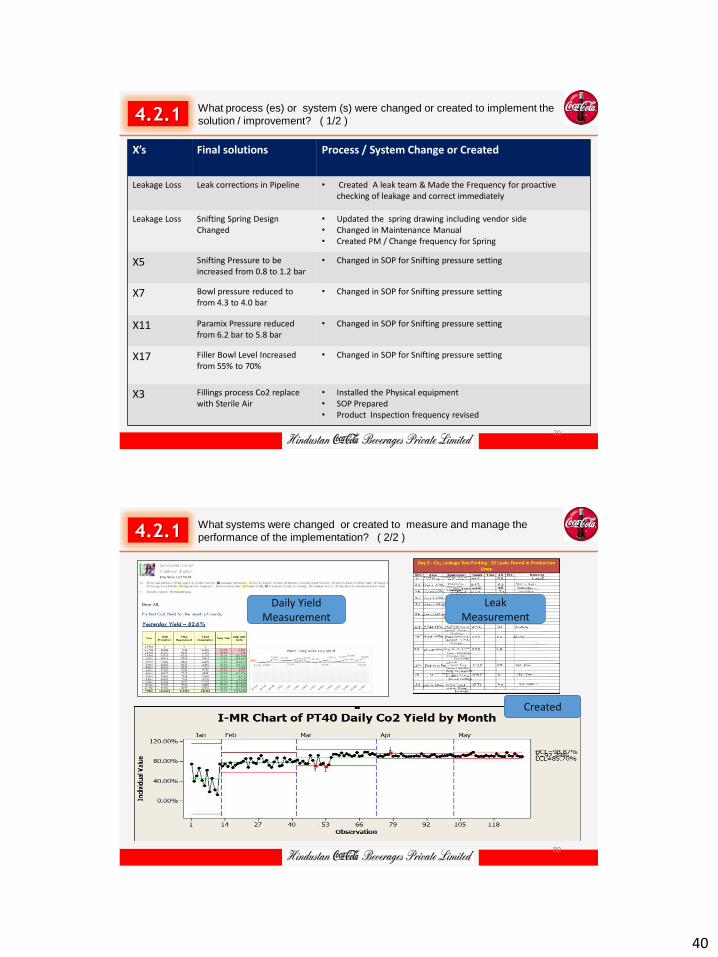
4.2.1 What process (es) or system (s) were changed or created to implement the
solution / improvement? ( 1/2 )
X’s Final solutions Process / System Change or Created
Leakage Loss Leak corrections in Pipeline • Created A leak team & Made the Frequency for proactive checking of leakage and correct immediately
Leakage Loss Snifting Spring Design Changed
• Updated the spring drawing including vendor side • Changed in Maintenance Manual • Created PM / Change frequency for Spring
X5 Snifting Pressure to be increased from 0.8 to 1.2 bar
• Changed in SOP for Snifting pressure setting
X7 Bowl pressure reduced to from 4.3 to 4.0 bar
• Changed in SOP for Snifting pressure setting
X11 Paramix Pressure reduced from 6.2 bar to 5.8 bar
• Changed in SOP for Snifting pressure setting
X17 Filler Bowl Level Increased from 55% to 70%
• Changed in SOP for Snifting pressure setting
X3 Fillings process Co2 replace with Sterile Air
• Installed the Physical equipment • SOP Prepared • Product Inspection frequency revised
79
4.2.1
01
What systems were changed or created to measure and manage the
performance of the implementation? ( 2/2 )
Created
Leak Measurement
Daily Yield Measurement
80

41
4.3.1 What were the result ? ( 1/2 )
How did the result compare to the specific project goal / measures from
item 2.1.1 ? ( 2/2 )
68
90 93
0
20
40
60
80
100
Current Target Actual
CO2 Yield %
Consistent Result
Target Achieved
Sterile Air
81
4.3.2 What additional benefits were realized from the project? ( 1/3 )
Potential Benefits
Benefits
Target : 7.0 MM INR
% Yield
Measures
Financial Benefit
(No variation of Yield in SKU size)
How did the team measure any of the additional benefit that were “soft” ?(2/3 )
How do the actual additional benefits that were realized compare Item 3.2.4?( 3/3 )
Realized : 5.1 MM INR by Jul 16
Improve to 93%
Market share Increase in small pack
Received approval
Manufacturing250 ml
( smallest in PET)
3.2.4
Health Workplace
No CO2 venting to local
workplace
82

42
Section : 5
Sustaining and Communicating Result
83 All the numbers are represented are masked considering business confidentiality
5.1.1 What was done to make sure the process or system changes made during
the implementation( Item 4.2.1) continued to be followed? ( 1/2 )
Make stock in Store for
replacement
SOP Testing Frequency
84

43
5.1.1 What evidence showed that this became part of the Organization’s Culture /
Operating strategy? ( 2/2 )
OE is the activation of the 6th P; it is “how” we will build a
Productivity culture
Our objective = Productivity culture
“We’ve added a 6th “P” to reflect the importance of making productivity part of everything we do.” - Muhtar Kent
PROFIT Revenue
and Margin Growth
People Engagement
& Development
Portfolio Optimization
Partners Collaboration
& Standardizati
on
Planet Sustainability
Productivity
Coca Cola
Strategic Framework
Opportunity Identification
Team Formation
Find out Root Cause
Final solution Standardized
Solution
Practice / Habit
Behavior / Culture
85
5.1.2 What was done to make sure that the benefits obtained from the
implementation ( Item 4.2.1) will be maintained ? ( 1/2 )
Financial Validation :
Closed Projects
Measure Benefit
Zonal Finance Validation
Corporate Finance
Validation
USA Atlanta Office
Reporting : Review & Action :
Peak Seasons -4 months
Seasonal Volume
Off Seasons - 8 months
86

44
5.1.2 What evidence showed that this became part of the organization’s culture /
operating strategy? ( 2/2 )
Replication across India
Criteria Weightage North East Gujarat
SC Meeting Score (Zonal & Site) 20 16 18 19
Team Meeting Compliance Score 20 20 20 19
Projects on track Score 35 32 27 31
Training Score 10 10 10 7
Certification Score 5 5 4 5
Savings Score 10 10 6 10
93.1 85.6 92.2
OE Score
Operational Excellence is our strategy to achieve a Productivity culture
Productivity delivers value across the other 5 P’s
87
5.2.1 How did the team communicate the results to the various stakeholder
groups? ( 1/1 )
Leadership Certification
SC Management Team
Core Execution Team
Steering Committee
Process Area Team
Stakeholder groups
BU Team
Communications
Project Review meeting & Closing Meting Email Communications ( Validated Savings by Finance)
Project Review meeting & Closing Meting Email Communications ( Validated Savings by Finance) OE Score ( Monthly ZSC ) Project Update ( Monthly ZSC )
Project Review meeting & Closing Meting Email Communications ( Validated Savings by Finance) OE Communication Board ( Display on shop Floor)
OE Communication Boards ( Displayed on shop floor) Shared with all members in Conference hall
Email Communications by Finance & OE Team members
88

45
Reward & Recognition ( POY )
OE REPORT OUT ( Project Of the Year )
89
Powered by
Thank You
90


![Gujarat Arts & Science College, Ahmedabad Computer … · Gujarat Arts & Science College, Ahmedabad Computer Science Department ... Ahmedabad Computer Science Department[Self Finance]](https://img.dokumen.tips/doc/110x75/5ada6c2a7f8b9a137f8d72c4/gujarat-arts-science-college-ahmedabad-computer-arts-science-college-ahmedabad.jpg)