Embed Size (px)
DESCRIPTION
GNSS Reflection from Bare and Vegetated Soils: Experimental Validation of an End-to-end Simulator. - PowerPoint PPT Presentation
Citation preview

N. Pierdicca1, L. Guerriero2 , R. Giusto1, M. Brogioni3, A. Egido4, N. Floury5
1 DIET - Sapienza Univ. of Rome, Rome, Italy2 DISP - University of Tor Vergata, Rome, Italy3 CNR/IFAC, Sesto Fiorentino. Italy4 Starlab, Barcelona, Spain5 ESA/ESTEC, Noordwyik, The Netherland
GNSS Reflection from Bare and GNSS Reflection from Bare and Vegetated Soils: Experimental Vegetated Soils: Experimental Validation of an End-to-end Validation of an End-to-end SimulatorSimulator

2
ContentContent
Introduction: the Leimon project Simulator description Simulator validation during Leimon Conclusions

3
Land MOnitoring with Navigation signals Evaluating the potential of GNSS signals for remote
sensing soil moisture and vegetation biomass, through a ground based experimental campaign
LEiMON ProjectLEiMON Project
Developing a simulator to theoretically explain experimental data and predict the capability of a GNSS-R aerospace systems
The SAM dual pol GNSS-R instrument (by Starlab)
LEiMON set up

4
The LEIMON experimentThe LEIMON experimentFDR and TDR soil moisture probes
Meteo station
Soil roughness profilometer
Bare (different roughness) and vegetated fields
Plant height and water content

5
Time serie overviewTime serie overview
West field with developed plants

6
|Y |2 Processed signal power at the receiver vs. delay and frequency f.PT The transmitted power of the GPS satellite.GT , GR The antenna gains of the transmitting and the receiving instrument.RR, RT The distance from target on the surface to receiving and transmitting
antennas.Ti The coherent integration time used in signal processing. Bistatic scattering coefficient2 The GPS correlation (triangle) function S2 The attenuation sinc function due to Doppler misalignment dA Differential area within scattering surface area A (the glistening zone).
The mean power of received signal vs. delay and frequency f is modeled by integral Bistatic Radar Equation which includes time delay domain response ’ and Doppler domain response S2 (f’-f ) of the system (Zavorotny and Voronovich, 2000).
dARR
ffSGGPTfY
TR
RTTi 022
22
3
222
)'()'(
)4()ˆ,ˆ(
The Bistatic Radar EquationThe Bistatic Radar Equation

7
The BRE integrationThe BRE integration
In order to solve the integral we have to introduce the equations relating all those variables to the coordinates over the surface.
dARR
ffSGGPTfY
TR
RTTi 022
22
3
222
)'()'(
)4()ˆ,ˆ(
function of point scattering delay
function of point looking direction wrt boresight
function of incidence direction function of point
wrt RX and TX position
function of point bistatic angle (zenith and azimuth)
function of point scattering Doppler
Integrand variables are the coordinates defined on the surface

8
Local vs global framesLocal vs global frames
Elliptic Earth approximation x’y’z’ local frame centered in the specular point z’ axes along the geodetic vertical x’z’ plane coincident with the bistatic scattering plane
z’
x’
y’ TX
RX
SP=[xs,ys,zs]ECEFF
Earth ellipsoide
is =i
Earth surface
x
z
y
Given RX and TX trajectory/velocity & epoch, integral is computed in the local frame, where soil/vegetation parms are defined
9
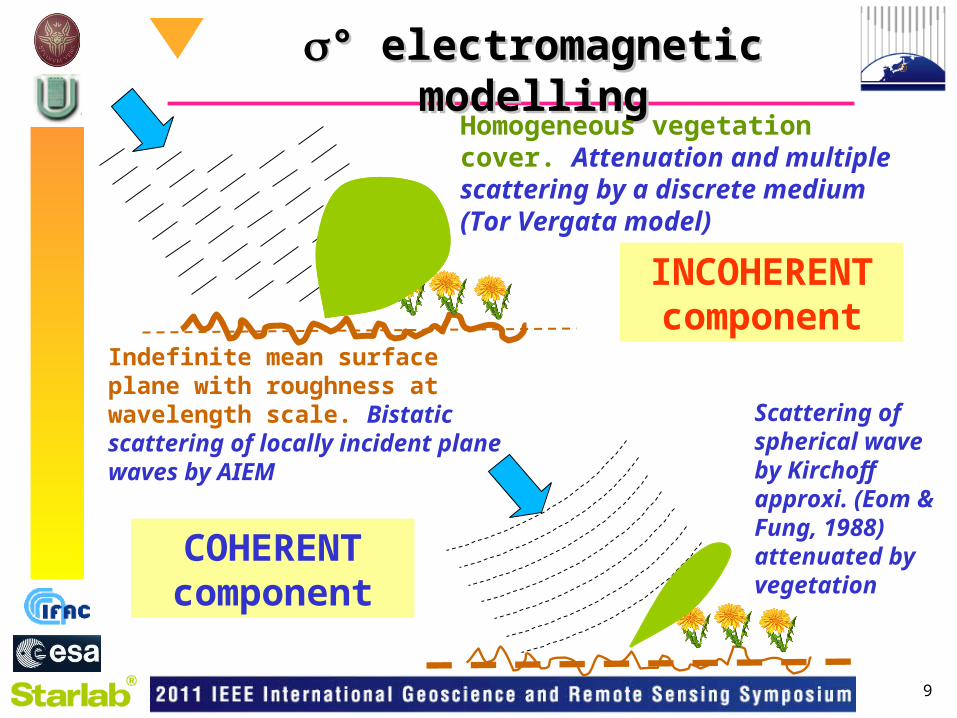
° electromagnetic modelling° electromagnetic modelling
Indefinite mean surface plane with roughness at wavelength scale. Bistatic scattering of locally incident plane waves by AIEM
Homogeneous vegetation cover. Attenuation and multiple scattering by a discrete medium (Tor Vergata model)
INCOHERENT
component
COHERENT component
Scattering of spherical wave by Kirchoff approxi. (Eom & Fung, 1988) attenuated by vegetation

10
Polarization synthesis for real antennasPolarization synthesis for real antennas
hhhv
vhvvBSAtBSAr
tinc
rrec
rt ss
ss
P
PrSpSp 4
4 22
Nominal polarization unit vector are pRHCP=(0-j0)/√2 and pLHCP=(0+j0)/√2
Real antenna polariz. unit vector
SCS of “real” antennas and channel cross talk
x
y
z P=r,,
2
00
cos1
cos
jRHCP θp
2 orthogonal electric dipoles /2 phase shifted
2
2
1
2
1
21
cos
cos1
14
jjLR S

11
The signal simulator structureThe signal simulator structure
Geometric module:• GPS TX orbit• SP position
E.M. bare soil bistatic ° model
Simulator core
E.M. vegetation bistatic ° model

12
AIEM vs scattering direction AIEM vs scattering direction ss,,ss
i=31°mv=20 % z=1.5 cml=5 cmHRX=10 kmHPBW=120°
Incoherent component RR & LR more spread
Coherent component RR & LR focused around specular s=31°
Azi
mu
th
Azi
mu
th
Zenith Zenith

13
DDM output exampleDDM output exampleDDM’s (delay on the horizontal axes, frequency on the vertical axes) for incoherent (top) and coherent (bottom) component at RHCP (left) and LHCP (right)
Spaceborne incoherent
airbone incoherent

14
Peak power output examplePeak power output example
mv=20 % z=1.5 cml=5 cmHRX=10 kmVRX=180 m/sHeadRX=45°HPBW=120°
Coherent and incoherent RR & LR peak power as the satellite moves along the orbit

15
The incoherent signal fluctuates (speckle) with long correlation time (15 sec) so only incoherent summation was feasible
Different soil/vegetation conditions investigated
Leimon dataLeimon data In the Leimon experiment the instrument records
temporal series of the direct and reflected signals (I&Q of the correlator output peak)
The mean reflected power (both LR and RR pol) normalized to the mean direct power (at RR pol.) is studied vs. the incidence angle
reflected
direct

16
August 26th SMC=10%
• East Z=0.6 cm
• West Z=1cm
April 8th SMC=30%
• East field Z=3cm
• West field Z=1.75cm
Simulator reproduces quite well LR signal versus at incidence angles ≤45°.
Validation: angular trendValidation: angular trend

17
August 26th SMC=10%
• East Z=0.6 cm
April 8th SMC=30%
• East Z=3cm
Theoretical simulations show that incoherent component strongly contributes to total signal when soil is rough.
Coherent vs. incoherent: soilCoherent vs. incoherent: soil
coherent
total

18
General overestimation of the DOWN/UP ratio but good correlation
Cross talk and/or different down and up antenna gains could explain the bias
RMSE=1.6 dB Bias=-1.4 dB
Bare soil overall comparison LRBare soil overall comparison LREast Side, West Side
Bare Soils 10%<SMC<30%
0.6<z<3cm

19
RMSE=7.25 dBBias=6.1 dB
The model underestimates RR polarization, especially at smaller angles
The RR measurements seem to saturate at -18 dB A deficiency of the mode could occur
Bare soil overall comparison RRBare soil overall comparison RREast Side, West Side
2020
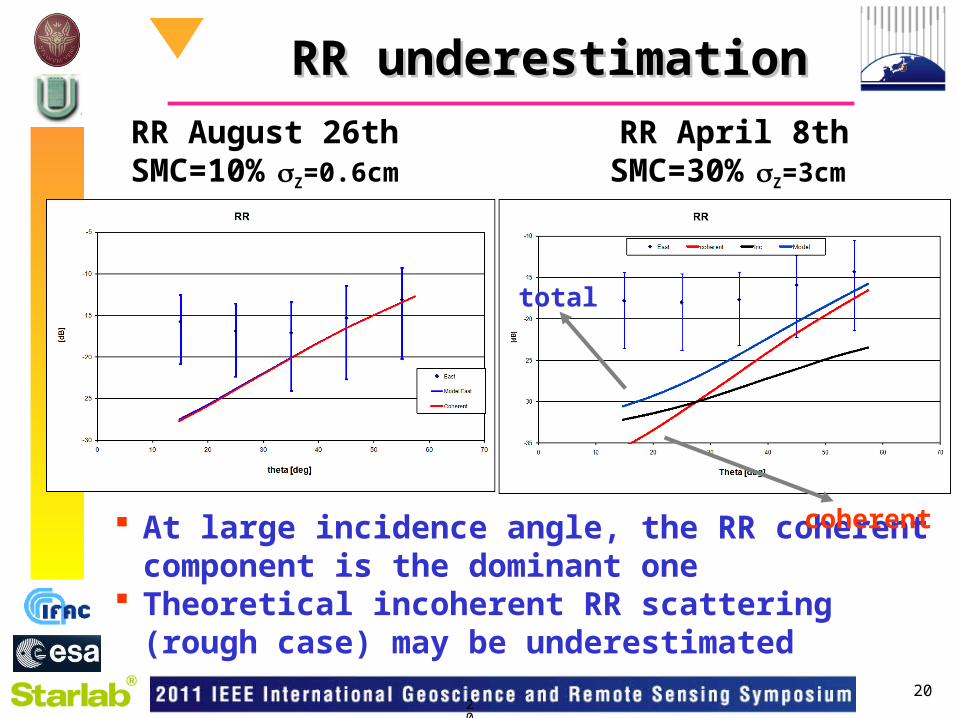
RR underestimationRR underestimation
RR August 26th SMC=10% Z=0.6cm
At large incidence angle, the RR coherent component is the dominant one
Theoretical incoherent RR scattering (rough case) may be underestimated
RR April 8th SMC=30% Z=3cm
coherent
total
21
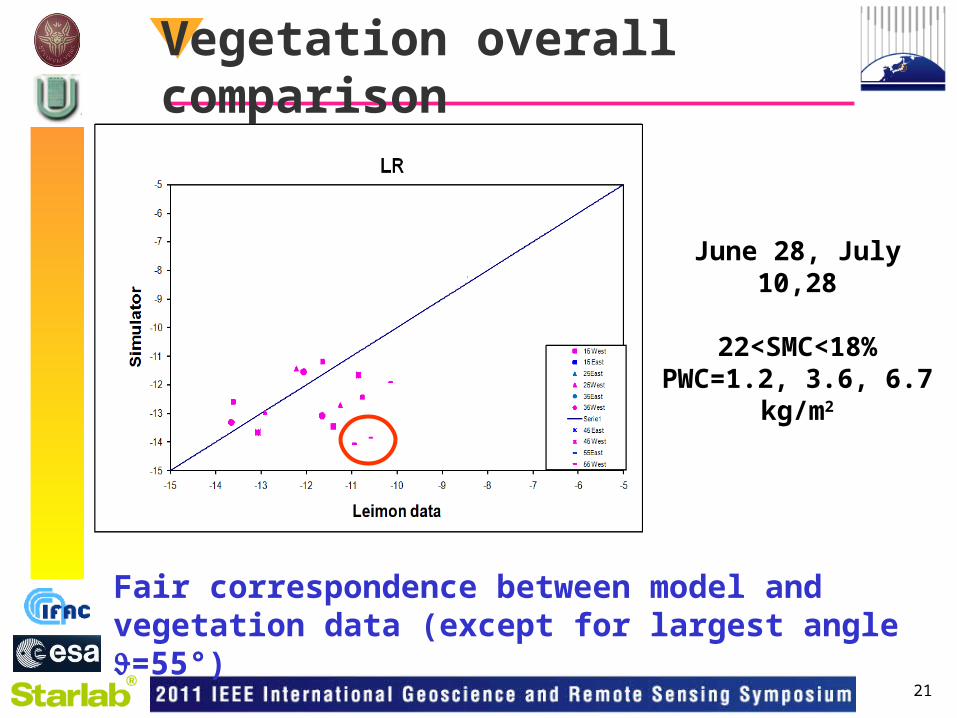
Vegetation overall comparison
Fair correspondence between model and vegetation data (except for largest angle =55°)
June 28, July 10,28
22<SMC<18%PWC=1.2, 3.6, 6.7 kg/m2

22
Sensitivity to SMCSensitivity to SMCBlack: Leimon data (May) and regression line Blue/Red: Theoretical simulations, two roughnesses
Model predicts 2.5 dB for a 10% SMC difference Leimon shows 2.8 dB

23
Sensitivity to vegetation Sensitivity to vegetation Magenta: Leimon data Green: Theoretical simulations vs. PWC
Model sensitivity reproduces the measured oneSensitivity to vegetation is quite low: about 2 dB for
the whole PWC range

24
Coherent vs Incoherent: vegetationCoherent vs Incoherent: vegetation
At 35°, the coherent component is attenuated by about 1 dB each 1kg/m2, which would predict a large sensitivity to PWC
The Simulator predicts a quite large incoherent component which explains the saturation effect with PWC in the data.
The model reproduces the measured trend thanks to the consideration of both component

25
ConclusionsConclusions A simulator has been developed which provides DDM’s
and waveforms of a GNSS-R system looking at land It takes as input arbitrary receiver position/velocity, in view
GPS satellite PRN code, surface properties (soil moisture, roughness, vegetation parameters).
It singles out coherent and incoherent signal components. A fair agreement has been found at LR polarization and
angles <45° (the antenna beamwidth) Incoherent component may be high in a ground based
configuration, and antenna properties must be considered Sensitivity to SMC is significant and well reproduced Sensitivity to vegetation is reproduced and it is quite low
because of the coherent and incoherent combination. A few discrepancies could be due to measurement or
model problems (of course) and are under investigation

26