Embed Size (px)
Citation preview
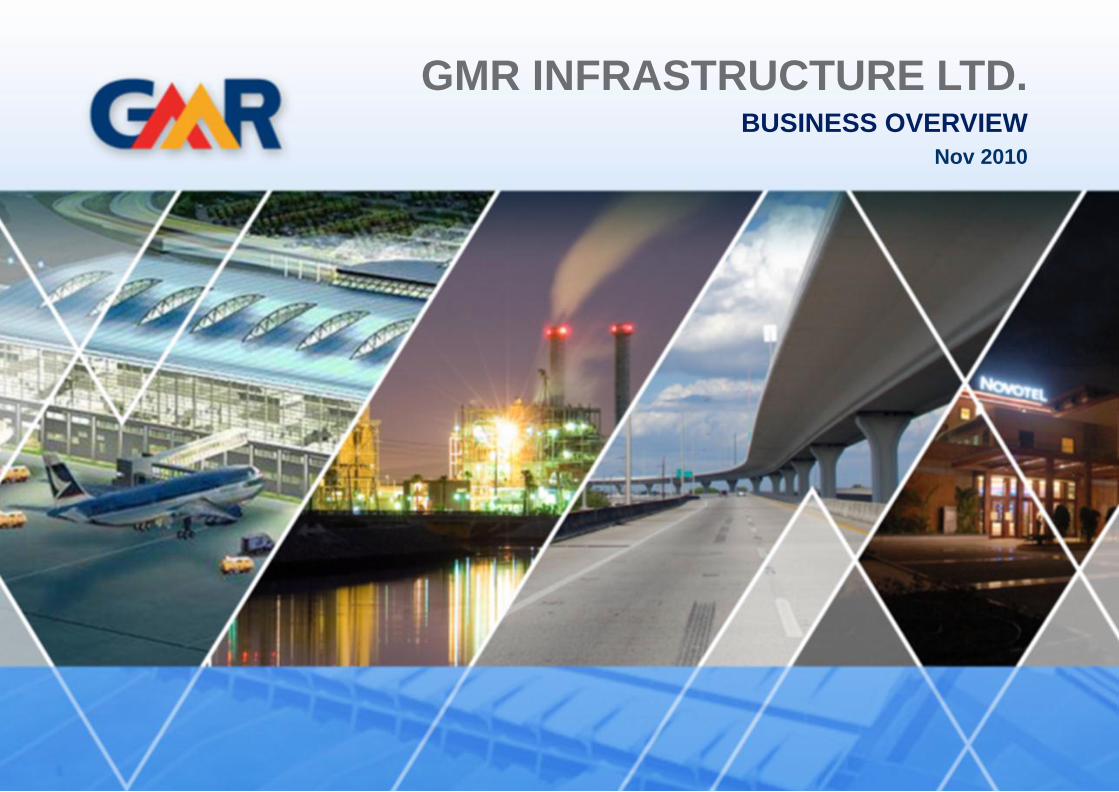
GMR INFRASTRUCTURE LTD. BUSINESS OVERVIEW
Nov 2010
1
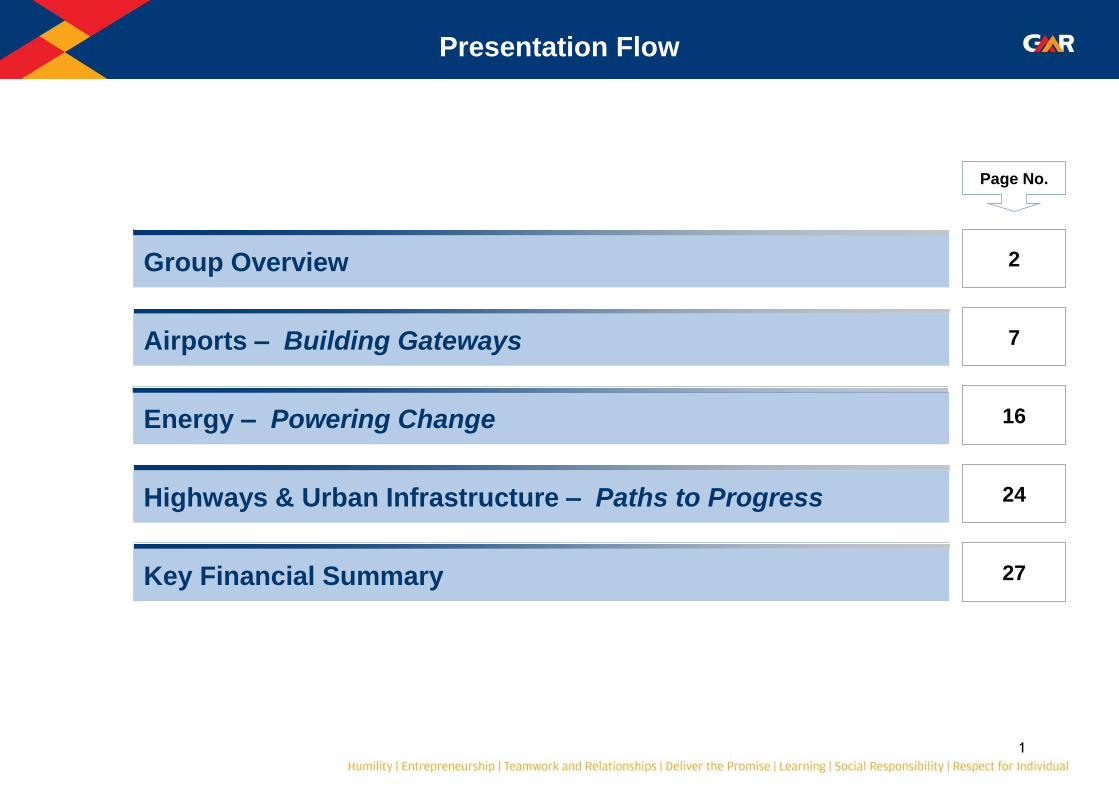
Presentation Flow
Page No.
2 Group Overview
16 Energy – Powering Change
27 Key Financial Summary
24 Highways & Urban Infrastructure – Paths to Progress
7 Airports – Building Gateways

Group Overview
3
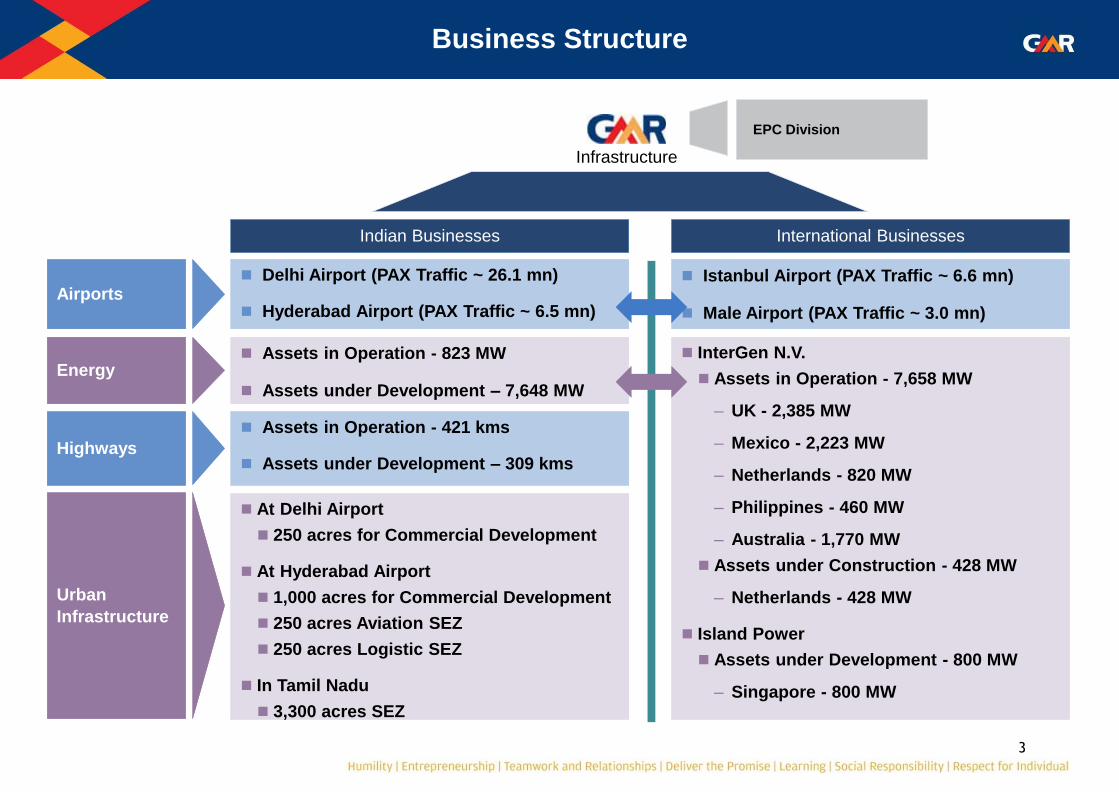
Business Structure
Infrastructure
Indian Businesses International Businesses
InterGen N.V.
Assets in Operation - 7,658 MW
– UK - 2,385 MW
– Mexico - 2,223 MW
– Netherlands - 820 MW
– Philippines - 460 MW
– Australia - 1,770 MW
Assets under Construction - 428 MW
– Netherlands - 428 MW
Island Power
Assets under Development - 800 MW
– Singapore - 800 MW
Airports Istanbul Airport (PAX Traffic ~ 6.6 mn)
Male Airport (PAX Traffic ~ 3.0 mn)
Delhi Airport (PAX Traffic ~ 26.1 mn)
Hyderabad Airport (PAX Traffic ~ 6.5 mn)
Energy Assets in Operation - 823 MW
Assets under Development – 7,648 MW
Highways
Assets in Operation - 421 kms
Assets under Development – 309 kms
Urban
Infrastructure
At Delhi Airport
250 acres for Commercial Development
At Hyderabad Airport
1,000 acres for Commercial Development
250 acres Aviation SEZ
250 acres Logistic SEZ
In Tamil Nadu
3,300 acres SEZ
EPC Division
4
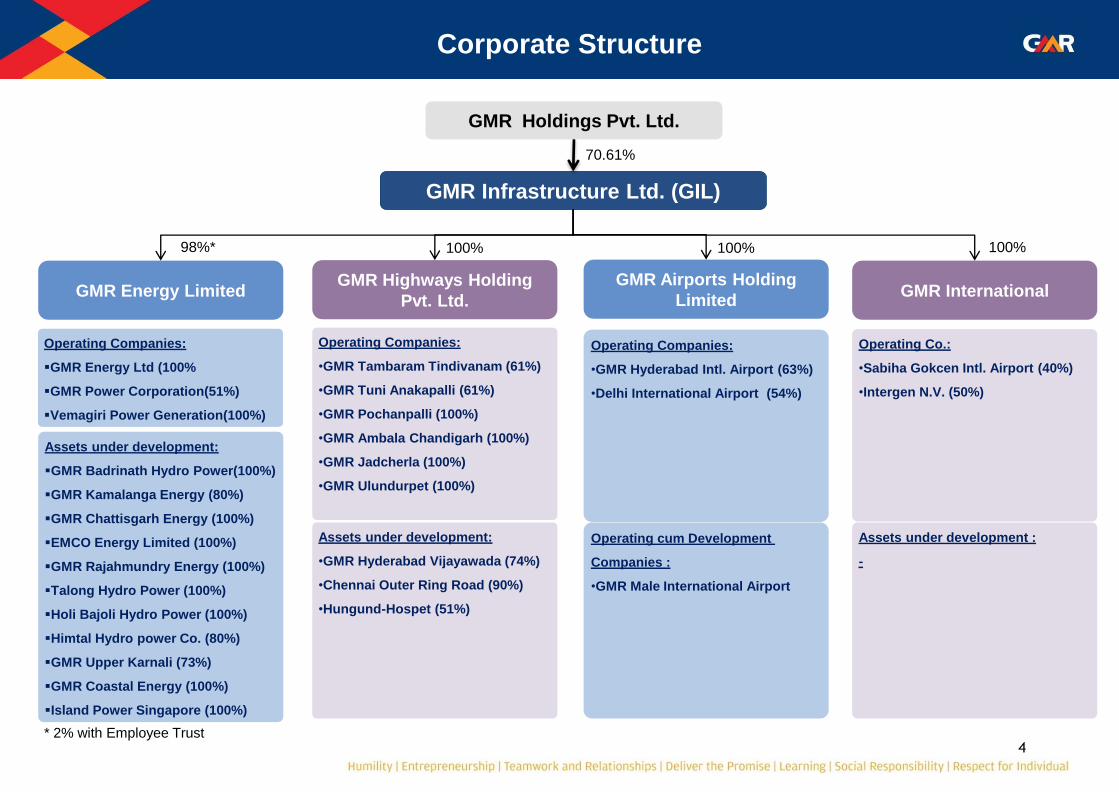
GMR International GMR Airports Holding
Limited
GMR Highways Holding
Pvt. Ltd. GMR Energy Limited
Operating Co.:
•Sabiha Gokcen Intl. Airport (40%)
•Intergen N.V. (50%)
Operating Companies:
•GMR Hyderabad Intl. Airport (63%)
•Delhi International Airport (54%)
Operating Companies:
•GMR Tambaram Tindivanam (61%)
•GMR Tuni Anakapalli (61%)
•GMR Pochanpalli (100%)
•GMR Ambala Chandigarh (100%)
•GMR Jadcherla (100%)
•GMR Ulundurpet (100%)
Corporate Structure
GMR Infrastructure Ltd. (GIL)
GMR Holdings Pvt. Ltd.
98%* 100% 100% 100%
Assets under development:
GMR Badrinath Hydro Power(100%)
GMR Kamalanga Energy (80%)
GMR Chattisgarh Energy (100%)
EMCO Energy Limited (100%)
GMR Rajahmundry Energy (100%)
Talong Hydro Power (100%)
Holi Bajoli Hydro Power (100%)
Himtal Hydro power Co. (80%)
GMR Upper Karnali (73%)
GMR Coastal Energy (100%)
Island Power Singapore (100%)
Assets under development:
•GMR Hyderabad Vijayawada (74%)
•Chennai Outer Ring Road (90%)
•Hungund-Hospet (51%)
Operating cum Development
Companies :
•GMR Male International Airport
Assets under development :
-
70.61%
* 2% with Employee Trust
Operating Companies:
GMR Energy Ltd (100%
GMR Power Corporation(51%)
Vemagiri Power Generation(100%)
5
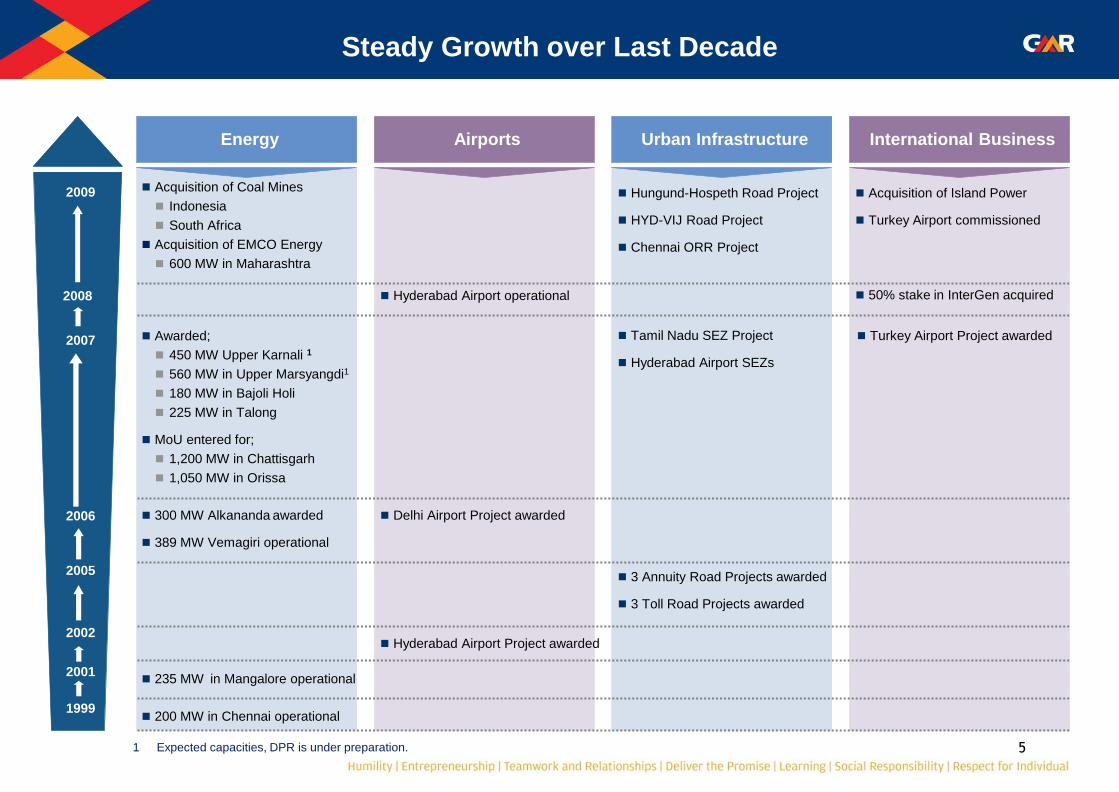
Steady Growth over Last Decade
1 Expected capacities, DPR is under preparation.
Airports
Hyderabad Airport Project awarded
Energy
200 MW in Chennai operational
235 MW in Mangalore operational
Delhi Airport Project awarded 300 MW Alkananda awarded
389 MW Vemagiri operational
Acquisition of Coal Mines
Indonesia
South Africa
Acquisition of EMCO Energy
600 MW in Maharashtra
Urban Infrastructure
3 Annuity Road Projects awarded
3 Toll Road Projects awarded
Hungund-Hospeth Road Project
HYD-VIJ Road Project
Chennai ORR Project
International Business
Awarded;
450 MW Upper Karnali 1
560 MW in Upper Marsyangdi1
180 MW in Bajoli Holi
225 MW in Talong
MoU entered for;
1,200 MW in Chattisgarh
1,050 MW in Orissa
Tamil Nadu SEZ Project
Hyderabad Airport SEZs
Turkey Airport Project awarded
Hyderabad Airport operational 50% stake in InterGen acquired
Acquisition of Island Power
Turkey Airport commissioned
2007
2006
2002
1999
2001
2005
2008
2009
6
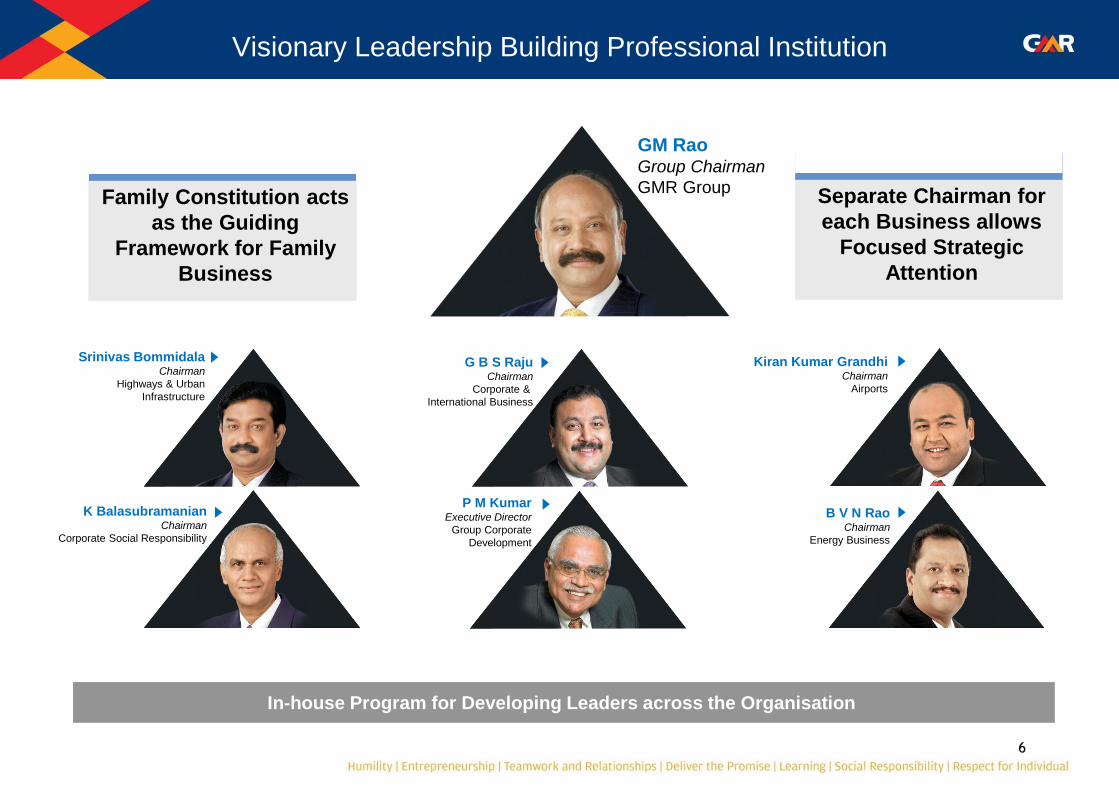
Visionary Leadership Building Professional Institution
GM Rao Group Chairman
GMR Group
Srinivas Bommidala Chairman
Highways & Urban
Infrastructure
K Balasubramanian Chairman
Corporate Social Responsibility
B V N Rao Chairman
Energy Business
Kiran Kumar Grandhi Chairman
Airports
P M Kumar Executive Director
Group Corporate
Development
G B S Raju Chairman
Corporate &
International Business
In-house Program for Developing Leaders across the Organisation
Family Constitution acts
as the Guiding
Framework for Family
Business
Separate Chairman for
each Business allows
Focused Strategic
Attention
Airports – Building Gateways
8
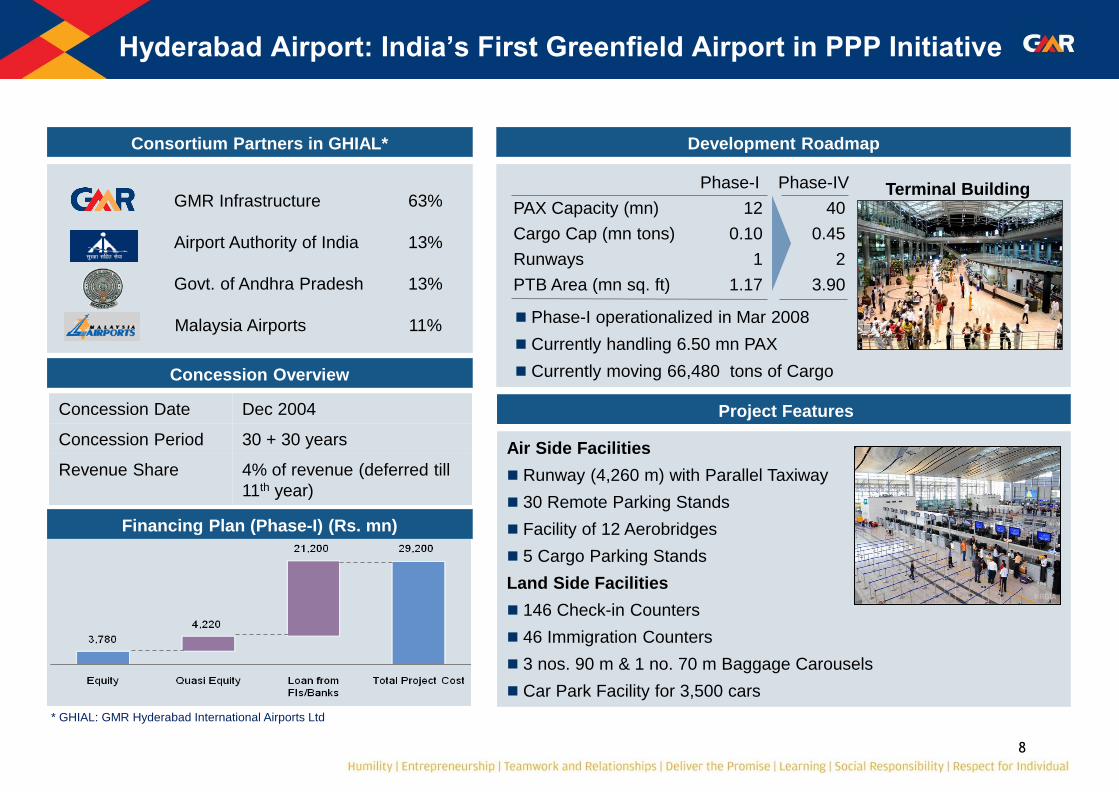
Concession Date Dec 2004
Concession Period 30 + 30 years
Revenue Share 4% of revenue (deferred till
11th year)
Hyderabad Airport: India’s First Greenfield Airport in PPP Initiative
Consortium Partners in GHIAL*
Project Features
Air Side Facilities
Runway (4,260 m) with Parallel Taxiway
30 Remote Parking Stands
Facility of 12 Aerobridges
5 Cargo Parking Stands
Land Side Facilities
146 Check-in Counters
46 Immigration Counters
3 nos. 90 m & 1 no. 70 m Baggage Carousels
Car Park Facility for 3,500 cars
Financing Plan (Phase-I) (Rs. mn)
Development Roadmap
Terminal Building
Phase-I operationalized in Mar 2008
Currently handling 6.50 mn PAX
Currently moving 66,480 tons of Cargo
Concession Overview
Phase-I Phase-IV
PAX Capacity (mn) 12 40
Cargo Cap (mn tons) 0.10 0.45
Runways 1 2
PTB Area (mn sq. ft) 1.17 3.90
GMR Infrastructure 63%
Airport Authority of India 13%
Govt. of Andhra Pradesh 13%
Malaysia Airports 11%
* GHIAL: GMR Hyderabad International Airports Ltd

9
19835 18812 22973 27119 23923 29361
13952 17459
23438 24059 33314
37119
30139 43016
59894 70980 68762 66899 7352
9155
9719
10992 12077 13557
2.1 3.04
4.57 5.52
4.65 4.8 0.75
1.00
1.21
1.43 1.57 1.69
Hyderabad Airport: Annual Operational Performance
CAGR: 19.7%
(in m
n)
CAGR: 18.1%
(in n
os.)
CAGR: 14.3%
Cargo Traffic Movement
Air Traffic Movements (ATMs) Passengers (PAX)
3
2 1
Hyderabad Airport
(in
tons)
2.85
4.04
5.78
6.95 6.22
37,491
52,171
69,613
81,972 80,456
33787 36271
46411 51178
66480
6.49
80,839
57237
FY05 FY06 FY07 FY08 FY09 FY10 FY05 FY06 FY07 FY08 FY09 FY10
FY05 FY06 FY07 FY08 FY09 FY10
Domestic International

10
Hyderabad Airport: 1,500 Acres of Property Development
Superior connectivity of Airport with City to further enhance the value of land
11.4 km 4 lane Elevated Expressway operational from Oct 2009 – reducing time taken to reach the city centre to 45min
Outer Ring Road Phase-I operational - reducing time taken to reach IT District (HiTech City) to 30min
Enhanced connectivity with completion of Metro Lines planned in future
Healthport
(~25 Acres)
Multi-Specialty Hospital focused on medical tourism as the anchor
Research & Clinical Trial Facilities
Medical education and training facilities
Funport
(~145 Acres)
Amusement Park with Destination Retail and Multi Purpose Arena as the
anchor
Discussion with leading global and Indian players in entertainment and sporting
events and content provision
Commercial
District
(~ 75 Acres)
Convention Centre cum Exhibition Facility as the anchor
Office Space, Hotels, Restaurants & supporting Retail facilities
Discussions with leading international convention and exhibition organization
Eduport
(~40 Acres)
International Business Institution and an International School as anchors
Supporting Retail and Sports Facility
Discussions currently in progress with leading global and Indian business
schools
Creating a theme-based, anchor-led mixed-use Airport City with Phase-I being 275 acres
11
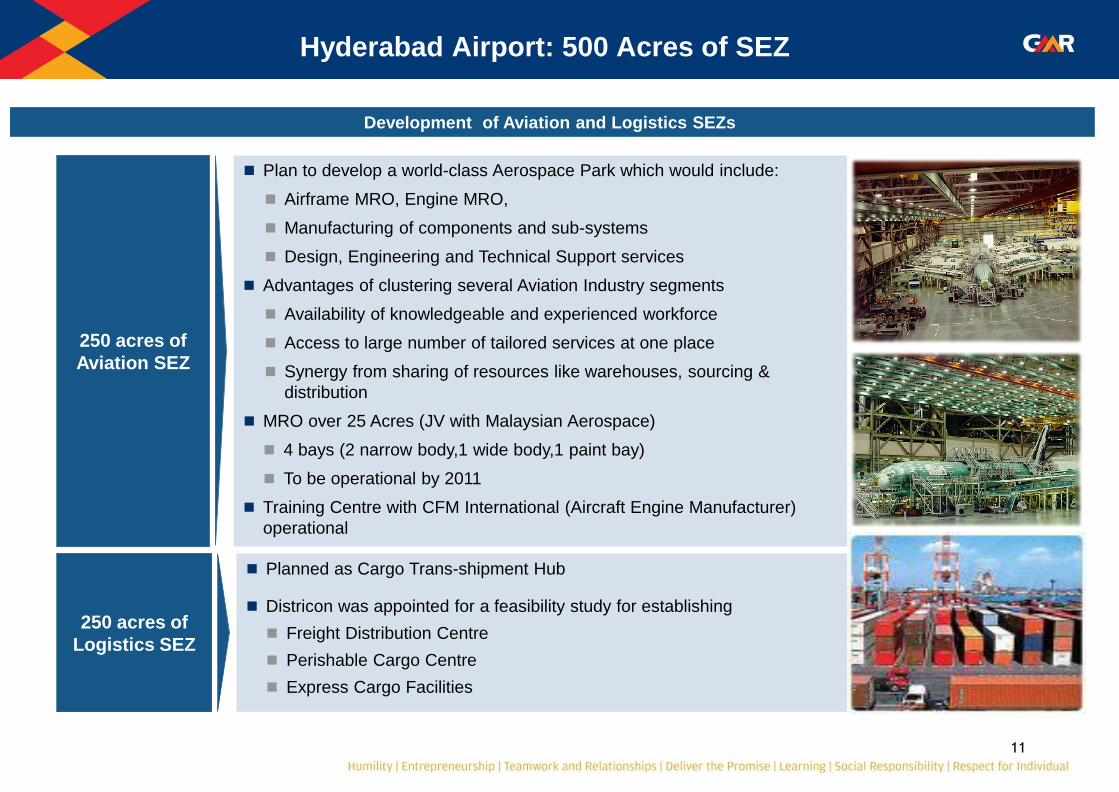
Hyderabad Airport: 500 Acres of SEZ
250 acres of
Aviation SEZ
Plan to develop a world-class Aerospace Park which would include:
Airframe MRO, Engine MRO,
Manufacturing of components and sub-systems
Design, Engineering and Technical Support services
Advantages of clustering several Aviation Industry segments
Availability of knowledgeable and experienced workforce
Access to large number of tailored services at one place
Synergy from sharing of resources like warehouses, sourcing &
distribution
MRO over 25 Acres (JV with Malaysian Aerospace)
4 bays (2 narrow body,1 wide body,1 paint bay)
To be operational by 2011
Training Centre with CFM International (Aircraft Engine Manufacturer)
operational
250 acres of
Logistics SEZ
Planned as Cargo Trans-shipment Hub
Districon was appointed for a feasibility study for establishing
Freight Distribution Centre
Perishable Cargo Centre
Express Cargo Facilities
Development of Aviation and Logistics SEZs
12
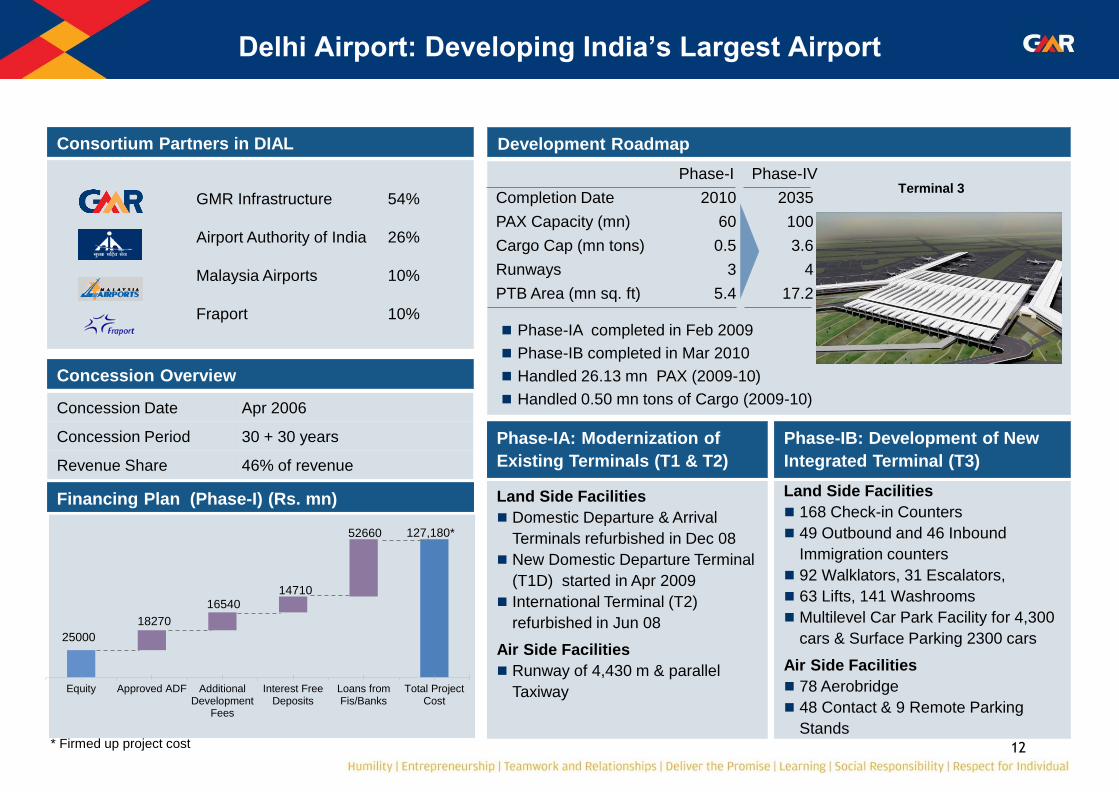
Phase-I Phase-IV
Completion Date 2010 2035
PAX Capacity (mn) 60 100
Cargo Cap (mn tons) 0.5 3.6
Runways 3 4
PTB Area (mn sq. ft) 5.4 17.2
GMR Infrastructure 54%
Airport Authority of India 26%
Malaysia Airports 10%
Fraport 10%
Delhi Airport: Developing India’s Largest Airport
Consortium Partners in DIAL
Financing Plan (Phase-I) (Rs. mn)
Development Roadmap
Concession Overview
Phase-IB: Development of New
Integrated Terminal (T3)
Phase-IA: Modernization of
Existing Terminals (T1 & T2)
Land Side Facilities
168 Check-in Counters
49 Outbound and 46 Inbound
Immigration counters
92 Walklators, 31 Escalators,
63 Lifts, 141 Washrooms
Multilevel Car Park Facility for 4,300
cars & Surface Parking 2300 cars
Air Side Facilities
78 Aerobridge
48 Contact & 9 Remote Parking
Stands
Land Side Facilities
Domestic Departure & Arrival
Terminals refurbished in Dec 08
New Domestic Departure Terminal
(T1D) started in Apr 2009
International Terminal (T2)
refurbished in Jun 08
Air Side Facilities
Runway of 4,430 m & parallel
Taxiway
Terminal 3
Phase-IA completed in Feb 2009
Phase-IB completed in Mar 2010
Handled 26.13 mn PAX (2009-10)
Handled 0.50 mn tons of Cargo (2009-10) Concession Date Apr 2006
Concession Period 30 + 30 years
Revenue Share 46% of revenue
25000
18270
16540 14710
52660 127,180*
Equity Approved ADF AdditionalDevelopment
Fees
Interest FreeDeposits
Loans fromFis/Banks
Total ProjectCost
* Firmed up project cost
13
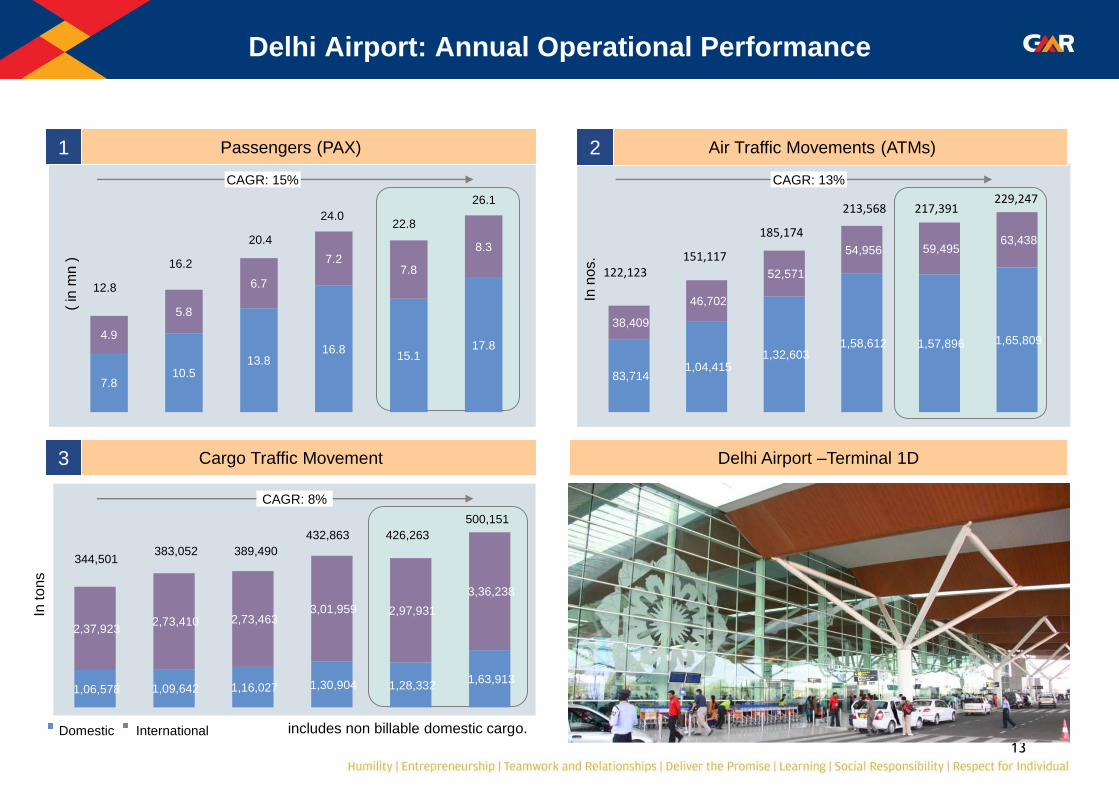
Delhi Airport: Annual Operational Performance
Cargo Traffic Movement
Air Traffic Movements (ATMs) Passengers (PAX)
3
2 1
Delhi Airport –Terminal 1D
7.8 10.5
13.8 16.8
15.1 17.8
4.9
5.8
6.7
7.2 7.8
8.3
12.8
16.2
20.4
24.0 22.8
26.1
CAGR: 15%
83,714 1,04,415
1,32,603 1,58,612 1,57,896 1,65,809
38,409
46,702
52,571
54,956 59,495 63,438
122,123 151,117
185,174
213,568 217,391 229,247
CAGR: 13%
( in
mn )
In n
os.
In to
ns
CAGR: 8%
includes non billable domestic cargo.
1,06,578 1,09,642 1,16,027 1,30,904 1,28,332 1,63,913
2,37,923 2,73,410 2,73,463
3,01,959 2,97,931
3,36,238
344,501 383,052 389,490
432,863 426,263
500,151
Domestic International
14
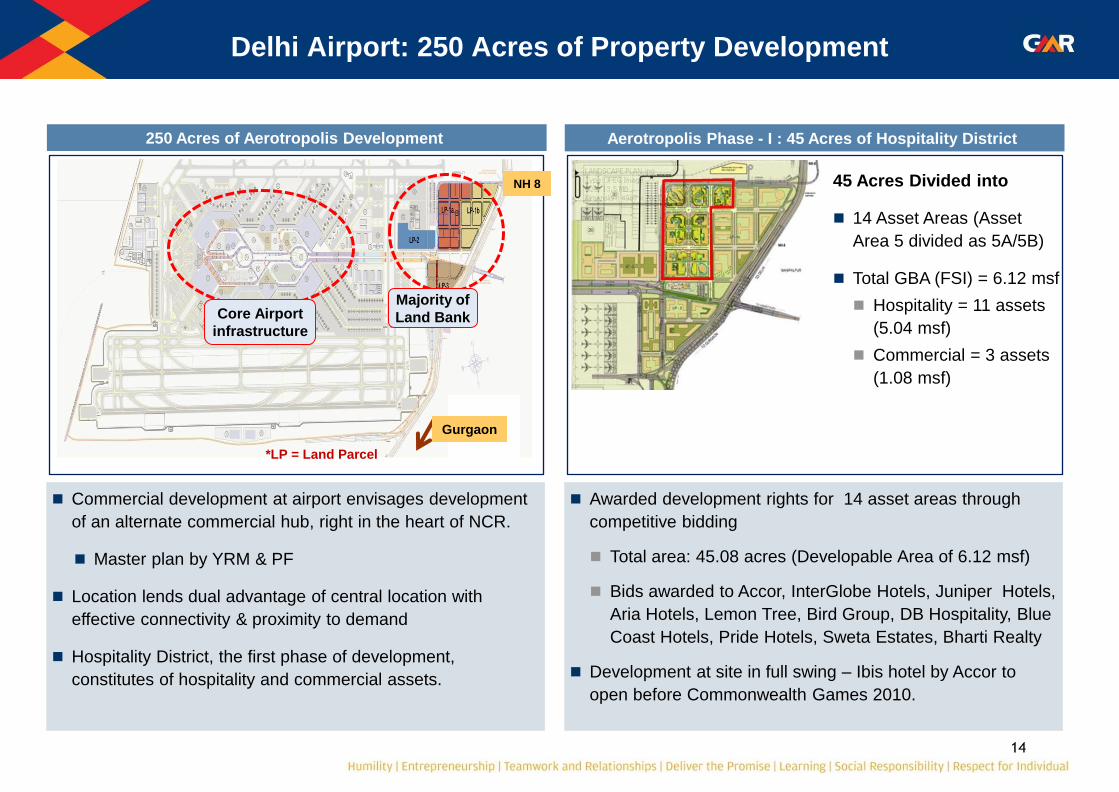
Delhi Airport: 250 Acres of Property Development
250 Acres of Aerotropolis Development Aerotropolis Phase - I : 45 Acres of Hospitality District
45 Acres Divided into
14 Asset Areas (Asset
Area 5 divided as 5A/5B)
Total GBA (FSI) = 6.12 msf
Hospitality = 11 assets
(5.04 msf)
Commercial = 3 assets
(1.08 msf)
Commercial development at airport envisages development
of an alternate commercial hub, right in the heart of NCR.
Master plan by YRM & PF
Location lends dual advantage of central location with
effective connectivity & proximity to demand
Hospitality District, the first phase of development,
constitutes of hospitality and commercial assets.
Awarded development rights for 14 asset areas through
competitive bidding
Total area: 45.08 acres (Developable Area of 6.12 msf)
Bids awarded to Accor, InterGlobe Hotels, Juniper Hotels,
Aria Hotels, Lemon Tree, Bird Group, DB Hospitality, Blue
Coast Hotels, Pride Hotels, Sweta Estates, Bharti Realty
Development at site in full swing – Ibis hotel by Accor to
open before Commonwealth Games 2010.
Majority of
Land Bank Core Airport
infrastructure
NH 8
Gurgaon
*LP = Land Parcel
15
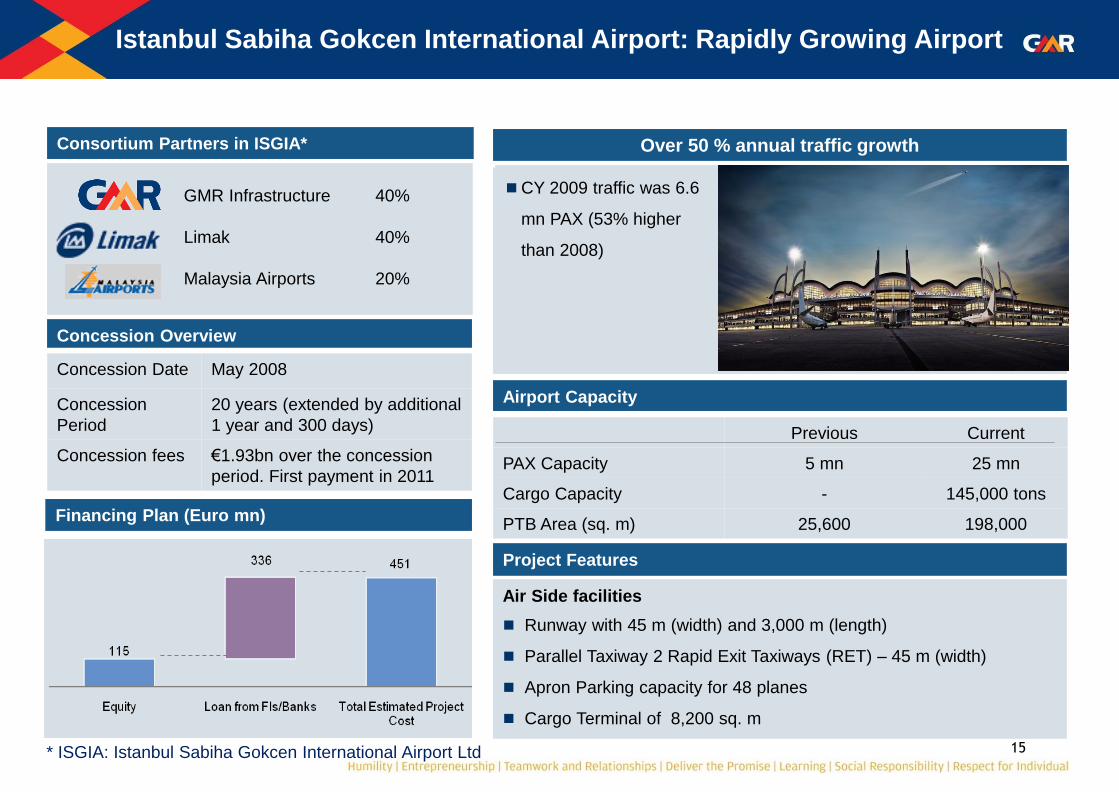
Airport Capacity
Project Features
Air Side facilities
Runway with 45 m (width) and 3,000 m (length)
Parallel Taxiway 2 Rapid Exit Taxiways (RET) – 45 m (width)
Apron Parking capacity for 48 planes
Cargo Terminal of 8,200 sq. m
Istanbul Sabiha Gokcen International Airport: Rapidly Growing Airport
Financing Plan (Euro mn)
Over 50 % annual traffic growth
CY 2009 traffic was 6.6
mn PAX (53% higher
than 2008)
Consortium Partners in ISGIA*
Concession Overview
GMR Infrastructure 40%
Limak 40%
Malaysia Airports 20%
* ISGIA: Istanbul Sabiha Gokcen International Airport Ltd
Concession Date May 2008
Concession
Period
20 years (extended by additional
1 year and 300 days)
Concession fees €1.93bn over the concession
period. First payment in 2011
Previous Current
PAX Capacity 5 mn 25 mn
Cargo Capacity - 145,000 tons
PTB Area (sq. m) 25,600 198,000

16
Airport Capacity
Project Features
Air Side facilities
Runway of 3,200 m with intermediate turnpad at 1,800m from runway
3 connecting taxiways
Apron – 16 Code C stands and 7 Code E stands
Seaplane water runway, jetties and boat pathways
Male International Airport
Financing Plan
High end premium tourist destination
Pax : 3 mn (Est for yr
2010). Achieved 20%+
growth over year 2009
for the first half of the
year
Consortium Partners
Concession Overview
GMR Infrastructure 77%
Malaysia Airports 23%
Concession Date Jan 2011
Concession
Period
25 years (extended by additional
10 years on mutual consent)
Concession fees Upfront : USD 78 mn
Fixed annual : USD 1.5 mn
Previous Current
PAX Capacity 2.6 mn 5.2 mn
Cargo terminal 10000 sq mts
Total est. Project Cost USD 511 mn
ADC of $25 per departing international passenger
from 1st Jan 2012.
17
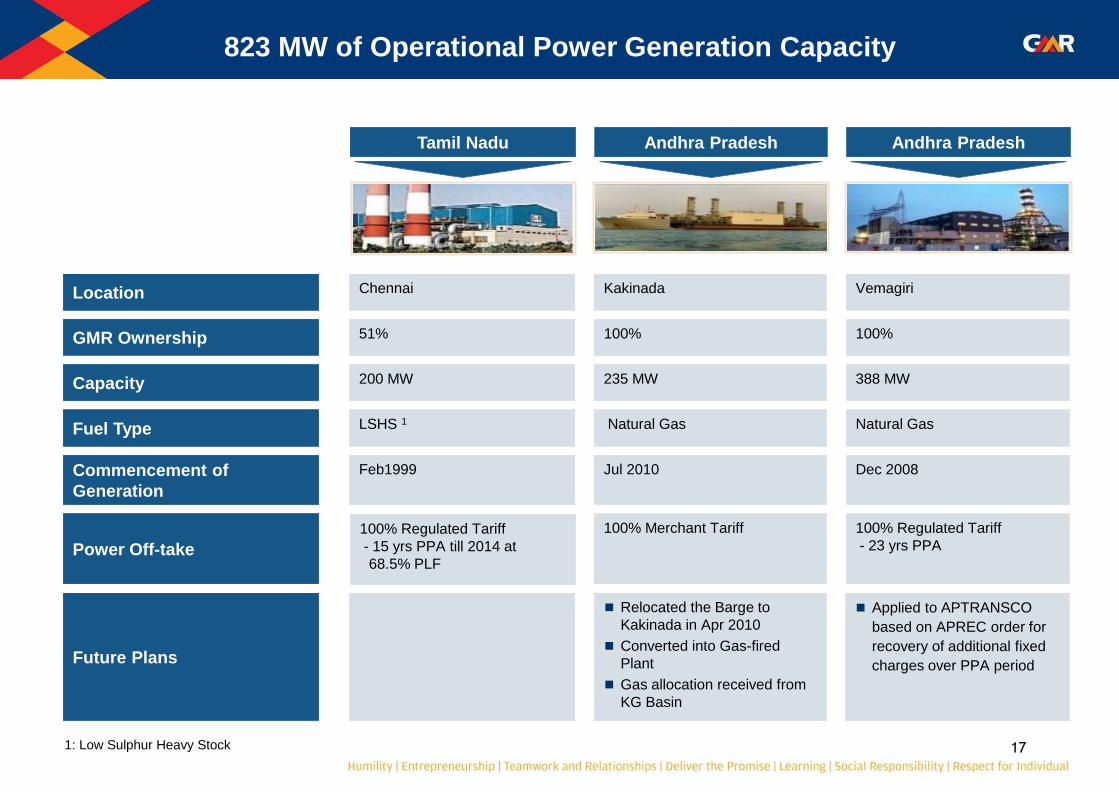
823 MW of Operational Power Generation Capacity
Location
Capacity
Fuel Type
Commencement of
Generation
GMR Ownership
Future Plans
Power Off-take
Andhra Pradesh
Vemagiri
388 MW
Natural Gas
Dec 2008
100%
Applied to APTRANSCO
based on APREC order for
recovery of additional fixed
charges over PPA period
100% Regulated Tariff
- 23 yrs PPA
Tamil Nadu
Chennai
200 MW
LSHS 1
Feb1999
51%
100% Regulated Tariff
- 15 yrs PPA till 2014 at
68.5% PLF
Andhra Pradesh
Kakinada
235 MW
Natural Gas
Jul 2010
100%
Relocated the Barge to
Kakinada in Apr 2010
Converted into Gas-fired
Plant
Gas allocation received from
KG Basin
100% Merchant Tariff
1: Low Sulphur Heavy Stock

Energy – Powering Change

19
823
768
2,000
1,370
1,670
1,840 8,471
0
1,000
2,000
3,000
4,000
5,000
6,000
7,000
8,000
9,000
2009 2012 2013 2014 2015 2016 UltimateCapacity
Well Diversified Power Project Portfolio in India
Project Pipeline (MW)
Balanced
fuel mix
Good portfolio of coal, gas & liquid
fuel and hydro projects
Portfolio approach
to revenue mix
Healthy mix of Merchant and PPA
based projects
Ensuring fuel
security
Acquisition of Coal Mines
(Indonesia and South Africa)
Diversification into
related areas
Power Trading and Transmission
Operational Assets
3 Projects
(823 MW)
Projects under Construction/Development
10 Projects
(7,648 MW)
8,471 MW of power projects spread across the country
Bajoli Holi
Alaknanda
Orissa
Vemagiri
Chennai
Mangalore
Upper Karnali
Upper Marsyangdi
Vemagiri
Expansion
Talong
Emco Energy
Chattisgarh
Financial Year
Madhya
Pradesh
20
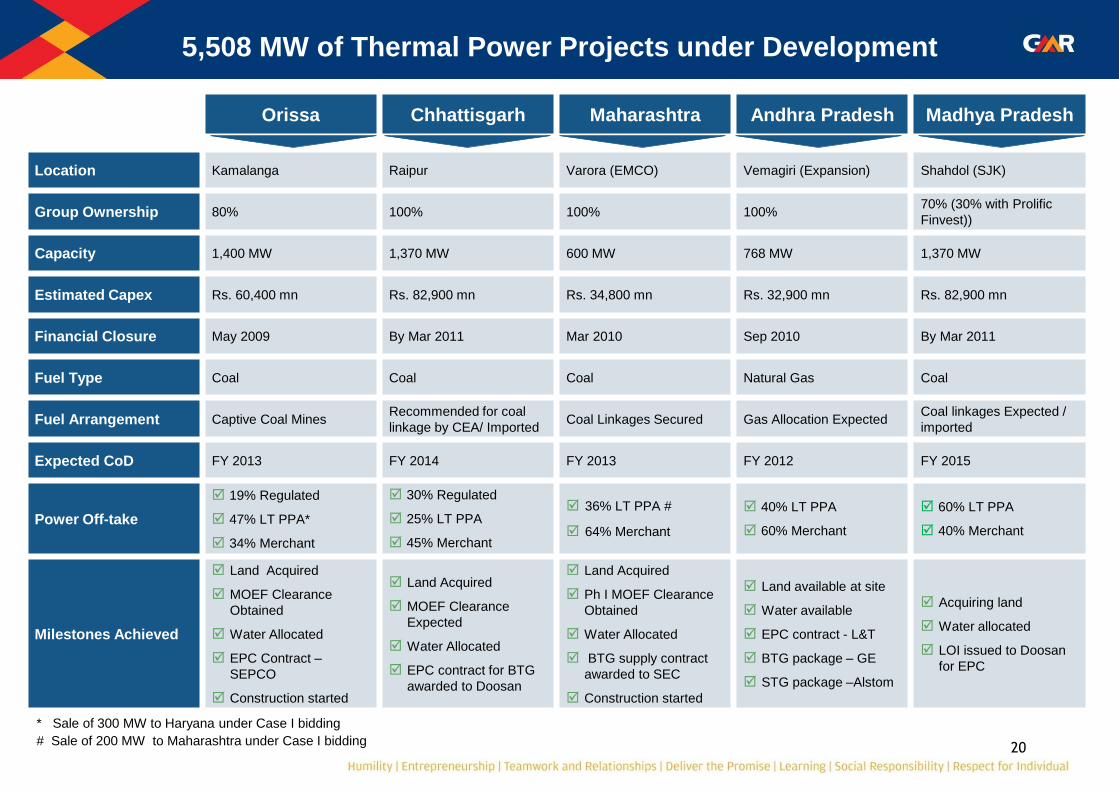
5,508 MW of Thermal Power Projects under Development
* Sale of 300 MW to Haryana under Case I bidding
# Sale of 200 MW to Maharashtra under Case I bidding
Orissa Chhattisgarh Maharashtra Andhra Pradesh Madhya Pradesh
Location Kamalanga Raipur Varora (EMCO) Vemagiri (Expansion) Shahdol (SJK)
Group Ownership 80% 100% 100% 100% 70% (30% with Prolific
Finvest))
Capacity 1,400 MW 1,370 MW 600 MW 768 MW 1,370 MW
Estimated Capex Rs. 60,400 mn Rs. 82,900 mn Rs. 34,800 mn Rs. 32,900 mn Rs. 82,900 mn
Financial Closure May 2009 By Mar 2011 Mar 2010 Sep 2010 By Mar 2011
Fuel Type Coal Coal Coal Natural Gas Coal
Fuel Arrangement Captive Coal Mines Recommended for coal
linkage by CEA/ Imported Coal Linkages Secured Gas Allocation Expected
Coal linkages Expected /
imported
Expected CoD FY 2013 FY 2014 FY 2013 FY 2012 FY 2015
Power Off-take
19% Regulated
47% LT PPA*
34% Merchant
30% Regulated
25% LT PPA
45% Merchant
36% LT PPA #
64% Merchant
40% LT PPA
60% Merchant
60% LT PPA
40% Merchant
Milestones Achieved
Land Acquired
MOEF Clearance
Obtained
Water Allocated
EPC Contract –
SEPCO
Construction started
Land Acquired
MOEF Clearance
Expected
Water Allocated
EPC contract for BTG
awarded to Doosan
Land Acquired
Ph I MOEF Clearance
Obtained
Water Allocated
BTG supply contract
awarded to SEC
Construction started
Land available at site
Water available
EPC contract - L&T
BTG package – GE
STG package –Alstom
Acquiring land
Water allocated
LOI issued to Doosan
for EPC
21
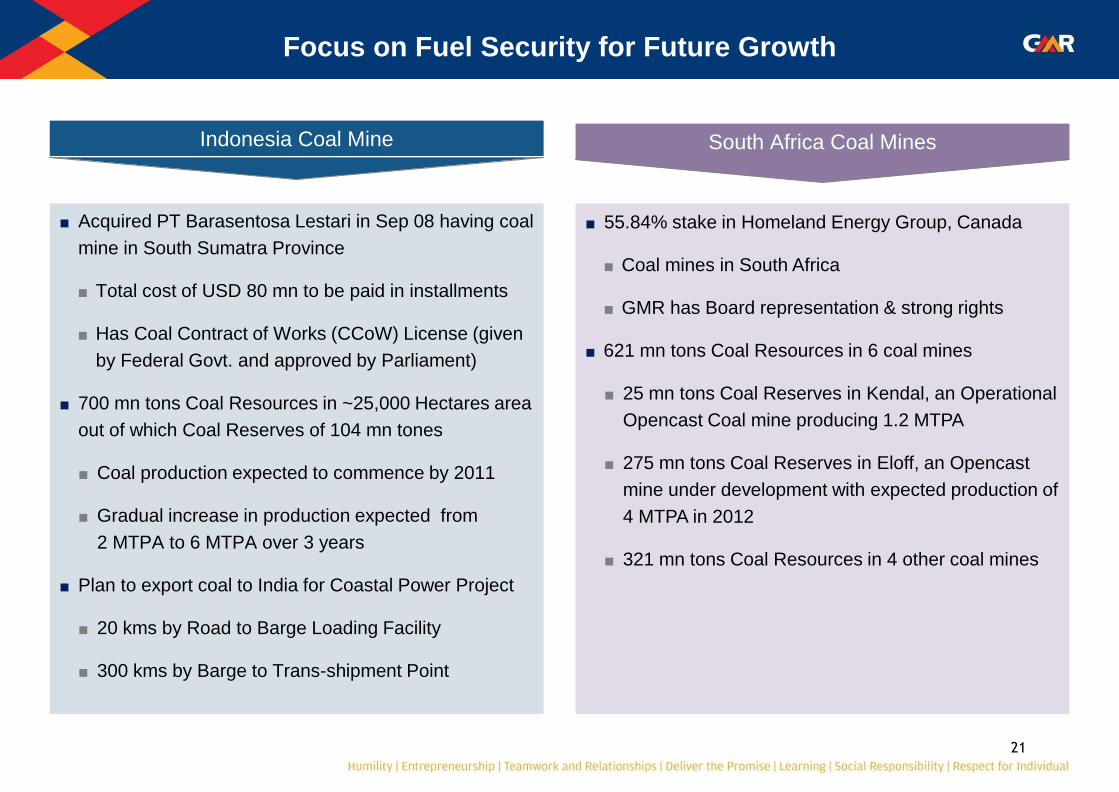
Focus on Fuel Security for Future Growth
■ Acquired PT Barasentosa Lestari in Sep 08 having coal
mine in South Sumatra Province
■ Total cost of USD 80 mn to be paid in installments
■ Has Coal Contract of Works (CCoW) License (given
by Federal Govt. and approved by Parliament)
■ 700 mn tons Coal Resources in ~25,000 Hectares area
out of which Coal Reserves of 104 mn tones
■ Coal production expected to commence by 2011
■ Gradual increase in production expected from
2 MTPA to 6 MTPA over 3 years
■ Plan to export coal to India for Coastal Power Project
■ 20 kms by Road to Barge Loading Facility
■ 300 kms by Barge to Trans-shipment Point
Indonesia Coal Mine South Africa Coal Mines
■ 55.84% stake in Homeland Energy Group, Canada
■ Coal mines in South Africa
■ GMR has Board representation & strong rights
■ 621 mn tons Coal Resources in 6 coal mines
■ 25 mn tons Coal Reserves in Kendal, an Operational
Opencast Coal mine producing 1.2 MTPA
■ 275 mn tons Coal Reserves in Eloff, an Opencast
mine under development with expected production of
4 MTPA in 2012
■ 321 mn tons Coal Resources in 4 other coal mines
22
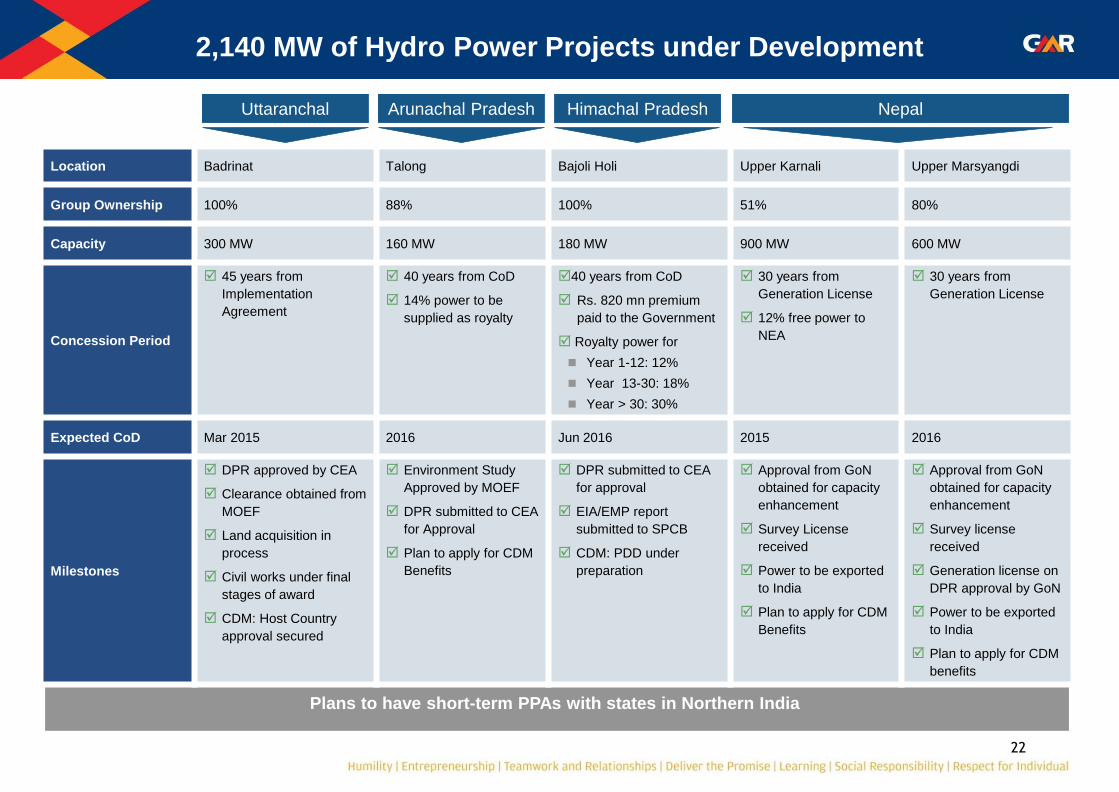
2,140 MW of Hydro Power Projects under Development
Plans to have short-term PPAs with states in Northern India
Uttaranchal Himachal Pradesh Nepal Arunachal Pradesh
Location Badrinat Talong Bajoli Holi Upper Karnali Upper Marsyangdi
Group Ownership 100% 88% 100% 51% 80%
Capacity 300 MW 160 MW 180 MW 900 MW 600 MW
Concession Period
45 years from
Implementation
Agreement
40 years from CoD
14% power to be
supplied as royalty
40 years from CoD
Rs. 820 mn premium
paid to the Government
Royalty power for
Year 1-12: 12%
Year 13-30: 18%
Year > 30: 30%
30 years from
Generation License
12% free power to
NEA
30 years from
Generation License
Expected CoD Mar 2015 2016 Jun 2016 2015 2016
Milestones
DPR approved by CEA
Clearance obtained from
MOEF
Land acquisition in
process
Civil works under final
stages of award
CDM: Host Country
approval secured
Environment Study
Approved by MOEF
DPR submitted to CEA
for Approval
Plan to apply for CDM
Benefits
DPR submitted to CEA
for approval
EIA/EMP report
submitted to SPCB
CDM: PDD under
preparation
Approval from GoN
obtained for capacity
enhancement
Survey License
received
Power to be exported
to India
Plan to apply for CDM
Benefits
Approval from GoN
obtained for capacity
enhancement
Survey license
received
Generation license on
DPR approval by GoN
Power to be exported
to India
Plan to apply for CDM
benefits
23
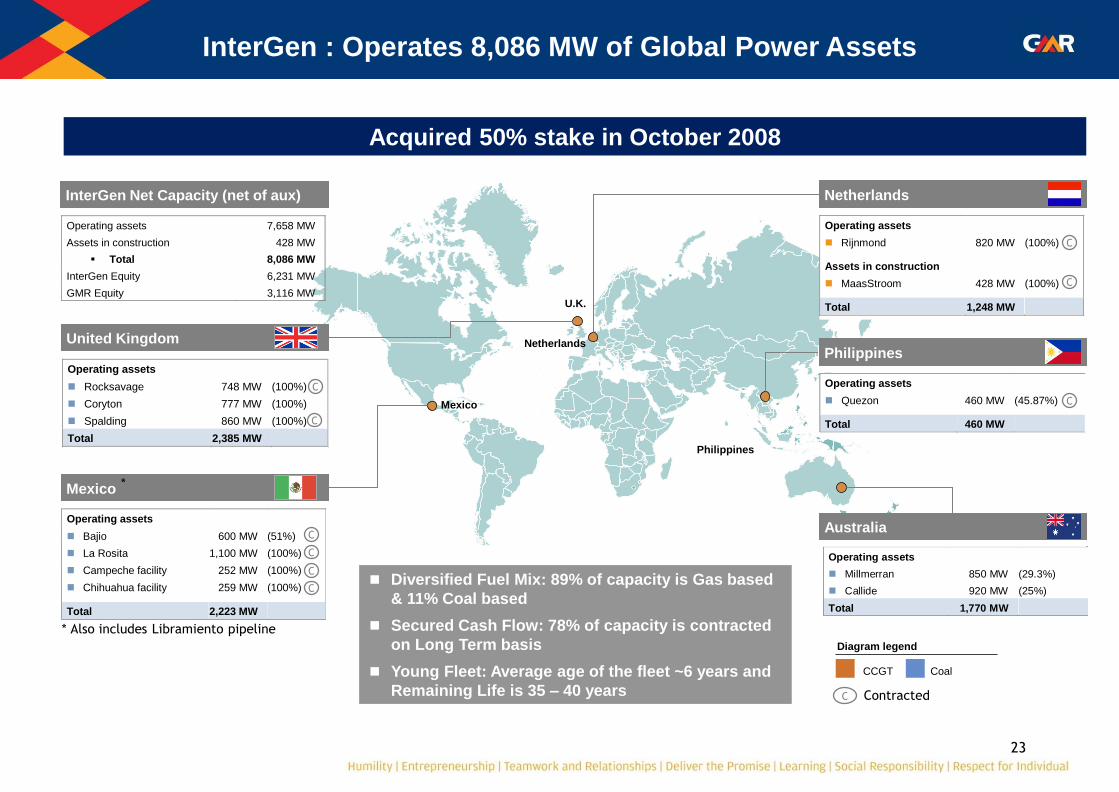
Operating assets
Millmerran 850 MW (29.3%)
Callide 920 MW (25%)
Total 1,770 MW
Operating assets
Rocksavage 748 MW (100%)
Coryton 777 MW (100%)
Spalding 860 MW (100%)
Total 2,385 MW
Operating assets
Bajio 600 MW (51%)
La Rosita 1,100 MW (100%)
Campeche facility 252 MW (100%)
Chihuahua facility 259 MW (100%)
Total 2,223 MW
Mexico
United Kingdom
Philippines
Mexico
U.K.
Netherlands
C
Diversified Fuel Mix: 89% of capacity is Gas based
& 11% Coal based
Secured Cash Flow: 78% of capacity is contracted
on Long Term basis
Young Fleet: Average age of the fleet ~6 years and
Remaining Life is 35 – 40 years
Netherlands
Operating assets
Rijnmond 820 MW (100%)
Assets in construction
MaasStroom 428 MW (100%)
Total 1,248 MW
Philippines
Operating assets
Quezon 460 MW (45.87%)
Total 460 MW
Australia
Operating assets 7,658 MW
Assets in construction 428 MW
Total 8,086 MW
InterGen Equity 6,231 MW
GMR Equity 3,116 MW
InterGen Net Capacity (net of aux)
* Also includes Libramiento pipeline
Acquired 50% stake in October 2008
InterGen : Operates 8,086 MW of Global Power Assets
Diagram legend
■ CCGT ■ Coal
C Contracted
*
C
C
C
C
C
C
C
C
Highways & Urban Infrastructure – Paths to Progress
25
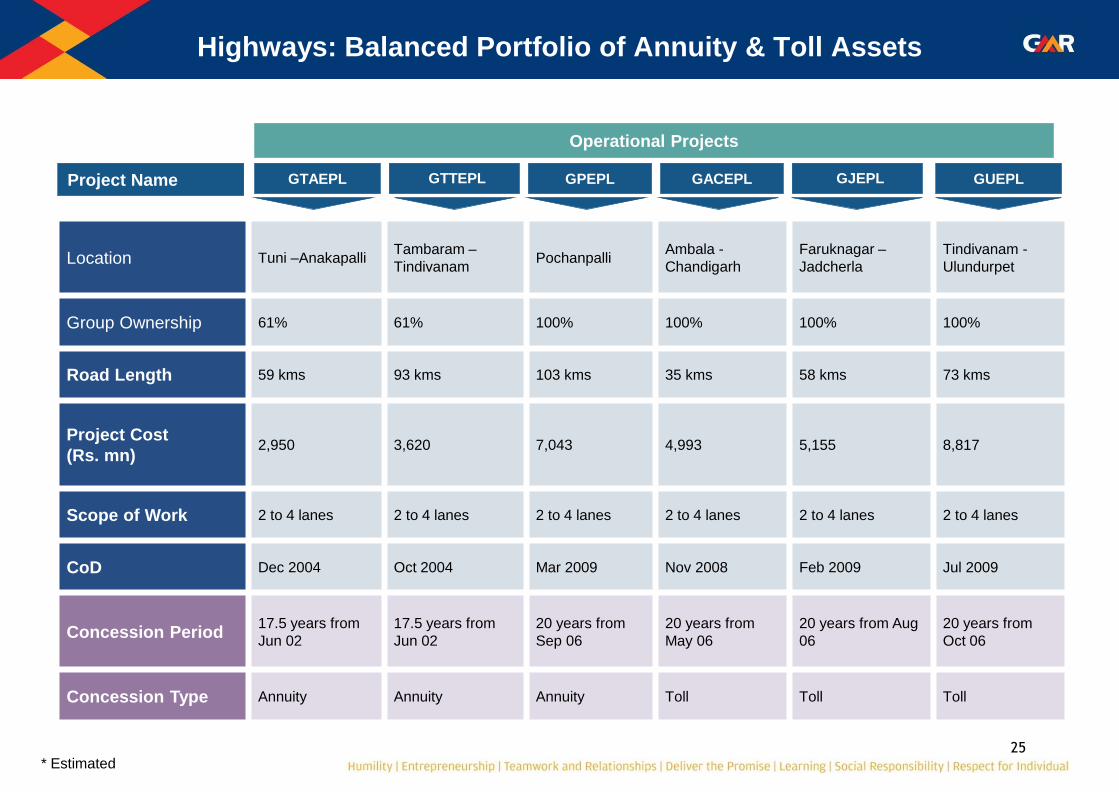
Highways: Balanced Portfolio of Annuity & Toll Assets
* Estimated
Operational Projects
GTAEPL GPEPL GTTEPL GACEPL GUEPL GJEPL Project Name
Location Tuni –Anakapalli Tambaram –
Tindivanam Pochanpalli
Ambala -
Chandigarh
Faruknagar –
Jadcherla
Tindivanam -
Ulundurpet
Group Ownership 61% 61% 100% 100% 100% 100%
Road Length 59 kms 93 kms 103 kms 35 kms 58 kms 73 kms
Project Cost
(Rs. mn) 2,950 3,620 7,043 4,993 5,155 8,817
Scope of Work 2 to 4 lanes 2 to 4 lanes 2 to 4 lanes 2 to 4 lanes 2 to 4 lanes 2 to 4 lanes
CoD Dec 2004 Oct 2004 Mar 2009 Nov 2008 Feb 2009 Jul 2009
Concession Period 17.5 years from
Jun 02
17.5 years from
Jun 02
20 years from
Sep 06
20 years from
May 06
20 years from Aug
06
20 years from
Oct 06
Concession Type Annuity Annuity Annuity Toll Toll Toll
26
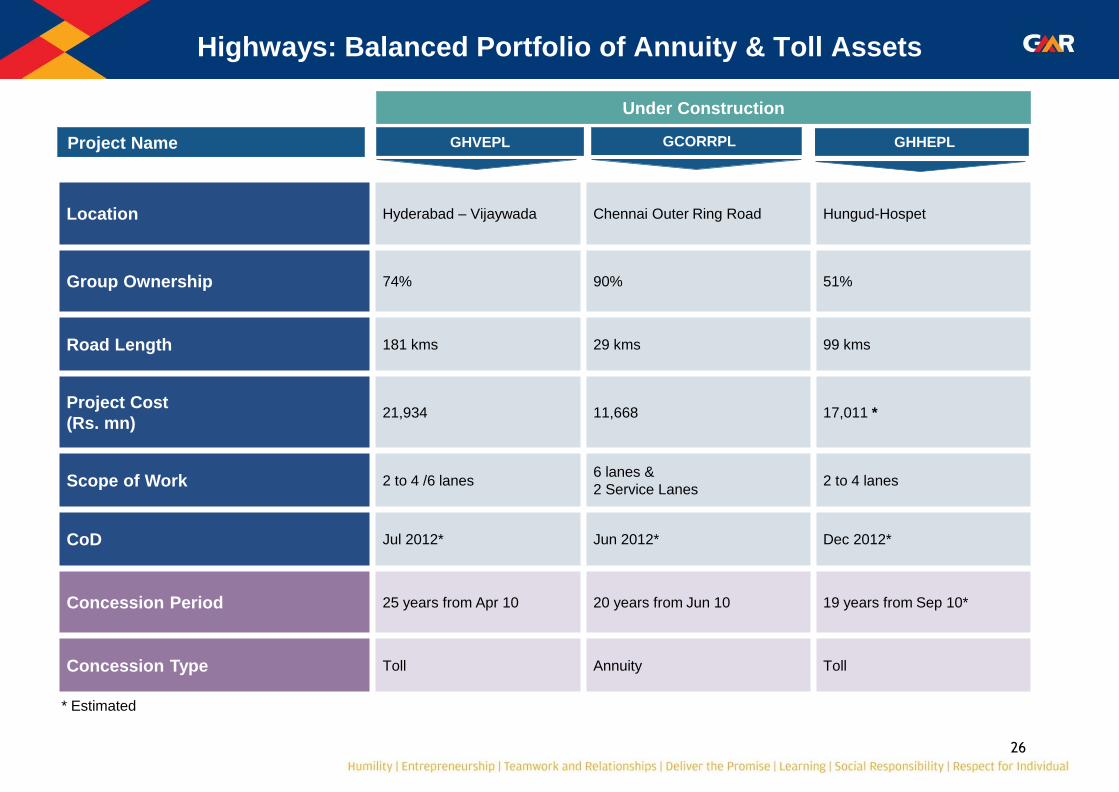
Location Hyderabad – Vijaywada Chennai Outer Ring Road Hungud-Hospet
Group Ownership 74% 90% 51%
Road Length 181 kms 29 kms 99 kms
Project Cost
(Rs. mn) 21,934 11,668 17,011 *
Scope of Work 2 to 4 /6 lanes 6 lanes &
2 Service Lanes 2 to 4 lanes
CoD Jul 2012* Jun 2012* Dec 2012*
Concession Period 25 years from Apr 10 20 years from Jun 10 19 years from Sep 10*
Concession Type Toll Annuity Toll
Highways: Balanced Portfolio of Annuity & Toll Assets
* Estimated
Under Construction
GHVEPL GCORRPL GHHEPL Project Name
27 27
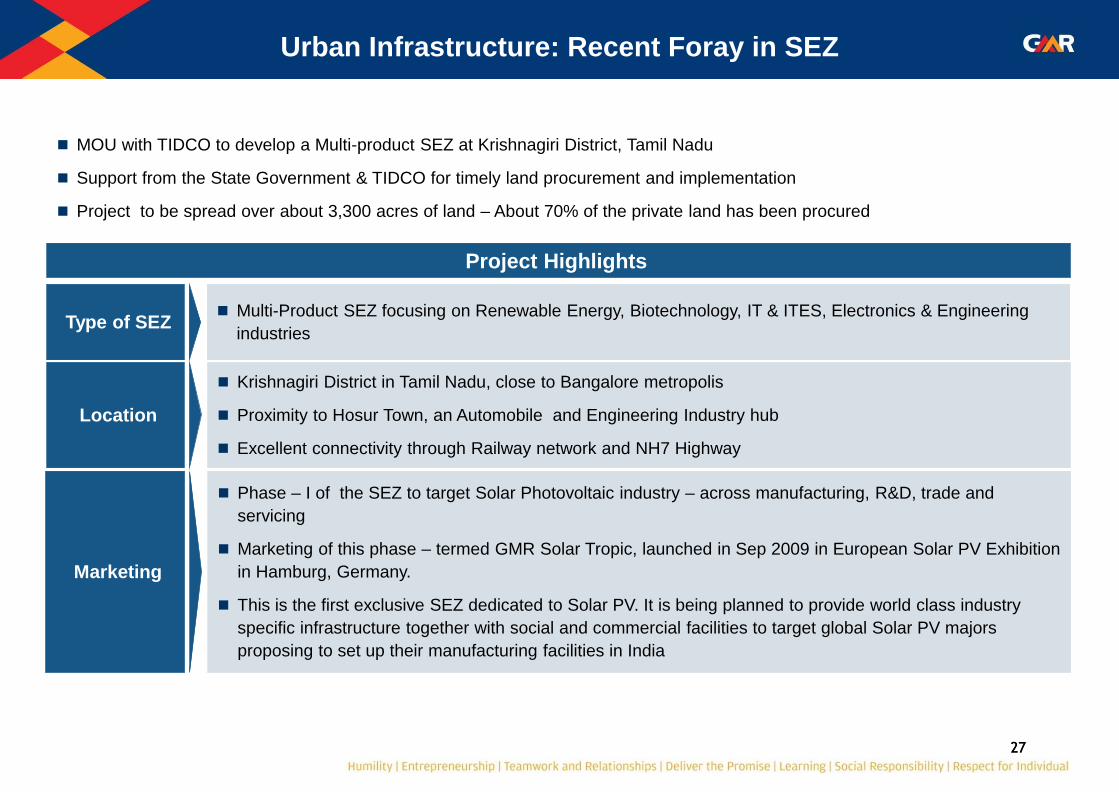
Urban Infrastructure: Recent Foray in SEZ
MOU with TIDCO to develop a Multi-product SEZ at Krishnagiri District, Tamil Nadu
Support from the State Government & TIDCO for timely land procurement and implementation
Project to be spread over about 3,300 acres of land – About 70% of the private land has been procured
Project Highlights
Type of SEZ Multi-Product SEZ focusing on Renewable Energy, Biotechnology, IT & ITES, Electronics & Engineering
industries
Location
Krishnagiri District in Tamil Nadu, close to Bangalore metropolis
Proximity to Hosur Town, an Automobile and Engineering Industry hub
Excellent connectivity through Railway network and NH7 Highway
Marketing
Phase – I of the SEZ to target Solar Photovoltaic industry – across manufacturing, R&D, trade and
servicing
Marketing of this phase – termed GMR Solar Tropic, launched in Sep 2009 in European Solar PV Exhibition
in Hamburg, Germany.
This is the first exclusive SEZ dedicated to Solar PV. It is being planned to provide world class industry
specific infrastructure together with social and commercial facilities to target global Solar PV majors
proposing to set up their manufacturing facilities in India

Key Financial Summary

29
23,332
43,181
1,06,840
1,35,101
1,89,760
3,136 3,764
4,412
6,669 7,346
4,564 5,436
5,985
10,670
13,643
10,617
19,967
26,979
44,762
51,234
29
Consolidated Financial Performance
¹ Cash Profit: PAT + Depreciation & Amortization+ Deferred Tax
27% 43% 32% 26% EBITDA
Margin
Capital Employed (2) Cash Profit (1)
EBITDA & Margins
4 3
2 Gross Revenues 1
CAGR: 48%
CAGR: 31%
CAGR: 23% CAGR: 68%
(Rs.m
n)
(Rs.m
n)
(Rs.m
n)
(Rs.m
n)
2 Capital employed: Total Assets – CWIP - EDCP
30%