Embed Size (px)
Citation preview

GM Technology Adoption, Production Risk and On-farm Varietal Diversity
Vijesh Krishna Department of Agricultural and Resource Economics
University of California at Berkeley, 94720 CA E-mail: [email protected]
David Zilberman Department of Agricultural and Resource Economics
University of California at Berkeley, 94720 CA
Matin Qaim Department of Agricultural Economics and Rural Development
Georg-August-University of Goettingen, 37073 Goettingen, Germany
Selected Paper prepared for presentation at the Agricultural & Applied Economics
Association’s 2009 AAEA & ACCI Joint Annual Meeting, Milwaukee, WI, July 26-28, 2009
Copyright 2009 by V. Krishna, D. Zilberman and M. Qaim. All rights reserved. Readers may make verbatim copies of
this document for non-commercial purposes by any means, provided this copyright notice appears on all such copies.

2
GM Technology Adoption, Production Risk and On-farm Varietal Diversity
This paper examines the impact of transgenic technology adoption on varietal diversity. Transgenic pest-resistant varieties are hypothesized to reduce farmers’ demand for on-farm diversity through an act of substitution, as both serve as production risk reducing instruments. This adverse agro-biodiversity impact might be partially counteracted by an expanding seed sector, supplying a large number of transgenic varieties. The case of Bt cotton in India is taken for empirical illustration. The production function analyses show that both Bt technology and on-farm varietal diversity enhance yield, while reducing the production risk. With few Bt varieties available in the first years, technology adoption entailed a reduction in on-farm varietal diversity. This effect, however, was partially offset by more Bt varieties becoming available over time.
Key words: Agro-biodiversity, Bt cotton, production risk, transgenic technology.
1. Introduction
From the very inception of transgenic technology in agriculture, concern about its potential environmental
impacts has been taking the center stage in both public and scientific forums. Despite the existence of
sizeable scientific literature, a consensus on the direct and indirect impacts of releasing these crops into the
environment has hardly been reached (Conner et al., 2003). One of the reasons could be that, though the
transgenic or genetically modified (GM) crops do not present new categories of environmental risks as
compared to conventional methods of crop improvement, the nature of risk associated varies, depending on
the crop, the trait introduced, agri-ecological system associated with and the institutional framework
regulating the technology use (Ervin and Welsh, 2005). In general, the potential biodiversity threats
associated with introduction of GM crops include (i) loss of original diversity of wild relatives of crops
through gene flow, (ii) damage infliction to non-target organisms, and (iii) erosion of crop varietal diversity
(Dale et al., 2002; Ammann, 2005; Thomson, 2006). The controversy generated by the studies suggesting
introgression of trans-genes in maize landraces of Mexico (Quist and Chapela, 2001), and negative impact of
Bt corn pollen on Monarch butterfly larvae (Losey et al., 1999) prompted substantial scientific investigations
on the first two aspects. Nevertheless, the varietal diversity erosion argument – that is, adoption of few
genetically uniform transgenic varieties erodes the diversity of indigenous crop varieties – has so far gained
relatively less academic attention. Superficially, this argument bears significant resemblance to the
conventional genetic erosion hypothesis (cf. Brush, 2000), which is arguably associated with the introduction
of any high yielding crop variety. Nonetheless, this paper proposes that the mode in which GM technology
impacts varietal diversity significantly differs from conventional yield enhancing methods. We take the case
of transgenic pest resistance (PR) for illustration purposes, explicitly differentiating between demand and
supply side aspects.

3
Crop genetic diversity is considered as a source of continuing advances in yield, pest resistance and quality
improvement and thus acts as a contributing force to sustainable agriculture (Birol et al., 2005; Jackson et
al., 2007). There exists mixed evidence on the relationship between genetic diversity and mean farm yields,
but it is widely accepted that greater varietal and species diversity would enable the system to maintain
productivity over a wide range of agro-ecological conditions (Chapin et al., 1997; Kinzig et al., 2002; Di
Falco and Perrings, 2003; Baumgärtner and Quaas, forthcoming). Further, Perrings and Gardgil (2002)
indicated that the magnitude of agricultural risks typically varies inversely with crop genetic diversity.
Transgenic variety adoption could be associated with a similar risk-reduction function. Researchers currently
advise farmers to consider adoption of PR-GM as an insurance mechanism (Hyde et al. 1999). Hurley et al.
(2004) suggest that the PR-GM technology could reduce the risk, depending on the cost of technology
appropriation. According to Crost and Shankar (2008), Bt technology has a risk-reducing effect on the cotton
production sector of India.1 Thus, by adopting transgenic resistance, a farmer could reduce her dependence
on varietal diversity to attain production risk reduction from biotic factors. Or, in other words, the farmer
could switch over from diversity-based to technology-based crop insurance, taking into account the financial
and transaction costs associated with each alternative. Hence, transgenic technology adoption might reduce
farmers’ demand for on-farm varietal diversity.
But how does the supply side look like, meaning, the seed industry’s provision of varietal diversity? The
answer very much depends on local breeding capacities, intellectual property rights regimes, biosafety
systems, and other institutional conditions (Batie and Ervin, 2001; Qaim, 2005). If, only one or few
transgenic varieties were available, farmers might adopt and replace them for a large number of conventional
crop varieties. However, if the conditions in a country are conducive, seed firms can backcross the
transgenic trait into numerous varieties, thereby maintaining or even enhancing the supply of varietal
diversity. We argue here that, the farmers’ motive behind cultivating multiple varieties on-farm plays a
critical role in this regard. If diminishing returns to scale for land under single variety be the sole reason (as
in the case of most conventional high yielding varieties), then the increased corporate supply of varieties
with Bt technology would restore on-farm diversity.2 Nevertheless, when the Bt technology is considered as
an instrument to reduce production risk, the varietal diversity status could be expected to diminish with
adoption, even when all varieties are genetically modified.
1 However, in the cotton production sector of South Africa, the authors found no evidence for Bt-related output risk reduction. 2 This argument is in line with Zilberman et al. (2007) that the introduction of GM technology does not invariably lead to loss of biodiversity, and that the erosion would be insignificant when the seed sector supplies a multitude of GM varieties, which is the case when the transaction costs of backcrossing transgenic traits into additional varieties are relatively low.

4
We employ a conceptual framework, derived from existing literature, as a starting point for modeling the
impacts of GM technology on crop varietal diversity (section 2). The hypotheses developed in this section
are then examined empirically using the case of Bt cotton in India. Section 3 briefly outlines the
development of IR-GM technology in the Indian cotton production sector, whereas section 4 and 5,
respectively elaborates the procedure of data collection and econometric framework employed for analysis.
The results of the empirical analysis are presented and discussed in section 6, while section 7 concludes.
2. Conceptual framework
We analyze the role of PR-GM varieties in land allocation as the technology that (i) enhances mean yield
and (ii) reduces yield variation. A number of studies indicate higher yield associated with Bt technology. For
example, in the case of Bt cotton in India, Qaim and Zilberman (2000), Qaim et al. (2006), and Crost et al.
(2007), observed a higher yield, due to reduction in previously uncontrolled crop damage. However, the
empirical evidence for risk-reduction with PR-GM technology is rather limited. In our best knowledge, the
study of Crost and Shankar (2008) only has examined this aspect so far. If the agronomic function of PR-
GM technology is limited to yield enhancement alone, then its impact on land allocation would be no
different than that of the conventional varieties. However, we postulate that when Bt technology functions as
production risk-reducing agent, the allocation decision would be rather complex.
We present a simple on-farm land-allocation model, limiting the number of varieties available for cultivation
to two (+ , 1, 2). These varieties compete for the fixed factor input, land (-.), and show significant
difference not only with respect to mean yield, but also yield variation. Assuming uniform cost structure
across all conventional varieties, variety [1] is superior over [2] for the farmer, such that the marginal
product (/012) of former is greater (/01.......3 4 /01.......5) at the mean input level, 67.58. The probability that the
farmer fail to achieve her goals in cotton production due to pest infestation in variety + be 92 such that 0 : 92 : 1. The 92 value is higher for variety [1] over variety [2] by assumption.
2.1. Case of risk-neutral farmer
We begin with the scenario (I) in which the farmer is risk-neutral and she ignores the associated probabilities
completely. The rationale behind cultivating multiple varieties on-farm is the exclusively diminishing
marginal returns to scale for land under single variety, and optimal land allocation is at the point of equality
between /12’s. Following damage control function proposed by Lichtenberg and Zilberman (1986), the
production relation is given by:

5
Y2 , =(-2). >(Γ?) @1A where Y2 is the yield realized with variety +, which is the function of cultivated area (-2) and damage control
function of non-GM varietal resistance (Γ?) toward pest; 0 : Γ? : 1. Assuming degree of varietal
resistance uniform in conventional varieties, the optimality of inter-variety land-allocation is at the equality
of /012 of varieties, BC′BD′ , 1. In Figure 1[A], lines AB and DC stand for >(Γ?). =7C′ and >(Γ?). =7D′
respectively, and the equality is reached at the point E. With respect to the land allocation, variety [1] is
considered ‘dominant’ over [2], which means that the land area allocated under former – IK in Figure 1[A] –
is greater in comparison with area under variety [2], I΄K.
Now consider the event that one or both the varieties are genetically modified to enhance varietal resistance
against pest to ΓE, such that >(Γ?) : >(ΓE) : 1. This would be associated with a shift in /012′s by the
magnitude, F>(ΓE) G >(Γ?)H . =2′, which is represented graphically by FG and HJ in Figure 1[A] for variety
[1] and [2] respectively. The direction and degree of impact of introduction of GM technology on varietal
diversity depends on the net land allocation, which in turn is determined by the selection of variety for
genetic modification, and the F>(ΓE) G >(Γ?)H value. Three possibilities are visualized:
(i) Dominant variety – variety [1] – is genetically modified
Since BC′ FI(ΓJ)KI(ΓL)HBD′ M 1 at (prior) optimal land allocation point (K), profitability increases when more
land is allocated to variety [1]. As cultivable land is fixed in supply, the net allocation would be
detrimental to variety [2]. In graph, it is represented by the shift of equality point of MP curves from E
to E1. The additional land KK1 is allocated under variety [1].
(ii) Recessive variety – variety [2] – is genetically modified
Here BC′BD′ FI(ΓJ)KI(ΓL)H N 1 at K, some land previously cultivated under variety [1] would be allocated for
variety [2]. This move is represented by shift in equality point from E to E2 in the Figure, and the net
area change in KK2.
6
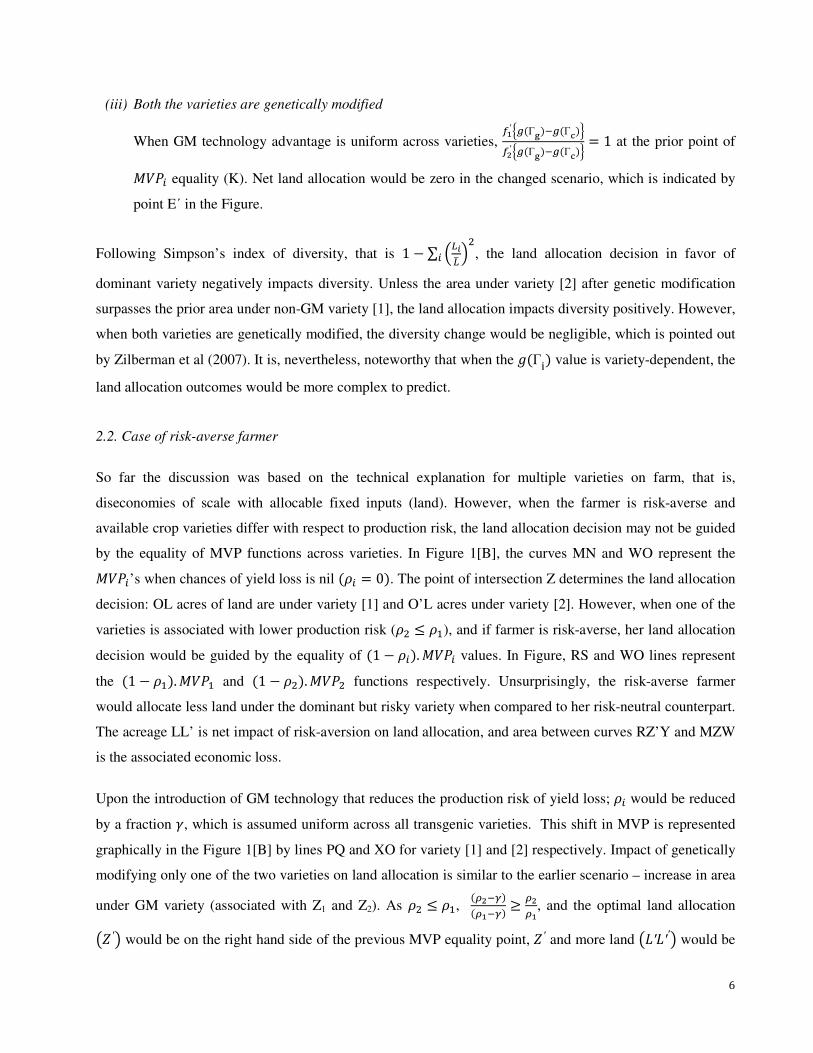
(iii) Both the varieties are genetically modified
When GM technology advantage is uniform across varieties, BC′ FI(ΓJ)KI(ΓL)HBD′ FI(ΓJ)KI(ΓL)H , 1 at the prior point of
/012 equality (K). Net land allocation would be zero in the changed scenario, which is indicated by
point E΄ in the Figure.
Following Simpson’s index of diversity, that is 1 G ∑ 67Q7. 852 , the land allocation decision in favor of
dominant variety negatively impacts diversity. Unless the area under variety [2] after genetic modification
surpasses the prior area under non-GM variety [1], the land allocation impacts diversity positively. However,
when both varieties are genetically modified, the diversity change would be negligible, which is pointed out
by Zilberman et al (2007). It is, nevertheless, noteworthy that when the >(ΓR) value is variety-dependent, the
land allocation outcomes would be more complex to predict.
2.2. Case of risk-averse farmer
So far the discussion was based on the technical explanation for multiple varieties on farm, that is,
diseconomies of scale with allocable fixed inputs (land). However, when the farmer is risk-averse and
available crop varieties differ with respect to production risk, the land allocation decision may not be guided
by the equality of MVP functions across varieties. In Figure 1[B], the curves MN and WO represent the /012’s when chances of yield loss is nil (92 , 0). The point of intersection Z determines the land allocation
decision: OL acres of land are under variety [1] and O’L acres under variety [2]. However, when one of the
varieties is associated with lower production risk (95 : 93), and if farmer is risk-averse, her land allocation
decision would be guided by the equality of (1 G 92). /012 values. In Figure, RS and WO lines represent
the (1 G 93). /013 and (1 G 95). /015 functions respectively. Unsurprisingly, the risk-averse farmer
would allocate less land under the dominant but risky variety when compared to her risk-neutral counterpart.
The acreage LL’ is net impact of risk-aversion on land allocation, and area between curves RZ’Y and MZW
is the associated economic loss.
Upon the introduction of GM technology that reduces the production risk of yield loss; 92 would be reduced
by a fraction S, which is assumed uniform across all transgenic varieties. This shift in MVP is represented
graphically in the Figure 1[B] by lines PQ and XO for variety [1] and [2] respectively. Impact of genetically
modifying only one of the two varieties on land allocation is similar to the earlier scenario – increase in area
under GM variety (associated with Z1 and Z2). As 95 : 93, (TDKU)(TCKU) 4 TDTC, and the optimal land allocation
VW′X would be on the right hand side of the previous MVP equality point, W′ and more land V-′-′′X would be

7
allocated to the dominant variety. It shows that, when the farmer’s rationale behind cultivating multiple
varieties on-farm is the provision of natural insurance against production risk from pests, the introduction of
PR-GM varieties would necessarily result in land allocation in favor of dominant GM varieties, and
ultimately erode on-farm varietal diversity. Again, the loss of diversity due to introduction of dominant PR-
GM variety would be greater for risk-averse farmer than her risk-neutral counterpart unless S , 92. 2.3. Testable hypotheses developed
The broad premise of this study is that introduction of transgenic technology lowers the farmers’ demand for
on-farm varietal diversity, which could be partially restored by enhancing the supply of transgenic varieties.
Based on the theoretical framework, three workable hypotheses are derived:
(i) Both on-farm varietal diversity and adoption of PR-GM technology reduce yield variability.
(ii) Adoption of transgenic technology reduces farmers’ demand for varietal diversity.
(iii) Supply of GM varieties by the seed industry is positively correlated with on-farm varietal
diversity.
The first hypothesis is tested empirically by estimating production functions that capture impacts of
production variables on mean yield and its variance. The second and third hypotheses are tested by
estimating regression models on on-farm varietal diversity data from two points in time – one during the
early stage of Bt adoption in India, when only few GM cotton varieties were available, and the other after the
number of available GM varieties had increased considerably.
3. Case of Bt cotton in India
Bollworm (mainly Helicoverpa armigera) infestation is reported to cause significant crop loss (worth Rs. 20
billion in the late 1990s as per Birthal et al., 2000), despite the cotton cultivation sector being highly
chemical intensive. Transgenic resistance development in cotton gained special relevance in this scenario. A
gene (Cry1Ac) from the soil bacterium Bacillus thuringiensis (Bt) was transferred to the cotton genome,
making it resistant to borer pests and reducing its dependency on chemical measures of pest control. The
insect resistance in these hybrids was introgressed from a US Bt cotton variety (event MON531) developed
by Monsanto (Qaim and Zilberman, 2000). Most of the ex post empirical evaluations reported that Bt cotton
technology reduces pesticide use by 20-40% in Indian agriculture (cf. Bennett et al., 2005, Narayanamoorthy
and Kalamkar, 2006, Qaim et al., 2006, Gandhi and Namboodiri, 2006; Crost et al., 2007). There is also a
significant yield advantage reported, which outweighs the associated cost increase, so that the average gross
margins increase by 50-75%. The magnitude of the economic advantages partly explains the high speed of

8
adoption of Bt cotton in India. In 2006, India became the world’s fifth largest producer of GM crops, with a
cultivated area of 9.4 million acres (3.8% of the world’s total), and registered the highest growth rate of
cultivated areas. From 2005 to 2006, the GM crop area in India increased by 192% (James, 2006).
Despite these significant economic benefits, the impact of Bt technology on on-farm varietal diversity is
hardly examined. When this technology was introduced in Indian cotton production sector, there were only
three Bt hybrids approved. All of them were released by the joint venture of Monsanto with the Indian firm
Maharashtra Hybrid Seed Company (MAHYCO), marketed under the trade name BollgardTM. In 2004, an
additional Bt variety, released by Rasi Seeds, became legally available for the farmers. The slow increase in
number of transgenic varieties could be attributed to the fact that every single Bt variety has to be approved
by the national Genetic Engineering Approval Committee (GEAC). However, within the next two years, the
GEAC approved more than 60 Bt cotton hybrids developed by 13 seed companies. All of these, except four,
have the MMB Bt technology (event MON531) that has been sublicensed to the respective seed companies
(APCoAB, 2006). Also in 2006, MAHYCO has commercialized Bollgard IITM, which contains Bt genes
Cry1Ac and Cry2Ab, imparting increased protection against a wider-spectrum of borer pests. The 15-fold
increase in number of varieties available with Bt technology between 2004 and 2006, makes the case of Bt
cotton in India ideal for a study diversity impacts of transgenic technology introduction. A comparative
evaluation of varietal diversity status in 2004 and 2006 would yield the supply-side impacts of technology
provision, whereas a cross-sectional evaluation of cotton growing households would divulge the demand
side impacts of technology adoption on varietal diversity.
4. Data
The south and central Indian states contribute to more than 60 per cent of the Indian cotton production (Qaim
et al., 2006). When Bt cotton technology was legally introduced for the first time in India in 2002, it was
limited to this region, and there was a rapid adoption of the technology here (Gandhi and Namboodiri, 2006).
The data for the present study is based on the cotton farmers from the four states of south and central India,
viz. Maharashtra, Karnataka, Andhra Pradesh and Tamil Nadu. Personal interview method was employed for
data collection, with the help of a pre-tested questionnaire. Details on land allocation under different crops
and cotton varieties, cost and returns from cotton cultivation, input use pattern, and farm household
characteristics were collected. The purpose was to create a panel database to study the dynamics of cotton
production after the introduction of transgenic technology.
Though the farm survey was conducted in three phases at an interval of two years starting from the first year
of commercialization, this paper limits itself to the last two phases – of 2004 and 2006 – as detailed

9
information on varietal use was elicited in these phases only. All the surveys were conducted at the end of
the cotton seasons of the respective years. In each of these phases, data was collected by contacting the same
farmers of the dataset gathered in year 2002. In addition, new households were included to rectify the
missing ones in every round. Though all possible efforts were made to ensure the continuity by including all
the samples of the first phase, there were some omissions due to reasons like demise of farmer, migration
etc. Further, for the present analysis, we excluded the data on households that discontinued cotton cultivation
in the respective years and hence reached the final sample size of 362 and 344 in the 2004 and 2006 surveys.
However, input-output data was collected for both Bt and non-Bt varieties from farmers following partial
adoption of the technology, making the sample size for production function analysis 464 and 369 during the
respective years.
5. Analytical framework
The analytical part consists of per-plot production function and per-farm Tobit model on factors contributing
to varietal richness estimations. On-farm varietal diversity enters as one of the explanatory variables in
production function, whereas it is the dependent variable in Tobit model. As simple count of varieties grown
per-farm would not control for the scale of measurement (Nagarajan et al., 2007), we have employed
Margalef varietal richness index (MVRI), which is a count of cotton varieties normalized by the scale of the
cotton area. Following Magurran (1988),
MVRI2 , 2̂ G 1ln(_2) @2A where 2̂ and _2 respectively are the number of cotton varieties cultivated and area under cotton on the ith
farm. MVRI as the diversity measure is widely used in literature (cf. Di Falco et al., 2007, and Natarajan et
al., 2007). Unavailability of data on area under individual varieties was the main reason for not resorting to
farm evenness indices for calculating the varietal diversity.3 In order to maintain continuity in MVRI2 estimates, we have taken the unit of land area as 0.10 acres, smaller than the smallest farm observed in the
survey. About 36 (45) per cent of cotton farmers cultivated a single variety on their farms during 2004
(2006), which corresponds the zero varietal diversity (MVRI2 = 0.00). The mean MVRI2 value was 0.33 in
2004, which has come down to 0.26 in 2006. Unsurprisingly, larger farms were cultivated with greater
number of varieties.
3 A close association between farm evenness and richness, as observed globally by Jarvis et al. (2008), is indicative of the fact that the empirical findings would not change drastically if the evenness indices are used instead of richness.
10
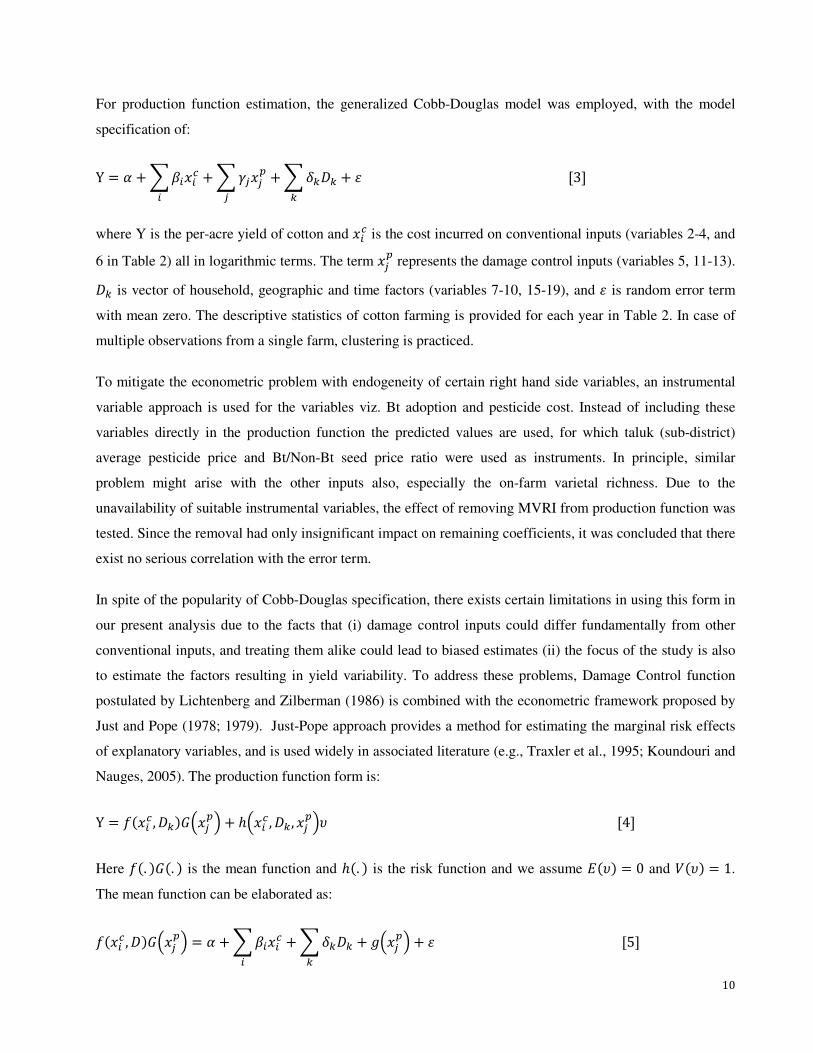
For production function estimation, the generalized Cobb-Douglas model was employed, with the model
specification of:
Y , a b c d2e2f2 b c Sgeghg b c ijkjj b l @3A where Y is the per-acre yield of cotton and e2f is the cost incurred on conventional inputs (variables 2-4, and
6 in Table 2) all in logarithmic terms. The term egh represents the damage control inputs (variables 5, 11-13).
kj is vector of household, geographic and time factors (variables 7-10, 15-19), and l is random error term
with mean zero. The descriptive statistics of cotton farming is provided for each year in Table 2. In case of
multiple observations from a single farm, clustering is practiced.
To mitigate the econometric problem with endogeneity of certain right hand side variables, an instrumental
variable approach is used for the variables viz. Bt adoption and pesticide cost. Instead of including these
variables directly in the production function the predicted values are used, for which taluk (sub-district)
average pesticide price and Bt/Non-Bt seed price ratio were used as instruments. In principle, similar
problem might arise with the other inputs also, especially the on-farm varietal richness. Due to the
unavailability of suitable instrumental variables, the effect of removing MVRI from production function was
tested. Since the removal had only insignificant impact on remaining coefficients, it was concluded that there
exist no serious correlation with the error term.
In spite of the popularity of Cobb-Douglas specification, there exists certain limitations in using this form in
our present analysis due to the facts that (i) damage control inputs could differ fundamentally from other
conventional inputs, and treating them alike could lead to biased estimates (ii) the focus of the study is also
to estimate the factors resulting in yield variability. To address these problems, Damage Control function
postulated by Lichtenberg and Zilberman (1986) is combined with the econometric framework proposed by
Just and Pope (1978; 1979). Just-Pope approach provides a method for estimating the marginal risk effects
of explanatory variables, and is used widely in associated literature (e.g., Traxler et al., 1995; Koundouri and
Nauges, 2005). The production function form is:
Y , =(e2f , kj)m6egh8 b n6e2f , kj, egh8o @4A Here =(. )m(. ) is the mean function and n(. ) is the risk function and we assume p(o) , 0 and 0(o) , 1.
The mean function can be elaborated as:
=(e2f , k)m6egh8 , a b c d2e2f2 b c ijkjj b >6egh8 b l @5A

11
Here >(. ) is the natural logarithm of m(. ). Upon testing different specifications of >(. ), the logistic form
was selected:
>6egh8 , q1 b exp st G c ugeghg vwK3
@6A Equation [6] is estimated using non-linear methods, and predicted the vector of error terms, l. Following
Just and Pope (1979), Kumbhakar and Tveteras (2003) and Koundouri and Nauges, (2005), the variance is
modeled as a Cobb-Douglas form of explanatory variables.
p(l5) , x5 , n6e2f , k, egh8 @7A ln(x5) , y b c z2e2f2 b c {geghg b c |jkjj b ln (o) @8A The result permits asymptotically valid hypothesis tests about marginal risk effects. Following Traxler et al.
(1995), predicted values from equation [9] are used as weights for generating generalized least squares
(GLS) estimators for the mean output function.
The second part of the estimation deals with factors contributing to the on-farm varietal richness. Due to the
large number of zero observations in the dependent variable, Tobit model (Tobin, 1958) was employed
instead of ordinary least square model. The observed variable, MVRI, is defined to be equal to the latent
variable whenever the latent variable is above zero and zero otherwise. Quadratic specification is assumed
for the explanatory variables, viz. share of cotton area under Bt varieties and irrigation, and farm size owned
by the household, and linear for the rest.
6. Empirical estimation
There is a significant change in the pattern of Bt technology adoption between the years: percentage of non-
adopters of technology has declined drastically from 54 in 2004 to 8 in 2006 amongst the sampled farmers,
and correspondingly increased the full adopters’ share from 16 to 74 per cent. About 30 per cent of farmers
resorted to partial adoption in 2004, and their share has reduced to 18 per cent during the two year period.
This change could be attributed to the reduction in seed price of Bt cotton through government regulations,
and increased supply of GM varieties, suitable for various agro-climatic conditions. The next sub-section
discusses the yield impacts of Bt adoption and on-farm varietal diversity, and subsequent section analyzes
the impact of Bt adoption on varietal richness.

12
6.1. Yield impacts of Bt technology and on-farm varietal diversity
A cross-sectional comparison across the groups of farms with respect to number of varieties shows that there
is a perceivable decline in coefficient of variation (CV) in yield with increase in MVRI (Table 1). At the
same time, the impact of diversity on mean yield is ambiguous. Reduction in yield variability by on-farm
varietal diversity are reported by Smale et al. (1998) and Di Falco and Perrings (2003). Secondly, an inter-
year comparison shows a significant increase in the cotton yield and a decline in CV in each variety class in
2006 as compared to 2004 data. Drastic increase in Bt cotton adoption could be one of the factors behind
these changes. Though the positive yield impacts of Bt technology are widely discussed in the literature, its
effect in reducing yield variability is yet to be subjected to in-depth analyses. The only existing empirical
evidence on Indian production sector (Crost and Shankar, 2008) supports the yield reduction function of Bt
technology adoption.
With the objective of estimating the individual impacts of various production inputs on both mean and
variance of cotton yield, GLS production functions were estimated (Table 3). The production inputs viz.
chemical fertilizers, human labor, and irrigation are positively associated with yield, whereas farm yard
manure and insecticide show negative yield effects. None of the household variables show significant impact
on mean yield. We limit our discussion to Bt adoption and on-farm varietal richness. The marginal impact of
Bt adoption is computed as 4.60 Q in Cobb-Douglas and 5.67 Q in Damage Control function. The
corresponding values are 2.45 Q and 2.46 Q for varietal richness in the respective functions. The Damage
Control function provides comparatively higher marginal values for Bt adoption. It is noteworthy that unit
increase in varietal richness indicates cultivation of additional 4 varieties at the mean cotton area/farm (5.80
acres). In sum, though both Bt adoption and varietal diversity are yield enhancing, when there are few Bt
varieties available for cultivation, yield maximizing farmer would rather go for Bt adoption over
maintenance of on-farm diversity. Nonetheless, production efficiency can be maximized by combining
varietal richness with adoption of Bt technology, especially since the interaction term of Bt is positive
(though statistically insignificant at 0.10 level). This is feasible only when the seed industry supplies
multitude of locally-adapted Bt varieties.
In order to test the hypothesis on impact of on-farm varietal diversity and adoption of PR-GM technology on
yield variability, variance function is estimated and presented in Table 3 (Col: iii). Chemical fertilizers and
irrigation reduce whereas insecticide use enhances yield variability and hence the production risk. Household
size, which acts as proxy for family labor availability, is also risk-reducing. Age of household head is found
positively associated with variability. Varietal richness is found risk-reducing. This result validates the
argument that one of the reasons for farmers to maintain on-farm varietal diversity is the insurance function
it provides against potential yield loss from biotic and abiotic stresses. However, the impact of Bt adoption is

13
much pronounced. In other words, technology based insurance is more efficient over diversity based, in the
farmers’ perspective. If the prime rationale behind conserving on-farm richness is risk-aversion for farmer,
then adoption of Bt technology could result in drastic reduction in varietal diversity. However, since the
magnitude of Bt-richness interaction is great (despite being statistically insignificant), the best strategy for
risk minimization would be maintaining diversity among Bt varieties. Again, this possibility is dependent on
a number of institutional factors.
6.2. Bt adoption and on-farm varietal richness
The previous sub-section dealt with the role of technology and diversity in production relations, and now the
article proceeds by examining the inter-relationship between these factors. Quadratic trend lines are fitted to
show the association between adoption of Bt technology and on-farm varietal count and richness in cotton
farms of India (Figure 2, a & b). They suggest that, as a general rule, partial adopters of Bt technology
maintained greater number of varieties as well as varietal richness on-farm, in comparison with both non-
and full adopters. This effect is more prominent in year 2004, for which farmers’ uncertainty about the yield
impact of limited available Bt cotton varieties could be one of the major reasons. Nonetheless, as the share of
partial adopters drastically reduces over time (30% in 2004 to 18% in 2006), de facto conservation efforts by
this group cannot be given greater significance in policy formulations. More importantly, the impact of full
adoption over non-adoption is significantly different across years. In 2004, the count and richness of
varieties were low amongst the full adopters, whereas in 2006, the impact of full adoption on these
parameters was opposite in direction. The first conclusion may be that, as suggested by Zilberman et al.
(2007), increase in supply of GM varieties may have resulted in the positive association between adoption of
GM varieties and varietal richness. On the other hand, the varietal count and richness have declined in farms
with share Bt adoption less than 60 per cent over the two year period. The increased corporate focus on Bt
seed production, and subsequent shortage in supply of non-Bt varieties could be one of the reasons for this
reduction. Realizing the complex interaction of farm factors other than Bt adoption and household
characteristics in determining the on-farm diversity, we proceed by employing more sophisticated
econometric tools to the dataset.
Due to the large number of farms following monoculture of varieties (MVRI = 0), the ordinary least square
(OLS) estimation would lead to biased estimates (Greene, 2000). Hence, we resort to the Tobit model. The
description of explanatory variables employed in the analysis is given in Table 2 (Col: ii). Along with farm
variables viz. Bt adoption, farm size owned by the household, and share of cotton area under irrigation, the
household characteristics are included in the model estimation to explain the variation in varietal richness
on-farm. Since farm size is positively correlated with cotton area, a positive association with varietal
richness would be unsurprising. As in the case of Bt adoption, a negative association of irrigation and

14
varietal diversity is anticipated, as irrigation could substitute on-farm diversity as instrument for risk
reduction.
The estimation results are presented in Table 4, which show that the larger farm area owned, the greater
would be varietal richness, and this positive relation holds for group of farms with acreage less than 25 acres,
which includes 88 per cent of the sample. The decline of diversity in the largest 12 per cent farms could
possibly be due to the risk-bearing ability of the wealthy households. Regarding irrigation facilities, the
varietal richness is greatest in the farms with partial adoption of irrigation facilities, where cultivation of
both drought-prone and tolerant varieties is possible. Low diversity status of rainfed farms could be due to
the limited availability of drought-tolerant varieties. The statistical insignificance of other farm and
household variables limits the insights into their patterns of influence. The varietal diversity is shown as
greatly determined by the geographic location, as indicated by the dummy variables for states.
However, the prime focus of the model is impact of Bt adoption on varietal richness. Due to the possible
endogeneity associated with the technology adoption decision, instrumental variable approach is resorted to,
as in the case of production function estimation. As shown in Figure 2, the relationship is of quadratic form –
the varietal richness increases at first, reaches the maximum when Bt adoption is partial (about 40% cotton
area under Bt) and then declines with adoption. Overall, the marginal impact of Bt cotton adoption on
varietal richness, which can be defined as the change in MVRI index corresponding to the full adoption of Bt
cotton over non-adoption, is negative in year 2004 and positive in 2006. The possible trade-off between
varietal diversity and transgenic technology in farmers’ perspective, as discussed in Section 2.1, could
possibly be attributed for this effect. The coefficient of the interaction term between year dummy and share
of area under Bt is indicative of a positive supply effect. A decrease in varietal richness in year 2006 among
non-Bt farmers is observed, which could be the result of decline in supply of non-Bt varieties by the seed
firms (by shifting seed market focus to more remunerative GM cultivars) in the corresponding year.
Since the supply of Bt varieties crucially determines the diversity, the limited supply of GM varieties would
cost the agricultural sector in both direct and indirect manner. Wide adoption of few Bt varieties implies that
at many locations agro-climatically incompatible varieties would be cultivated. The yield loss due to
location-variety incompatibility is the direct impact of low diversity in Bt seed supply. This can be rectified
through development of local GM varieties. The indirect impact is through the drastic decline in on-farm
varietal richness with technology adoption. Richness is found as one of the production enhancing, risk
reducing factors, and a reduction in it lead to economic welfare of farming community.

15
7. Conclusions
Biodiversity impact of transgenic technology is multi-dimensional. This paper has examined the singular
aspect of on-farm crop varietal diversity conservation, taking the case of Bt cotton in Indian agriculture for
empirical evaluation. A combination of Damage Control and Just-Pope production function analyses on farm
level data is carried out, in order to test the hypothesized adverse demand effect of PR-GM technology on
diversity. Both Bt technology and varietal richness are found to increase the mean yield and reduce yield
variability, with the former being more efficient. Hence, the farmers’ economic welfare can be greatly
enhanced by ensuring diversity amongst the GM varieties. On the other hand, when farmers’ motive for
maintaining diversity is risk-aversion from pest infestation, and they realize the potential of Bt technology
for the same purpose, then the on-farm diversity impact of technology adoption would invariably be
negative. In other words, one of the factors behind the technology-diversity trade-off is that PR-GM
technology could effectively provide a natural insurance against pests, which is also a function of
agrobiodiversity, ultimately resulting in low yield variation.
The rate at which adoption of transgenic technology eliminates on-farm diversity depends on a multitude of
factors. This paper particularly underlines the importance of the supply side, represented by the seed sector.
Release of GM varieties by the seed industry is postulated as positively correlated with on-farm varietal
diversity. Availability of temporal data before and after the expansion of GM seed industry enabled us to
observe these supply-side impacts. The estimation results show that, in year 2004 when the supply of GM
varieties was limited, the varietal diversity shrunk with full adoption of the technology. However, once the
industry got expanded, the impact of Bt adoption turned marginally positive. At the same time, the varietal
diversity has declined drastically among the non-adopters of technology, possibly due to decline in supply of
non-Bt seeds by the firms. These results vividly support the study by Zilberman et al. (2007), which suggests
the role of the existing institutional framework on ensuring diversity with technology development.
In sum, our findings complement those of Smale (1997) and Smale et al. (1998) on bread wheat cultivation,
which indicated that, due to the very interplay of a multitude of factors, any causal relationship between
technology adoption during Green Revolution and genetic erosion cannot be established. Here we extend her
conclusions to Gene Revolution in cotton production sector of India. Since the agronomic impacts of GM
crops could be potentially greater in magnitude, the concerned government policies regulating the
introduction and dissemination of GM varieties should be more efficient. Development of transgenic
technology prompts firms to release more varieties utilizing this technology. This increase in supply could
partially ameliorate the adverse demand effect. Nevertheless, ensuring diversity among non-GM seed sector
is also required in order to maintain diversity among all the farmer groups during the process of technology
diffusion. Once the GM crop gets regulatory approval, release of more varieties at lower cost should be

16
enhanced in order to reduce its negative impacts due to the declining farmer demand for agrobiodiversity.
Strong intellectual property rights regime in the seed sector and high biosafety regulation and/or transaction
costs could hamper the firms from entering the GM seed market. In situations where supply of GM/non-GM
varieties is restricted, possibly due to the informal structure of seed sector, government should take up direct
agro-biodiversity conservation activities.
References
Ammann, K., Effects of biotechnology on biodiversity: herbicide-tolerant and insect-resistant GM crops. TREDS in Biotechnology, 23(8):388-394.
APCoAB, 2006, Bt cotton in India: a status report. Asia-Pacific Consortium on Agricultural Biotechnology, New Delhi, India.
Batie, S.S. and Ervin, D.E., 2001, Transgenic crops and the environment: missing markets and public roles. Environment and Development Economics, 6: 435-457.
Baumgärtner, S. and Quaas, M.F., forthcoming, Agro-biodiversity as natural insurance and the development of financial insurance markets. In Pascual, P., Kontoleon, A., and Smale, M. (eds.) Agricultural
biodiversity and economic development. New York: Routledge. pp:293-317. Bennett, R., Ismael, Y. and Morse, S., 2005, Explaining contradictory evidence regarding impacts of
genetically modified crops in developing countries: varietal performance of transgenic cotton in India. Journal of Agricultural Science, 143: 35-41.
Birol, E., Smale, M. and Gyovoi, A., 2005, Farmer management of agricultural biodiversity in Hungary’s transition economy. In Smale, M. (ed), Valuing crop biodiversity: on-farm genetic resources and
economic change. Wallingford, UK: CAB International Publishing. Birthal, P.S., Sharma, O.P., Kumar, S. and Dhandapani, A., 2000, Pesticide use in rainfed cotton: frequency,
intensity and determinants. Agricultural Economics Research Review, 13(2): 107-122. Brush, S.B. 2000. The issues of in situ conservation of crop genetic resources. In Brush, S.B., (ed.) Genes in
the Field: On-Farm Conservation of Crop Diversity. IDRC/IPGRI/Lewis Publishers. Chapin, F.S., Walker, B.H., Hobbs, R.J., Hooper, D.U., Lawton, J.H., Sala, O.E., and Tilman, D., 1997,
Biotic control over the functioning of the ecosystem. Science, 277(5325): 500-504. Conner, A.J., Glare, T.R. and Nap, J-P., 2003, The release of genetically modified crops into the
environment (Part II: Overview of ecological risk assessment). The Plant Journal¸33:19-46. Crost, B., Shankar, B., Bennett, R. and Morse, S., 2007, Bias from farmer self-selection in genetically
modified crop productivity estimates: evidence from Indian data. Journal of Agricultural Economics, 58(1): 24-36.
Crost, B., and Shankar, B., 2008, Bt cotton and production risk: panel data evidence. International Journal
of Biotechnology, 10 (2/3): 122-131. Dale, P.J., Clarke, B., Fontes, E.M.G., 2002, Potential for the environmental impacts of transgenic crops.
Nature Biotechnology 20, 567 – 574. Di Falco, S. and Perrings, C., 2003, Crop genetic diversity, productivity and stability of agroecosystems. A
theoretical and empirical investigation. Scottish Journal of Political Economy, 50(2): 207-216. Di Falco, S., Chavas, J-P., Smale, M., 2007, Farmer management of production risk on degraded lands: the
role of wheat diversity in the Tigray region, Ethiopia. Agricultural Economics, 36: 147-156. Ervin, D. and Welsh, R., 2006, “Environmental Effects of Genetically Modified Crops: Differentiated Risk
Assessment and Management”. In Just, R.E., Alston, J.M., and Zilberman, D. (Eds.), Regulating
Agricultural Biotechnology: Economics and Policy. Springer Publishers, New York.

17
Gandhi, V.P. and Namboodiri, N.V., 2006, The adoption and economics of Bt cotton in India: preliminary results from a study. Working paper number 2006-09-04, Indian Institute of Management, Ahmedabad, India.
Greene, W.H., 2000, Econometric analysis, 4th edition. Prentice-Hall Inc., New Jersey. Hyde, J., Martin, M.A., Preckel, P.V. and Edwards, C.R., 1999, The economics of Bt corn: valuing
protection from the European corn borer. Review of Agricultural Economics, 21:442-454. Jackson, L.E., Pascual, U., and Hodgkin, T., 2007, Utilizing and conserving agrobiodiversity in agricultural
landscapes. Agriculture, Ecosystems and Environment, 121: 196-210. James, C., 2006, Global status of commercialized biotech/GM crops: 2006. ISAAA Briefs, No. 35.
International Service for the Acquisition of Agri-biotech Applications, Ithaca, NY. Jarvis, D.I., Brown, A.H.D., Cuong, P.H., Collado-Panduro, L., Latournerie-Moreno, L., Gyawali, S., Tanto,
T., Sawadogo, M., Mar, I., Sadiki, M., Hue, N, T., Arias-Reyes, L., Balma, D., Bajracharya, J., Castillo, F, Rijal, D., Belqadi, L., Rana, R., Saidi, S., Ouedraogo, J., Zangre, R., Rhrib, K., Chavez, J.L., Schoen, D., Sthapit, B., De Santis, P., Fadda, C. and Hodgkin, T., 2008, A global perspective of the richness and evenness of traditional crop-variety diversity maintained by farming communities. Proceedings of the National Academy of Sciences (PNAS), 105(14): 5326-5331.
Just, R.E and Pope, R.D., 1978, Stochastic representation of production functions and econometric implications. Journal of Econometrics, 7(1): 67-86.
Just, R.E and Pope, R.D., 1979, Production function estimation and related risk considerations. American
Journal of Agricultural Economics¸61(2): 276-284. Kinzig, A., Pacala, S. and Tilman, D., 2002, The functional consequences of biodiversity: empirical progress
and theoretical extensions. Princeton, NJ: Princeton University Press. Koundouri, P. and Nauges, C., 2005, On production function estimation with selectivity and risk
considerations. Journal of Agricultural and Resource Economics, 30(3): 597-608. Kumbhakar, S.C. and Treterås, R., 2003, Risk preferences, production risk and firm heterogeneity.
Scandinavian Journal of Economics, 105(2): 275-293. Lichtenberg, E. and Zilberman, D., 1986, The economics of damage control: why specification matters.
American Journal of Agricultural Economics¸68: 262-273. Losey, J.E., Rayor, L.S. and Carter, M.E., 1999, Transgenic pollen harms monarch larve. Nature 399: 214. Magurran, A., 1988, Ecological density and its measurement. Princeton University Press, Princeton, NJ. Narayanamoorthy, A. and Kalamkar, S.S., 2006, Is Bt cotton cultivation economically viable for Indian
farmers? An empirical analysis. Economic and Political Weekly, June 30, 2006: 2716-2724. Natarajan, L., Smale, M. and Glewwe, P., 2007, Determinants of millet diversity at the household-farm and
village community levels in the drylands of India: the role of local seed systems. Agricultural
Economics, 36: 157-167. Perrings, C. and Gardgil, M., 2002, Conserving biodiversity: reconciling local and global public benefits. In
Kaul (ed.), Providing global public goods: making globalization work for all. Oxford University Press, UK.
Qaim, M., 2005, Agricultural Biotechnology Adoption in Developing Countries. American Journal of
Agricultural Economics, 87(5): 1317-1324. Qaim, M. and Zilberman, D., 2003, Yield effects of genetically modified crops in developing countries.
Science 299: 900-902. Qaim, M., Subramanian, A., Naik, G. and Zilberman, D., 2006, Adoption of Bt cotton and impact
variability: insights from India. Review of Agricultural Economics, 28 (1), 48–58. Quist, D. and Chapela, I.H., 2001, Transgenic DNA introgressed into traditional maize landraces in Oaxaca,
Mexico. Nature 414, 541-543. Smale, M., 1997, The Green Revolution and wheat genetic diversity: some unfounded assumptions. World
Development, 25(8): 1257-1269. Smale, M., Hartell, J., Heisey, P.W. and Senauer, B., 1998, The contribution of genetic resources and
diversity to wheat production in the Punjab of Pakistan. American Journal of Agricultural Economics, 80: 482-493.

18
Thirtle, C., Beyers, L., Ismal, Y., and Piesse, J., 2003, Can GM technologies help the poor? The impact of Bt cotton in Makhathini Flats, KwaZulu-Natal. World Development, 31(4): 717-732.
Thomson, J.A., 2006, GM crops: the impact and the potential. Collingwood, Australia: CSIRO Publishing. pp:65-77.
Tobin, J., 1958, Estimation for relationships with limited dependent variables. Econometrica, 26 (1): 24–36 Traxler, G., Falck-Zepeda, J.I, Ortiz-Monasterio, R., and Sayre, K., 1995, Production risk and the evolution
of varietal technology. American Journal of Agricultural Economics, 77: 1-7. Zilberman, D., Ameden, H. and Qaim, M., 2007, The impact of agricultural biotechnology on yields, risks,
and biodiversity in low-income countries. Journal of Development Studies, 43(1): 63-78.

19
Table 1. On-farm varietal richness and cotton yield Year No. of
varieties/farm % of farms MVR
Index Share of Bt
adoption Cotton yield
[quintals/acre] CV in yield
2004 [N =362]
1 36.19 0.00 (0.00)
0.42 (0.49)
5.45 (3.80)
0.70
2 31.49 0.28 (0.05)
0.21 (0.31)
5.79 (3.75)
0.65
3 14.09 0.51 (0.07)
0.21 (0.25)
5.81 (2.66)
0.46
4 7.18 0.69 (0.07)
0.19 (0.23)
6.12 (2.49)
0.41
5 3.87 0.92 (0.10)
0.19 (0.21)
5.93 (2.45)
0.41
> 5 7.18 1.18 (0.25)
0.13 (0.16)
4.14 (1.66)
0.40
Overall 100.00 0.33 (0.36)
0.28 (0.38)
5.58 (3.40)
0.61
2006
[N =343] 1 44.90 0.00
(0.00) 0.83
(0.37) 7.27
(3.85) 0.53
2 26.53 0.28 (0.04)
0.88 (0.24)
8.31 (3.47)
0.42
3 14.87 0.50 (0.06)
0.85 (0.23)
8.96 (3.29)
0.37
4 8.45 0.72 (0.09)
0.82 (0.23)
8.59 (2.13)
0.25
5 4.37 0.84 (0.08)
0.89 (0.17)
8.45 (2.87)
0.34
> 5
0.87 1.29 (0.21)
0.76 (0.21)
8.71 (2.06)
0.24
Overall 100.00 0.26 (0.29)
0.85 (0.30)
7.97 (3.54)
0.44
Figures in parentheses show standard deviation (SD) N stands for the sample size.

20
Table 2. Summary statistics Variables Description (units) i. Per plot ii. Per farm
2004 [N = 464]
2006 [N = 369]
2004 [N = 362]
2006 [N = 343]
1. Yield Cotton yield (Q/acre) 6.19 (3.18)
8.13 (3.56)
5.58 (3.40)
7.97 (3.54)
2. Manure Cost of farm yard manure (Rs/acre) 277.56 (803.77)
868.62 (1877.50)
3. Fertilizer Cost of chemical fertilizers (Rs/acre) 1745.59 (1251.05)
1883.86 (2801.37)
4. H.Labor Cost of human labor employed (Rs/acre) 1808.10 (1047.06)
2755.23 (2062.26)
5. Insecticide Cost of insecticides used (Rs/acre) 2115.65 (1812.13)
1166.80 (1675.77)
6. Other Cost of other production inputs (Rs/acre) 104.13 (1206.34)
196.57 (846.01)
7. Farm size Farm size owned by the household (acres) 14.88 (17.41)
12.31 (13.55)
13.57 (16.21)
12.04 (13.43)
8. Household Number of members in the household 6.79 (4.02)
6.26 (4.05)
6.63 (3.77)
6.18 (4.07)
9. Age Age of head of the household (years) 44.96 (12.75)
44.68 (13.11)
44.87 (12.77)
44.64 (13.03)
10 Education Years of schooling obtained by head of the household 7.42 (4.90)
6.82 (5.46)
7.27 (4.89)
6.85 (5.46)
11. Irrigation Share of cotton area under irrigation (0-1) 0.39 (0.46)
0.51 (0.48)
0.39 (0.46)
0.52 (0.48)
12. Richness Margalef Varietal Richness (MVR) Index 0.39 (0.36)
0.27 (0.29)
0.33 (0.36)
0.26 (0.29)
13. Bt Dummy for Bt cotton 0.36 0.85
14. Bt share Share of cotton area under Bt cotton per farm (0-1) 0.28 (0.38)
0.85 (0.30)
15. Year Dummy for year of 2006 0.44 0.49
16. Maharashtra Dummy [reference] if farmer is from Maharashtra 0.33 0.32 0.33 0.32
17. Karnataka Dummy if farmer is from Karnataka 0.29 0.29 0.31 0.29
18. AP Dummy if farmer is from Andhra Pradesh 0.31 0.35 0.30 0.35
19. TN Dummy if farmer is from Tamil Nadu 0.07 0.04 0.08 0.04
Figures in parentheses show standard deviation of sample mean. N stands for the sample size. 1 US$ = Rs. 48.62 (monthly average in October 2008)

21
Table 3. Production function analysis Variables i. Cobb-Douglas ii. Damage Control iii. Yield variance
Coefficient Std. Err. p-value Coefficient Std. Err. p-value Coefficient Std. Err. p-value
ln(Manure) -0.027 0.007 0.00 -0.026 0.007 0.00 0.019 0.028 0.49 ln(Fertilizer) 0.023 0.020 0.27 0.028 0.017 0.09 -0.287 0.101 0.01 ln(H.Labour) 0.036 0.016 0.03 0.033 0.016 0.04 -0.107 0.075 0.16 ln(Other) 0.010 0.011 0.40 0.009 0.011 0.39 0.043 0.042 0.31 ln(Insecticide) -0.063 0.052 0.23 0.630 0.217 0.00 Irrigation 0.352 0.063 0.00 -0.493 0.239 0.04 Bt 0.567 0.183 0.00 -2.230 0.813 0.01 Richness 0.255 0.094 0.01 -0.930 0.382 0.02 Bt*Richness 0.227 0.217 0.30 -0.784 0.600 0.19 ln(Farm size) -0.026 0.021 0.22 -0.029 0.020 0.16 0.063 0.090 0.49 ln(Household size) -0.013 0.056 0.81 8.E-08 0.052 1.00 -0.579 0.227 0.01 ln(Age) -0.026 0.079 0.75 -0.032 0.079 0.69 0.481 0.287 0.09 ln(Education) 0.031 0.025 0.21 0.028 0.024 0.24 -0.043 0.097 0.66 Karnataka 0.142 0.062 0.02 0.146 0.061 0.02 0.157 0.268 0.56 AP 0.356 0.109 0.00 0.409 0.094 0.00 -1.522 0.415 0.00 TN -0.475 0.161 0.00 -0.494 0.119 0.00 1.040 0.682 0.13 Year -0.308 0.145 0.03 -0.476 0.167 0.01 1.593 0.692 0.02 Damage
control
µ 0.041 0.565 0.94 ln(Insecticide) 0.155 0.066 0.02 Irrigation -0.698 0.156 0.00 Bt -1.713 0.563 0.00 Richness -0.453 0.164 0.01 Bt*Richness -1.078 1.255 0.39
Intercept 1.449 0.383 0.00 2.279 0.433 0.00 -3.580 1.473 0.02
Adjusted R2 0.162 0.167 0.058

22
Table 4. Determinants of on-farm varietal richness
Tobit model Test statistic
Coefficient Std. Err p-value H0 F(2, 691) p-value
Bt_share [ β1] 0.617 0.403 0.13 β1= β2=0 4.85 0.01
Square of Bt_share [ β2] -1.297 0.529 0.02
Farm [ β3] 0.016 0.003 0.00 Β3= β4=0 15.43 0.00
Square of Farm [ β4] -1.E-04 4.E-05 0.00
Irrigation [ β5] 0.751 0.217 0.00 Β5= β6=0 6.95 0.01
Square of Irrigation [ β6] -0.784 0.214 0.00
Household -0.003 0.004 0.48
Age -0.002 0.001 0.18
Education 3.E-04 0.004 0.94
Karnataka -0.470 0.050 0.00
AP -0.056 0.044 0.20
TN -0.572 0.090 0.00
Year -1.639 0.481 0.00
Year*Bt_share 2.312 0.694 0.00
Intercept 0.320 0.107 0.00
σ 0.386 0.015 0.00
Log-pseudo-likelihood ratio -385.46
F(14, 691) 18.85
Prob. > F 0.00
Pseudo R2 0.280

23
Figure 1. Impact of PR-GM on varietal diversity on-farm
[A] Mean yield enhancing
[B] Production risk reduction
>(Γ?). =7D~
>(Γ?). =7C~
�3 �5
p3 p5
�
p~
p m �
_ �
�
� k
MVP3 MVP5
� I I~
>(ΓE). =7C~
>(ΓE). =7D~
W~
�
-~
W3
93 , 0
95 , 0
93
(93 G S)
MVP5 MVP3
W
/
^
�
�
1
�
�
� �~
(95 G S)
95
W~~
W5
-~~ -
�
�

24
Figure 2. Bt cotton adoption and on-farm diversity
a. Number of varieties on-farm
b. Varietal richness index
0
1
2
3
4
0.0 0.2 0.4 0.6 0.8 1.0
Number o
f cotton va
rieties per
farm
Share of cotton area under Bt technology
20042006
0.00.10.20.30.40.50.6
0.0 0.2 0.4 0.6 0.8 1.0
Margalef v
arietal ric
hness ind
ex
Share of cotton area under Bt technology
20042006