Embed Size (px)
Citation preview

arX
iv:1
701.
0072
4v1
[ast
ro-p
h.S
R]
3 Ja
n 20
17Astronomy& Astrophysicsmanuscript no. desimone c©ESO 2018August 10, 2018
Glycolaldehyde in Perseus young solar analogs⋆
M. De Simone1, C. Codella1, L. Testi1, 2, 3, 4, A. Belloche5, A.J. Maury6, S. Anderl7, 8, Ph. André6, S. Maret7, 8, and L.Podio1
1 INAF, Osservatorio Astrofisico di Arcetri, Largo E. Fermi 5,50125 Firenze, Italy2 ESO, Karl Schwarzchild Str. 2, 85748 Garching bei München, Germany3 Excellence Cluster ‘Universe’, Boltzmannstr. 2, D-85748 Garching bei Muenchen, Germany4 Gothenburg Center for Advance Studies in Science and Technology, Department of Mathematical Sciences, Chalmers University
of Technology and University of Gothenburg, SE-412 96 Gothenburg, Sweden5 Max-Planck-Institut für Radioastronomie, Auf dem Hügel 69, 53121 Bonn, Germany6 Laboratoire AIM-Paris-Saclay, CEA/DSM/Irfu - CNRS -Université Paris Diderot, CE Saclay, 91191 Gif-sur-Yvette Cedex, France7 Univ. Grenoble Alpes, CNRS, IPAG, 38000, Grenoble, France8 CNRS, IPAG, 38000, Grenoble, France
Received date; accepted date
ABSTRACT
Context. The earliest evolutionary stages of low-mass protostars are characterised by the so-called hot-corino stage, when thenewlyborn star heats the surrounding material and enrich the gas chemically. Studying this evolutionary phase of solar protostars may helpunderstand the evolution of prebiotic complex molecules inthe development of planetary systems.Aims. In this paper we focus on the occurrence of glycolaldehyde (HCOCH2OH) in young solar analogs by performing the firsthomogeneous and unbiased study of this molecule in the Class0 protostars of the nearby Perseus star forming region.Methods. We obtained sub-arcsec angular resolution maps at 1.3mm and1.4mm of glycolaldehyde emission lines using the IRAMPlateau de Bure (PdB) interferometer in the framework of theCALYPSO IRAM large program.Results. Glycolaldehyde has been detected towards 3 Class 0 and 1 Class I protostars out of the 13 continuum sources targeted inPerseus: NGC1333-IRAS2A1, NGC1333-IRAS4A2, NGC1333-IRAS4B1, and SVS13-A. The NGC1333 star forming region looksparticularly glycolaldehyde rich, with a rate of occurrence up to 60%. The glycolaldehyde spatial distribution overlaps with thecontinuum one, tracing the inner 100 au around the protostar. A large number of lines (up to 18), with upper-level energies Eu from37 K up to 375 K has been detected. We derived column densities≥ 1015 cm−2 and rotational temperaturesTrot between 115 K and236 K, imaging for the first time hot-corinos around NGC1333-IRAS4B1 and SVS13-A.Conclusions. In multiple systems glycolaldehyde emission is detected only in one component. The case of the SVS13-A+B andIRAS4-A1+A2 systems support that the detection of glycolaldehyde (atleast in the present Perseus sample) indicates older protostars(i.e. SVS13-A and IRAS4-A2), evolved enough to develop the hot-corino region (i.e. 100 K in the inner 100 au). However, only twosystems do not allow us to firmly conclude whether the primaryfactor leading to the detection of glycolaldehyde emissionis theenvironments hosting the protostars, evolution (e.g. low value ofLsubmm/Lint), or accretion luminosity (highLint).
Key words. Stars: formation – ISM: jets and outflows – ISM: molecules – individual objects: NGC1333-IRAS2A, –IRAS4A,–IRAS4B, and SVS13-A
1. Introduction
The gas surrounding a new born star can reach temperatureshigher than 100 K, due to thermal heating by the protostar (theso called hot-corinos see e.g. Ceccarelli et al. 2007) as well asshocks produced by both accretion and ejection processes (e.g.Codella et al. 2009; Sakai et al. 2014). In turn, such temperaturesfavour a rich complex organic chemistry, with a consequent dra-matic increase of the abundance of the so-called Complex Or-ganic Molecules (COMs; i.e. organic molecules with at least6atoms detected in space, Herbst & van Dishoeck 2009), whichcan be considered the first bricks to build biologically relevantmolecules. Among the COMs, glycolaldehyde (HCOCH2OH) isthe simplest sugar-like molecule and it is expected to be involved
Send offprint requests to: C. Codella, e-mail:[email protected]⋆ Based on observations carried out with the IRAM Plateau de Bure
interferometer. IRAM is supported by INSU/CNRS (France), MPG(Germany), and IGN (Spain)
in the chemical processes leading to ribose (e.g. Weber 1998;Jalbout et al. 2007), in turn the backbone of terrestrial RNA.
The first detection of interstellar glycolaldehyde was madein the hot core Sagittarius B2(N) located in the high-mass starforming region Sagittarius B2 close to the Galactic Centre (Hol-lis et al. 2000, 2004; Halfen et al. 2006; Requena-Torres et al.2008). Later on, Beltrán et al. (2009) imaged glycolaldehydeemission for the first time towards a star forming region, namelythe massive hot core (the scaled-up version of a hot-corino)G31.41+0.31, while Calcutt et al. (2014) reported glycolalde-hyde towards further hot cores. However, the large distanceofthe observed high-mass star forming regions (≥ 1 kpc) hampers(i) to assess a reliable association with one or more young stellarobjects due to multiplicity, and (ii) an analysis on spatialscalescomparable to that of a protoplanetary disk (i.e.∼ 100 au). Inaddition, the study of the formation and evolution of complexorganic molecules (including glycolaldehyde) in young Solaranalogs is essential to understand the potential of formation andevolution of pre-biotic material in these systems.
Article number, page 1 of 24

A&A proofs:manuscript no. desimone
Jørgensen et al. (2026) reported the first detection of glyco-laldehyde emission with ALMA towards the young Solar analoglow-mass Class 0 protostellar system IRAS 16293-2422. Theydetected 13 emission lines indicating the presence of glycolalde-hyde in the warm gas (200–300 K) in the inner regions of thesystem, within∼ 50 au from each protostar. This study paved theway to the study of glycolaldehyde around Sun-like star formingregions (see also the recent work by Jørgensen et al. 2016). In-deed, Coutens et al. (2015) and Taquet et al. (2015) detected,using the IRAM PdB array, up to 8 glycolaldehyde lines towardstwo others well know hot-corinos associated with the NCC1333-IRAS2A and NGC1333-IRAS4A protostars, finding tempera-tures higher than 100 K. Going beyond these initial findings,itis important to perform a more systematic study to understandhow common is the occurrence of glycolaldehyde around solar-type protostars, and whether the presence of relatively abundantgas-phase glycolaldehyde can be linked to a specific evolution-ary phase. A uniform sensitivity and high angular resolution sur-vey of protostars is the best approach to attempt to answer thesequestions.
The CALYPSO1 survey of Class 0 protostars (i.e. 104–105 yrsolar analog protostars; André et al. 1993, 2000), which wascar-ried out with the IRAM-PdB interferometer (see Maury et al.2014, for more details), offers a unique dataset for studying gly-colaldehyde. The sources are mainly Class 0 protostars withtheexception of SVS13-A which has apparently entered in the ClassI stage (Lada 1987). CALYPSO includes all Solar-mass proto-stellar systems in the Perseus L1448 (d = 232±18 pc; Hirota etal. 2011) and NGC-1333 (d = 235±18 pc; Hirota et al. 2008)regions. The dataset (see Sect. 2) includes high angular resolu-tion (≤ 1′′) spectral maps at 1.3 and 1.4 mm, which cover a broadrange of glycolaldehyde lines and upper-level energy and are ad-equate for an initial statistical study. In this paper we present ananalysis of these data, limited to the glycolaldehyde molecule,a detailed analysis of the continuum data will be presented inMaury et al. (in preparation), and the analysis of all complexorganic molecules detected in the survey in Belloche et al. (inpreparation).
The goal of the present paper is: (i) to perform a first sta-tistical analysis of the occurrence of glycolaldehyde emissiontowards Class 0 protostellar sources, and (ii) to take advantageof the combination of high sensitivity and high spatial resolutionprovided by the CALYPSO database to detect a large numberof lines covering a wide range of upper-level energy, leading toreliable estimates of the rotational (excitation) temperatures andglycolaldehyde column densities. The observations are reportedin Sect. 2, while in Sect. 3 we describe the selected sample. Theobtained images, the derived physical conditions, and the esti-mate of the glycolaldehyde abundances are reported in Sect.4.Our conclusions are summarized in Sect. 5.
2. Observations
The Perseus sources (listed in Table 1) were observed at 1.3mmand 1.4mm with the IRAM PdB six-element array during severaltracks between November 2010 and February 2012 using boththe A and C configurations. The shortest and longest baselinesare 19 m and 762 m, respectively, allowing us to recover emis-sion at scales from∼ 8′′ down to∼ 0′′.4. The glycolaldehyde
1 http://irfu.cea.fr/Projects/Calypso
lines2 were observed using the WideX backend to cover two 4-GHz spectral windows (one at 1.3mm and one at 1.4mm) witha spectral resolution of 2 MHz (∼ 2.6 km s−1 at 1.4 mm). Theobserved spectral ranges are the following: 217.0–220.5 GHz(1.4mm hereafter), and 229.0–233.0 GHz (1.3mm). Calibrationwas carried out following standard procedures, using GILDAS-CLIC3. The phase rms was≤ 65◦, the precipitable water vapor(PWV) was typically less than 2mm, the system temperaturesless than 200 K. The final uncertainty on the absolute flux scaleis ≤ 15%. The continuum emission was removed from the vis-ibility tables to produce continuum-free line tables. The typicalrms noise in the 2-MHz channels was 3–9 mJy beam−1. Imageswere produced using natural weighting, and restored with a cleanbeam of≤ 1′′, reported, for each source and for each wavelength,in Table 1.
3. The sample
The sample of sources is based on all the peaks detected in the1.3mm and 1.4mm continuum images of CALYPSO targets inPerseus (see Codella et al. 2014; Santangelo et al. 2015; An-derl et al. 2016; Maury et al., in preparation). We selected thesources in the Perseus complex, which is a classical laboratory tostudy low-mass star formation; in particular, the selectedsourcesbelong to the most active sites of current star formation in thePerseus cloud: the NGC-1333 and L1448 clusters. We observed4 multiple systems in NGC-1333 (IRAS2A, IRAS4A, IRAS4B,and SVS13) as well as 4 protostars in L1448 (2A, NB, NA, andC objects), for a total number of 13 objects to be analysed tosearch for glycolaldehyde emission. In Table 1 we report thecontinuum peaks detected at 1.4 mm in Perseus using the CA-LYPSO database; for every source are reported the positionsofthe peaks and the systemic velocities (Vsys) extracted from theCALYPSO dataset, the 1.4 mm peak flux, the internal luminos-ity (Lint), and the clean beams (HBPWsyn) for each wavelength.The internal luminosities are derived using the 70µm measure-ments provided by theHerschel Gould Belt survey (André et al.2010). In particular, Dunham et al. (2008), in the context oftheSpitzer Space Telescope Legacy Project "From Molecular Coresto Planet Forming Disks", showed how the 70µm flux and inter-nal luminosity of a protostar are tightly correlated. As theformeris a directly observable quantity but the latter is not, thiscorrela-tion gives a powerful method for estimating protostellar internalluminosities.Lint is expected to be a more reliable probe of ac-cretion luminosity than the bolometric luminosityLbol (see alsoLadjelate et al., in preparation), which requires a full coverage ofthe Spectral Energy Distribution (SED) at high-spatial resolution(8′′).
The continuum map of NGC1333-IRAS2A reveals the mainprotostar IRAS2-A1, plus two weaker peaks, IRAS2-A2 andIRAS2-A3 (see Codella et al. 2014). The nature of A2 and A3is still debated, being possibly dust fragments associatedwiththe molecular cloud and swept up by the outflows driven bythe nearby IRAS2-A1 protostar (see Codella et al. 2014; Tobinet al. 2016). For the purpose of the analysis presented in thispaper, we have considered these as genuine protostars, exceptwhere explicitly mentioned otherwise. The NGC-1333-IRAS4system has two main objects: IRAS4A and IRAS4B. In turn,IRAS4A is a binary composed by two Class 0 objects, separated
2 Spectroscopic parameters have been extracted from the Jet Propul-sion Laboratory molecular database (Pickett et al. 1998), see Tables 2to 5.3 http://www.iram.fr/IRAMFR/GILDAS
Article number, page 2 of 24

De Simone et al.: Glycolaldehyde in Perseus young solar analogs
Table 1. Continuum peak emission at 1.4mm, detected in Perseus usingthe CALYPSO survey, where glycolaldehyde emission has beensearchedfor.
Source α(J2000)a δ(J2000)a Vsysa db F1.4mm Lint
c HPBWsyn
(h m s) (◦ ′ ′′) (km s−1) (pc) (mJy/beam) (L⊙) ′′×′′(◦)1.4mm 1.3mm
L1448-2A 03:25:22.406 +30 45 13.28 +4.2 232 31 2.7 0′′.99×0′′.71 (28◦) 1′′.03×0′′.81 (39◦)L1448-NB 03:25:36.364 +30 45 14.84 +4.7 232 25 4.1 0′′.81×0′′.67 (67◦) 0′′.65×0′′.48 (48◦)L1448-NA 03 25 36.503 +30 45 21.87 +4.7 232 139 - 0′′.81×0′′.67 (67◦) 0′′.65×0′′.48 (48◦)L1448-C 03 25 38.878 +30 44 05.32 +5.2 232 102 6.8 0′′.77×0′′.63 (22◦) 0′′.61×0′′.38 (33◦)IRAS2A3 03 28 55.514 +31 14 34.84 +7.3 235 16 - 0′′.82×0′′.80 (32◦) 0′′.75×0′′.74 (168◦)IRAS2A1 03 28 55.575 +31 14 37.05 +7.3 235 99 26.7 0′′.82×0′′.80 (32◦) 0′′.75×0′′.74 (168◦)IRAS2A2 03 28 55.677 +31 14 35.56 +7.3 235 12 - 0′′.82×0′′.80 (32◦) 0′′.75×0′′.74 (168◦)SVS13-B 03 29 03.075 +31 15 51.71 +8.4 235 122 1–2c 1′′.06×0′′.80 (20◦) 0′′.70×0′′.42 (20◦)SVS13-A 03 29 03.759 +31 16 03.74 +8.4 235 123 24.5 1′′.06×0′′.80 (20◦) 0′′.70×0′′.42 (20◦)IRAS4A2 03 29 10.429 +31 13 32.10 +7.2 235 284 - 1′′.10×0′′.81 (20◦) 0′′.70×0′′.42 (20◦)IRAS4A1 03 29 10.531 +31 13 30.96 +7.2 235 795 2.8 1′′.10×0′′.81 (20◦) 0′′.70×0′′.42 (20◦)IRAS4B1 03 29 12.012 +31 13 08.07 +6.7 235 449 1.0 1′′.08×0′′.83 (20◦) 0′′.70×0′′.42 (20◦)IRAS4B2 03 29 12.840 +31 13 06.98 +6.7 235 53 - 1′′.08×0′′.83 (20◦) 0′′.70×0′′.42 (20◦)
a Positions of the 1.3mm continuum peak emission and systemicvelocities are extracted from the CALYPSO dataset (Codellaetal. 2014; Santangelo et al. 2015; Anderl et al. 2016; Maury etal., in preparation).b From Hirota et al. (2008, 2011).c Internalluminosities were derived from the observed flux at 70µm (Dunham et al. 2008), a wavelength at whichHerschel Gould Belt
survey observations (André et al. 2010) provide data at 8′′ spatial resolution (see also Ladjelate et al., in preparation). The internalluminosity of SVS13-B is more uncertain due to the proximityto SVS13-A.
by 1′′.8: IRAS4-A1 and IRAS4-A2 (e.g. Looney et al. 2000).While IRAS4-A1 is more than three times brighter in the mm-flux than its companion, only IRAS4-A2 shows a high molecularcomplexity (see Taquet et al. 2015; Coutens et al. 2015; Santan-gelo et al. 2015). IRAS4B is located∼ 30′′ southeast of IRAS4A,and it is associated with two compact continuum sources, B1 andB2, with an angular separation of 11′′ (e.g. Looney et al. 2000;Choi et al. 2011). NGC1333-SVS13 is a cluster dominated atmillimeter wavelengths by two sources: SVS13-A, and SVS13-B. SVS13A is a protostar already in the Class I stage and drivesan extended outflow associated with the well-known HH7-11chain (e.g. Lefloch et al. 1998; Chen et al. 2009). On the otherhand, SVS13-B is an earlier protostar lying southwest of SVS13-A at a distance of 15′′ (e.g. Bachiller et al. 1998; Looney et al.2000). Finally, the L1448-NA, L1448-NB, and L1448-2A proto-stars are located in the northern portion of the L1448 complex, atabout∼ 1◦ southwest of NGC1333, while L1448-C is located atthe center of the L1148 complex (see Looney et al. 2000; Tobinet al. 2016, and references therein).
4. Results and discussion
The results of the present search towards the coordinates listed inTable 1 indicates the presence of glycolaldehyde towards 4 outof the 13 observed continuum peaks. If we consider that the clas-sification of the IRAS2-A3 and IRAS2-A2 continuum peaks asgenuine protostars is debated (see the recent paper by Tobinet al.2016), the detection rate is∼36%. Interestingly, glycolaldehydehas only been detected towards the NGC1333 sources, where thedetection rate is as high as∼60%.
Figures A.1 to A.9 report the spectra at the frequencies ofthe glycolaldehyde lines observed towards IRAS2A1, SVS13-A,IRAS4A2, and IRAS4B1. The spectral resolution does not allowus to probe the profiles of the emission lines and the observedspectra are affected by line blending. Nevertheless, there is littledoubt that the large WideX bandwidths (8 GHz in total) allowedus to detect towards the four sources a considerable number ofglycolaldehyde lines (up to 18) with a signal-to-noise ratio (S/N)
Table 2. Number of glycolaldehyde lines and results of the LTE analysisfor the detected sources.
Source Ntrans Eu Trot Ntot
(K) (K) (1014 cm−2)IRAS2A1 13 37–318 159(24) 46(20)IRAS4A2 18 37–375 236(74) 88(70)IRAS4B1 13 37–271 152(35) 15(9)SVS13-A 11 37–375 115(13) 21(8)
a In several cases (3 for IRAS2A1, 1 for IRAS4A2, IRAS4B1,and SVS13-A; see Tables A1 to A4), the detected lines are dueto two glycolaldehyde transitions at frequencies blended at the
present spectral resolution.
of at least 3. We then selected only those transitions with a cor-responding synthetic line (derived using the rotation diagram so-lutions, see below) that reproduces at least 50% of a detectedpeak temperature. The lines were identified using the Jet Propul-sion Laboratory (JPL) molecular database (Marstokk & Møllen-dal 1970, 1973; Pickett et al. 1998; Butler et al. 2001; WidicusWeaver et al. 2005; Carroll et al. 2010). Figure 1 shows examplesof glycolaldehyde emission lines (inTB scale) observed in the1.3mm and 1.4mm spectral windows towards the four detectedsources. Figures A.1, A.3, A.5, and A.7 show all the lines usedfor the following analysis. Tables A.1-A.4 report the observedline parameters; we list both peak line intensities (Tpeak) andvelocities (Vpeak, consistent with the LSR velocities of the ob-jects), linewidth (FWHM), and the integrated emission (
∫Tdv).
All the values are inTB scale and are derived from Gaussianfits. A wide upper-level energy range is observed (see Table 2),with Eu from 37 K up to 375 K: this allows us (i) to improve onthe results of Coutens et al. (2015) and Taquet et al. (2015) onIRAS2A1 and IRAS4A2, by increasing the number of detectedlines and expanding the range of upper-level energy probed,and(ii) to firmly assess, for the first time, the glycolaldehyde occur-rence towards IRAS4B1 and SVS13-A.
Article number, page 3 of 24
A&A proofs:manuscript no. desimone
Fig. 1. Examples of glycolaldehyde emission lines (inTB scale) observed in the 1.3mm and 1.4mm spectral windows (andat different upper-level energy,Eu from 37 K to 135 K) towards NGC1333-IRAS2A1 (Upper-left panel), NGC1333-IRAS4A2 (Upper-right panel), NGC1333-IRAS4B1 (Lower-left panel), and NGC1333-SVS13A (Lower-right panel). The horizontal green dotted lines show the 3σ level. In blue we markthe glycolaldehyde lines extracted from Tables A1-A4. The bright line at∼ 220190 MHz is due to CH3OCHO(174,13–164,12)A (Maury et al. 2014;Belloche et al. in preparation). The red line shows the synthetic spectrum obtained with the GILDAS–Weeds package (Maret et al. 2011) andassuming the rotation diagram solutions (see Fig. 3).
4.1. HCOCH2OH spatial distributions
Figure 2 compares the spatial distribution of the glycolalde-hyde emission (colour scale and green contours) with thatof the 1.4mm continuum (white contours; see Codella et al.2014; Maury et al., in preparation) towards (from top tobottom) NGC1333-IRAS2A1, NGC1333-IRAS4A, NGC1333-IRAS4B1, and NGC1333 SVS13-A. The glycolaldehyde distri-bution refers to emission lines in both the 1.3mm and 1.4mmspectral windows, i.e. the sum of the 76,2-65,1 and 76,1-65,2 lines(220.2 GHz,Eu = 37 K), and the 222,21-211,20 line (232.3 GHz,Eu = 135 K). Consistent with the results of Taquet et al. (2015),our images indicate that the glycolaldehyde emission is onlymarginally resolved. For each source, we derived the emissionsize of the brightest line at 1.3 mm shown in Fig. 2 by fit-ting an elliptical Gaussian in theuv domain: we obtain about0′′.5 (IRAS2A1), 0′′.4 (IRAS4A2, IRAS4B1), and 0′′.3 (SVS13-A), which implies that the glycolaldehyde emission is confinedin the inner 100 au around each protostar. The glycolaldehydeemission peak is consistent, considered the angular resolution,with the continuum peaks. Our results confirm the hot-corinonature of NGC1333-IRAS2A1 and NGC1333-IRAS4A2, previ-ously noted by Maury et al. (2014) and Taquet et al. (2015), andin addition supports the same nature for IRAS4B1 and SVS13-A(see Sect. 4.2 for the temperature measurements).
Finally, the image of the brightest glycolaldehyde emission(at 220.2 GHz) of the IRAS4-A1+A2 system, shows, in addi-tion to the A2 compact core, a tentative detection at 5σ of amore extended emission. If significant, either this could tracepart of the extended envelope hosting the two protostars; oritcould be associated with the swept-up material associated withthe two N-S outflows driven by the A1 and A2 protostars (San-tangelo et al. 2015). In the latter case, this would be the first sig-nature of glycolaldehyde emission from a protostellar outflow.However, note that this feature could be potentially contami-
nated by emission due to the SO17O(132,12–131,13) transition at220196.75 MHz (Eu = 93 K, log (Aij /s−1) = -3.8). We inspectedthe CALYPSO dataset searching for emission lines due to SO2isotopologues. We have only a weak (less than 3σ) 34SO2(42,2–31,3) emission at 229.9 GHz (Eu = 19 K, log (Aij /s−1) = -4.1),but only around the NGC1333-IRAS4A2 protostar. In addition,again only IRAS4A2, we have a tentative (≥ 3sigma) detectionof the SO2(115,7–124,8) line (Eu = 122 K) at 229.3 GHz, and,not surprisingly, no detection of the SO2(227,15–236,18) line at219.3 GHz (Eu = 352 K). In any case, the spectral resolution andsensitivity of the present dataset is not high enough to properlyinvestigate this intriguing possibility, calling for further interfer-ometric observations. The analysis presented in this paperonlyrefers to the compact component.
4.2. HCOCH2OH rotation diagrams
Given that the glycolaldehyde collisional rates are not availablein the literature, we derived excitation temperature and columndensities by using a crude approach such as the classical rota-tional diagram, assuming a unique temperature, optically thinemission, and Local Thermodynamic Equilibrium (LTE) condi-tions. We applied a correction due to the beam filling factor us-ing the sizes reported in Sect. 4.1. Under these assumptions, fora given transition the column density of the upper level,Nup, isrelated to the rotational temperatureTrot, as follows:
Nup =8πkν2
hc3Aul f f
∫Tdv (1)
lnNup
gup= lnNtot − lnQ(Trot) −
Eup
kTrot(2)
where:h andk are the Planck and Boltzmann constants, re-spectively,f f is the beam filling factor (derived using the sizes
Article number, page 4 of 24

De Simone et al.: Glycolaldehyde in Perseus young solar analogs
Fig. 2. Comparison between the 1.4mm continuum (white contours) and the glycolaldehyde spatial distributions (colour scale and green contours)towards (from top to bottom) NGC1333-IRAS2A1, NGC1333-IRAS4A, NGC1333-IRAS4B1, and NGC1333 SVS13-A. For continuum,first con-tours and steps correspond to 5σ (14 mJy beam−1) and 10σ, respectively. The ellipses show the PdBI synthesised beam(HPBW) for the continuum(white, see Table 1) and glycolaldehyde images. The HPBWs for the glycolaldehyde images at 1.4mm are: 0′′.82×0′′.70, 32◦ (NGC1333-IRAS2A1),1′′.08×0′′.81, 19◦ (NGC1333-IRAS4A), 1′′.08×0′′.83, 20◦ (NGC1333-IRAS4B1), and 1′′.06×0′′.80, 20◦ (NGC1333 SVS13-A). The HPBWs for theglycolaldehyde images at 1.3mm are: 0′′.82×0′′.70, 32◦ (NGC1333-IRAS2A1), 0′′.72×0′′.44, 21◦ (NGC1333-IRAS4A), 0′′.72×0′′.44, 21◦ (NGC1333-IRAS4B1), and 0′′.71×0′′.43, 21◦ (NGC1333 SVS13-A).Left panels: The glycolaldehyde distribution refers to the sum of the 76,2-65,1 and 76,1-65,2
emission with (220.2 GHz,Eu = 37 K; see Tables A1-A4). First contours and steps correspondto 5σ (90, 90, 75, and 55 mJy beam−1 km s−1
respectively for NGC1333-IRAS2A1, NGC1333-IRAS4A, NGC1333-IRAS4B1, and NGC1333 SVS13-A) and 3σ, respectively.Right panels:The glycolaldehyde distribution refers to the 222,21-211,20 emission (232.3 GHz,Eu = 135 K; see Tables 2-5). First contours and steps correspondto 5σ (100, 110, 50, and 60 mJy beam−1 km s−1 respectively for NGC1333-IRAS2A1, NGC1333–IRAS4A, NGC1333-IRAS4B1, and NGC1333SVS13-A) and 3σ, respectively.
Article number, page 5 of 24

A&A proofs:manuscript no. desimone
50 100 150 200 250 300Eu /Kb (K)
22.5
23.5
24.5
25.5
26.5ln(N
a/ga)
N=46(20) 1014 cm−2
T=159(24) K
IRAS2A1 1.4mm
1.3mm
50 100 150 200 250 300 350Eu /Kb (K)
23
24
25
26
27
ln(N
a/ga)
N=88(70) 1014 cm−2T=236(74) K
IRAS4A2 1.4mm
1.3mm
50 100 150 200 250 300Eu /Kb (K)
23
24
25
26
ln(N
a/g
a)
N=15(9) 1014 cm−2
T=152(35) K
IRAS4B1 1.4mm
1.3mm
50 100 150 200 250 300 350Eu /Kb (K)
22
23
24
25
26
27
ln(N
a/g
a)
N=21(8) 1014 cm−2
T=115(13) K
SVS13-A 1.4mm
1.3mm
Fig. 3. Rotation diagram for the glycolaldehyde transitions reported in Table 2 for NGC1333-IRAS2A (Upper-left panel), NGC1333-IRAS4A2(Upper-right panel), NGC1333-IRAS4B1 (Lower-left panel), and NGC133-SVS13A (Lower-right panel). The line intensities have been correctedfor beam dilution using the sizes derived in Sect. 4.1. The parametersNup, gup, andEup are respectively the column density, the degeneracy, and theenergy of the upper level. The error bars on ln(Nup/gup) are given by the vertical bar of the symbols. Red and blue points refer to the lines detectedin the 1.3 mm and 1.4mm spectral bands, respectively. The dashed lines represent the best fits.
reported in Sect. 4.1),gup is the degeneracy of the upper level,Ntot is the total column density,Q(Trot) is the partition function,andEup is the upper level energy. Figure 3 shows the rotation di-agrams obtained using both the 1.3mm (red points) and 1.4mm(blue points) lines, while Table 2 reports the results, i.e.hightemperatures,Trot between 115 K and 236 K, andNtot ≃ 1–9×1015 cm−2. The present data image, for the first time, a hot corinoaround SVS13-A and NGC1333-IRAS4B1. These findings con-firm that the glycolaldehyde gas is present in the region witharadius less than 100 au where the temperature is high enoughto sublimate the dust mantles. Thus, either glycolaldehydeisdirectly released from mantle sublimation or formed throughgas-phase reactions using simpler species directly formedonthe mantles and successively evaporated due to thermal heat-ing. Note that the sources where we report a detection of gly-colaldehyde are those with the highest number of spectral linesof COMs (e.g. HCOOCH3) detected above 6σ in the 1.3mm and1.4mm WideX spectra of the CALYPSO subsample of Perseussources (Belloche et al., in preparation). In the case of IRAS2A1and IRAS4A2, the estimated rotational temperatures and col-umn densities are well in agreement (after applying correctly thebeam filling factor scaling) with what was previously reportedby Taquet et al. (2015) and Coutens et al. (2015) using differentdatasets on similar spatial scales, thus confirming the goodness
of the present line identification. On the other hand, the derivedNtot are lower than what Jørgensen et al. (2012, 2016) towardsthe IRAS16293-2422 binary (3–4× 1016 cm−2) found, in Ophi-uchus, on smaller (≤ 60 au) spatial scales. The sources where wereport a detection of glycolaldehyde are those with the highestnumber of spectral lines of complex organic molecules detectedabove 6 sigma in the 1.3 mm and 1.4 mm WIDEX spectra ofthe CALYPSO subsample of Perseus sources (Belloche et al., inprep.).
The rotation diagram solutions have been used to create syn-thetic spectra (see the red lines in Fig. 1 and Figs. A.1 to A.9)to strengthen the detection using the GILDAS–Weeds package(Maret et al. 2011). We assumed a background temperature of2.73 K. In principle, for sources with a strong continuum suchas NGC1333-IRAS4B1, the column density obtained using therotational diagram method can be underestimated, convertingthe measurement in a lower limit. The synthetic intensitiesarenot systematically over- or under-estimating the observedlines,confirming that the temperatures derived from the rotation dia-grams are good approximations. Note that all the detected linesare optically thin. However, even though the rotational diagramsshow reasonable agreement between measurements and the sin-gle temperature model, it is worth to point out here some short-comings of our models in reproducing the observed spectra.
Article number, page 6 of 24

De Simone et al.: Glycolaldehyde in Perseus young solar analogs
Source
13.0
13.5
14.0
14.5
15.0
15.5
16.0
log10(N
g/cm
−2)
IRAS2A
1
IRAS4A
2
IRAS4B
1
SVS13-A
IRAS2A
2
IRAS2A
3
IRAS4A
1
SVS13-B
L1448-2A
L1448-C
L1448-N
A
L1448-N
B
IRAS4B
2
Fig. 4. Distribution of the glycolaldehyde column density (Ntot) derivedtowards the selected sample (see Table 1). Red arrows are forupperlimits.
While we do not find large discrepancies, the spectral resolu-tion of our observations is relatively low and the spectra veryrich of emission lines (especially of the four sources wherewedo detect glycolaldehyde line). This implies that in some casesthe lines may be contamined by emission from other molecules.Figures A.1, A.3, A.5, and A.7 shows the lines selected for theanalysis. To be thorough, Figs. A.2, A.4, A.6, and A.8 show allthe lines excluded from the present analysis because, althoughthey are consistent with the observed spectrum, the blends withother species prevents a firm identification of the line. Notethat,in a few cases, our simple LTE model predicts higher fluxesthan observed; a special case is represented by the 202,18-193,17line at 220463 MHz observed towards NGC1333-IRAS4B1, -IRAS2A1, IRAS4A2, and -SVS13A (see Fig. A.9), and con-servatively excluded from the LTE analysis falling at the edgeof the observed WideX band. Beside this line, only in 2 cases(over a grand total of about 90 lines, counting also those notusedhere because of blending) the discrepancy reaches a factor 3: the221,21−212,20 line at∼ 232286 MHz in IRAS2A1 (see Fig. A.2),and the 95,5 − 84,4 line at∼ 217626 MHz in SVS13-A (see Fig.A.8). The difference is even less once considered both the errorsassociated with the LTE fit (see Table 2) and the errors on the ob-served line peak intensity. Indeed, for lines close to the detectionlimit the systematic discrepancy could be understood in terms ofthe noise fluctuations and the uncertainty of the continuum sub-traction in a region of the spectrum very rich of lines. We alsonote that deviations from the simplifying assumptions of singletemperature LTE, non thermal excitation and absorption maybethe cause of some of the discrepancies. Obtaining higher sen-sitivity and higher spectral and spatial resolution observationsover a broader frequency range, together with a full spectrummodeling, will help deriving more accurate estimates of thegasparameters. Nonetheless, eventually the intrinsic linewidth, thesource chemical complexity and richness of the spectra and thesource physical complexity will always limit the ability toaccu-rately identify and measure individual lines. Overall, oursimpleLTE analysis and comparison with the spectra show that, whilenot perfect, it is possible to estimate a temperature and columndensity representative of the bulk of the molecular emission.
4.3. HCOCH2OH occurrence around protostars
Figure 4 compares the column densities measured towards thefour sources detected in glycolaldehyde with the upper limits onNtot derived for the 9 objects in Perseus where glycolaldehydehas not been revealed. Assuming a typical temperature of 150K,a size of 0′′.4 (see Sect. 4.1), and considering the 3σ values ofthe spectra where no glycolaldehyde emission has been found,the typical upper limit is≤ 1015 cm−2, i.e. one order of magni-tude less than what found in IRAS2A1, IRAS4A2, IRAS4B1,and SVS13-A. These measurements support that these four pro-tostars show a significantly higher column density of glycolalde-hyde molecules in the gas phase. However, this may not reflectdirectly a difference in glycolaldehyde abundance.
To estimate the possible enhancement (or deficit) of gasphase glycolaldehyde abundance in the sources in our sampleweneed to compare with an estimate of the total gas column densityin each source. As a proxy for the total column density towardseach source we use the peak continuum flux at 1.4 mm. The mil-limetre continuum flux in these sources is dominated by the ther-mal emission from dust grains. The exact conversion of the mil-limeter flux into total gas column density depends on three veryuncertain factors: the dust properties (defining the dust opacityper gram of dust), the dust density and temperature structure,and the gas to dust ratio. Comparing the observed glycolalde-hyde column densities with the continuum peak flux will allowto search for systematic abundance variations in our sampleonlyunder the assumption that the sources in our sample have uni-form properties. While this is expected, since our sources are anhomogeneous set of protostars in the same star forming region,in the future this analysis will have to be refined using more ex-tensive observations and more accurate estimates of the total gascolumn density in each source.
Figure 5 shows the ratio between the glycolaldehyde columndensity,Ntot, and the continuum peak flux at 1.4 mm (F1.4mm,from Maury et al. in preparation) against the value of the 1.4mmpeak flux itself. As mentioned above, if we assume that themolecular hydrogen column density scales with the dust peakflux density, then the plot in Fig. 5 shows that the gas phaseabundance of glycolaldehyde relative to molecular hydrogen hasa spread of a factor of about 10 among the sources with glyco-laldehyde detections. Even if the non-detection of sourceswithF1.4mm less than 100 mJy might suggest that a detection requiresbright continuum emission, a bright continuum source is notnec-essarily associated with glycolaldehyde emission. A typical ex-ample is given by the IRAS4-A1+A2 system, where it is onlythe object showing weaker continuum emission that is detectedin glycolaldehyde (see Fig. 2). If we consider the sources withcontinuum peak flux above∼100 mJy/beam, then the averageratios for sources with detected glycolaldehyde are a factor of∼10 higher than the sources with upper limits. This suggests thatthe detected sources may have a significantly higher gas phaseabundance of glycolaldehyde compared with the non-detectedsources.
The glycolaldehyde detection indicates that the gas reacheda temperature of at least 100 K; at these high temperatures thegas is enriched chemically by the release of molecules directlyfrom the dust mantles and/or by the overcome of the activationbarrier of gas phase reactions using what was released from theicy dust mantles. It is reasonable to assume that the temperatureincreases with the source luminosity, which depends on the pro-tostellar mass and on the source accretion rate, which in turn isrelated to the evolutionary stage. However, only three sourceswhere glycolaldehyde has been detected can be associated with
Article number, page 7 of 24

A&A proofs:manuscript no. desimone
1.0 1.5 2.0 2.5 3.0
log10(F1.4mm/mJy)
11
12
13
14log 1
0(N
g/F1.4mm/cm−2/m
Jy)
IRAS2A1
SVS13-A
IRAS4A2
IRAS4B1
IRAS2A2
IRAS2A3
L1448-N
B
L1448-2A
L1448-C
SVS13-B
L1448-N
A
IRAS4A1
IRAS4B2
Fig. 5. Ratio between the glycolaldehyde column density (Ntot) and thepeak flux of the 1.4mm continuum emission (F1.4mm; Maury et al., inpreparation) versus the 1.4mm peak flux. Red arrows are for sourceswhere glycolaldehyde has not been detected.
a measurement of the internal luminosity hampering a reliablecheck for a trend (see Table 1). In addition, our 1.4mm fluxes donot allow us to derive a direct measurement of the protostellarmass. Trying to shed light on this aspect, we note that in the caseof the SVS13-A+B system, glycolaldehyde is only detected to-wards the more evolved SVS13-A source, withLint = 24.5 L⊙,whereas the younger object SVS13-B, withLint = 1–2L⊙. doesnot show evidence of an enriched chemistry. Therefore, at leastin this case, the lack of a detected hot-corino in SVS13-B sug-gests that the protostar had not enough time to warm a portionof gas large/bright enough to be detectable. Interestingly, San-tangelo et al. (2015), using the SiO and CO jet properties im-aged in IRAS4-A1+A2 system, proposed that the chemical rich-ness observed towards IRAS4-A2 (and not towards IRAS4-A1),is due to a later evolutionary stage, inferred from the jet prop-erties driven by the two objects. Nevertheless, it is clear that amore systematic comparative study of sources in different evo-lutionary phases is required to reach a firm conclusion: basedonly on a few sources (e.g. SVS13-A+B), it is very difficult totell whether the primary factor leading to the detection of glyco-laldehyde emission is evolution (e.g. low value ofLsubmm/Lint) oraccretion luminosity (highLint) or environment (e.g. NGC1333vs. L1448). These findings call for further analysis of the chem-ical content of the protostellar environments of the whole CA-LYPSO sample, using all the emission due to all the COMs andnot only to glycolaldehyde, which will be presented in a forth-coming paper (Belloche et al., in preparation).
5. Conclusions
We report a survey of glycolaldehyde emission towards a sampleof Class 0 protostars located in the L1448 and NGC1333 starforming regions, in Perseus. The analysis has been performed inthe framework of the IRAM PdBI CALYPSO survey. The mainfindings can be summarised as follows:
1. We found glycolaldehyde towards 3 Class 0 objects(NGC1333-IRAS2A1, NGC1333-IRAS4A2, NGC1333-IRA4B1) and 1 Class I source (SVS13-A). Once excludedthe continuum peaks whose nature is still debated, thisresults in a detection rate of∼ 36%. The NGC1333 star
forming region is particularly rich in glycolaldehyde, with adefinitely higher rate of occurrence: up to 60%.
2. The glycolaldehyde emission is compact and coincident withthe continuum peak of each detected source. The brightestlines indicate typical sizes of 0′′.4 showing that the glyco-laldehyde emission is tracing the inner 100 au around theprotostar. We detected a large (up to 18) number of lines,covering a large range of upper-level energy, withEu from37 K up to 375 K, and indicating high temperatures,Trotbetween 100 K and 200 K. We confirm and extend ear-lier results towards IRAS2A1 and IRAS4A2, and reveal forthe first time the presence of hot corinos around NGC1333-IRAS4B1 and SVS13-A. The total column densities of gly-colaldehyde in the detected sources are≃ 1–9× 1015 cm−2.
3. We suggest that the four hot corinos imaged in glycolalde-hyde in NGC1333 are associated with a significantly highergas phase abundance of glycolaldehyde with respect to therest of the sample. The SVS13-A+B and IRAS4-A1+A2 sys-tems suggest that the detection of glycolaldehyde emissionisdue to the source evolution: the chemical richness highlightsthose protostars evolved enough to warm a bright region of∼100 au at temperatures larger than 100 K. However, thepresent sample does not allow us to reach a firm conclusionwhether the glycolaldehyde detection is always a question ofevolution or accretion luminosity and/or if it depends on theenvironment hosting the protostars.
Our initial results can be confirmed and extended with moresensitive observations of a larger sample of objects. In particular,more accurate determinations of the possible variations ofgly-colaldehyde abundance in gas phase will be a powerful probe ofthe chemical evolution of protostars and may confirm the presentresults.
Acknowledgements. We are very grateful to all the IRAM staff, whose dedicationallowed us to carry out the CALYPSO project. This work was partly supportedby the PRIN INAF 2012 – JEDI and by the Italian Ministero dell’Istruzione,Università e Ricerca through the grant Progetti Premiali 2012 – iALMA (CUPC52I13000140001). AM is supported by the MagneticYSOs, grant agreementn.679937. CC, LT, and AM have been partially supported by theGothenburgCentre for Advanced Studies in Science and Technology as part of the Go-CAS programOrigins of Habitable Planets. The research leading to these resultshas received funding from the European Community’s SeventhFramework Pro-gramme (FP7/2007-2013/) under grant agreements No 229517 (ESO COFUND)and No 291294 (ERC ORISTARS), and from the French Agence Nationale de laRecherche (ANR), under reference ANR-12-JS05-0005.
References[2016] Anderl S., Maret S., Cabrit S., et al. 2016, A&A 591, A3[1993] André P., Ward-Thompson D., & Barsony M. 1993, ApJ, 406, 122[2000] André P., Ward-Thompson D., & Barsony M. 2000, Protostars and Planets
IV, 59[2010] André P., Men’shchikov A., Bontemps S., et al. 2010, A&A, 518, L102[1998] Bachiller R., Guilloteau S., Gueth F., et al. 1998, A&A 339, L49[2009] Beltrán M.T., Codella C., Viti, S., Neri R., & Cesaroni R. 2009, ApJ 690,
L93[2001] Butler R.A.H., De Lucia F.C., Petkie D.T., et al. 2001, ApJS 134, 319[2014] Calcutt H., Viti S., Codella C., et al. 2014, MNRAS 443, 3157[2010] Carroll P.B., Drouin B.J., & Widicus Weaver S.L. 2010, ApJ 723, 845[2007] Ceccarelli C., Caselli P., Herbst E., Tielens A.G.G.M., $ Caux E. 2007 Pro-
tostars and Planets V, 47[2009] Chen X., Launhardt R., & Henning T. 2009, ApJ 691, 1729[2011] Choi M., Kang M., Tatematsu K., Lee, J.-E., & Park G. 2011, PASP 63,
1281[2009] Codella C., Benedettini M., Beltrán, M. T., et al. 2009, A&A 507, L25[2014] Codella C., Maury A., Gueth F., et al. 2014, A&A 563, L3[2015] Coutens A., Persson M.V., Jørgensen J.K., Wampfler S.F., & Lykke J.M.
2015, A&A 576, A5[2008] Dunham M.M., Crapsi A., Evans II N.J., et al. 2008, ApJS 179, 249
Article number, page 8 of 24

De Simone et al.: Glycolaldehyde in Perseus young solar analogs
[2006] Halfen D.T., Apponi A.J., Woolf N., Polt R., & Ziurys L.M. 2006, ApJ 639,237
[2009] Herbst E., & van Dishoeck E.F. 2009, ARA&A 47, 427[2008] Hirota T., Bushimata T., Choi Y.K., et al. 2008, PASJ 60, 37[2011] Hirota T., Honma N., Imai H., et al. 2011, PASJ 63, 1[2000] Hollis, J.M., Lovas F.J., & Jewell P.R. 2000, ApJ 540,L107[2004] Hollis J.M., Jewell P.R., Lovas F.J., & Remijan A. 2004, ApJ 613, L45[2007] Jalbout A.F., Abrell L., & Adamowicz L., et al. 2007, Astrobiology 7, 433[2012] Jørgensen J.K., Favre C., Bisschop S.E., et al. 2012,ApJ 757, L4[2016] Jørgensen J.K., van der Wiel M.H.D., Coutens A., et al. 2016, A&A 595,
A117[1987] Lada C.J. 1987, in IAU Symposium, Vol. 115, Star Forming Regions, ed.
M.Peimbert & J.Jugaku, 1-17[1998] Lefloch B., Castets A., Cernicharo J., Langer W.D., & Zylka R. 1998, A&A
334, 269[2000] Looney L.W., Mundy L.G., & Welch W.J. 2000, ApJ 529, L477[2011] Maret S., Hily-Blant P., Pety J., Bardeau, S., & Reynier E. 2011, A&A 526,
47[1970] Marstokk K.-M. & Møllendal H. 1970, Journal of Molecular Structure, 5,
205[1973] Marstokk K.-M. & Møllendal H. 1970, Journal of Molecular Structure, 16,
259[2014] Maury A.J., Belloche A., André Ph., et al. 2014, A&A 563, L2[1998] Pickett H.M., Poynter R.L., Cohen E.A., et al. 1998, J. Quant. Spectrosc. &
Rad. Transfer 60, 883[2008] Requena-Torres M.A., Martín-Pintado J., Martín S.,& Morris M.R. 2008,
ApJ 672, 352[2014] Sakai N., Sakai T., Hirota T., et al. 2014, Nature 507,78[2015] Santangelo G., Codella C., Cabrit S., et al. 2015, A&A584, 216[2015] Taquet V., López-Sepulcre A., Ceccarelli C., et al. 2015, ApJ 804, 81[2016] Tobin J.J., Looney L.W., Li Z.-Y., et al. 2016, ApJ 818, 73[1998] Weber A.L., 1998, Origins of Life and Evolution of theBiosphere, 28, 259[2005] Widicus Weaver S.L., Butler R.A.H., Drouin B.J., et al. 2005, ApJS 158,
188
Article number, page 9 of 24
A&A proofs:manuscript no. desimone
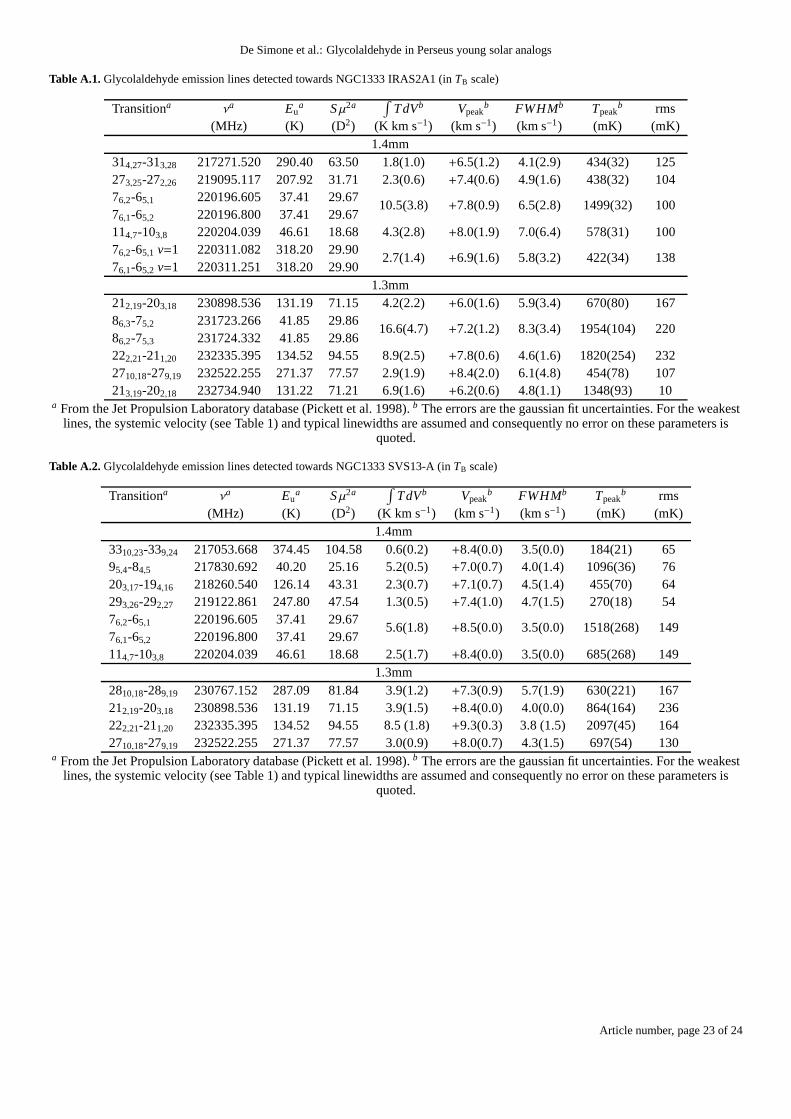
Appendix A: Observed HCOCH2OH emission lines
Tables A.1 to A.4 report, for the 4 sources where glycolaldehydeemission has been detected (IRAS2A, SVS13-A, IRAS4A2, andIRAS4B), the results of the Gaussian fit for all the detected lines.In particular, we first list the spectral parameters (frequency,ν,upper level energy,Eu, and theS µ2 product, all taken from theJet Propulsion Laboratory database; Pickett et al. 1998), fol-lowed by the line parameters (inTMB scale), namely: the inte-grated emission (
∫Tdv), both peak line velocities (Vpeak) and
intensities (Tpeak), linewidth (FWHM), and r.m.s. noise. FiguresA.1, A.3, A.5, and A.7 show the lines detected and used for theanalysis, Figs. A.2, A.4, A.6, and A.8 show the lines excludedfrom the analysis given the severe blending with other emissionlines, while Fig. A.9 is for a line which has not been used be-cause it is located at the edge of the WideX bandwidth.
Article number, page 10 of 24

De Simone et al.: Glycolaldehyde in Perseus young solar analogs
Fig. A.1. Glycolaldehyde emission lines (inTB scale) detected in the 1.3mm and 1.4mm spectral windows towards NGC1333-IRAS2A1 and usedto perform the LTE analysis. The horizontal green dotted lines show the 3σ level. In blue we mark the glycolaldehyde lines extracted from TableA.1. The red line shows the synthetic spectrum obtained withthe GILDAS–Weeds package (Maret et al. 2011) and assuming the rotation diagramsolutions (see Fig. 3).
Article number, page 11 of 24

A&A proofs:manuscript no. desimone
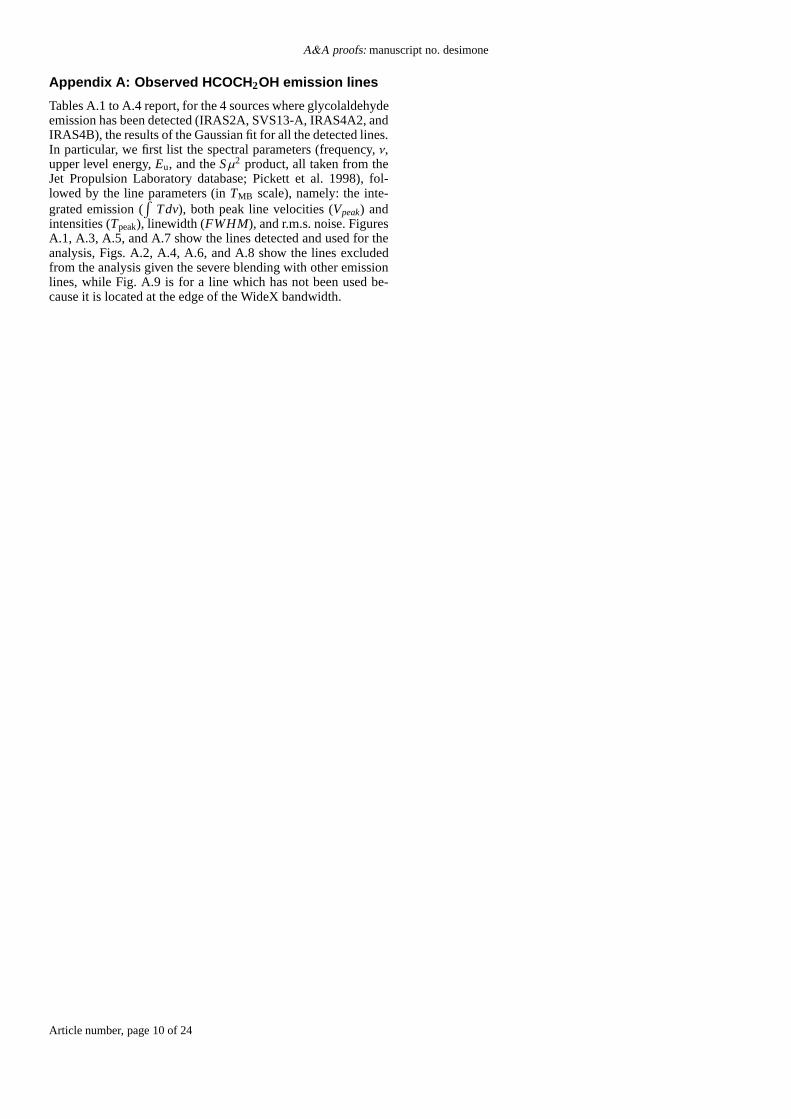
Fig. A.2. Glycolaldehyde emission lines (inTB scale) observed in the 1.3mm and 1.4mm spectral windows towards NGC1333-IRAS2A1 andexcluded from the LTE analysis because of severe blending with other emission lines. The horizontal green dotted lines show the 3σ level. In bluewe mark the glycolaldehyde transitions. The red line shows the synthetic spectrum obtained with the GILDAS–Weeds package (Maret et al. 2011)and assuming the rotation diagram solutions (see Fig. 3).
Article number, page 12 of 24
De Simone et al.: Glycolaldehyde in Perseus young solar analogs
Fig. A.2. Continued.
Article number, page 13 of 24

A&A proofs:manuscript no. desimone
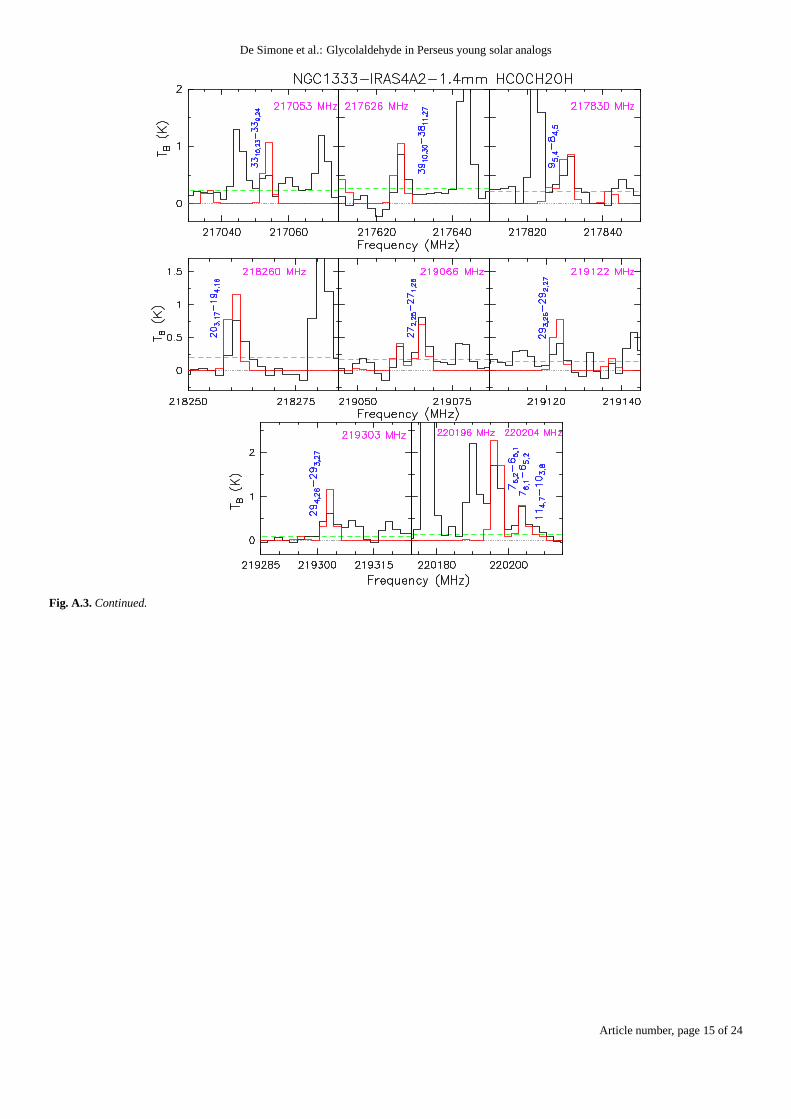
Fig. A.3. Glycolaldehyde emission lines (inTB scale) detected in the 1.3mm and 1.4mm spectral windows towards NGC1333-IRAS4A2 and usedto perform the LTE analysis. The horizontal green dotted lines show the 3σ level. In blue we mark the glycolaldehyde lines extracted from TableA.2. The red line shows the synthetic spectrum obtained withthe GILDAS–Weeds package (Maret et al. 2011) and assuming the rotation diagramsolutions (see Fig. 3).
Article number, page 14 of 24
De Simone et al.: Glycolaldehyde in Perseus young solar analogs
Fig. A.3. Continued.
Article number, page 15 of 24

A&A proofs:manuscript no. desimone
Fig. A.4. Glycolaldehyde emission lines (inTB scale) observed in the 1.3mm and 1.4mm spectral windows towards NGC1333-IRAS4A2 andexcluded from the LTE analysis because of severe blending with other emission lines. The horizontal green dotted lines show the 3σ level. In bluewe mark the glycolaldehyde transitions. The red line shows the synthetic spectrum obtained with the GILDAS–Weeds package (Maret et al. 2011)and assuming the rotation diagram solutions (see Fig. 3).
Article number, page 16 of 24

De Simone et al.: Glycolaldehyde in Perseus young solar analogs
Fig. A.5. Glycolaldehyde emission lines (inTB scale) detected in the 1.3mm and 1.4mm spectral windows towards NGC1333-IRAS4B1 and usedto perform the LTE analysis. The horizontal green dotted lines show the 3σ level. In blue we mark the glycolaldehyde lines extracted from TableA.3. The red line shows the synthetic spectrum obtained withthe GILDAS–Weeds package (Maret et al. 2011) and assuming the rotation diagramsolutions (see Fig. 3).
Article number, page 17 of 24

A&A proofs:manuscript no. desimone
Fig. A.6. Glycolaldehyde emission lines (inTB scale) observed in the 1.3mm and 1.4mm spectral windows towards NGC1333-IRAS4B1 andexcluded from the LTE analysis because of severe blending with other emission lines. The horizontal green dotted lines show the 3σ level. In bluewe mark the glycolaldehyde transitions. The red line shows the synthetic spectrum obtained with the GILDAS–Weeds package (Maret et al. 2011)and assuming the rotation diagram solutions (see Fig. 3).Article number, page 18 of 24

De Simone et al.: Glycolaldehyde in Perseus young solar analogs
Fig. A.6. Continued.
Article number, page 19 of 24
A&A proofs:manuscript no. desimone
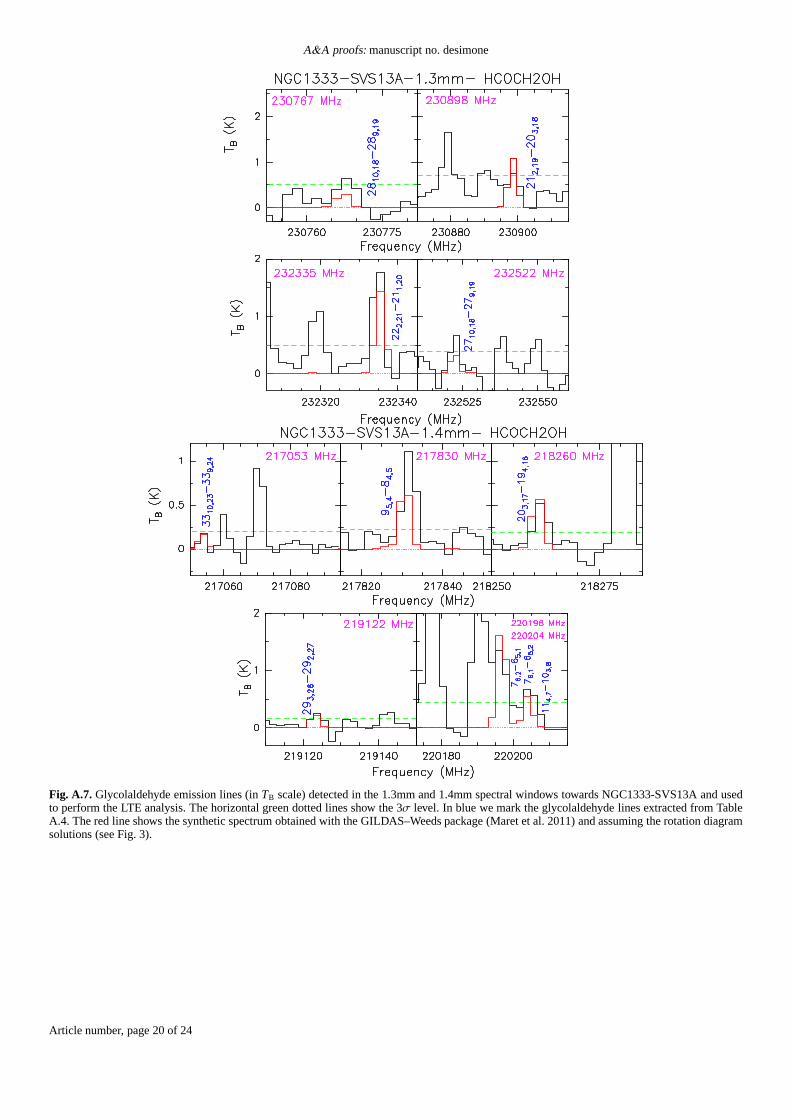
Fig. A.7. Glycolaldehyde emission lines (inTB scale) detected in the 1.3mm and 1.4mm spectral windows towards NGC1333-SVS13A and usedto perform the LTE analysis. The horizontal green dotted lines show the 3σ level. In blue we mark the glycolaldehyde lines extracted from TableA.4. The red line shows the synthetic spectrum obtained withthe GILDAS–Weeds package (Maret et al. 2011) and assuming the rotation diagramsolutions (see Fig. 3).
Article number, page 20 of 24

De Simone et al.: Glycolaldehyde in Perseus young solar analogs
Fig. A.8. Glycolaldehyde emission lines (inTB scale) observed in the 1.3mm and 1.4mm spectral windows towards NGC1333-SVS13A andexcluded from the LTE analysis because of severe blending with other emission lines. The horizontal green dotted lines show the 3σ level. In bluewe mark the glycolaldehyde transitions. The red line shows the synthetic spectrum obtained with the GILDAS–Weeds package (Maret et al. 2011)and assuming the rotation diagram solutions (see Fig. 3).
Article number, page 21 of 24

A&A proofs:manuscript no. desimone
Fig. A.8. Continued.
Fig. A.9. Glycolaldehyde 202,18-193,17 emission lines (inTB scale) observed at 220463 MHz towards NGC1333-IRAS4B1, -IRAS2A1, IRAS4A2,and -SVS13A, and conservatively excluded from the LTE analysis falling at the edge of the observed WideX band. The horizontal green dotted linesshow the 3σ level. In blue we mark the glycolaldehyde transitions. The red line shows the synthetic spectrum obtained with the GILDAS–Weedspackage (Maret et al. 2011) and assuming the rotation diagram solutions (see Fig. 3).
Article number, page 22 of 24
De Simone et al.: Glycolaldehyde in Perseus young solar analogs
Table A.1. Glycolaldehyde emission lines detected towards NGC1333 IRAS2A1 (in TB scale)
Transitiona νa Eua S µ2a
∫TdVb Vpeak
b FWHMb Tpeakb rms
(MHz) (K) (D2) (K km s−1) (km s−1) (km s−1) (mK) (mK)1.4mm
314,27-313,28 217271.520 290.40 63.50 1.8(1.0) +6.5(1.2) 4.1(2.9) 434(32) 125273,25-272,26 219095.117 207.92 31.71 2.3(0.6) +7.4(0.6) 4.9(1.6) 438(32) 10476,2-65,1 220196.605 37.41 29.67
10.5(3.8) +7.8(0.9) 6.5(2.8) 1499(32) 10076,1-65,2 220196.800 37.41 29.67114,7-103,8 220204.039 46.61 18.68 4.3(2.8) +8.0(1.9) 7.0(6.4) 578(31) 10076,2-65,1 v=1 220311.082 318.20 29.90
2.7(1.4) +6.9(1.6) 5.8(3.2) 422(34) 13876,1-65,2 v=1 220311.251 318.20 29.90
1.3mm212,19-203,18 230898.536 131.19 71.15 4.2(2.2) +6.0(1.6) 5.9(3.4) 670(80) 16786,3-75,2 231723.266 41.85 29.86
16.6(4.7) +7.2(1.2) 8.3(3.4) 1954(104) 22086,2-75,3 231724.332 41.85 29.86222,21-211,20 232335.395 134.52 94.55 8.9(2.5) +7.8(0.6) 4.6(1.6) 1820(254) 2322710,18-279,19 232522.255 271.37 77.57 2.9(1.9) +8.4(2.0) 6.1(4.8) 454(78) 107213,19-202,18 232734.940 131.22 71.21 6.9(1.6) +6.2(0.6) 4.8(1.1) 1348(93) 10
a From the Jet Propulsion Laboratory database (Pickett et al.1998).b The errors are the gaussian fit uncertainties. For the weakestlines, the systemic velocity (see Table 1) and typical linewidths are assumed and consequently no error on these parameters is
quoted.
Table A.2. Glycolaldehyde emission lines detected towards NGC1333 SVS13-A (inTB scale)
Transitiona νa Eua S µ2a
∫TdVb Vpeak
b FWHMb Tpeakb rms
(MHz) (K) (D2) (K km s−1) (km s−1) (km s−1) (mK) (mK)1.4mm
3310,23-339,24 217053.668 374.45 104.58 0.6(0.2) +8.4(0.0) 3.5(0.0) 184(21) 6595,4-84,5 217830.692 40.20 25.16 5.2(0.5) +7.0(0.7) 4.0(1.4) 1096(36) 76203,17-194,16 218260.540 126.14 43.31 2.3(0.7) +7.1(0.7) 4.5(1.4) 455(70) 64293,26-292,27 219122.861 247.80 47.54 1.3(0.5) +7.4(1.0) 4.7(1.5) 270(18) 5476,2-65,1 220196.605 37.41 29.67
5.6(1.8) +8.5(0.0) 3.5(0.0) 1518(268) 14976,1-65,2 220196.800 37.41 29.67114,7-103,8 220204.039 46.61 18.68 2.5(1.7) +8.4(0.0) 3.5(0.0) 685(268) 149
1.3mm2810,18-289,19 230767.152 287.09 81.84 3.9(1.2) +7.3(0.9) 5.7(1.9) 630(221) 167212,19-203,18 230898.536 131.19 71.15 3.9(1.5) +8.4(0.0) 4.0(0.0) 864(164) 236222,21-211,20 232335.395 134.52 94.55 8.5 (1.8) +9.3(0.3) 3.8 (1.5) 2097(45) 1642710,18-279,19 232522.255 271.37 77.57 3.0(0.9) +8.0(0.7) 4.3(1.5) 697(54) 130
a From the Jet Propulsion Laboratory database (Pickett et al.1998).b The errors are the gaussian fit uncertainties. For the weakestlines, the systemic velocity (see Table 1) and typical linewidths are assumed and consequently no error on these parameters is
quoted.
Article number, page 23 of 24

A&A proofs:manuscript no. desimone
Table A.3. Glycolaldehyde emission lines detected towards NGC1333 IRAS4A2 (in TB scale)
Transitiona νa Eua S µ2a
∫TdVb Vpeak
b FWHMb Tpeakb rms
(MHz) (K) (D2) (K km s−1) (km s−1) (km s−1) (mK) (mK)1.4mm
3310,23-339,24 217053.668 374.45 104.58 2.6(1.6) +7.0(0.0) 3.5(0.0) 701(61) 803910,30-3811,27 217626.061 40.20 25.19 4.2(1.1) +5.9(0.6) 4.5(1.3) 876(20) 9095,4-84,5 217830.692 40.20 25.16 5.9(1.6) +5.7(1.0) 7.7(2.8) 699(67) 70203,17-194,16 218260.540 126.14 43.31 4.7(0.8) +4.7(0.5) 5.7(1.2) 784(58) 69272,25-271,26 219066.914 207.91 31.72 4.3(1.8) +5.4(0.9) 5.2(3.0) 778(78) 60293,26-292,27 219122.861 247.80 47.54 2.4(1.2) +6.2(1.2) 5.4(3.0) 404(63) 49294,26-293,27 219303.367 247.81 47.54 2.8(0.8) +7.0(0.0) 3.5(0.0) 777(23) 2676,2-65,1 220196.605 37.41 29.67
7.4(1.9) +7.0(0.0) 3.5(0.0) 1969(256) 4976,1-65,2 220196.800 37.41 29.67114,7-103,8 220204.039 46.61 18.68 3.2(1.9) +7.0(0.0) 3.5(0.0) 885(256) 49
1.3mm105,5-94,6 229329.580 45.76 25.44 3.6(1.2) +7.0(0.0) 3.5(0.0) 957(199) 120164,13-153,12 230703.712 85.68 27.38 4.6(2.9) +6.7(1.5) 3.8(2.2) 1102(197) 1802810,18-289,19 230767.152 287.09 81.84 3.1(1.2) +7.0(0.0) 3.5(0.0) 866(149) 200212,19-203,18 230898.536 131.19 71.15 6.9(2.3) +7.0(0.0) 3.5(0.0) 1887(133) 181213,18-204,17 232261.725 137.84 49.86 8.6(3.6) +6.1(0.9) 3.9(2.0) 2021(310) 160221,21-212,20 232286.032 134.52 94.55 12.8(3.7)+5.9(0.6) 3.9(1.3) 3031(31) 150222,21-211,20 232335.395 134.52 94.55 21.9(2.6)+7.2(0.3) 3.7(0.7) 5592(23) 2112710,18-279,19 232522.255 271.37 77.57 9.4(2.2) +7.4(0.5) 4.7(1.3) 1861(62) 124
a From the Jet Propulsion Laboratory database (Pickett et al.1998).b The errors are the gaussian fit uncertainties. For the weakestlines, the systemic velocity (see Table 1) and typical linewidths are assumed and consequently no error on these parameters is
quoted.
Table A.4. Glycolaldehyde emission lines detected towards NGC1333 IRAS4B1 (inTB scale)
Transitiona νa Eua S µ2a
∫TdVb Vpeak
b FWHMb Tpeakb rms
(MHz) (K) (D2) (K km s−1) (km s−1) (km s−1) (mK) (mK)1.4mm
95,4-84,5 217830.692 40.20 25.16 1.8(0.5) +7.0(0.0) 3.5(0.0) 485(23) 51293,26-292,27 219122.861 247.80 47.54 1.0(0.5) +6.2(1.2) 4.2(1.9) 226(7) 28134,10-123,9 219230.248 60.52 21.81 1.6(0.6) +7.4(0.8) 3.5(0.0) 366(17) 34294,26-293,27 219303.367 247.81 47.54 0.9(0.4) +7.0(0.0) 3.5(0.0) 253(23) 9076,2-65,1 220196.605 37.41 29.67
2.5(0.5) +8.3(0.5) 3.7(0.8) 643(101) 10176,1-65,2 220196.800 37.41 29.67114,7-103,8 220204.039 46.61 18.68 1.3(0.6) +7.8(1.0) 4.6(2.2) 251(101) 101
1.3mm105,5-94,6 229329.580 45.76 25.44 3.7(0.9) +6.2(0.8) 5.2(1.6) 638(65) 102164,13-153,12 230703.712 85.68 27.38 3.4(1.8) +6.1(1.4) 5.2(2.8) 631(56) 206212,19-203,18 230898.536 131.19 71.15 2.2(0.9) +6.2(0.9) 3.7(1.5) 551(25) 127221,21-212,20 232286.032 134.52 94.55 2.9(0.9) +7.0(0.0) 3.5(0.0) 699(124) 124222,21-211,20 232335.395 134.52 94.55 4.0(0.9) +7.0(0.0) 3.5(0.0) 932(164) 1482710,18-279,19 232522.255 271.37 77.57 1.8(0.9) +8.3(1.4) 4.5(2.8) 387(108) 108
a From the Jet Propulsion Laboratory database (Pickett et al.1998).b The errors are the gaussian fit uncertainties. For the weakestlines, the systemic velocity (see Table 1) and typical linewidths are assumed and consequently no error on these parameters is
quoted.
Article number, page 24 of 24