Embed Size (px)
Citation preview

ORIGINAL RESEARCH
Glucagon-Like Peptide-1 Receptor Agonist TreatmentPatterns Among Type 2 Diabetes Patients in SixEuropean Countries
Victoria Divino • Mitch DeKoven • Shawn Hallinan • Nebibe Varol •
Sara Bruce Wirta • Won Chan Lee • Matthew Reaney
To view enhanced content go to www.diabetestherapy-open.comReceived: August 29, 2014 / Published online: November 4, 2014� The Author(s) 2014. This article is published with open access at Springerlink.com
ABSTRACT
Introduction: The objective of this study was to
evaluate real-world treatment patterns of type 2
diabetes (T2D) patients initiating glucagon-like
peptide-1 receptor agonists (GLP-1 RAs) in
Germany (GE), the United Kingdom (UK),
France (FR), the Netherlands (NE), Belgium
(BE), and Sweden (SE).
Methods: Adult T2D patients initiating
exenatide twice daily (exBID), liraglutide once
daily (LIRA) or exenatide once weekly (exQW)
were identified using the IMS LifeLinkTM (IMS
Health, Danbury, CT, USA): Electronic Medical
Records (EMR; GE/UK/FR) and IMS LifeLinkTM:
longitudinal prescriptions (LRx; NE/BE/GE/UK)
databases, and national health register data (SE),
between 2010 and 2012. Therapy initiation date
was termed ‘index date’. Eligible patients had
C180-day pre- and variable follow-up
(minimum C360-day post-index exBID and
LIRA, C180-day post-index exQW). Treatment
modification and persistence were evaluated
over 180 days. Kaplan–Meier (KM) survival
curves and Cox proportional hazards models
(PHMs; EMR databases only) evaluated stopping
of the index therapy (measured as first of
discontinuation or switch).
Results: 30,206 exBID, 5,401 exQW, and
52,155 LIRA patients were included in the
analysis (46.0–66.9% male; mean age range
55.4–59.3 years). Mean follow-up was
20.3–27.4 months for exBID and LIRA, and
7.6–13.9 months for exQW. Across the
databases, the proportion experiencing a
treatment modification at 180 days was
highest among exBID (37.6–81.7%) compared
to LIRA (36.8–56.6%) and exQW (32.3–47.7%).
The proportion persistent at 180 days was
lowest among exBID patients (46.8–73.5%)
Electronic supplementary material The onlineversion of this article (doi:10.1007/s13300-014-0087-6)contains supplementary material, which is available toauthorized users.
V. Divino (&) � M. DeKoven � S. Hallinan �W. C. LeeHealth Economics and Outcomes ResearchReal-World Evidence Solutions, IMS Health,Fairfax, VA, USAe-mail: [email protected]
N. Varol � M. ReaneyGlobal Patient Outcomes and Real World Evidence,Eli Lilly and Co, Surrey, UK
S. B. WirtaHealth Economics and Outcomes ResearchReal-World Evidence Solutions, IMS Health,Stockholm, Sweden
Diabetes Ther (2014) 5:499–520
DOI 10.1007/s13300-014-0087-6

compared to LIRA (50.6–80.1%) or exQW
(57.5–74.6%). In the KM analyses, LIRA
patients had a lower proportion stopping
therapy at all time points compared to exBID
patients, across the databases. In the Cox PHMs,
LIRA was associated with a significantly lower
risk of stopping compared to exBID; in GE,
exQW was associated with a lower risk
compared to exBID and LIRA.
Conclusion: Treatment patterns varied among
GLP-1 RA patients, with persistence highest
among either LIRA or exQW across countries,
and lowest among exBID. Longer-term data
would be useful, particularly given limited
exQW follow-up due to more recent launch.
Keywords: Databases; Diabetes mellitus;
Exenatide BID; Exenatide QW; Glucagon-like
peptide 1; Liraglutide; Retrospective studies;
Treatment outcome; Type 2/drug therapy
INTRODUCTION
The International Diabetes Federation estimates
that there are 56.3 million adults with diabetes,
representing 8.5% of European adults [1]. Type
2 diabetes (T2D) constitutes 85–95% of all
diabetes, and the incidence/prevalence
continues to increase due in part to obesity,
physical inactivity, and poor diet. This has
substantial cost implications to healthcare
systems and society [1]. Upon diagnosis of
T2D, patients are often required to engage in
healthy eating, weight control, and increased
physical activity to improve glycemic
sensitivity/control [2]. However, most patients
will require drug therapy, with metformin
monotherapy generally preferred as initial
pharmacological treatment. Over time,
combination therapy is needed, with the
American Diabetes Association (ADA)/
European Association for the Study of Diabetes
(EASD) recommending one of five treatment
classes combined with metformin: a
sulfonylurea, thiazolidinediones (TZD),
dipeptidyl peptidase-4 (DPP-4) inhibitor, basal
insulin or a glucagon-like peptide-1 receptor
agonist (GLP-1 RA) [2].
GLP-1 RAs mimic endogenous GLP-1,
stimulating insulin release from the pancreas
and suppressing glucagon secretion [2]. GLP-1
RAs are associated with high glycemic efficacy,
weight loss and low risk of hypoglycemia, but
with some risk of gastrointestinal side effects.
While concerns of an association with
pancreatic disease exist, the US Food and Drug
Administration (FDA) and European Medicines
Agency (EMA) have agreed that a causal
association is inconsistent with the current
data [3]. There are five EMA approved GLP-1
RAs: exenatide twice daily (exBID; Byetta�,
AstraZeneca; approved in 2006), liraglutide
once daily (LIRA; QD; Victoza�, Novo Nordisk;
approved in 2009), exenatide once weekly
(exQW; Bydureon�, AstraZeneca; approved in
2011), lixisenatide once daily (Lyxumia�,
Sanofi; approved in 2013), and albiglutide
once weekly (EperzanTM, GlaxoSmithKline;
approved in 2014). In addition, the
Committee for Medicinal Products for Human
Use (CHMP) has recently adopted a positive
opinion and recommended the granting of a
marketing authorization for dulaglutide once
weekly (TrulicityTM, Eli Lilly).
Daily doses, injection frequencies and
injection time related to meals of current GLP-
1 RA therapies are variable. For example, the
initial dose of exBID is 5 lg injected under the
skin (subcutaneously) twice daily, 60 min
before two major meals with at least 6 h in
between. The dose can be increased to 10 lg
twice daily after 1 month of therapy [4]. LIRA is
administered once daily independent of meals
500 Diabetes Ther (2014) 5:499–520

and should be initiated with a dose of 0.6 mg
once daily for the first week, followed by a dose
increase to 1.2 mg once daily [5]. If the 1.2 mg
dose does not result in acceptable glycemic
control, the dose may be increased to 1.8 mg
after at least 1 week, although the EMA [6] and
the National Institute for Health and Care
Excellence (NICE) [7] state that the available
evidence suggests only marginal benefit of this
escalation on glycemic control. ExQW is
administered once per week independent of
meals at a dose of 2.0 mg [8]. While the ADA/
EASD recommend GLP-1 RA therapy in second-
or third-line therapy [2], some European Union
(EU) health care authorities, including the
United Kingdom (UK) [7], the Netherlands
(NE) [9], Sweden (SE) [10], and Belgium (BE)
[11], generally recommend GLP-1 RAs as a
third-line therapy, often restricted to certain
populations (obese, intolerant to other
therapies, etc.).
Only a few studies have compared treatment
patterns or variable dosing between exBID and
LIRA [12–14]. Little is known about treatment
patterns among GLP-1 RA therapy users in the
real-world setting, particularly for exQW, or
average patient dosing given variability in
dosing for exBID and LIRA. The primary
objective of this analysis was to evaluate
treatment patterns among T2D GLP-1 RA
therapy initiators, specifically persistence with
the index therapy and treatment modification
[discontinuation, switch, stop (a composite
outcome of either discontinuation or switch)
or augmentation]. Secondary objectives
included evaluating average daily dose (ADD)
of the therapy and the patient characteristics
associated with risk of stopping therapy. These
outcomes were evaluated using available
databases containing prescription data in
Germany (GE), the UK, France (FR), NE, BE,
and SE. When this study was conducted, exBID,
exQW, and LIRA were the only approved GLP-1
RAs; therefore, these therapies comprise the
cohorts of this study.
METHODS
A retrospective cohort analysis was conducted
using eight databases in six European countries
(GE, the UK, FR, NE, BE, and SE). This study
involved a retrospective cohort analysis using
eight databases, and the analysis does not
contain studies with human or animal subjects
performed by any of the authors. Research
ethics approval was received from the regional
Ethics Review Board in Stockholm in order to
conduct the Swedish analysis. Ethics approval
was not required in the other countries.
Data Sources
Electronic Medical Records
The IMS LifeLinkTM (IMS Health, Danbury, CT,
USA): Electronic Medical Records databases
(henceforth referred to as EMR) were used in
GE, the UK, and FR. EMR contains longitudinal
anonymized patient-level data from the EMRs
of office-based physician practices [general
practitioners (GPs) in the UK/FR, GPs/
diabetologists in GE]. Data include basic
demographics, physician-recorded medical
diagnoses [International Statistical
Classification of Diseases (ICD) ICD-10 format]
and written prescriptions [EphMRA Anatomical
Classification (ATC) code]. EMR covers
approximately 18.9%, 6.7%, and 7.6% of the
GE, UK, and FR populations, respectively.
Retail Pharmacy
The IMS LifeLinkTM: Longitudinal Prescriptions
databases (henceforth referred to as LRx) were
used in the NE, BE, the UK (GPs only; limited to
Diabetes Ther (2014) 5:499–520 501

aggregated data analysis due to privacy
legislation), and GE. LRx contains prescription
data (EphMRA ATC code) and limited
demographic data [e.g., age (unavailable in BE;
age bands only in the UK), gender]. The
representativeness of the databases based upon
current population and pharmacy coverage in
2013 is: 72% NE, 32% BE, 51% GE, and 44% UK.
Both EMR and LRx databases were utilized in
GE and UK as they provide somewhat different
samples: physician-recorded pharmacy and
clinical data vs. filled pharmacy prescription
data. Overlap in the populations from the two
databases is possible.
Sweden
The Swedish national drug register was utilized,
which provides national, patient-level data on
all prescription drugs dispensed at all
pharmacies from the Swedish National
Pharmacy Corporation (World Health
Organization [WHO] ATC code). In addition,
the Swedish Mortality Register was used to
identify patient death and provide full
visibility into patient follow-up. Research
ethics approval was received from the regional
Ethics Review Board in Stockholm.
Patient Selection
Patients were first identified based on a
prescription for the therapy of interest (exBID,
exQW, or LIRA) within the selection window
(Table 1), which varied by country and was
adjusted for exQW given its more recent launch
(June 2011). The first prescription for a therapy
of interest within the selection window was
termed the ‘index therapy’ and the date was
termed the ‘index date’. Patients were followed
through the end of continuous eligibility (CE;
i.e., visibility) or study end date, whichever
occurred first.
Adult patients (C18 years on the index date)
were identified as eligible if they met the
following inclusion/exclusion criteria: (1)
evidence of T2D [no evidence of type 1
diabetes (T1D); see Table 1 for database-specific
criteria], (2) C180-day CE pre-index, (3) C360-
day CE post-index (C180-day post-index for
exQW patients only) within the database (see
Table 1 for database-specific CE criteria), (4)
naıve to the initiated therapy class with no
prescription for any GLP-1 RA (EphMRA ATC
A10S0; WHO ATC A10BX04/A10BX07) in the
180-day pre-index period, (5) not initiating any
other injectable antihyperglycemic therapy
(GLP-1 RA or insulin) on the index date other
than the index therapy; and (6) non-missing
age or gender required (age unavailable in BE
LRx).
Measures and Analysis
Baseline demographic (age and gender where
available) characteristics were assessed as well as
non-index antihyperglycemic therapy classes
used in the pre-index period and concomitant
use on the index date. A non-index
antihyperglycemic therapy class was defined as
concomitant if the time between a prescription for
a therapy class in the pre- and post-index was
B120 days, with overlap on the index date, or if
the therapy class was prescribed/filled on the
index date. Additional EMR clinical
characteristics were summarized where available,
including body mass index (BMI), comorbidities
in the pre-index and physician type (GP/
diabetologist in GE). Patients with missing
prescription quantity data were excluded from
the subsequent ADD and treatment modification
analyses in FR EMR (35.8% exBID, 52.6% LIRA)
and NE LRx (0.6% exBID; 3.7% exQW, 0.5%
LIRA). There was no missing prescription quantity
data for the other databases.
502 Diabetes Ther (2014) 5:499–520

Tab
le1
Stud
ype
riod
Cou
ntry
Ger
man
yU
KFr
ance
Swed
enB
elgi
umG
erm
any
The
Net
herl
ands
UK
Dat
abas
eE
MR
LR
x
Sele
ctio
nw
indo
wex
BID
,LIR
A:
Janu
ary
1,20
10–D
ecem
ber
31,2
011
exB
ID,L
IRA
:M
ay1,
2010
–Apr
il
30,2
012
exQ
W(G
erm
any
only
):Ju
ne1,
2011
–Jun
e30
,201
2ex
QW
:Ju
ne1,
2011
–Oct
ober
31,
2012
Stud
yen
dda
teD
ecem
ber
31,2
012
Sept
embe
r30
,201
3A
pril
1,20
13
Con
tinu
ous
Elig
ibili
tyC
rite
ria/
Follo
w-u
p
Ger
man
y/Fr
ance
EM
RB
ased
onpa
tien
tac
tivi
ty(p
hysi
cian
visi
tor
wri
tten
pres
crip
tion
),an
dad
diti
onal
lyin
Fran
ce,r
epor
ting
phys
icia
nre
quir
edto
repo
rt
cons
iste
ntly
thro
ugho
utth
est
udy
win
dow
;fo
llow
edun
til
the
last
evid
ence
ofac
tivi
tyw
ithi
nth
est
udy
peri
od
UK
EM
RB
ased
onpa
tien
tre
gist
rati
onda
te;
follo
wed
unti
lst
udy
end
date
orde
-reg
istr
atio
nda
te
LR
xB
ased
onpa
tien
tpr
escr
ipti
onac
tivi
tyan
dal
lpha
rmac
ies
visi
ted
bypa
tien
tel
igib
lefo
rth
efu
llst
udy
tim
efr
ame;
follo
wed
unti
lthe
end
ofst
udy
win
dow
(exc
epti
onof
UK
LR
x;ag
greg
ate-
leve
lan
alys
is)
Swed
enB
ased
onpa
tien
tpr
escr
ipti
onac
tivi
ty;
follo
wed
unti
lfir
stof
eith
eren
dof
stud
ype
riod
orde
ath
Evi
denc
eof
T2D
(no
evid
ence
ofT
1D)
EM
R(d
iagn
oses
avai
labl
e)E
vide
nce
ofT
2Dw
asre
quir
edas
eith
er(a
)IC
D-1
0di
agno
sis
code
sof
diab
etes
,E10
–E14
,in
the
180-
day
pre-
inde
x(t
erm
edth
epr
e-
inde
xpe
riod
)up
to60
days
post
-inde
xor
(b)
atle
ast
C1
OA
Mcl
ass
and
nodi
agno
sis
for
poly
cyst
icov
aria
nsy
ndro
me
(IC
D-1
0:
E28
.2)
inth
epr
e-in
dex
peri
od
Pati
ents
wer
eex
clud
edif
they
had
evid
ence
ofT
1D:
pati
ents
wit
ha
diag
nosi
sof
E10
inth
epr
e-in
dex
peri
odm
eeti
ngal
lof
the
follo
win
gcr
iter
ia:(
a)no
E11
diag
nosi
s(T
2D),
(b)
noO
AM
use,
and
(c)
insu
linus
ein
the
pre-
inde
xpe
riod
,and
(d)
40ye
ars
ofag
e
oryo
unge
rat
first
E10
diag
nosi
s;or
ifth
eyha
dpr
egna
ncy
diag
nose
s(I
CD
-10
O00
–O9A
0)in
the
pre-
inde
xpe
riod
LR
x/Sw
eden
C1
OA
Mcl
ass
used
inth
epr
e-in
dex
peri
od
EM
RE
lect
roni
cM
edic
alR
ecor
dsda
taba
ses,
exB
IDex
enat
ide
twic
eda
ily,e
xQW
exen
atid
eon
cew
eekl
y,L
IRA
lirag
luti
deon
ceda
ily,I
CD
Inte
rnat
iona
lCla
ssifi
cati
onof
Dis
ease
s,L
Rx
Lon
gitu
dina
lPre
scri
ptio
nsda
taba
ses,
OA
Mor
alan
tihy
perg
lyce
mic
med
icat
ion,
T1D
type
1di
abet
es,T
2Dty
pe2
diab
etes
,UK
Uni
ted
Kin
gdom
Diabetes Ther (2014) 5:499–520 503
Experience of a first treatment modification
was assessed during the 180-day post-index
period. Treatment modifications included
discontinuation, switch, augmentation, off-
label up-titration and down-titration, assessed
following previously published methods [13].
Titration was calculated using ADD given the
lack of a reliable prescribed dose field.
Discontinuation was defined as a gap in a
series of successive index therapy prescriptions
C29 the expected duration of the first
prescription. Switching was defined as a new
non-index antihyperglycemic prescription (new
antihyperglycemic therapy class not observed in
the pre-index or index date, or non-index
antihyperglycemic therapy from the same
class) within 30 days before or after
discontinuation of the patient’s index
treatment. Augmentation was defined as C2
prescriptions for a new non-index
antihyperglycemic prescription, started more
than 30 days before the end of follow-up or
the index discontinuation date. Off-label up-
titration was identified as any dose increase
outside of label recommendations (daily dose
[20 lg for exBID; two consecutive prescriptions
with daily dose [1.8 mg for LIRA). Down-
titration was defined as two consecutive
prescriptions with doses lower than the index
dose. Persistence (i.e., continuation of the index
therapy) was evaluated during the 180-day post-
index period. Patients were considered
persistent until evidence of discontinuation or
switch. A stop outcome was defined as the
occurrence of either discontinuation or switch
(whichever came first).
Index therapy ADD was assessed for all
patients while persistent (until discontinuation
or switch); patients who augmented their index
therapy continued to factor into that index
therapy’s ADD. ADD was calculated by dividing
the total amount or units of drug prescribed by
the number of days between two consecutive
prescriptions. ADD was evaluated by calendar
month intervals for patients with an index
therapy prescription within that month.
Average ADDs over calendar months were
summarized to provide both a yearly and
overall ADD. An average weekly dose (AWD)
was calculated for exQW by multiplying the
ADD by 7. Prescriptions received within 14 days
of a previous prescription were excluded to
avoid overestimating ADD due to duplicate
prescriptions or ambiguous up-titration with
an exception for the prescription following the
index therapy (i.e., the second prescription) if
the gap between the second and third
prescription was equal to the expected
duration of the prescribed therapy. ADD in the
UK LRx (aggregated data) was calculated as
follows: total units of drug prescribed in a
month were summed and divided by the total
number of patients with a prescription in that
month; then divided by the number of days in
that month. This does not account for multiple
prescriptions prescribed for a patient in a
month which could result in over-inflation of
ADD estimates. For yearly and overall ADD/
AWD calculations, calendar months with less
than 30 patients were trimmed.
A wide range of ADDs were expected, due to
variability in gaps between consecutive
prescriptions [13]. Given overall ADD
sensitivity to small gaps/overlaps in available
prescriptions, we grouped ranges of ADD values
in categories consistent with labeled use and
dispensed doses to calculate titration outcomes.
For exBID: calculated ADD 5–15 lg = 10 lg;
calculated ADD [15–25 lg = 20 lg; and
calculated ADD [25 lg = dose above label; for
LIRA: calculated ADD 0.6–1.5 mg = 1.2 mg;
calculated ADD [1.5–2.1 mg = 1.8 mg; and
calculated ADD [2.1 mg = dose above label.
On-label up-titration was assessed as a separate
504 Diabetes Ther (2014) 5:499–520

Tab
le2
Dem
ogra
phic
and
clin
ical
char
acte
rist
ics
Cha
ract
eris
tics
Ger
man
yE
MR
UK
EM
RFr
ance
EM
RT
heN
ethe
rlan
dsL
Rx
ExB
ID(N
530
0)E
xQW
(N5
174)
LIR
A(N
590
6)E
xBID
(N5
388)
LIR
A(N
530
6)E
xBID
(N5
120)
LIR
A(N
539
9)E
xBID
(N5
171)
ExQ
W(N
527
0)L
IRA
(N5
2,18
9)
Age
(yea
rs)
atin
dex
(%)
18–2
91.
31.
21.
21.
00.
70.
00.
81.
20.
70.
6
30–3
94.
04.
63.
83.
93.
63.
32.
38.
25.
25.
2
40–4
921
.013
.816
.515
.517
.020
.013
.324
.617
.819
.1
50–6
449
.048
.951
.352
.653
.943
.353
.646
.849
.650
.2
65?
24.7
31.6
27.3
27.1
24.8
33.3
30.1
19.3
26.7
24.9
Mea
n56
.858
.257
.757
.657
.159
.359
.355
.457
.156
.7
SD10
.910
.910
.910
.410
.211
.110
.611
.010
.810
.7
Med
ian
57.0
59.0
58.0
58.0
57.0
59.0
59.0
56.0
58.0
57.0
Gen
der
(%m
ale)
59.3
56.3
54.5
51.8
53.9
47.5
51.6
49.7
52.2
46.0
Follo
w-u
p(m
onth
s)
Mea
n24
.510
.624
.025
.521
.824
.720
.327
.013
.924
.2
SD7.
02.
66.
86.
86.
66.
95.
26.
23.
36.
6
Med
ian
24.8
10.5
24.6
26.3
20.9
25.1
20.5
28.4
14.6
24.7
Num
ber
ofan
tihy
perg
lyce
mic
ther
apy
clas
ses
used
inth
e18
0-da
ypr
e-in
dex
peri
od
Mea
n1.
61.
61.
62.
222.
181.
71.
952.
072.
162.
26
SD1.
021
1.01
0.79
0.79
1.34
1.22
0.85
0.74
0.81
Med
ian
11
22
22
22
22
Dis
trib
utio
nof
freq
uent
([10
%)
anti
hype
rgly
cem
icth
erap
ycl
asse
sus
edin
the
180-
day
pre-
inde
xpe
riod
(%)*
Fast
-act
ing
insu
lin18
.710
.315
.86.
25.
93.
32.
815
.26.
316
.3
Inte
rmed
iate
-
acti
ngin
sulin
9.0
4.6
8.5
2.1
2.3
0.0
0.8
5.8
4.1
5.5
Diabetes Ther (2014) 5:499–520 505

Ta
ble
2co
ntin
ued
Cha
ract
eris
tics
Ger
man
yE
MR
UK
EM
RFr
ance
EM
RT
heN
ethe
rlan
dsL
Rx
ExB
ID(N
530
0)E
xQW
(N5
174)
LIR
A(N
590
6)E
xBID
(N5
388)
LIR
A(N
530
6)E
xBID
(N5
120)
LIR
A(N
539
9)E
xBID
(N5
171)
ExQ
W(N
527
0)L
IRA
(N5
2,18
9)
Inte
rmed
iate
/fas
t-
acti
ngin
sulin
2.0
2.3
2.1
9.5
11.1
1.7
2.0
8.8
6.7
12.1
Lon
g-ac
ting
insu
lin6.
75.
77.
66.
27.
26.
74.
59.
94.
414
.4
Sulp
hony
lure
a18
.720
.720
.561
.656
.238
.348
.156
.770
.463
.3
Big
uani
de59
.344
.856
.087
.479
.146
.754
.187
.782
.685
.8
Big
uani
de/
Sulp
hony
lure
a
0.0
0.0
0.0
N/a
N/a
0.8
2.0
0.6
0.4
0.1
Glit
azon
e5.
72.
95.
618
.618
.011
.79.
86.
48.
98.
2
Glin
ide
6.0
3.4
6.1
1.0
0.7
15.0
14.8
0.0
0.4
0.2
DPP
-IV
11.7
24.7
12.6
24.2
29.7
19.2
24.6
13.5
25.9
15.8
DPP
-IV
/Big
uani
de11
.037
.418
.10.
81.
314
.221
.62.
35.
63.
7
Num
ber
ofco
ncom
itan
tan
tihy
perg
lyce
mic
ther
apy
clas
ses
used
onth
ein
dex
date
**
Mea
n0.
90.
720.
841.
621.
541.
591.
241.
341.
411.
40
SD0.
730.
650.
670.
750.
790.
820.
90.
840.
750.
81
Med
ian
11
12
22
11
11
Dis
trib
utio
nof
freq
uent
([10
%)
conc
omit
ant
anti
hype
rgly
cem
icth
erap
ycl
asse
sus
edon
the
inde
xda
te(%
)*,**
Inte
rmed
iate
-
acti
ngin
sulin
2.0
0.6
1.7
1.3
1.3
0.0
0.5
3.5
0.4
1.4
Sulp
hony
lure
a8.
36.
39.
250
.542
.852
.546
.636
.351
.941
.3
Big
uani
de50
.744
.853
.581
.273
.563
.370
.766
.765
.265
.1
Glin
ide
5.3
1.2
2.8
0.3
0.3
7.5
10.5
0.0
0.4
0.0
506 Diabetes Ther (2014) 5:499–520

Tab
le2
cont
inue
d
Cha
ract
eris
tics
Bel
gium
LR
xG
erm
any
LR
xSw
eden
ExB
ID(N
584
5)L
IRA
(N5
1,38
4)E
xBID
(N5
4,23
0)E
xQW
(N5
1,62
9)L
IRA
(N5
12,7
27)
ExB
ID(N
534
3)E
xQW
(N5
121)
Lir
a(N
53,
808)
Age
(yea
rs)
atIn
dex
(%)
18–2
9N
/aN
/a0.
71.
30.
8s
s1
30–3
9N
/aN
/a4.
13.
74.
53
44
40–4
9N
/aN
/a18
.617
.918
.013
1316
50–6
4N
/aN
/a52
.451
.051
.760
5251
65?
N/a
N/a
24.2
26.1
25.0
2330
28
Mea
nN
/aN
/a57
.157
.857
.257
.958
.957
.9
SDN
/aN
/a10
.711
.210
.79.
910
.610
.5
Med
ian
N/a
N/a
57.0
58.0
58.0
59.0
60.0
59.0
Gen
der
(%m
ale)
56.1
53.9
49.7
50.0
50.3
58.3
66.9
55.8
Follo
w-u
p(m
onth
s)
Mea
n27
.420
.625
.313
.025
.127
.27.
621
.6
SD6.
84.
97.
74.
77.
77.
20.
96.
2
Med
ian
29.9
20.7
25.0
12.0
25.0
29.5
7.4
21.0
Num
ber
ofan
tihy
perg
lyce
mic
ther
apy
clas
ses
used
inth
e18
0-da
ypr
e-in
dex
peri
od
Mea
n1.
922.
072.
211.
852.
331.
911.
982.
03
SD0.
900.
781.
080.
901.
120.
870.
870.
87
Med
ian
22
22
22
22
Diabetes Ther (2014) 5:499–520 507

Ta
ble
2co
ntin
ued
Cha
ract
eris
tics
Bel
gium
LR
xG
erm
any
LR
xSw
eden
ExB
ID(N
584
5)L
IRA
(N5
1,38
4)E
xBID
(N5
4,23
0)E
xQW
(N5
1,62
9)L
IRA
(N5
12,7
27)
ExB
ID(N
534
3)E
xQW
(N5
121)
Lir
a(N
53,
808)
Dis
trib
utio
nof
freq
uent
([10
%)
anti
hype
rgly
cem
icth
erap
ycl
asse
sus
edin
the
180-
day
pre-
inde
xpe
riod
(%)*
Fast
-act
ing
insu
lin0.
70.
716
.17.
617
.57.
313
.211
.7
Inte
rmed
iate
-act
ing
insu
lin3.
12.
610
.66.
011
.414
.018
.219
.4
Inte
rmed
iate
/fas
t-ac
ting
insu
lin2.
62.
63.
31.
72.
912
.8s
11.5
Lon
g-ac
ting
insu
lin0.
40.
15.
52.
37.
54.
4s
7.2
Sulp
hony
lure
a61
.368
.928
.429
.129
.124
.228
.124
.5
Big
uani
de76
.481
.975
.661
.974
.989
.292
.688
.2
Big
uani
de/S
ulph
onyl
urea
10.1
8.1
0.0
0.2
0.0
0.0
0.0
0.0
Glit
azon
e3.
42.
55.
81.
47.
76.
7s
6.4
Glin
ide
18.1
18.3
6.7
7.0
7.3
8.7
s8.
2
DPP
-IV
15.1
19.7
13.3
22.4
16.4
15.7
19.0
19.9
DPP
-IV
/Big
uani
de0.
50.
817
.936
.220
.6s
s2.
7
Num
ber
ofco
ncom
itan
tan
tihy
perg
lyce
mic
ther
apy
clas
ses
used
onth
ein
dex
date
**
Mea
n1.
551.
550.
831.
141.
231.
461.
551.
53
SD0.
700.
680.
750.
900.
870.
750.
760.
80
Med
ian
22
11
11
11
Dis
trib
utio
nof
freq
uent
([10
%)
conc
omit
ant
anti
hype
rgly
cem
icth
erap
y
clas
ses
used
onth
ein
dex
date
(%)*
,**
Inte
rmed
iate
-act
ing
insu
lin0.
40.
42.
60.
93.
49.
914
.014
.4
508 Diabetes Ther (2014) 5:499–520

outcome, defined as any dose increase based on
label recommendations (two consecutive
prescriptions with ADD of 20 lg for exBID;
two consecutive prescriptions with ADD
C1.2 mg up to 1.8 mg for LIRA).
Descriptive summary statistics were used to
describe frequency and percentage distributions
for categorical variables while continuous
variables were described using the mean/
standard deviation/median. Time to stop of
the index therapy over the variable follow-up
was assessed using Kaplan–Meier (KM) analysis.
For the EMR cohorts, Cox proportional hazards
models (PHMs) were developed to assess risk of
stopping the index therapy. Statistical and
descriptive analyses were performed using SAS
version 9.1 (SAS Institute Inc., Cary, NC, USA).
A P value \0.05 was considered statistically
significant.
RESULTS
Patient Sample
After application of the inclusion/exclusion
criteria, the final sample consisted of 30,206
exBID patients (300 GE EMR/388 UK EMR/120
FR EMR/171 NE LRx/845 BE LRx/23,809 UK
LRx/4,230 GE LRx/343 SE), 5,401 exQW
patients (174 GE EMR/270 NE LRx/3,207 UK
LRx/1,629 GE LRx/121 SE), and 52,155 LIRA
patients (906 GE EMR/306 UK EMR/399 FR
EMR/2,189 NE LRx/1,384 BE LRx/30,436 UK
LRx/12,727 GE LRx/3,808 SE). Because
individual patient prescription data were
unavailable from the UK LRx due to privacy
legislation, it was not possible to evaluate
clinical characteristics or treatment patterns;
the aggregate UK LRx data allowed only for the
aggregate analysis of ADD outcomes.
Demographic and clinical characteristics of
the study sample can be found in Table 2. MeanTa
ble
2co
ntin
ued
Cha
ract
eris
tics
Bel
gium
LR
xG
erm
any
LR
xSw
eden
ExB
ID(N
584
5)L
IRA
(N5
1,38
4)E
xBID
(N5
4,23
0)E
xQW
(N5
1,62
9)L
IRA
(N5
12,7
27)
ExB
ID(N
534
3)E
xQW
(N5
121)
Lir
a(N
53,
808)
Sulp
hony
lure
a50
.154
.314
.015
.215
.517
.519
.016
.9
Big
uani
de60
.966
.360
.747
.665
.285
.186
.084
.0
Glin
ide
11.1
10.7
3.1
3.4
3.4
5.2
s4.
7
Pati
ent-
leve
lana
lysi
sw
asno
tpo
ssib
lew
ith
the
UK
LR
xdu
eto
priv
acy
legi
slati
on;o
nly
age
grou
pat
inde
xan
dge
nder
wer
eav
aila
ble
and
are
desc
ribe
din
the
text
N/a
data
not
appl
icab
leor
unav
aila
ble,
sdat
asu
ppre
ssed
inSw
eden
due
topa
tien
tco
unt
less
than
10in
com
plia
nce
wit
hSw
edis
hpr
ivac
yle
gisla
tion
DPP
-IV
Dip
epti
dylp
epti
dase
-4,E
MR
Ele
ctro
nic
Med
ical
Rec
ords
data
base
sex
BID
exen
atid
etw
ice
daily
,exQ
Wex
enat
ide
once
wee
kly,
LIR
Alir
aglu
tide
once
daily
,L
Rx
Lon
gitu
dina
lPr
escr
ipti
ons
data
base
s,U
KU
nite
dK
ingd
om*
Not
mut
ually
excl
usiv
e**
Ant
ihyp
ergl
ycem
icth
erap
yde
fined
asco
ncom
itan
tif
(1)
tim
ebe
twee
nth
erap
ycl
ass
pres
crip
tion
sin
pre-
and
post
-inde
xof
120
days
orle
ss,w
ith
over
lap
onin
dex
or(2
)w
ith
pres
crip
tion
onth
ein
dex
date
Diabetes Ther (2014) 5:499–520 509

age at index ranged from 55.4 to 59.3 years old
for patients across index therapy cohort and
database, and approximately half or more were
male (46.0–66.9%). ExBID and LIRA patients
had approximately 2 years of follow-up; exQW
patients had shorter follow-up ranging from 7.6
to 13.9 months. Available demographic
characteristics for the UK LRx sample were
limited (due to privacy legislation) to age at
index prescription [most often between 50 and
64 years (48.2–49.0%)] and gender with over
half male (52.7–55.4%) across therapy cohorts.
On average, patients had 1.6–2.3
antihyperglycemic therapy classes in the
180-day pre-index (with a median of 2 classes
for most index therapy cohorts), and patients
most often used a median of 1 concomitant
antihyperglycemic therapy class during index.
Biguanides, followed by sulfonylureas were the
most common antihyperglycemic therapy
classes used in both the 180-day pre-index and
concomitant with the index therapy, while
insulin use was less frequent.
For EMR, data on BMI were available for
most patients only in the UK, where the
majority of exBID and LIRA patients had a
BMI indicative of obesity (BMI C 30.0) at index
(76.8% and 67.0%), although only 12.1% and
10.5% were diagnosed with obesity,
respectively. Cardiovascular (CV) disease was
the most common comorbidity of interest
observed in the 180-day pre-index (range
53.7–63.7%) in GE and UK across cohorts
(diagnoses were less frequently recorded in FR).
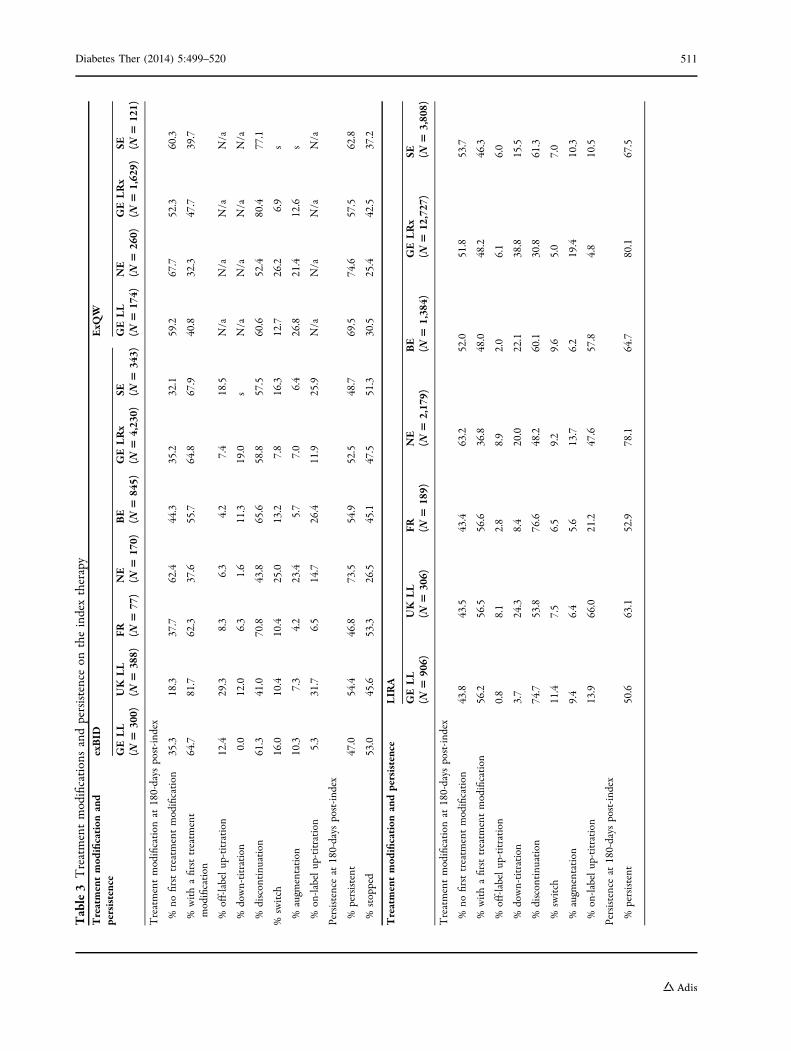
Treatment Patterns
Across databases, the proportion of patients
persistent at 180 days was higher among LIRA
and exQW patients compared to exBID
(Table 3), and for LIRA patients ranged from
50.6% to 80.1% (GE EMR and GE LRx), for
exBID patients ranged from 46.8% to 73.5% (FR
EMR and NE LRx), and for exQW patients
ranged from 57.5% to 74.6% (GE LRx and NE
LRx). The proportion persistent at 180 days was
highest for exQW in GE EMR, and second to
LIRA in NE LRx, GE LRx and SE.
KM results for time to stop (discontinuation
or switch) over the variable follow-up by index
therapy cohort (excluding the UK LRx) can be
found in Fig. 1a–c. Median time to stop for
exBID ranged from 95 days to 275 days (GE EMR
and NE LRx); 265 days to 377 days for exQW
(GE LRx and GE EMR; note: fewer than 50%
experienced stop in NE LRx or SE), and 179 days
to 814 days for LIRA (GE EMR and GE LRx).
Across databases, the proportion stopping was
lower among LIRA patients compared to exBID
at all time points. Comparisons to exQW are
limited given the shorter follow-up period
(180 days minimum).
Treatment modifications at 180-day post-
index can be found in Table 3 by index
therapy cohort. More exBID patients
experienced treatment modification at
180 days compared to LIRA or exQW patients
in each database. More than half of exBID
patients experienced treatment modification
[ranging from 55.7% to 81.7% (BE LRx and UK
EMR)] with the exception of NE LRx (37.6%).
Approximately, half of LIRA patients
experienced treatment modification ranging
from 46.3% to 56.6% (SE and FR EMR), again
with the exception of NE LRx (36.8%). The
proportion experiencing treatment
modification at 180 days among exQW ranged
from 32.3% to 47.7% (NE LRx and GE LRx);
fewer exQW patients experienced treatment
modification compared to LIRA patients in GE
EMR (40.8% and 56.2%) and SE (39.7% and
46.3%), while proportions were more similar in
NE and GE LRx. Discontinuation was the most
common first treatment modification type
510 Diabetes Ther (2014) 5:499–520
Tab
le3
Tre
atm
ent
mod
ifica
tion
san
dpe
rsis
tenc
eon
the
inde
xth
erap
yT
reat
men
tm
odifi
cati
onan
dpe
rsis
tenc
eex
BID
ExQ
W
GE
LL
(N5
300)
UK
LL
(N5
388)
FR (N5
77)
NE
(N5
170)
BE
(N5
845)
GE
LR
x(N
54,
230)
SE (N5
343)
GE
LL
(N5
174)
NE
(N5
260)
GE
LR
x(N
51,
629)
SE (N5
121)
Tre
atm
ent
mod
ifica
tion
at18
0-da
yspo
st-in
dex
%no
first
trea
tmen
tm
odifi
cati
on35
.318
.337
.762
.444
.335
.232
.159
.267
.752
.360
.3
%w
ith
afir
sttr
eatm
ent
mod
ifica
tion
64.7
81.7
62.3
37.6
55.7
64.8
67.9
40.8
32.3
47.7
39.7
%of
f-la
bel
up-t
itra
tion
12.4
29.3
8.3
6.3
4.2
7.4
18.5
N/a
N/a
N/a
N/a
%do
wn-
titr
atio
n0.
012
.06.
31.
611
.319
.0s
N/a
N/a
N/a
N/a
%di
scon
tinu
atio
n61
.341
.070
.843
.865
.658
.857
.560
.652
.480
.477
.1
%sw
itch
16.0
10.4
10.4
25.0
13.2
7.8
16.3
12.7
26.2
6.9
s
%au
gmen
tati
on10
.37.
34.
223
.45.
77.
06.
426
.821
.412
.6s
%on
-labe
lup
-tit
rati
on5.
331
.76.
514
.726
.411
.925
.9N
/aN
/aN
/aN
/a
Pers
iste
nce
at18
0-da
yspo
st-in
dex
%pe
rsis
tent
47.0
54.4
46.8
73.5
54.9
52.5
48.7
69.5
74.6
57.5
62.8
%st
oppe
d53
.045
.653
.326
.545
.147
.551
.330
.525
.442
.537
.2
Tre
atm
ent
mod
ifica
tion
and
pers
iste
nce
LIR
A
GE
LL
(N5
906)
UK
LL
(N5
306)
FR (N5
189)
NE
(N5
2,17
9)B
E(N
51,
384)
GE
LR
x(N
512
,727
)SE (N
53,
808)
Tre
atm
ent
mod
ifica
tion
at18
0-da
yspo
st-in
dex
%no
first
trea
tmen
tm
odifi
cati
on43
.843
.543
.463
.252
.051
.853
.7
%w
ith
afir
sttr
eatm
ent
mod
ifica
tion
56.2
56.5
56.6
36.8
48.0
48.2
46.3
%of
f-la
bel
up-t
itra
tion
0.8
8.1
2.8
8.9
2.0
6.1
6.0
%do
wn-
titr
atio
n3.
724
.38.
420
.022
.138
.815
.5
%di
scon
tinu
atio
n74
.753
.876
.648
.260
.130
.861
.3
%sw
itch
11.4
7.5
6.5
9.2
9.6
5.0
7.0
%au
gmen
tati
on9.
46.
45.
613
.76.
219
.410
.3
%on
-labe
lup
-tit
rati
on13
.966
.021
.247
.657
.84.
810
.5
Pers
iste
nce
at18
0-da
yspo
st-in
dex
%pe
rsis
tent
50.6
63.1
52.9
78.1
64.7
80.1
67.5
Diabetes Ther (2014) 5:499–520 511

across index therapies for all countries with the
exception of LIRA patients in GE LRx where
down-titration was most common.
Cox Proportional Hazards Models for Risk
of Stopping
Type of index therapy was significantly
associated with risk of stopping in all EMR
countries, with LIRA associated with a lower risk
of stopping compared to exBID (Table 4). In GE,
compared to exBID, exQW was associated with
a 54% lower risk while LIRA was associated with
a 31% lower risk (both P\0.001). In UK,
compared to exBID, LIRA was associated with
a 28% lower risk (P\0.001). In FR, compared to
exBID, LIRA was associated with a 38% lower
risk (P = 0.002). In both GE and UK,
concomitant use of a biguanide was associated
with a lower risk of stopping the index therapy
compared to no biguanide use. In GE, other
significant predictors for stop included male
gender, GP physician type, depression and non-
neuropathic pain in the pre-index and no CV
disease and concomitant insulin use. It is
important to note the availability of physician
type in GE only and the different sample sizes,
which may impact model findings.
Average Daily Dose
ADD by calendar year (year of prescription) and
overall (over the entire follow-up period) is
reported in Table 5. Mean (SD) overall ADD for
exBID was on the higher end of the approved
doses and ranged from 16.39 (1.68) to
19.36 (1.04) lg (SE and UK EMR); overall ADD
calculated at the aggregate level in UK LRx was
higher: 20.73 (0.58) lg. Overall ADD for LIRA
was generally in the middle of the indicated
doses and ranged from 1.30 (0.07) to
1.61 (0.15) mg (BE LRx and NE LRx); overallTab
le3
cont
inue
d
Tre
atm
ent
mod
ifica
tion
and
pers
iste
nce
LIR
A
GE
LL
(N5
906)
UK
LL
(N5
306)
FR (N5
189)
NE
(N5
2,17
9)B
E(N
51,
384)
GE
LR
x(N
512
,727
)SE (N
53,
808)
%st
oppe
d49
.436
.947
.121
.935
.319
.932
.5
Pati
ent-
leve
lan
alys
isw
asno
tpo
ssib
lew
ith
the
UK
LR
xdu
eto
priv
acy
legi
slati
on;
ther
efor
e,tr
eatm
ent
patt
ern
outc
omes
wer
eno
tas
sess
edN
/ada
tano
tap
plic
able
,sda
tasu
ppre
ssed
inSw
eden
due
topa
tien
tco
unt
less
than
10in
com
plia
nce
wit
hSw
edis
hpr
ivac
yle
gisla
tion
BE
Bel
gium
,EM
RE
lect
roni
cM
edic
alR
ecor
dsda
taba
ses,
exB
IDex
enat
ide
twic
eda
ily,e
xQW
exen
atid
eon
cew
eekl
y,FR
Fran
ce,G
EG
erm
any,
LIR
Alir
aglu
tide
once
daily
,LR
xL
ongi
tudi
nal
Pres
crip
tion
sda
taba
ses,
NE
the
Net
herl
ands
,SE
Swed
en,U
KU
nite
dK
ingd
om
512 Diabetes Ther (2014) 5:499–520

Fig. 1 Kaplan–Meier analyses for time to stop: a exBID,b exQW, c LIRA. Patient-level analysis was not possiblewith the UK LRx due to privacy legislation; therefore,treatment pattern outcomes were not assessed. BE Belgium,EMR Electronic Medical Records databases, exBID
exenatide twice daily, exQW exenatide once weekly, FRFrance, GE Germany, LIRA liraglutide once daily, LRxLongitudinal Prescriptions databases, NE The Netherlands,SE Sweden, UK United Kingdom
Diabetes Ther (2014) 5:499–520 513

Table 4 Cox proportional hazards models for risk of stopping in Germany, UK, and France EMR; dependent variable:experience of stopModel 1. Germany EMR, N 5 1,380
Variable Parameterestimate
Standarderror
Chisquare
P value Hazardratio
95% confidence interval
Lower limit Upper limit
Index treatment (reference: exBID)
exQW -0.768 0.129 35.678 \0.0001 0.46 0.361 0.597
LIRA –0.379 0.074 25.857 \0.0001 0.69 0.592 0.792
Male (reference: female) 0.155 0.065 5.752 0.017 1.17 1.029 1.326
Physician type (reference: GP)
Diabetologist –0.357 0.083 18.567 \0.0001 0.70 0.595 0.823
Specific relevant comorbidities (yes vs. no)
CV diseaseq –0.190 0.069 7.618 0.006 0.83 0.723 0.946
Depression 0.254 0.115 4.910 0.027 1.29 1.030 1.615
Pain (non-neuropathic) 0.197 0.098 4.042 0.044 1.22 1.005 1.475
Concomitant antihyperglycemic treatment classes used (yes vs. no)�
Insulin 0.542 0.111 24.061 \0.0001 1.72 1.385 2.136
Biguanide –0.163 0.065 6.289 0.012 0.85 0.747 0.965
Other OAM –0.155 0.093 2.741 0.098 0.86 0.713 1.029
Model 2. UK EMR, N 5 694
Variable Parameterestimate
Standarderror
Chi square P value Hazardratio
95% confidence interval
Lower limit Upper limit
Index treatment (reference: exBID)
LIRA –0.326 0.092 12.440 0.0004 0.72 0.603 0.865
Specific relevant comorbidities (yes vs. no)
Obesity –0.242 0.143 2.868 0.0903 0.79 0.594 1.039
Concomitant antihyperglycemic treatment classes used (yes vs. no)�
Biguanide –0.256 0.108 5.592 0.018 0.77 0.627 0.957
Model 3. France EMR, N 5 694
Variable Parameterestimate
Standarderror
Chi square P value Hazardratio
95% confidence interval
Lower limit Upper limit
Index treatment (reference: exBID)
LIRA –0.473 0.151 9.791 0.002 0.62 0.464 0.838
Specific relevant comorbidities (yes vs. no)
514 Diabetes Ther (2014) 5:499–520

ADD calculated at the aggregate level in UK LRx
was 1.49 (0.04) mg. Overall AWD (ADD 9 7)
exQW ranged from 2.00 (0.07) to
2.14 (0.18) mg (GE LRx and GE EMR); overall
AWD calculated at the aggregate level in UK
LRx was 2.18 (0.07) mg.
DISCUSSION
Our research suggests that treatment patterns
varied among GLP-1 RA patients. Across the
databases, the proportion of patients that
experienced a treatment modification and that
stopped the index therapy by 180-day post-
index were higher among exBID compared to
LIRA QD or exQW patients. A greater
proportion of exBID patients stopped therapy
than LIRA patients at all time points in the KM
analyses, further supported by the Cox PHMs.
While treatment pattern results for ExQW
varied by dataset relative to LIRA, the Cox
PHM results in GE EMR supported the observed
lower likelihood of stopping for exQW relative
to LIRA and exBID. The exQW data should be
interpreted with caution; comparisons are
restricted given the shorter follow-up due to
more recent launch. While the overall ADDs of
GLP-1 RAs were generally within the indicated
ranges, the overall ADD for LIRA was generally
in the middle of the indicated doses (1.2 or
1.8 mg following the second week); and on
average, higher than the 1.2 mg dosing
recommended by the EMA [6] and NICE [7],
suggesting that on average, many patients are
using and benefitting from the higher dose.
Some differences between treatment patterns by
index therapy were observed between databases
in GE (EMR and LRx), including the proportion
stopping therapy; it is important to consider the
different populations (physician EMR records
vs. filled pharmacy claims) and variable follow-
up periods, as well as the much higher sample
size for LRx. Overall ADD results in GE EMR
compared to GE LRx were similar (exBID: 17.65,
17.70 lg; exQW: 0.31, 0.29 mg; LIRA: 1.44,
1.40 mg, respectively). The ADD was higher as
calculated in the UK LRx for all therapies
compared to the UK EMR, likely related to
over-estimation with the aggregate-level
analysis. It is important to note that the
Table 4 continued
Model 3. France EMR, N 5 694
Variable Parameterestimate
Standarderror
Chi square P value Hazardratio
95% confidence interval
Lower limit Upper limit
Depression 0.587 0.353 2.755 0.097 1.80 0.899 3.594
Table presents only borderline significant or significant predictors, for brevity’s sakeCV Cardiovascular, EMR Electronic Medical Records databases, exBID exenatide twice daily, exQW exenatide once weekly,GP general practitioner, LIRA liraglutide once daily, OAM Oral antihyperglycemic medication, UK United Kingdom� Antihyperglycemic therapy defined as concomitant if (1) time between therapy class prescriptions in pre- and post- indexof 120 days or less, with overlap on index or (2) with prescription on the index dateq CV disease included the following ICD-10 (International Classification of Diseases) codes: E78.0, E78.2, E78.4–E78.6;I10; I11.0, I11.9; I15.2, I15.8, I15.9; I20, I20.0, I20.1, I20.8, I20.9; I21, I21.0–I21.4, I21.9; I22.0, I22.1, I22.8, I22.9; I24.0,I24.8, I24.9; I25.0–I25.6, I25.8, I25.9; I44, I44.0–I44.7; I45.0; I46, I46.0, I46.9; I50, I50.0, I50.1, I50.9; I60, I60.0–I60.9;I61, I61.0–I60.6, I60.8, I60.9; I61, I61.0–I61.9; I63, I63.0–I63.6, I63.8, I63.9; I64; I70, I70.0–I70.2, I70.8, I70.9; I71,I71.0–I71.6, I71.8, I71.9; I72, I72.0–I72.4, I72.8, I72.9; I73, I73.8, I73.9; I74, I74.0–I74.5, I74.8, I74.9; I79, I79.2, I79.8;I82, I82.2, I82.3, I82.8, I82.9
Diabetes Ther (2014) 5:499–520 515

Tab
le5
Yea
rly
and
over
all
AD
DE
xBID
AD
D(l
g)G
erm
any
EM
R(N
530
0)U
KE
MR
(N5
388)
The
Net
herl
ands
LR
x(N
517
0)B
elgi
umL
Rx
(N5
845)
2010
2011
Ove
rall
2010
2011
2012
Ove
rall
2010
2011
Ove
rall
2010
2011
2012
Ove
rall
Mea
n17
.38
17.8
617
.65
19.1
518
.91
20.0
419
.36
16.7
918
.85
18.6
217
.28
17.8
818
.97
18.0
2
SD1.
920.
521.
191.
000.
481.
231.
04–
1.22
1.33
0.72
0.51
0.79
0.96
Med
ian
18.0
718
.03
18.0
718
.99
19.0
019
.95
19.3
016
.49
18.9
018
.81
17.3
517
.93
18.8
317
.95
AD
D(l
g)G
erm
any
LR
x(N
54,
230)
Swed
en(N
534
3)U
KL
Rx
(N5
23,8
09)*
2010
2011
2012
2013
Ove
rall
2010
2011
2012
Ove
rall
2010
2011
2012
2103
Ove
rall
Mea
n16
.28
17.0
118
.53
19.2
517
.70
15.7
016
.26
18.1
916
.39
20.6
220
.76
20.7
120
.97
20.7
3
SD1.
400.
651.
031.
652.
101.
631.
441.
161.
680.
600.
680.
460.
660.
58
Med
ian
16.2
616
.95
18.4
118
.90
17.4
415
.81
15.7
118
.03
16.3
620
.77
20.8
120
.72
20.8
920
.73
exQ
W
AD
D(m
g)G
erm
any
EM
R(N
517
4)T
heN
ethe
rlan
dsL
Rx
(N5
260)
Ger
man
yL
Rx
(N5
1,62
9)
2011
2012
Ove
rall
AW
D**
2011
2012
2013
Ove
rall
AW
D**
2011
2012
2013
Ove
rall
AW
D**
Mea
n0.
330.
300.
312.
140.
310.
300.
300.
302.
100.
300.
280.
280.
292.
00
SD0.
060.
010.
030.
180.
010.
010.
020.
010.
090.
010.
010.
010.
010.
07
Med
ian
0.33
0.30
0.30
2.10
0.31
0.29
0.31
0.30
2.08
0.30
0.28
0.28
0.28
1.99
AD
D(m
g)Sw
eden
(N5
121)
UK
LR
x(N
53,
207)
Yea
rO
vera
llY
ear
Ove
rall
2012
Ove
rall
AW
D**
2011
2012
2013
Ove
rall
AW
D**
Mea
n0.
300.
302.
120.
300.
310.
310.
312.
18
SD0.
010.
010.
05–
0.01
0.01
0.01
0.07
Med
ian
0.30
0.30
2.11
0.26
0.31
0.31
0.31
2.17
516 Diabetes Ther (2014) 5:499–520

Tab
le5
cont
inue
dL
IRA
AD
D(m
g)G
erm
any
EM
R(N
590
6)U
KE
MR
(N5
306)
Fran
ceE
MR
(N5
189)
2010
2011
2012
Ove
rall
2010
2011
2012
Ove
rall
2011
2012
Ove
rall
Mea
n1.
411.
411.
511.
441.
381.
321.
351.
341.
431.
291.
41
SD0.
090.
060.
160.
110.
070.
050.
080.
070.
13–
0.13
Med
ian
1.40
1.42
1.45
1.43
1.37
1.32
1.35
1.33
1.45
1.29
1.41
AD
D(m
g)T
heN
ethe
rlan
dsL
Rx
(N5
2,17
9)B
elgi
umL
Rx
(N5
1,38
4)G
erm
any
LR
x(N
512
,727
)
2010
2011
2012
2103
Ove
rall
2010
2011
2012
Ove
rall
2010
2011
2012
2013
Ove
rall
Mea
n1.
421.
591.
691.
881.
611.
231.
281.
371.
301.
281.
341.
451.
611.
40
SD0.
070.
060.
070.
090.
150.
040.
030.
050.
070.
030.
030.
050.
180.
14
Med
ian
1.44
1.59
1.70
1.84
1.60
1.23
1.28
1.37
1.29
1.27
1.33
1.45
1.57
1.36
AD
D(m
g)Sw
eden
(N5
3,80
8)U
KL
Rx
(N5
30,4
36)*
2010
2011
2012
Ove
rall
2010
2011
2012
2013
Ove
rall
Mea
n1.
431.
491.
661.
521.
511.
491.
481.
491.
49
SD0.
050.
030.
120.
120.
040.
050.
030.
050.
04
Med
ian
1.42
1.49
1.62
1.49
1.52
1.48
1.48
1.49
1.48
AD
Dpr
esen
ted
repr
esen
tsa
sum
mar
yof
mon
thly
AD
Dfo
rel
igib
lepr
escr
ipti
onre
cord
s.Pa
tien
tN
chan
ges
over
tim
e,an
dpa
tien
tsre
flect
am
ixof
new
init
iato
rsan
dpr
eval
ent
user
sov
erti
me
Yea
rly/
over
all
data
not
pres
ente
dif
all
com
pone
ntm
onth
sha
vepa
tien
tN
\30
;M
onth
lyA
DD
calc
ulat
ions
trim
med
whe
reN
\30
AD
DA
vera
geda
ilydo
se,A
WD
aver
age
wee
kly
dose
,EM
RE
lect
roni
cM
edic
alR
ecor
dsda
taba
ses,
exB
IDex
enat
ide
twic
eda
ily,e
xQW
exen
atid
eon
cew
eekl
y,L
IRA
lirag
luti
deon
ceda
ily,L
Rx
Lon
gitu
dina
lPr
escr
ipti
ons
data
base
s,U
KU
nite
dK
ingd
om*
UK
LR
xA
DD
calc
ulat
edat
the
aggr
egat
ele
vel
**A
WD
calc
ulat
edas
AD
D9
7
Diabetes Ther (2014) 5:499–520 517

prescription of GLP-1 RA therapies in the
countries evaluated may be influenced by local
regulation and reimbursement policies, such as
reimbursement in the third-line setting only
among restricted populations [7, 9–11],
prescribing restricted to specialists [15] or even
restrictive prescribing targets for physicians
[16], related to the costs and cost-effectiveness
perceptions of GLP-1 RA therapies which may
vary in each considered country.
The results presented must be viewed in light
of some limitations associated with using
electronic medical record and prescription data.
Patients included in EMR (and their physicians)
and LRx databases may not be fully
representative of all patients in the respective
country, as data are collected only from
physicians who have agreed to participate in
the EMR panel or only from pharmacies which
participate in the database. For EMR, only care
within the EMR practice setting is visible, and
data linkage is not available if a patient visits
multiple physicians within the EMR panel, as the
patient is assigned different identification
numbers by each physician. The prescription
information only highlights prescriptions
written by the participating physician, with no
information on actual pharmacy fills. As
mentioned earlier, the UK and FR data are
limited to GPs. LRx lacks visibility to any
prescriptions purchased outside the pharmacies
included in the database. The lack of medical
diagnosis codes in LRx and SE made it difficult to
confirm the presence/absence of T1D and/or
T2D, however, oral antihyperglycemic
medication (OAM) use in the 180-day pre-
index was required, with the exception of the
UK LRx where no patient-level data are available.
It is possible that the UK LRx patient sample
included non-T2D users, potentially for off-label
weight-loss benefits despite the sole indication
of GLP-1 RAs for T2D. Further, lack of clinical
data limited our ability to adjust for confounding
factors. Both EMR and LRx lack the ability to
identify patient mortality. The SE data provide
more comprehensive insight into treatment
patterns given the national pharmacy data and
identification of patient mortality. No
assumptions can be made about actual filling of
prescriptions (EMR) or consumption of all of the
medication supplied in each prescription on
time. Lastly, our study was subjected to the
same limitations that are often inherent in
retrospective claims-based analyses. Our results
can only establish associations and not cause-
and-effect relationships. Our sample may be
biased towards a healthier population due to
our continuous enrollment requirements, which
were necessary to ensure adequate visibility into
the patients’ clinical history; this may be less of
an issue among patients with chronic diseases,
such as diabetes. Further, small sample sizes for
some cohorts/databases limited comparisons.
Few studies have compared treatment
patterns and ADD between GLP-1 RA
therapies. Miller et al. [13] compared exBID
and LIRA treatment patterns using the GE EMR
database. Patients were identified initiating
therapies of interest between January 2009 and
April 2010 with C90-day post-index follow-up.
Mean ADD was 16.7 lg for exBID and 1.43 mg
for LIRA, while in our GE EMR analysis, we
found a higher ADD for exBID, 17.7 lg, and a
similar ADD for LIRA, 1.44 mg. In addition,
based on Cox PHM estimates in the Miller et al.
[13] study, index therapy was not a statistically
significant predictor of time to treatment
modification. In our model for time to
stopping (discontinuation or switch), LIRA was
associated with a lower risk of stop. Differences
between study results may be partially
explained by different study periods as our
analysis utilized longer-follow-up for LIRA
following its approval in Europe in 2009.
518 Diabetes Ther (2014) 5:499–520

McDonell et al. [12] examined the real-world
daily usage of exBID and LIRA using UK LRx
between November 2008 and March 2011 in a
similar analysis of ADD using an aggregate
approach. The average daily usage was
estimated at 20.49 lg for exBID and 1.50 mg
for LIRA. We found similar results with an
overall ADD of 20.73 lg for exBID and 1.49 mg
for LIRA. Using LRx in GE, Fuchs et al. [14]
found a mean ADD of 1.29 mg excluding
extreme values and 1.42 mg including extreme
values for LIRA; while the latter is closer to our
observed ADD of 1.44 mg in GE EMR and
1.40 mg in GE LRx, our methods varied
(trimming of extreme values vs. trimming
months with N\30 patients). Additionally,
Fuchs et al. [14] captured an earlier time
period (2009–2010).
CONCLUSIONS
Our study is the first, to our knowledge, to
comprehensively examine treatment patterns
and ADD of GLP-1 RA therapies, including
exQW, across various EU countries and
datasets. In this real-world analysis, ADD was
within indicated label ranges for GLP-1 RA
therapies. Treatment patterns varied among
GLP-1 RA patients in the sample of European
countries considered in this study, with
persistence highest among either LIRA or
exQW across countries, and lowest among
exBID. Longer-term data would be useful to
further elucidate practice patterns associated
with these medicines, particularly exQW.
ACKNOWLEDGMENTS
This study and article processing charges were
financially supported by Eli Lilly and Company,
Indianapolis, IN, USA. All named authors met
the ICMJE criteria for authorship for this
manuscript, take responsibility for the
integrity of the work as a whole, and have
given final approval to the version to be
published. Mitch DeKoven, Nebibe Varol, Won
Chan Lee, Matthew Reaney were involved in
study conception, all authors were involved in
study design, Mitch DeKoven, Shawn Hallinan,
Sara Bruce Wirta were involved in data
acquisition, Victoria Divino, Shawn Hallinan,
and Sara Bruce Wirta were involved in data
analysis, Victoria Divino, Mitch DeKoven,
Nebibe Varol, Matthew Reaney, Sara Bruce
Wirta were involved in data interpretation,
Victoria Divino drafted the manuscript, all
authors reviewed, edited and provided final
approval of the manuscript. The authors thank
Hartmut Richter and Lara Lucchese, employees
of IMS Health, who were also involved in data
analysis.
Conflict of interest. Nebibe Varol is an
employee of Lilly. Matthew Reaney was an
employee of Lilly at the time of the study.
Victoria Divino is an employee of IMS Health.
Mitch DeKoven is an employee of IMS Health.
Sara Bruce Wirta is an employee of IMS Health.
Shawn Hallinan was an employee of IMS Health
at the time of the study. Won Chan Lee was an
employee of IMS Health at the time of the
study. IMS Health received consulting fees from
Lilly for this study.
Compliance with ethics guidelines. This
study involved a retrospective cohort analysis
using eight databases, and the analysis does not
contain studies with human or animal subjects
performed by any of the authors. Research
ethics approval was received from the regional
Ethics Review Board in Stockholm in order to
conduct the Swedish analysis. Ethics approval
was not required in the other countries.
Diabetes Ther (2014) 5:499–520 519

Open Access. This article is distributed
under the terms of the Creative Commons
Attribution Noncommercial License which
permits any noncommercial use, distribution,
and reproduction in any medium, provided the
original author(s) and the source are credited.
REFERENCES
1. International Diabetes Federation. IDF DiabetesAtlas. 6th ed. Brussels: International DiabetesFederation; 2013. http://www.idf.org/diabetesatlas.Accessed February 18, 2014.
2. Inzucchi SE, Bergenstal RM, Buse JB, et al.Management of hyperglycemia in type 2 diabetes:a patient-centered approach: position statement ofthe American Diabetes Association (ADA) and theEuropean Association for the Study of Diabetes(EASD). Diabetes Care. 2012;35:1364–79.
3. Egan AG, Blind E, Dunder K, et al. Pancreatic safetyof incretin-based drugs—FDA and EMA assessment.N Engl J Med. 2014;370:794–7.
4. Byetta: EPAR—European Medicines Agency—Europa, European Medicines Agency. http://www.ema.europa.eu/docs/en_GB/document_library/EPAR_-Product_Information/human/000698/WC500051845.pdf (2011). Accessed March 28, 2013.
5. Victoza: EPAR—Product Information—EuropeanMedicines Agency. European Medicines Agency.http://www.ema.europa.eu/docs/en_GB/document_library/EPAR_-Product_Information/human/001026/WC500050017.pdf (2014). Accessed October 21,2014.
6. European Medicines Agency: Assessment report forVictoza. http://www.ema.europa.eu/docs/en_GB/document_library/EPAR_-_Public_assessment_report/human/001026/WC500050016.pdf. AccessedSeptember 16, 2013.
7. Type 2 Diabetes—newer agents (partial update ofCG66) (CG87): NICE clinical guidelines. http://publications.nice.org.uk/type-2-diabetes-cg87 (2009).Accessed February 20, 2013.
8. Bydureon : EPAR—Product information—EuropeanMedicines Agency. European Medicines Agency.http://www.ema.europa.eu/docs/en_GB/document_library/EPAR_-_Product_Information/human/002020/WC500108241.pdf (2011). Accessed March 12,2013.
9. GLP-1-agonisten: MedicijnBalans. http://medicijnbalans.nl/medicijngroepen/diabetes-type-2/middel/99 (2014). Accessed October 21, 2014.
10. National Guidelines for Diabetes Care—summary.Socialstyrelsen. http://www.socialstyrelsen.se/nationalguidelines/nationalguidelinesfordiabetescare(2010). Accessed February 12, 2014.
11. Scheen AJ, Van Gaal LF. Liraglutide (Victoza):human glucagon-like peptide-1 used in once dailyinjection for the treatment of type 2 diabetes. RevMed Liege. 2010;65:464–70.
12. McDonell A, Zammit DC, Haslam T, et al. PDB35estimating the real life daily usage and daily cost ofGLP-1 receptor agonists in the UK setting. ValueHealth. 2011;14:A477–8.
13. Miller LA, Burudpakdee C, Zagar A, et al. ExenatideBID and liraglutide QD treatment patterns amongtype 2 diabetes patients in Germany. J Med Econ.2012;15:746–57.
14. Fuchs S, Kostev L, Seitz L, Wohlleben M. Ermittlungder tatsachlichen Tagesdosierung von Liraglutid(PDD) unter realen Versorgungsbedingungen imHinblick auf die Berechnung vonTagestherapiekosten. Diabetologie undStoffwechsel. 2011;6:P234.
15. Buitenhuis R. Impact of a restrictive reimbursementpolicy on access, costs and quality and safety oftreatment: Analysis of a Dutch reimbursement caseregarding GLP-1 therapy. Masters thesis, ErasmusUniversity, Rotterdam. http://thesis.eur.nl/pub/12738/Buitenhuis%20R%20351371.pdf (2012).Accessed September 22, 2014.
16. Decision Resources: European physician and payerforum. DPP-IV inhibitors and GLP-1 analogues forType 2 diabetes—how are physician and payerperspectives shaping the European markets?http://decisionresources.com/Products-and-Services/Report?r=pforeu0611 (2011). Accessed September23, 2014.
520 Diabetes Ther (2014) 5:499–520