Embed Size (px)
Citation preview


5
Dynamic Marketswe see promising possibilities for growth in dynamic markets.
H OW CAN WE CREATE SUCCESS THE WORLD OVER? By bridging the fl exibility of our unique business model
with the distinct nuances and opportunities in each market.With 20 years of history and operations in 40 countries, we
have garnered tremendous experience in geographic expansion and in adapting our business model to fi t local conditions. We must continue to focus on our key strengths, adapt our business, and innovate new strategies to succeed in markets throughout the world. By building a solid foundation for growth, we can claim all that each market has to offer.
b r i d g e o f t h e a u t u m n m o o n
this beautiful, centuries-old bridge in china’s hunan province is named the bridge of the autumn moon. the chinese, like people of other cultures, believe bridges bring worlds together and lead those with vision to find great success.

6
W e are now beginning to claim the potential we saw in china.
Our expertise in adapting our business model to a market proved essential as we expanded operations in China in 2003. Chinese regulations did not permit us to implement the direct selling business model that had generated so much success for us in surrounding countries. Undaunted, we saw the opportunity and estab-lished our presence by opening retail stores in several major cities and employing thousands of local sales representatives. These efforts formed the foundation for our future in China.
With a solid foundation in place, we are leveraging the operational experience we have gained—and are claiming the vast potential that
China offers. We estimate that direct selling companies in China gener-
ated approximately $4 billion in 2004 revenue. We believe China could generate annual industry
revenue of $10 billion within fi ve years, which would make it the world’s third largest direct selling market.
We are in position to garner our share of the vast potential in China. Historically, our company has found strong success in countries with connections to China. Our position in the direct selling industries of Hong Kong and Taiwan leads us
t h e d r a g o n w i n d o w
this window looks out from the stately lingyin temple near hangzhou in eastern china. many windows in china provide a vision that is much more meaningful than just a view of the outside world. look through this window and you will see a chinese dragon—a powerful symbol of good fortune, prosperity, and wisdom.
China has the potential to
rank among the top three
direct selling markets in
the world within the next
fi ve years.


8
to believe that we can generate $300 to $500 million in annual revenue in China within the next fi ve years.
To achieve our potential in China, we will focus on three key initiatives—distributor leadership development, introduction of Pharmanex® products, and geographic expansion. We are making progress in our leadership development efforts as we provide an attractive
opportunity based on our generous compensation structure. Our efforts will enable us to attract new leaders while further developing our current sales leaders in China. We will strengthen our product offering as we introduce Pharmanex® products and the Pharmanex® BioPhotonic Scanner in our stores during the fi rst half of 2005. Finally, we expect to open 80 to 100 new stores in 2005. Based on these projections, we will have operations spread through-out the country in approximately 80 cities by the end of the year.
In China, we know we are building on uncommon ground. We have harnessed the unique strengths that the market has to offer, and are now realizing our enormous poten-tial in this country.
t h e c h i n a m a p
l e g e n d
★ store locations—2003–2004.2003–2004.
★ projected store locations—2005.2005.
red areas—no stores at the end of 20042004. scheduled expansion in 20052005.
blue areas—stores operating at the end of 20042004.scheduled expansion in 20052005.
we currently operate more than 120120 stores in 3939 cities in china. to build a strong foundation for expanded business operations and to reach more people, we plan to open 8080 to 100100 new
stores in large cities throughout china in 20052005. the map on the facing page shows where we now operate stores and where we plan to open stores in 20052005.
By the end of 2005, we
expect to have operations
in approximately 80
cities throughout China.


Red Square

11
2004 was a year of solid growth and rich new opportunities.
Our ability to adapt our business model for different regulatory and cultural environments extends beyond China. There are also signifi cant direct selling opportunities to be found in Latin America, Eastern Europe, and other parts of Asia. Our efforts to fi ne-tune our business model for developing countries are beginning to produce encouraging results. This is particularly evident in Latin America, where we spent the year making changes to our management team, product mix, compensation plan, and distribution methods. In Mexico, for example, fourth quarter 2004 revenue increased more than 121 percent while the number of new executive distributors grew 149 percent.
We will continue to expand our geographic reach to new markets with tremendous potential—such as Russia, Indonesia, and India. In Russia, direct selling has grown about
400 percent since 2000. We expect to commence operations in Russia by mid-2006. We are also positive about our business prospects for Indonesia and anticipate opening this market in the second half of 2005. The strength of our Asian sales leadership gives us high expectations that Indonesia will be a meaningful market for us.
Our uncommon vision broadens our perspective on the world. It allows us to identify market potential and adapt our business model to establish a foundation for growth.
s t. b a s i l ’ s c a t h e d r a l
commissioned in 15551555 by the tsar, st. basil’s cathedral has stood in moscow for more than four centuries as a symbol of russia’s strength and rich cultural heritage. we see great potential to build a solid foundation for growth in russia as we prepare to commence operations there.
We are focused on rapidly
developing markets that
show tremendous potential.

Fountainto be shot end of Feb

13
Powerful Solutionswe channel streams of innovation into reservoirs of
compelling products and business opportunities.
W E ARE CONSTANTLY FILLING OUR INNOVATION
RESERVOIRS. Our uncommon vision lets us see how key scientifi c advances, consumer needs, and a vibrant distribution channel can come together to create powerful consumer solutions. Our global distributor reach, combined with our worldwide network of scientists and research facilities, gives us tremendous insight into untapped opportunities—and access to the most advanced techniques and knowledge in our industries. Our innovation network is opening the fl oodgates to new products and tools that are revolutionizing the way we do business.
t h e f o u n t a i n
with many streams flowing together, we are constantly filling our reservoirs of innovation. see it for yourself. stop and watch a fountain in a city plaza, in a park, or in a garden, and you will see a powerful symbol of perpetual renewal.

14
T he pharmanex ® biophotonic scanner givesus a unique position in the nutrition industry.When we brought the Pharmanex® BioPhotonic Scanner to the market, we weren’t just introducing a novel invention to the world. We were providing a scientifi cally validated tool that would impact our business by changing the way consumers look at their health and nutrition.
In 1928, an Indian scientist named Chandrasekar Venkat Raman made an important discovery. He found that certain molecules, when exposed to light at specifi c wavelengths, have light-scattering properties. The measurement of these signals is now known in science as Raman spectroscopy. It has allowed scientists to study the molecular composition of a wide range of substances. Raman spectroscopy was a scientifi c breakthrough—so useful that it earned Sir C. V. Raman the Nobel Prize in 1930.
More than 70 years later, a team of researchers at a prominent university developed technology that enabled them to use Raman spectroscopy to measure certain nutrient levels in human tissue. Pharmanex, in conjunction with the research team, applied that technology to a proprietary measurement instrument. That instrument, known as the Pharmanex® BioPhotonic Scanner, uses Raman spectroscopy to measure carotenoid antioxidant levels in the skin—and is the fi rst non-invasive instrument to provide an accurate indication of antioxidant levels.
t h e s c a n n e r
the scanner is a powerful solution that is uniquely positioned in the nutrition industry. pharmanex distributors using the scanner have a compelling consumer proposition. they can demonstrate the effectiveness of lifepak® by challenging customers to get scanned to identify their
current nutritional status, take lifepak® for 3030 to 60 60 days, and then get scanned again to see improvement. and with more than 1.71.7 million scans in the pharmanex database, we can provide measurable proof to customers that lifepak® really works.
In 2004, the Scanner helped increase the Pharmanex
business by 36 percent in the United States.

3d Scannershot in Feb

17
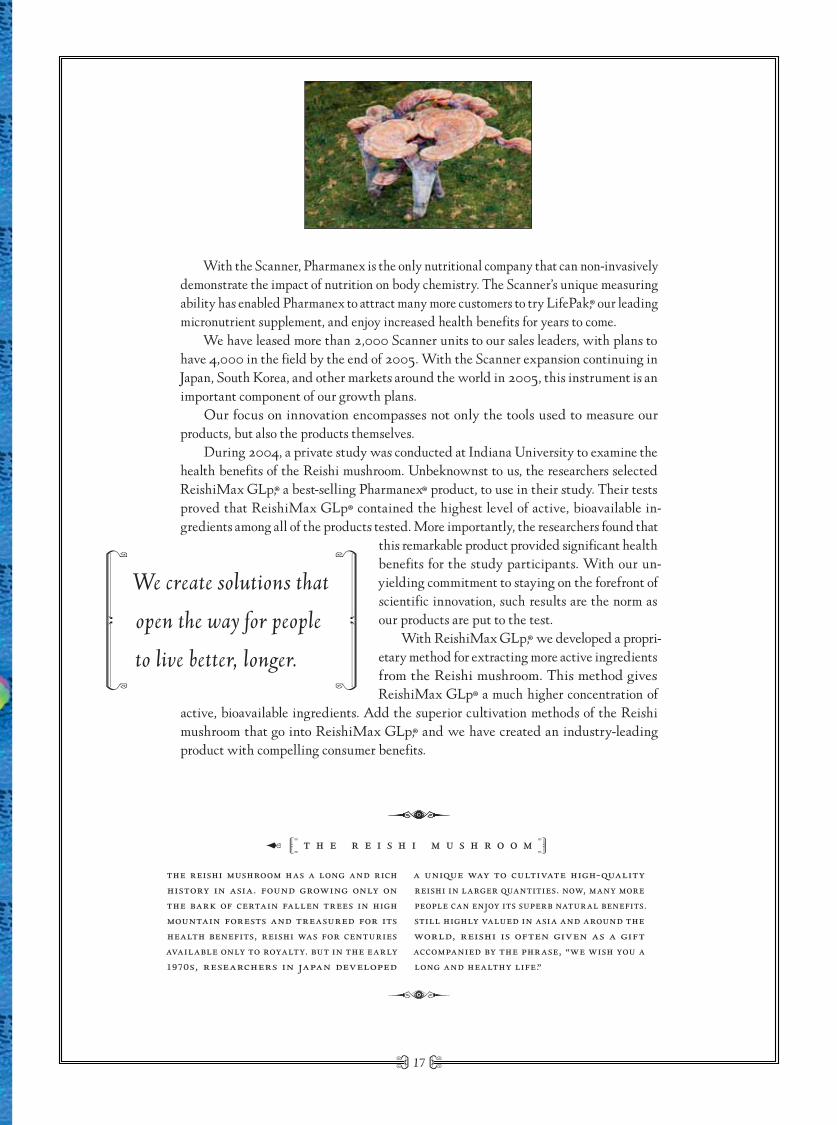
With the Scanner, Pharmanex is the only nutritional company that can non-invasively demonstrate the impact of nutrition on body chemistry. The Scanner’s unique measuring ability has enabled Pharmanex to attract many more customers to try LifePak,® our leading micronutrient supplement, and enjoy increased health benefi ts for years to come.
We have leased more than 2,000 Scanner units to our sales leaders, with plans to have 4,000 in the fi eld by the end of 2005. With the Scanner expansion continuing in Japan, South Korea, and other markets around the world in 2005, this instrument is an important component of our growth plans.
Our focus on innovation encompasses not only the tools used to measure our products, but also the products themselves.
During 2004, a private study was conducted at Indiana University to examine the health benefi ts of the Reishi mushroom. Unbeknownst to us, the researchers selected ReishiMax GLp,® a best-selling Pharmanex® product, to use in their study. Their tests proved that ReishiMax GLp® contained the highest level of active, bioavailable in-gredients among all of the products tested. More importantly, the researchers found that
this remarkable product provided signifi cant health benefi ts for the study participants. With our un-yielding commitment to staying on the forefront of scientifi c innovation, such results are the norm as our products are put to the test.
With ReishiMax GLp,® we developed a propri-etary method for extracting more active ingredients from the Reishi mushroom. This method gives ReishiMax GLp® a much higher concentration of
active, bioavailable ingredients. Add the superior cultivation methods of the Reishi mushroom that go into ReishiMax GLp,® and we have created an industry-leading product with compelling consumer benefi ts.
t h e r e i s h i m u s h r o o m
the reishi mushroom has a long and rich history in asia. found growing only on the bark of certain fallen trees in high mountain forests and treasured for its health benefits, reishi was for centuries available only to royalty. but in the early 19701970s, researchers in japan developed
a unique way to cultivate high-quality reishi in larger quantities. now, many more people can enjoy its superb natural benefits. still highly valued in asia and around the world, reishi is often given as a gift accompanied by the phrase, “we wish you a long and healthy life.”
We create solutions that
open the way for people
to live better, longer.
18
ReishiMax GLp® is just another example of the many products we make that have been demonstrated to be effective by peer-reviewed clinical studies. In 2004 alone, Pharmanex® products were part of nine human clinical studies, 28 experimental studies, and 19 scientifi c publications.
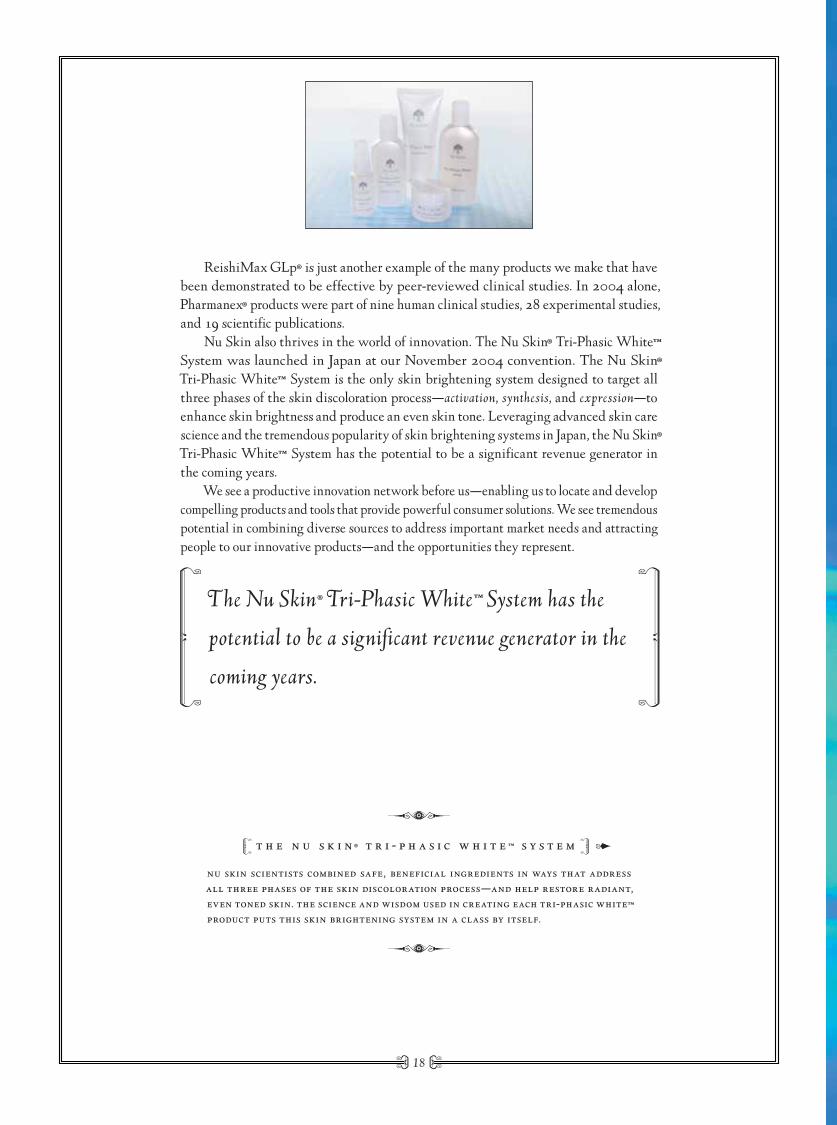
Nu Skin also thrives in the world of innovation. The Nu Skin® Tri-Phasic White™ System was launched in Japan at our November 2004 convention. The Nu Skin® Tri-Phasic White™ System is the only skin brightening system designed to target all three phases of the skin discoloration process—activation, synthesis, and expression—to enhance skin brightness and produce an even skin tone. Leveraging advanced skin care science and the tremendous popularity of skin brightening systems in Japan, the Nu Skin® Tri-Phasic White™ System has the potential to be a signifi cant revenue generator in the coming years.
We see a productive innovation network before us—enabling us to locate and develop compelling products and tools that provide powerful consumer solutions. We see tremendous potential in combining diverse sources to address important market needs and attracting people to our innovative products—and the opportunities they represent.
t h e n u s k i n ® t r i - p h a s i c w h i t e ™ s y s t e m
nu skin scientists combined safe, beneficial ingredients in ways that address all three phases of the skin discoloration process—and help restore radiant, even toned skin. the science and wisdom used in creating each tri-phasic white™ product puts this skin brightening system in a class by itself.
The Nu Skin® Tri-Phasic White™ System has the
potential to be a signifi cant revenue generator in the
coming years.

Tri-Phasicshoot in Feb


21
Greater Profi tabilityour sights are set on improving shareholder value by
delivering sustained double-digit earnings per share growth.
I N ORDER TO INCREASE SHAREHOLDER VALUE, we must continually improve our business practices. This is why we have
a goal to increase our operating margin to 14–15 percent over the next fi ve years as we grow our revenue. To achieve this goal, we will improve processes, increase operating effi ciencies, and invest our cash wisely to drive profi tability and increase shareholder value.
t h e w a t e r w h e e l
this noria-style water wheel is a simple yet powerful symbol of efficiency. based on designs developed by the ancient persians, this wheel uses the strong flow of a river or canal to turn itself—all the while lifting water out of the stream to supply an aqueduct. the fresh water is then diverted down smaller channels to satisfy many of the water needs of an entire community.

22
We are focusing our efforts on three key areas to achieve our profi tability target. Our fi rst area of focus is to reduce product costs by bringing additional manufacturing in-house. In establishing our operations in China, we built manufacturing facilities to meet regulatory guidelines. Our experience to date has been positive—realizing signifi cant savings on products we manufacture for our China business. We have a state-of-the-art manufacturing facility located just outside of Shanghai that is producing our personal care products. And we are putting the fi nishing touches on a new extraction and encapsulation plant for our nutritional product line.
Because of cost effi ciencies in China, we are able to employ extensive quality processes and enjoy signifi cant manufacturing fl exibility at less than our historical cost. We are currently planning the construction of an additional facility in China that will have suffi cient capacity to enable us to export our nutritional products. As a result, we can realize signifi cant reductions in product costs in the future.
Our second area of focus is to further improve our operational effi ciencies. As we have focused more attention on improving distributor and customer retention, we have
seen signifi cant increases in our product sub-scription programs. Customers who establish product subscription orders generally remain active longer than customers who do not. In addition to improving retention, we are expe-riencing improved effi ciencies by reducing order processing costs on each order. In December 2004, we fi lled approximately 370,000 product subscription orders, representing 31 percent of
December’s revenue. We expect that percentage to grow to 35–40 percent in 2005. We are confi dent that we can continue to leverage our subscription and Internet ordering programs to enhance effi ciency and improve our operating margins.
W e are focused on generating increased profitability.
In December 2004, we fi lled
approximately 370,000
product subscription orders.


24
Finally, we are focusing our attention on breaking even in our unprofi table markets in Latin America and Europe. While local profi tability in our larger markets is consistently healthy, these smaller markets in Latin America and Europe have negatively impacted our earnings per share in the last several years. In 2004, we made adjustments in the form of value-oriented product lines, compensation plan changes, and new management in these markets to drive revenue and improve margins. Now that these changes are in
place, we believe we have established a pathway to profi tability. We see great potential in these smaller markets and are confi dent that they can and will be fruitful assets to our continued growth.
Our business model generates healthy cash fl ow. In 2004, we generated $130 million of cash fl ow from operations. Our capital expenditures are directed toward building revenue and profi tability within our markets. We invest cash wisely in promising growth opportunities.
Having demonstrated a positive impact in the United States, we are using our cash to deploy the Pharmanex® BioPhotonic Scanner program globally. During 2005, we will invest $10 to $15 million to double the number of Scanners in our markets around the world.
Likewise, we are preparing to open 80 to 100 more stores in China in 2005, representing a $4 to $6 million investment. The construction of margin-improving manufacturing facilities in China will require $15 to $20 million of capital in the next two years.
Most signifi cantly, we use our cash to build shareholder value. From 2001 through 2004, we paid $81 million in dividends and repurchased $255 million of stock.
We are committed to delivering sustained double-digit earnings growth in the years to come. By enhancing manufacturing effi ciencies, reaching profi tability in small markets, and returning cash to shareholders, we believe we can consistently improve shareholder value.
From 2001 through
2004, we improved
shareholder value by
paying $336 million
in the form of cash
dividends and stock
repurchases.


27
To Our ShareholdersFor Nu Skin Enterprises, 2004 was a remarkable year. In our 20th year of operations the company achieved several key milestones, including the generation of more than $1 billion in revenue, with many of our most mature markets posting the strongest revenue gains.
Revenue of $1.14 billion represented 15 percent revenue growth for the year, with earnings per share increasing 26 percent, or 19 percent excluding a one-time restructuring charge in 2003. Our return on invested capital improved 270 basis points in 2004 to more than 18 percent. And our average days of inventory on hand was reduced by 14 days in 2004.
We are proud of our operational results and are pleased that our stock price has responded favorably. In fact, our stock price improved 49 percent in 2004. We were gratifi ed to be recognized by the Wall Street Journal in its annual “Best Performers” summary as the number one performing NYSE NYSE stock in the personal care category for not only 2004, but also for the last three- and fi ve-year periods, generating compounded annual growth of 25 percent for the last fi ve years.
Our growth initiatives are paying off. We surpassed one million people scanned with the Pharmanex® BioPhotonic Scanner in 2004, leading to 29 percent of our total revenue being generated through our product subscription programs. With 147 percent growth in our product subscription orders since January 2003, we ended the year with nearly 370,000 orders shipped in December on a subscription basis. The prospect of having at least one million subscription customers is a realistic objective in the next few years.

28
The year also marked the achievement of the goals outlined in our 2003 annual report. In fact, we either met or exceeded each of the six objectives we established for 2004. We accomplished our fi rst objective by BUILDING MOMENTUM IN OUR JAPAN BUSINESSBUILDING MOMENTUM IN OUR JAPAN BUSINESS. Although it took us longer than we had hoped to achieve this goal, in the fourth quarter we posted a strong improvement in revenue trends as well as in our key leading distributor metrics. The launch of the Scanner in November and modifi cations made in our distributor incentives have proven to be effective catalysts to returning positive trends to our Japan business, which we expect to continue in 2005.
We had a great year in Mainland China. Our growth, however, slowed during the second half of the year as we worked through new market dynamics and dealt with a changing regulatory environment. We believe, however, that our business fundamentals are much stronger at the end of the year than they were at the fi rst of the year and that we are poised for renewed sequential quarterly growth in 2005. OUR SECOND GOAL FOR OUR SECOND GOAL FOR THE YEAR WAS TO DOUBLE CHINA REVENUETHE YEAR WAS TO DOUBLE CHINA REVENUE IN IN 2004.2004. WE FAR WE FAR SURPASSEDSURPASSED THIS TARGET THIS TARGET, GROWING REVENUE GROWING REVENUE 179179 PERCENT FROM PERCENT FROM $38$38 TO TO $106$106 MILLION. MILLION.
IN THE UNITED STATES WE POSTED IN THE UNITED STATES WE POSTED 3333 PERCENT REVENUE GROWTH IN OUR COMBINED PERCENT REVENUE GROWTH IN OUR COMBINED NU SKIN AND PHARMANEX BUSINESSNU SKIN AND PHARMANEX BUSINESS, WHICH EXCEEDED OUR STATED GOAL OF WHICH EXCEEDED OUR STATED GOAL OF 2020 PERCENT PERCENT GROWTH.GROWTH. The Scanner, coupled with emphasis on distributor and customer retention, was key to achieving our target in the United States.
ANOTHER OF OUR ANOTHER OF OUR 20042004 GOALS WAS TO REFINE A BUSINESS MODEL FOR EMERGING GOALS WAS TO REFINE A BUSINESS MODEL FOR EMERGING MARKETS LIKE LATIN AMERICA AND EASTERN EUROPEMARKETS LIKE LATIN AMERICA AND EASTERN EUROPE, WHERE WE HAVE NOT YET SEEN WHERE WE HAVE NOT YET SEEN SATISFACTORY LEVELS OF SUCCESS.SATISFACTORY LEVELS OF SUCCESS. Changes to our business model in Latin America included a new product line, revised distributor incentives, and new local management. While all of our Latin American business improved in 2004, we generated the most improvement in Mexico, a very large direct selling market. During the fourth quarter, revenue in Mexico was up 121 percent over the prior-year period. Even more encouraging was to see one of our early success indicators: our executive distributor count up 149
r e v e n u e g r o w t h
( i n m i l l i o n s )
$1,138$986$964
200420032002

29
percent in the market. And at the close of the year, we had more people in qualifi cation to become executive distributors than ever before.
In addition to specifi c revenue goals for our largest markets, OUR FIFTH GOAL WAS OUR FIFTH GOAL WAS TO GROW REVENUE IN ALL OF OUR OTHER MARKETS.TO GROW REVENUE IN ALL OF OUR OTHER MARKETS. We are pleased to report that of the 34 markets that were open at the end of 2003, 28 of them posted year-over-year local currency revenue growth in 2004.
THE FINAL GOAL FOR THE FINAL GOAL FOR 20042004 WAS TO IMPROVE DISTRIBUTOR AND CUSTOMER RETENTION. WAS TO IMPROVE DISTRIBUTOR AND CUSTOMER RETENTION. Again, we generated great results in this area. Traditionally, direct selling companies are better at attracting new customers and distributors than in retaining these individuals for an extended period of time. Our subscription programs are having a dramatic, positive impact on retention. For example, in Hong Kong and Taiwan, where we focused heavily on retention efforts, our six-month distributor retention rates have nearly doubled to more than 60 percent in the past 18 months.
Although we are proud of our efforts in 2004, we begin the new year with renewed enthusiasm and a clear vision for continued growth. Our goal is to become the world’s leading direct selling company. We will reach this goal when we are generating more commission dollars for our sales leaders than any other company in the world generates for their sales leaders. And as we move forward to achieve this objective, our shareholders will be well rewarded.
The foundation for a great 2005 requires a solid performance in each of our key geographies—Japan, China, and the United States. IN JAPAN, OUR LARGEST MARKET, WE IN JAPAN, OUR LARGEST MARKET, WE NEED TO POST LOCAL CURRENCY REVENUE GROWTH.NEED TO POST LOCAL CURRENCY REVENUE GROWTH. To achieve this goal we must con-tinue to effectively execute the Scanner rollout. Based on results since November, we are optimistic that this initiative will yield the desired target. Our Scanner push is directly tied to increases in our subscription customer base and improved customer and distributor retention. Our target is to increase our global sub scriber base 36 percent and to have 500,000 subscribers by year end.
e a r n i n g s p e r s h a r e g r o w t h
$1.07$0.85
$0.78
200420032002

30
A great 2005 also requires SEQUENTIAL QUARTERLY REVENUE GROWTH IN CHINA SEQUENTIAL QUARTERLY REVENUE GROWTH IN CHINA AS WE MOVE TOWARD NEW REGULATIONS AND HOPEFULLY DIRECT SELLER STATUS THERE.AS WE MOVE TOWARD NEW REGULATIONS AND HOPEFULLY DIRECT SELLER STATUS THERE. While the timeline for the new regulations remains unclear, we expect the regulatory climate to improve in China as the year progresses, and the landscape to become better defi ned. We are confi dent that China will become one of the world’s largest markets for direct sellers. And we’re confi dent that we will begin to realize our potential in the next few years. In the meantime, we are launching key products from our Pharmanex line as well as the Scanner in our stores during the fi rst half of 2005. We anticipate that the new direct selling regulations will require a certain number of stores in each province to qualify for a direct selling license. We intend to get a head start on this requirement by extending our geographic reach. We will add 80 to 100 stores in new cities and provinces as well as in current cities.
We anticipate continued growth in the United States in 2005 and beyond. Our expectation is for the United States to be a $200 million per year market for us within two years. IN IN 20052005, WE EXPECT TO DELIVER MID- TO HIGH-TEENS REVENUE GROWTH, WE EXPECT TO DELIVER MID- TO HIGH-TEENS REVENUE GROWTH by equipping our distributors with the support and materials they need to keep the Scanner central to their business building efforts. In addition, we will continue to innovate in our product offerings and within our business model to reach the direct selling market share we are capable of gaining in the United States.
20052005 WILL ALSO SEE US REACH INTO NEW GEOGRAPHIC MARKETS. WILL ALSO SEE US REACH INTO NEW GEOGRAPHIC MARKETS. Although Indonesia is very much a developing economy, we expect it to make a meaningful contribution to our top line in its fi rst year of operations. We anticipate opening this market in the second half of 2005. We continue to consider Eastern European markets. We recently opened Israel and Hungary with a view to leveraging human resources in these markets throughout Eastern Europe. Russia, in particular, holds great potential for direct sellers. Down the road, we expect India to also be a signifi cant market for us.
c h i n a r e v e n u e g r o w t h
( i n m i l l i o n s )
$106
$38
20042003

31
We are very optimistic about the work being done within each of our divisions on new products and services. In the upcoming months you will see us take bold steps toward accomplishing our objective to become the world’s leading direct selling company with signifi cant new product introductions and continued enhancements to the way we motivate our distributors. Direct selling is a dynamic and growing channel and we are focused on remaining the innovation leader within this industry.
In 2005 we expect to see continued revenue growth, resulting in double-digit earnings per share growth. By the end of the year we expect to have more than one million active distributors, 35,000 executive distributors, and 500,000 monthly subscription orders.
As we look beyond 2005 we see a very bright future for the company and our shareholders. Our goal is to become the world’s leading direct selling company. Our ability to reach this level of success rests upon three key factors: 1) developing solid distributor leaders by continuing to attract and retain the highest caliber sales force in the direct selling industry; 2) continuing to be innovative in our product offerings and direct selling business model; and 33) investing our cash wisely to increase revenue growth and drive improved profi tability.
Ours is a unique business that requires uncommon vision. A world of opportunity lies right before our eyes. Today, our greatest challenge is focusing our vision and our energy on the elements that will enable us to reach our potential. We are committed to doing just that. Our management team and our sales leaders in each of our markets share this uncommon vision—a vision that will enable our company to continue to succeed in dynamic markets around the world. We hope you see what we see, and believe as we do—that our journey has just begun.
Blake M. Roney, Chairman M. Truman Hunt, President and CEO

32
t a b l e o f c o n t e n t s
selected consolidated fi nancial data . . . . . . . . . . . . . . . . . 33
management’s discussion and analysis . . . . . . . . . . . . . . . . . 34
consolidated balance sheets . . . . . . . . . . . . . . . . . . . . . . 52
consolidated statements of income . . . . . . . . . . . . . . . . . . 53
consolidated statements of stockholders’ equity . . . . . . . . . . 54
consolidated statements of cash fl ows . . . . . . . . . . . . . . . . 56
notes to consolidated fi nancial statements . . . . . . . . . . . . . 57
report of independent registered public accounting fi rm . . . . . . . . . . . . . . . . . . . 72
management report on internalcontrol over fi nancial reporting . . . . . . . . . . . . . . . . . . . 73