Embed Size (px)
Citation preview

User’s Guide
International Stormwater Best Management Practices Database
Data Entry Spreadsheets
Release Version 2.0
Prepared by Wright Water Engineers, Inc.
GeoSyntec Consultants
Under Support From Water Environment Research Foundation
American Society of Civil Engineers Environment and Water Resources Institute
U.S. Environmental Protection Agency Federal Highway Administration
American Public Works Association
December 2007
Version 2.0 Page i December 2007
Table of Contents
DISCLAIMER .................................................................................................................. 1 ACKNOWLEDGMENTS AND PROJECT CONTACT INFORMATION .......................... 2 EXECUTIVE SUMMARY ................................................................................................ 3 PROJECT BACKGROUND ............................................................................................ 4
BMP DATABASE ........................................................................................................... 5 BMP MONITORING GUIDANCE .................................................................................... 5 BMP DATABASE STRUCTURE AND RELATIONSHIPS TO SPREADSHEETS.......... 6 BRIEF OVERVIEW OF REQUESTED DATA ................................................................. 9 General Test Site Information ....................................................................................................................... 9 Monitored Events .......................................................................................................................................... 9 Watershed (Tributary to BMP) Information ................................................................................................... 9 General BMP Information .............................................................................................................................. 9
Structural BMPs ....................................................................................................................................... 10 Non-structural BMPs ............................................................................................................................... 10 Low Impact Development (LID) Sites ...................................................................................................... 10
Monitoring Stations ..................................................................................................................................... 10 Monitoring Results ...................................................................................................................................... 11
Precipitation ............................................................................................................................................. 11 Flow (Runoff and Base Flow) .................................................................................................................. 11 Water Quality ........................................................................................................................................... 11
DESCRIPTION OF DATA PRIORITY CODES ............................................................. 12 PICK LISTS .................................................................................................................. 12
PART 1. GENERAL TEST SITE INFORMATION ........................................................ 13 1. General Test Site Information ................................................................................................................ 13 2. Test Site/Study Documentation Information .......................................................................................... 14 3. Monitoring and Sponsoring Agencies .................................................................................................... 15 4. Location Information ............................................................................................................................... 16 PART 2. ESTABLISH MONITORED EVENTS ............................................................ 18 5. Monitoring Events .................................................................................................................................. 18 6. Site Monitoring Costs ............................................................................................................................. 18 PART 3. WATERSHED (TRIBUTARY AREA) INFORMATION .................................. 20 7. General Watershed Information ............................................................................................................. 20 8. Roads and Parking Lots in Watershed .................................................................................................. 25
Streets, Roads and Alleys ....................................................................................................................... 25 Parking Lots in Watershed ...................................................................................................................... 26 Highway Data .......................................................................................................................................... 27
9. Land Use ................................................................................................................................................ 27 PART 4. GENERAL BMP INFORMATION .................................................................. 28 10. General BMP Information .................................................................................................................... 28 11. BMP Cost Data .................................................................................................................................... 30 PART 5. MONITORING STATIONS ............................................................................ 32 12. Monitoring Stations .............................................................................................................................. 32
12a. Monitoring Station ID ...................................................................................................................... 32 12b. Monitoring Station Relationships .................................................................................................... 33
13. Site Monitoring Instrumentation ........................................................................................................... 33 PART 6. MONITORING RESULTS (PRECIPITATION, FLOW AND WATER QUALITY) ..................................................................................................................... 35 14. Precipitation Data ................................................................................................................................. 35 15. Flow ...................................................................................................................................................... 36
Release Version 2.0 Page ii December 2007
16. Water Quality Data for Sampling Event ............................................................................................... 38 17. TSS Settling Velocity Distribution ........................................................................................................ 40 PART 7. INDIVIDUAL BMP DESIGN SPREADSHEETS ............................................ 41 18. Detention Basin Design Data ............................................................................................................... 41 19. Retention Pond Design Data ............................................................................................................... 44 20. Grass Filter Strip and Swale Design Data ........................................................................................... 47 20. Grass Filter Strip and Swale Design Data ........................................................................................... 47 21. Media Filter Design Data ..................................................................................................................... 50 22. Porous Pavement Design Data ............................................................................................................ 53 23. Infiltration Basin Design Data ............................................................................................................... 56 24. Percolation Trench and Dry Well Design Data .................................................................................... 59 25. Wetland Channel and Swale Design Data ........................................................................................... 61 26. Wetland Basin Design Data ................................................................................................................. 63 27. Manufactured Device ........................................................................................................................... 66 28. Green Roof ........................................................................................................................................... 68 29. Low Impact Development (LID) ........................................................................................................... 70 30. Non-structural BMPs ............................................................................................................................ 71 31. Other .................................................................................................................................................... 73 PICK LISTS .................................................................................................................. 74 Units of Measure Codes .............................................................................................................................. 75 Test Site, Agency and Location Spreadsheet Codes ................................................................................. 76 Monitoring Event Spreadsheet Codes ........................................................................................................ 77 Watershed, Roads and Parking Lots, and Land Use Spreadsheet Codes ................................................. 78 Land Use Spreadsheet Codes .................................................................................................................... 78 Climate Station Codes ................................................................................................................................ 75 BMP Info Spreadsheet: BMP Type Codes ................................................................................................. 78 Monitoring Station Spreadsheet Codes ...................................................................................................... 79 Instrumentation Spreadsheet Codes .......................................................................................................... 79 Water Quality Spreadsheet Codes ............................................................................................................. 80 Water Quality Spreadsheet Commonly Reported Characteristic (Water Quality Constituent) Codes ....... 83 Non-structural BMP Spreadsheet Type Codes ........................................................................................... 86

International Stormwater BMP Database Data Entry Spreadsheets User’s Guide
Release Version 2.0 Page 1 December 2007
Disclaimer
The BMP Database (―Database‖) was developed as an account of work sponsored by the Water Environment Research Foundation (WERF), the American Society of Civil Engineers (ASCE)/Environmental and Water Resources Institute (EWRI), the American Public Works Association (APWA), the Federal Highway Administration (FHWA), and U.S. Environmental Protection Agency (USEPA) (collectively, the ―Sponsors‖). The Database is intended to provide a consistent and scientifically defensible set of data on Best Management Practice (―BMP‖) designs and related performance. Although the individuals who completed the work on behalf of the Sponsors (―Project Team‖) made an extensive effort to assess the quality of the data entered for consistency and accuracy, the Database information and/or any analysis results are provided on an ―AS-IS‖ basis and use of the Database, the data information, or any apparatus, method, or process disclosed in the Database is at the user’s sole risk. The Sponsors and the Project Team disclaim all warranties and/or conditions of any kind, express or implied, including, but not limited to any warranties or conditions of title, non-infringement of a third party’s intellectual property, merchantability, satisfactory quality, or fitness for a particular purpose. The Project Team does not warrant that the functions contained in the Database will meet the user’s requirements or that the operation of the Database will be uninterrupted or error free, or that any defects in the Database will be corrected.
UNDER NO CIRCUMSTANCES, INCLUDING CLAIMS OF NEGLIGENCE, SHALL THE SPONSORS OR THE PROJECT TEAM MEMBERS BE LIABLE FOR ANY DIRECT, INDIRECT, INCIDENTAL, SPECIAL, OR CONSEQUENTIAL DAMAGES INCLUDING LOST REVENUE, PROFIT OR DATA, WHETHER IN AN ACTION IN CONTRACT OR TORT ARISING OUT OF OR RELATING TO THE USE OF OR INABILITY TO USE THE DATABASE, EVEN IF THE SPONSORS OR THE PROJECT TEAM HAVE BEEN ADVISED OF THE POSSIBILITY OF SUCH DAMAGES.
The Project Team’s tasks have not included, and will not include in the future, recommendations of one BMP type over another. However, the Project Team's tasks have included reporting on the performance characteristics of BMPs based upon the entered data and information in the Database, including peer reviewed performance assessment techniques. Use of this information by the public or private sector is beyond the Project Team’s influence or control. The intended purpose of the Database is to provide a data exchange tool that permits characterization of BMPs solely upon their measured performance using consistent protocols for measurements and reporting information.
The Project Team does not endorse any BMP over another and any assessments of performance by others should not be interpreted or reported as the recommendations of the Project Team or the Sponsors.

International Stormwater BMP Database Data Entry Spreadsheets User’s Guide
Release Version 2.0 Page 2 December 2007
Acknowledgments and Project Contact Information Project Manager: Jeff Moeller, P.E., Water Environment Research Foundation Principal Investigators: Jonathan Jones, P.E, Wright Water Engineers, Inc. Eric Strecker, P.E., Geosyntec Consultants Project Staff/Contacts for More Information: Jane Clary, Project Coordinator, Wright Water Engineers, Inc. Marcus Quigley, P.E., Project Manager-Data Analysis, Geosyntec Consultants John O'Brien, Project Software Engineer, Wright Water Engineers, Inc. Project Steering Committee: Patricia A. Cazenas, Office of Natural and Human Environment, Federal Highway Administration (FHWA) Colene Vogel, American Public Works Association (APWA) Brian Parsons, P.E., Environmental and Water Resources Institute of American Society of Civil Engineers (EWRI-ASCE) Eric Strassler, U.S. Environmental Protection Agency Office of Water/Office of Science & Technology (USEPA) Project Sub Committee: Richard Tveten, Chairperson, Washington State Department of Transportation (WSDOT) Ben Urbonas, P.E., Former Chairperson, Urban Drainage and Flood Control District (UDFCD) Michael E. Barrett, Ph.D., P.E., Center for Research in Water Resources, University of Texas Bob Carr, P.E., Water Resources Modeling American Public Works Association (APWA) David R. Graves, Environmental Analysis Bureau, New York State Dept. of Transportation Gregory E. Granato, U.S. Geological Survey (USGS) Jesse Pritts, P.E., Engineering and Analysis Division Office of Water/Office of Science & Technology, USEPA Other: Shaw L. Yu, P.E., Ph.D., Former Project Sub Committee member, Environmental Engineering Department of Civil Engineering, The University of Virginia Urban Drainage and Flood Control District graciously granted permission to use graphics from the Urban Storm Drainage Criteria Manual, Volume 3.
This database was originally developed as a result of the vision and support of the Urban Water Resources Research Council (UWRRC) of EWRI-ASCE in cooperation with the USEPA Office of Water, Washington, D.C., with Eric Strassler serving as USEPA Project Officer and Carol Bowers serving as ASCE Project Manager.

International Stormwater BMP Database Data Entry Spreadsheets User’s Guide
Release Version 2.0 Page 3 December 2007
Executive Summary
In 1999, the Urban Water Resources Research Council of the American Society of Civil Engineers and the U.S. Environmental Protection Agency released Version 1.0 of the National Stormwater BMP Database software in CD format. The database software contained a Data Entry Module and a Data Retrieval Module using a Microsoft Access platform. Since that time, dramatic changes in software and the Internet have occurred that have necessitated changes to the format of the originally released product. As a result, the Project Team, now supported by a coalition of organizations led by the Water Environment Research Foundation (WERF), has released Data Entry Spreadsheets for use by researchers and data providers. These spreadsheets are similar to the structure and data elements contained in the original database, but allow more flexibility for database users in a familiar Excel format. The spreadsheets should be used for submissions of the data to the Stormwater BMP Database.
Although the spreadsheet package contains 31 spreadsheets for data entry, most users typically require less than half of these to enter their data. For example, fourteen of the spreadsheets request BMP-specific design information for various BMP types; therefore, if only one BMP type is present, then only one of these 14 BMP design spreadsheets would need to be completed (in combination with other test site and monitoring data). Additionally, several of the spreadsheets are associated with optional information such as cost data and supplemental watershed characteristics, which are useful but not required for a complete study submission. Additionally, users are encouraged to paste water quality data from their laboratory’s electronic data deliverable (EDD) formats into the water quality spreadsheet to decrease data entry time and errors.
This User’s Guide provides a general overview of the BMP Database structure and descriptions of the information requested in the spreadsheets. For more information on the project and for BMP data analysis results, go to www.bmpdatabase.org.
To be placed on an e-mail notification list when revisions are made to these spreadsheets, please send your contact information to [email protected].

International Stormwater BMP Database Data Entry Spreadsheets User’s Guide
Release Version 2.0 Page 4 December 2007
Project Background
In the 1990's as required by the Clean Water Act, the U.S. Environmental Protection Agency (USEPA) mandated that most municipalities in the United States with populations larger than 10,000 obtain a stormwater runoff discharge permit. One of the requirements of this permit program is the use of non-structural and structural best management practices (BMPs) appropriate to reduce pollutants to the Maximum Extent Practicable (MEP). In response to this program, communities need to know which types of BMPs are appropriate for them (e.g., which BMPs function best in cold climates or in areas of heavy rainfall) and how to monitor the performance of the BMPs they select to ensure they function properly. However, a centralized, easy-to-use, scientifically sound tool for assessing the appropriateness of BMPs under a variety of site conditions was lacking. In addition, BMP studies in the literature had not historically followed standardized or transferable data collection, reporting and performance evaluation protocols, making a scientific and consistent evaluation of these data difficult to impossible.
In response to this problem, the International Stormwater BMP Database project (first known as the National BMP Database) began in 1996 through the efforts of a team of experts from the Urban Water Resources Research Council (UWRRC) of the American Society of Civil Engineers (ASCE) under a grant from the USEPA. The original principal investigators for the project were:
Ben Urbonas, P.E., Urban Drainage and Flood Control District Eric Strecker, P.E., Geosyntec Consultants Jonathan Jones, P.E., Wright Water Engineers, Inc.
The project's original long-term goal, which remains the central focus of the project, is to gather transferable technical design and performance information to improve BMP selection and design so that local stormwater problems can be cost-effectively addressed. Original project tasks included:
1. Develop a set of recommended monitoring and reporting protocols for BMP monitoring studies.
2. Design and create a national stormwater BMP database.
3. Collect existing BMP design and performance data, evaluate it to ascertain if it could meet the protocols and, if so, enter the data into the BMP Database.
4. Develop a recommended data evaluation approach.
5. Evaluate the data entered into the database and report initial findings.
A companion project to develop a detailed stormwater BMP monitoring guidance emerged when it became apparent that much of the available BMP data was of limited value due not only due to inconsistent BMP monitoring and reporting protocols, but also due to actual monitoring procedures.
The analysis of the BMP studies contained in the database has been updated periodically, as more studies have been submitted to the database. Two ―flat file‖ spreadsheets containing a summary of monitoring data and a summary of analyses results are available on the project web site www.bmpdatabase.org, along with PDF files for each individual BMP and cumulative analysis reports for the overall data set.

International Stormwater BMP Database Data Entry Spreadsheets User’s Guide
Release Version 2.0 Page 5 December 2007
In 2004, the project transitioned from a USEPA funded grant project to a more broadly supported coalition of partners including the Water Environment Research Foundation (WERF), ASCE Environmental and Water Resources Institute (EWRI), USEPA, Federal Highway Administration (FHWA) and the American Public Works Association (APWA). Wright Water Engineers, Inc. and Geosyntec Consultants are the entities maintaining and operating the database clearinghouse and web page, answering questions, conducting analyses of newly submitted BMP data, conducting updated performance evaluations of the overall data set, disseminating project findings, and expanding the database to include other approaches such as Low Impact Development techniques. The overall project is being managed by WERF's Jeff Moeller with the support of an expert advisory committee.
BMP Database
The cornerstones of the project are the BMP monitoring and reporting protocols and the BMP Database itself, which were developed based on the input and intensive review of many experts for the purpose of developing standardized reporting parameters necessary for more accurate BMP performance analysis. The database encompasses a broad range of parameters including test site location, watershed characteristics, climate data, BMP design and layout characteristics, monitoring instrumentation, and monitoring data for precipitation, flow and water quality. The database originally consisted of two modules: 1) data entry software for those monitoring BMP performance and 2) a search engine module "loaded" with BMP studies for those researching BMP performance. The database was initially release on a CD in 1999 including these two modules and 71 BMP studies, which were selected from an initial bibliography and review of over 800 reports. A Database User's Guide was developed in tandem with the database.
Although the original CD is still available upon request, the most up-to-date version of the database with roughly 340 BMPs, can be searched on-line or downloaded from the project web site. The on-line version of the database also contains statistical analysis of the BMP data, which is not available on the CD. The Project Team conducts quality assurance review of the BMPs prior to posting them to the site and conducts data analysis using statistical techniques developed during the course of the project. The data entry module of the database has not been modified from its original release on CD in 1999 and is being replaced with the dowloadable data entry spreadsheets that accompany this User’s Guide.
BMP Monitoring Guidance
As a result of reviewing over 800 literature sources on BMP performance, the Project Team identified the need for better guidance on proper monitoring of stormwater BMPs and developed the guidance document: Urban Stormwater BMP Performance Monitoring - A Guidance Manual for Meeting the National Stormwater BMP database Requirements. The manual is intended to help achieve stormwater BMP monitoring project goals through the collection of more useful and representative rainfall, flow, and water quality information. Many of the recommended protocols (particularly those for reporting monitoring, watershed, and design information) are directly related to requirements of the Stormwater BMP Database. However, the manual is intended to improve the state of the practice by providing a recommended set of protocols and standards for collecting, storing, analyzing, and reporting BMP monitoring data that will lead to better understanding of the function, efficiency, and design of urban stormwater BMPs. This manual provides insight into and guidance for strategies, approaches, and techniques that are appropriate and useful for monitoring BMPs. The manual focuses primarily on the collection,

International Stormwater BMP Database Data Entry Spreadsheets User’s Guide
Release Version 2.0 Page 6 December 2007
reporting, and analysis of water quantity and quality measurements at the heart of quantitative BMP efficiency projects. To download BMP Monitoring Guidance, go to www.bmpdatabase.org.
BMP Database Structure and Relationships to Spreadsheets
The International Stormwater BMP Database is stored in Microsoft Access and includes multiple tables that can be linked together by key fields such as Test Site I.D., Watershed I.D., Event I.D., BMP I.D., and Monitoring Station I.D. A simplified overview of the general relationships between various types of requested data are provided in Figure 1 at a conceptual level. A detailed Element-Relationship (E-R) Diagram can be downloaded separately from this User’s Guide for more detailed information.
Figure 1. Conceptual Overview of BMP Database
Primary linkages between tables in the master database (back-end to which the spreadsheets are uploaded) are described below:
Test Site links to Study Documents, Agencies (sponsoring or monitoring the study), Location, Watershed, Monitoring Station, Monitoring Event, and Monitoring Costs on the field SITENAME.
Watershed links to Land Use and BMP Info (formerly called ―Struct Info‖ in previous database releases) on the field WSNAME (which is watershed name).
BMP Info links BMP Costs, and all of the design tables for the various BMPs on the field BMPNAME (which is the name of the BMP). The BMP tables include grassfilter, infiltrationbasin, mediafilter, porouspavement, retentionpond, structbasin (detention basin), wetlandchannel, percolationtrench, structwetland (wetland basin), hydrodevices (manufactured devices), greenroof, LID, other and nonstructural.
Monitoring Station links to BMP Info, Instruments, and each of the monitoring data tables (precip, flow, water quality, settling velocity) on the field MSName.
Monitoring Event links to Test Site and Precipitation, Flow, Water Quality and Settling Velocity on the field Event # (which is user-assigned event number). Events are included at the Test Site level so that all events monitored at a test site can be easily paired together.

International Stormwater BMP Database Data Entry Spreadsheets User’s Guide
Release Version 2.0 Page 7 December 2007
Precipitation, Flow, Water Quality and TSS Velocity each link to Event to enable pairing of data for a particular monitoring event. Each of these tables also links to Monitoring Station to identify the relationship (e.g., inflow, outflow) of the data to the BMP.
In addition to the primary linkages described above, many of the key fields are ―carried‖ throughout the tables to increase user friendliness when querying data.
The Excel worksheets are designed to be compatible with the master BMP database described above, with the underlying Access tables organized into a series of Excel worksheets as described in Table 1.

International Stormwater BMP Database Data Entry Spreadsheets User’s Guide
Release Version 2.0 Page 8 December 2007
Table 1. Relationship Between Excel Worksheets and Master Database
Excel Worksheet Name Access Database Table Name
PART 1. GENERAL TEST SITE INFORMATION
1. General Test Site Information TESTSITE
2. Test Site/Study Documentation Information DOCUMENTS
3. Monitoring and Sponsoring Agencies AGENCY
4. Location Information LOCATION
PART 2. ESTABLISH MONITORED EVENTS
5. Monitoring Events EVENT
6. Site Monitoring Costs MONITORINGCOSTS
PART 3. WATERSHED (TRIBUTARY AREA) INFORMATION
7. General Watershed Information WATERSHEDINFO
8. Roads and Parking Lots in Watershed WATERSHEDINFO
Streets, Roads and Alleys WATERSHEDPARKINGLOT
Parking Lots in Watershed WATERSHEDPARKINGLOT
Highway Data WATERSHEDPARKINGLOT
9. Land Use LANDUSE
PART 4. GENERAL BMP INFORMATION (required for all sites)
10. General BMP Information BMPINFO
11. BMP Cost Data BMPCOST
PART 5. MONITORING STATIONS
12a. Monitoring Station ID MONITORINGSTATIONDEF
12b. Monitoring Station Relation MONITORINGSTATION
13. Site Monitoring Instrumentation INSTRUMENTS
PART 6. MONITORING RESULTS (PRECIPITATION, FLOW AND WATER QUALITY)
14. Precipitation Data PRECIPITATION
15. Flow FLOW
16. Water Quality Data for Sampling Event WQDATA
17. TSS Settling Velocity Distribution TSSVELOC
PART 7. INDIVIDUAL BMP DESIGN SPREADSHEETS
18. Detention Basin Design Data STRUCTBASIN S02d
19. Retention Pond Design Data RETENPOND S02r
20. Grass Filter Strip and Swale Design Data GRASSFILTER S02g
21. Media Filter Design Data MEDIAFILT S02f
22. Porous Pavement Design Data POROUSPAV S02p
23. Infiltration Basin Design Data INFBASINS S02i
24. Percolation Trench and Dry Well Design Data TRENCH S02t
25. Wetland Channel and Swale Design Data STRUCTWETL S02c
26. Wetland Basin Design Data WETLANDBAS S02w
27. Manufactured Device HYDRODYNAMIC S02*
28. Green Roof GREEN ROOF
29. Low Impact Development (LID) LID
30. Non-structural BMPs NONSTRUCT INFO N02
31. Other OTHER *Note: Manufactured devices were named hydrodynamic devices in previous database releases.

International Stormwater BMP Database Data Entry Spreadsheets User’s Guide
Release Version 2.0 Page 9 December 2007
Brief Overview of Requested Data
In keeping with Figure 1 and Table 1, which provide an overview of the overall database structure, a brief description of each general data category in the database follows.
General Test Site Information
The purpose of the general Test Site data set is to identify the study, its location, involved parties and cost of monitoring for the study. Additionally, the study documents spreadsheet enables the user to attach supporting information such as links to published studies, quality assurance plans, photos, BMP and site layouts and other information. Climate information is also entered at the Test Site level based on an EPA-sponsored report by Driscoll et al. (1990) Analysis of Storm Event Characteristics for Selected Rainfall Gages Throughout the United States. The user simply selects the closest climate station from a pick list provided in the data entry spreadsheet.
Only one Test Site can be entered in each spreadsheet package.
Monitored Events
The purpose of the Monitoring Event table is to develop a user-defined list of events monitored at the test site so that precipitation, flow and water quality data can easily be paired together. Events are defined at the test site level since most monitoring designs will monitor the same events at reference watersheds and multiple BMPs may monitor the same events. Additionally, as Low Impact Development studies are integrated into the database in the future, events may be monitored for the test site as a whole rather than at each individual BMP or integrated management practice (IMP).
Watershed (Tributary to BMP) Information
The purpose of the Watershed table is to identify the conditions in the area tributary to the BMP. For example, important factors for successful designs of infiltration-type BMPs include watershed parameters such as soil type, imperviousness, and storm drainage system efficiency. Since initial release of the Database, FHWA and various state departments of transportation have taken interest in the database. As a result, additional information is now being requested for sites located along highways.
More than one watershed may be present at a BMP test site for studies that use a reference (i.e., Control) watershed to compare BMP performance. This approach is often the case for non-structural BMP studies.
General BMP Information
General information and cost data for BMPs are requested for all BMP types, including structural and non-structural BMPs and LID sites. General information requested includes parameters such as date of installation, various design parameters, maintenance and rehabilitation types and frequencies, and cost data.
Multiple BMPs may be present at a single test site, provided that they have the same tributary area. Additionally, for sites using a reference watershed site, a ―Control BMP‖ type must be entered under BMP type to indicate that BMPs are not in place in the watershed. For LID sites

International Stormwater BMP Database Data Entry Spreadsheets User’s Guide
Release Version 2.0 Page 10 December 2007
or other sites with multiple BMPs that are monitored as an overall test site, a ―Composite BMP‖ type must be entered to facilitate data analysis for the site. Design information must still be entered for the individual BMPs at the test site. An overview of the type of information requested for structural, nonstructural and LID sties is provided below.
Structural BMPs
This information must be completed for each structural BMP in a test watershed. The data requested vary according to the following common groups of BMPs: Detention Basins, Manufactured Devices, Retention Ponds, Infiltration Basins, Percolation Trenches/Dry Wells, Porous Pavement, Wetland Basins, Wetland Channels/Swales, Grass Filter Strips, Media Filters, and Green Roofs. An Other BMP category is also provided to enable flexibility for entry of BMPs that may not fit a pre-defined category. Most of the parameters requested in the structural BMP tables are required in order to compare the effectiveness of various BMP designs. All BMP-specific design forms are located at the end of the spreadsheets in the workbook, with each BMP type having a separate worksheet.
Non-structural BMPs
Non-structural BMP data requested are generally narrative/descriptive information on the type and extent of BMP practice being implemented, as well as cost data. Non-structural BMPs have been divided into the general categories of education, maintenance, recycling and source controls. Evaluating non-structural BMP characteristics is new ground for many. Defining measurable (i.e., quantifiable) parameters for non-structural BMPs is an evolving science. When more than one non-structural BMP is employed, it can be extremely difficult, if not impossible, to isolate the effectiveness of one BMP from the effects of other non-structural BMP(s) being tested at the same site. Also, a significant amount of data is needed to discern differences in water quality results between comparable watersheds with and without non-structural BMPs. For this reason, nonstructural BMP testing programs will typically need to take place over more than one year. It is likely that confounding variables will be difficult to identify and to isolate in non-structural BMP tests. The Non-structural BMP design forms are located at the end of the spreadsheets in the workbook, with each BMP type having a separate worksheet.
Low Impact Development (LID) Sites
LID sites attempt to mimic pre-development site hydrologic conditions by controlling runoff close to its source. As a result, BMPs (or IMPs) are typically dispersed throughout a development site. LID is anticipated to be integrated into the BMP Database in the near future; as a result, a placeholder for LID techniques has been provided in this release of the database. Information currently requested for LID is primarily in narrative format and will be significantly revised in future releases of the database. It is envisioned that a ―Composite BMP‖ type will be used to characterize an overall LID site; however, more detailed information on the design and implementation of individual practices at an LID site will also be required.
Monitoring Stations
Monitoring stations must be identified for the test site as a whole, and then the relationship of each monitoring station to each BMP at the test site must be identified as monitoring inflow, outflow, an intermediate location, or identified as not applicable (e.g., for monitoring stations that only measure precipitation). For test sites that contain more than one BMP, two BMPs may share the same monitoring station that monitors the effluent from one BMP that is also the

International Stormwater BMP Database Data Entry Spreadsheets User’s Guide
Release Version 2.0 Page 11 December 2007
influent to a downstream BMP. In such cases, the relationship of the monitoring station must be identified relative to each BMP.1 A unique monitoring station name must be assigned to each monitoring station at a test site.
Information on instruments installed at monitoring stations is also requested. Multiple instruments may be present at a single monitoring station. This information provides much insight into the flow gauging and sampling techniques used and the reliability of the data collected at the site. As a result, instrumentation reporting should be encouraged for all new evaluation efforts
Monitoring Results
Monitoring results may include precipitation, storm runoff or base flow, water quality data, and/or settling velocity distributions associated with a monitoring event. Monitoring results must be reported in association with previously defined monitoring events and monitoring stations. Monitoring results may include a combination of these data sets. For sites also monitoring groundwater levels, the water quality spreadsheet can be used to enter depth to groundwater. Each data set is briefly described below.
Precipitation
Precipitation data such as date and time that the event began and ended, total depth and peak one-hour precipitation rate are useful parameters for evaluating BMP performance. For example, a BMP may perform well for a low-intensity, short duration storm, but perform poorly for storms of longer duration. This type of information can help to explain variations in BMP performance. While absence of precipitation data should not rule out the site from national evaluation, it should be obtained and reported for all new BMP evaluation efforts. If precipitation data are not available, then the date that the storm began should be provided, at a minimum, so that related flow events (e.g., inflow and outflow) can be paired based on storm events.
Flow (Runoff and Base Flow)
Storm runoff directly affects the hydraulics of BMPs. Base flow data are also useful to understand the type of pollutant loading that occurs under dry weather conditions. Types of runoff data requested include runoff volumes into, from or bypassing the BMP, and peak flow rates. Base flow data requested include flow rates.
Water Quality
Water quality data in combination with flow data for a monitoring event are used to calculate loads of each constituent, which are fundamental for comparing the performance of BMPs at different sites, locations and regions. The water quality data entry format in the 2007 release of the spreadsheets has been updated to be compatible with many Electronic Data Deliverable (EDD) formats now offered by laboratories and is generally based on EPA’s Water Quality Exchange (WQX) format, using ―Modern‖ STORET terminology2. The spreadsheet data entry
1 Prior to 2007, a monitoring station “matrix” approach was used so that shared monitoring stations were only entered into the
database once; however, this approach made data analysis more complicated for database end-users conducting data analysis.
Two spreadsheets (12a-b) are now used to define monitoring station information for the test site.
2 Pre-2007 releases of the Database were based on STORET “Legacy” terminology and formats, which many users found
confusing. The historic data contained in the Database will be converted to the “Modern” STORET.

International Stormwater BMP Database Data Entry Spreadsheets User’s Guide
Release Version 2.0 Page 12 December 2007
approach enables pasting of EDDs into the database, thereby reducing the likelihood of data entry errors.
Particle size distribution data, which are important to evaluating the performance of many types, can be entered into the water quality data table using WQX codes provided in a pick-list.
Description of Data Priority Codes
In order to enable meaningful analysis of BMP data, a fairly large amount of information is requested in the spreadsheet package. These data requests are prioritized as ―required,‖ ―essential, but not required‖ or ―nice to have.‖ The priority level for each field is color coded in the spreadsheets according to these three priority levels:
Required: ―Required‖ data are necessary for proper evaluation and comparison of BMP data. If these data are not provided, then the BMP study will be flagged as "incomplete record." Examples of required data include: identification of monitoring station locations relative to BMPs, certain design parameters for structural BMPs, and watershed area. Required fields are color-coded in blue in the spreadsheets.
Essential: ―Essential data‖ are also necessary for proper evaluation and comparison of BMP data. If these data are currently unavailable, they should be collected in future monitoring efforts. The absence of "essential" data will not cause the test record to be flagged as incomplete. Many of the watershed parameters fall into this category. For example, soil types and vegetation types present in a watershed are important factors that influence runoff quality and quantity; however, meaningful evaluation of the effectiveness of a BMP can still occur without knowing this information. Essential fields are color-coded in purple in the spreadsheets.
Nice to Have: ―Nice to have‖ fields provide data that are useful in BMP evaluation but not essential for BMP evaluation. For example, several forms request installation and maintenance cost data. Required fields are color-coded in yellow in the spreadsheets.
Variable: ―Variable‖ fields, typically in the Watershed table spreadsheets, identify data sets that are required for some BMP types, but not others.
Pick Lists
Some fields in the spreadsheet require that entries conform to pre-established ―pick lists‖. The pick lists are provided in drop-down boxes on the individual spreadsheets, as well as below the data entry form (in some cases) for most spreadsheets. Exceptions include the ―Units‖ pick list provided on a separate worksheet at the beginning of the spreadsheet package and independent worksheets (16a &b) for the water quality data. Drop-down pick-list boxes for the water quality data spreadsheet were not provided to enable pasting of Electronic Data Deliverables into the spreadsheet. The user is encouraged to print-out the Units pick list and the water quality pick lists (16 a&b) for reference during data entry.

International Stormwater BMP Database Data Entry Spreadsheets User’s Guide
Release Version 2.0 Page 13 December 2007
Part 1. General Test Site Information
Three general information worksheets and one set of document attachments must be completed for each test site. These spreadsheets request information on test site location, sponsoring and monitoring agencies/entities, location information, and documents associated with the study or test site. Only one test site is allowed per spreadsheet package, although the single test site may include multiple BMPs if the tributary watersheds to the BMPs are approximately the same, as shown in Figure 2. In Figure 2, where the watershed areas between the two BMPs differ significantly (i.e., 50 versus 100 acres), separate test sites would be created even though the BMPs are in series. In future revisions to the Database, an exception to this rule may occur when an LID site is being monitoring that includes multiple IMPs (BMPs) and a ―Composite BMP‖ is provided for the overall site.
Figure 2. Test Site Definition Example (for Non-LID Monitoring Studies)
Watershed #2=
100 acres
Watershed #1
= 50 acres
BMP 1
BMP 1
Watershed
#1=75 acres
BMP 2
BMP 1
2 Test Sites1 Test Site
Test Site 2
Test Site 1
1. General Test Site Information
The purpose of the BMP General Test Site Information data is to identify the test location. The location information is important for a variety of reasons. For example, it enables recognition of the types of conditions under which the BMP test is conducted (e.g., Seattle = lots of low intensity rain much of the year, Phoenix = few high intensity storms). This information also enables interface with other EPA databases. Data requested as part of General Test Site Information are described below.
Test Site Name is the name that the site is known by locally (e.g., Shop Creek, First Bank). A test site is a unique geographic location where a BMP testing effort has been conducted. The site may contain more than one BMP, but ONLY if the watersheds tributary to these BMPs are virtually identical. In cases where several BMPs are located in the same general vicinity, new

International Stormwater BMP Database Data Entry Spreadsheets User’s Guide
Release Version 2.0 Page 14 December 2007
test sites should be identified whenever the tributary watersheds for the BMPs differ by more than five percent in area, even if the BMPs are in series. Proper understanding of the definition of a test site is paramount to proper entry of data into the database and later data analysis. BMP test site name is required information for the BMP test to be recorded in the database.
City closest to the test site. The site does not have to be within the city limits. This is required information.
County in which test site is located. Although not essential, this information is nice to have if available.
State where test was performed (2 characters). This is required information.
Zip Code of the test site. This is required information.
Country where the test site is located (2 characters). This is required information.
Site Elevation is the elevation above mean sea level provided to the nearest 100 feet from a U.S. Geological Survey quadrangle map or to the nearest 30 meters for studies outside of the United States. Units of measurement must be selected from the provided pick list. This is required information.
Unit System Code must be selected for all data entry as either Metric (SI) (e.g., meters) or U.S. Standard (e.g., feet). Enter ―0‖ for SI or ―1‖ for Metric.
Number of Watersheds associated with the test site is required data.
Number of BMPs located at the test site is required data.
Type of BMP being tested must be identified as either Structural (=1) or Non-Structural (=2) or Both (=3). This is required data. Use the Comments field on the General Test Site Information spreadsheet to indicate that both BMP types are present in the watershed.
Comments are encouraged to provide a general overview of the study and to identify any concerns or limitations associated with usage of data from the study. Comments are considered nice to have.
2. Test Site/Study Documentation Information
As the Database has evolved, many users have requested additional supplemental information about the study. This spreadsheet provides a checklist of potential attachments to the study submittal, as well as other document information, including the following:
Year Submitted to Database helps track growth of the database over time and is useful to database users wanting to identify new data sets. This is required information.
Data Provider helps track the individual submitting the study for future contact purposes. The data provider, may or may not correspond to the entity conducting or sponsoring the study. This is required information.

International Stormwater BMP Database Data Entry Spreadsheets User’s Guide
Release Version 2.0 Page 15 December 2007
Report Title or Data Source enables future database users to go to the original underlying research. This is nice to have information.
Report Authors enables future database users to go to the original data provider and or underlying research. This is nice to have information.
Year of Publication enables future database users to go to the original data provider and or underlying research. This is nice to have information.
Attachments provide the user with more information about the test site. Attachments should be provided in PDF format and accompany the data submittal. In the spreadsheet, enter Yes (Y) or No (N) to identify whether various attachments have been provided with the study submittal.
Study Reports enable future database users/researchers to access more detailed information on the study. This information is nice to have.
Photos enable future database users/researchers to develop a visual image of the BMP. This information is nice to have.
BMP Layout enables future database users to develop a clear understanding of the BMP. Drawings of the BMP and/or site layout in plan, profile and layout view are requested. These drawings must be ―saved down‖ to a single file in PDF format. This is required information.
QAPP/SAP are Quality Assurance Project Plans and Sampling and Analysis Plans that are often developed as part of monitoring efforts. Attaching a PDF of these plans enables future database users to assess the quality of the data and study design. This information is nice to have.
Abstract enables the data provider to paste a published abstract into the spreadsheet or to create a study abstract for use by future database users. This information is nice to have.
3. Monitoring and Sponsoring Agencies
The purpose of this spreadsheet is to provide contact information for the entity(ies) sponsoring the BMP test and the entity(ies) actually conducting the test. For example, EPA may be sponsoring the test by providing funding, while a private firm may be actually conducting the test. All address lines may not be necessary for an entity. For example, there may be no department name and only one address line may be necessary. Multiple entries are allowed for each test site. Specific data requested include:
Agency Name identifies the entities sponsoring and/or monitoring the study. This is required
information.
Agency Responsibility should be selected from the provided pick list to identify whether the agency monitored, sponsored and both monitored/sponsored the study. Multiple entities may be involved with a BMP study. This is required information.
Agency Type should be selected from the provided pick list. Agency types may include a city, county, state, industry, federal, special district, council of governments, authority, consultant, or other. Although not essential, this information is nice to have if available.

International Stormwater BMP Database Data Entry Spreadsheets User’s Guide
Release Version 2.0 Page 16 December 2007
Address information includes agency department (if any), street or post office address, city, state, zip code, country, phone, fax and e-mail. This is required information. Fax and e-mail should be provided when available.
4. Location Information
Regional Climate Station in the United States that is most relevant to the test site can be selected from the Regional Climate Station pick list. Storm event statistics have already been calculated for these stations including the average and coefficient of variation for these parameters: number of storms, precipitation (in/yr), storm duration (hours), storm intensity (in/hr), and storm volume (in/hr). These data were taken from Analysis of Storm Event Characteristics for Selected Rainfall Gauges Throughout the United States by Eugene D. Driscoll, Gary E. Palhegyi, Eric W. Strecker and Philip E. Shelley, prepared for the U.S. Environmental Protection Agency, December 1989. For sites outside of the United States, this information can be developed based on the definition of an individual storm being separated by six hours or more of inter-event time. Storms that have less than 0.1 inches of total rainfall should be filtered out before calculating these statistics. For non-United States test sites, this information can be entered into the Comments field on the General Test Site Information spreadsheet or table.
Latitude is the North-South coordinate that locates the project to the nearest second on the globe relative to the equator. The latitude should be reported in a decimal degree format, typically generated by a Global Positing System (GPS) device. This is essential information. If it is currently unavailable, it should be collected in future monitoring efforts.
Longitude is the East-West coordinate that locates the project to the nearest second on the globe relative to the selected principal meridian. The longitude should be reported in a decimal degree format, typically generated by a Global Positing System (GPS) device. This is essential information. If it is currently unavailable, it should be collected in future monitoring efforts.
Horizontal Reference Datum associated with the latitude and longitude should also be selected from the provided pick list (e.g., NAD83, WGS84). This is essential information. If it is currently unavailable, it should be collected in future monitoring efforts.
Hydrologic Unit Code is the U.S. Geological Survey (USGS) 8-digit hydrologic unit code (HUC) which represents a geographic area containing part or all of a surface drainage basin or distinct hydrologic feature. The first two digits of the code represent the water resources region; the first four digits represent the subregion; the first six digits represent the accounting unit; and all eight digits represent the cataloguing unit. The HUC can be looked up on the EPA "Surf Your Watershed" web site at http://www.epa.gov/surf/. If the user’s search response is "no results", then higher level tributary names should be tried, or other descriptors such as county name or zip code entered until a HUC is provided. If these approaches are unsuccessful, the user should provide the requested latitude and longitude information so that this information can be completed by EPA or the database clearinghouse staff. This is essential information for sites in the United States. If it is currently unavailable, it should be collected in future monitoring efforts.
EPA Reach Code is the EPA-designated RF1 or RF3 river reach with which the station is associated. Sites will either have an RF1 code or an RF3 code, but not both. There are about 67,000 RF1 codes and over 2 million RF1 codes within the United States. The first eight digits of the Reach Codes are the hydrologic unit code (HUC) described above; therefore, the user

International Stormwater BMP Database Data Entry Spreadsheets User’s Guide
Release Version 2.0 Page 17 December 2007
only needs to provide the last three or four digits in the Reach Code which follow the 8-digit HUC. The RF1 and RF3 codes can be obtained from the BASINS watershed analysis software, which EPA has distributed to state water quality agencies, as well as many regional or local agencies. The BASINS software modules may be obtained from EPA at no charge; however, the user must have ArcView, a commercial GIS software product. More information on obtaining BASINS is available on the EPA web site at http://www.epa.gov/OST/BASINS/. This is essential information for sites in the United States. If it is currently unavailable, it should be collected in future monitoring efforts.
Township is a public land surveying unit consisting of 36 sections or 36 square miles in the United States. Townships are located by their distance and direction (north or south) from a selected baseline. For example: Township 2 North (T2N). This information can be identified on a U.S. Geological Survey quadrangle map. This information should be identified for U.S. sites only. Although not essential, this information is nice to have if available.
Range identifies the site distance and direction (east or west) from the selected principal meridian. For example, Range 60 West (R60W). This information can be found on a U.S. Geological Survey quadrangle map. This information should be identified for U.S. sites only. Although not essential, this information is nice to have if available.
Principal Meridians are the infinite sets of imaginary circles around the globe passing through the north and south poles from which degrees of longitude are measured. The principal meridian is the local or international meridian from which the degrees of longitude locating the BMP test site are measured. Although not essential, this information is nice to have if available.
Section is a land area containing one square mile or 640 acres that can be identified on a U.S. Geological Survey quadrangle map. There are 36 sections in a township numbered from 1 to 36. This information should be identified for U.S. sites only. Although not essential, this information is nice to have if available.
Quarter, Quarter-Quarter and Quarter-Quarter-Quarter Sections should be provided to locate the BMP test site on a U.S. Geological Survey quadrangle map. A quarter section of land is 160 acres. A quarter-quarter section is 40 acres and a quarter-quarter-quarter section is 10 acres. Enter from smallest quarter to largest quarter for the quarter-quarter and quarter-quarter-quarter fields. Enter the data in the form of NE, NW, SW, or SE. For example, the BMP test site is located in the northeast (NE) quarter of the southwest (SW) quarter of the northeast (NE) quarter of section 36. This information should be identified for U.S. sites only. Although not essential, this information is nice to have if available.
USGS Quadrangle Map Name is the U.S. Geological Survey (USGS) map on which the site can be located. This information should be identified for U.S. sites only. Although not essential, this information is nice to have if available.
Time Zone in which the BMP test site is located off-set in hours from Greenwich Mean Time should be provided. For example in the United States, Eastern Time is -5, Central Time is -6, Mountain Time is -7 and Pacific Time is -8. A pick list is provided. Although not essential, this information is nice to have if available.

International Stormwater BMP Database Data Entry Spreadsheets User’s Guide
Release Version 2.0 Page 18 December 2007
Part 2. Establish Monitored Events
5. Monitoring Events
In order to properly link monitoring events for the overall test site, a monitoring events table must be established for the test site as a whole. More detailed information for monitoring events is included in the precipitation, flow and water quality spreadsheets.
Event ID is pre-entered, numbered from 1 to 25. Additional event numbers may be added, if necessary. This is required information prerequisite for all subsequent monitoring data entry.
Event Start Date is the calendar date (month, day and 4-digit year) that storm started (e.g., 01/01/1998) or the base flow event was sampled. The event start date may not correspond exactly to the event sample date for longer storms or BMPs with extended release periods. This is required information.
Event Start Time is the time that the storm (or monitoring event for base flow) started (e.g., 21:00). This is nice to have information.
Event Type identified whether the monitored event is associated with storm runoff, base flow/dry weather, or other event. This is required information that must be selected from a pick-list.
Describe Quality Assurance/Quality Control Measures in Place for the Sampling Event. The types of Quality Assurance/Quality Control (QA/QC) measures in place for both laboratories and field activities should be provided. Alternatively, the user may define the quality assurance objectives and state whether these were met. If water quality data are being entered into the database, then this is essential information. If it is currently unavailable, it should be collected in future monitoring efforts. If a Quality Assurance Project Plan (QAPP) and or Sampling and Analysis Plan (SAP) is available in PDF format, these files may be attached separately in the Documents directory for the Test Site.
Comments allows the user to enter observations regarding the event conditions. For example, if the event generated flow conditions greater than the BMP design storm, this could be noted in the event field. This information is nice to have.
6. Site Monitoring Costs
Enter approximate annual monitoring costs for the overall test site for each year.
Monitoring Year is the year during which monitoring was conducted. If monitoring has been conducted over a five-year period, then enter costs for each of the five years. This may be done by simply dividing the total monitoring costs by the number of years. Although not essential, this information is nice to have if available.
Comments may be needed to clarify unusual monitoring costs or other details as deemed appropriate by the user. Although not essential, this information is nice to have if available.
Fixed Monitoring Station Costs are those costs associated with fixed monitoring instrumentation installed for long term use. For example, a shed may be constructed to house

International Stormwater BMP Database Data Entry Spreadsheets User’s Guide
Release Version 2.0 Page 19 December 2007
the instrumentation. Year of cost basis, equipment, maintenance, sampling and laboratory costs are requested for fixed monitoring stations. Although not essential, this information is nice to have if available.
Temporary Monitoring Station Costs are those costs associated with temporary monitoring instruments not intended for long-term use. Year of cost basis, equipment, sampling and laboratory costs are requested for temporary monitoring stations. Although not essential, this information is nice to have if available.
Year of Cost Basis is the year that the monitoring activities were conducted or equipment purchased. For example, if the instrument was purchased in 1995 for $500, then 1995 is the year of cost basis. Although not essential, this information is nice to have if available.
Equipment Costs are the costs of sampling and flow gauging equipment (rental or purchase) and installation in U.S. currency. Although not essential, this information is nice to have if available.
Maintenance Costs are the annual maintenance costs for equipment in U.S. currency. Although not essential, this information is nice to have if available.
Sampling Costs are the annual costs of sampling in U.S. currency. Although not essential, this information is nice to have if available.
Laboratory Costs are the annual costs of sample analysis by a laboratory. This information is not essential for inclusion into the database, but it is nice to have if available
International Stormwater BMP Database Data Entry Spreadsheets User’s Guide
Release Version 2.0 Page 20 December 2007
Part 3. Watershed (Tributary Area) Information
Several spreadsheets must be completed providing watershed information to characterize conditions at the time that test data were collected. The term watershed in this context refers only to the area tributary to the BMP or LID site, not the watershed as a whole. For studies that are conducted over time, if watershed conditions have changed significantly over time (e.g., land use changed from agricultural to commercial) at the test site, set-up a separate test site to enter data collected since the time that the watershed changed.
7. General Watershed Information
Watershed characteristics play a significant role in the types and quantities of pollutants contributed to stormwater runoff. The information requested below is useful for comparing effectiveness of BMPs under various watershed conditions. The priority level (e.g., required, nice-to-have) of the data varies based on the type of BMP study being conducted and is described further below.
Watershed Name is the name that the watershed is referred to locally. This is required information.
Watershed Type Code can either be a Test Watershed (=1) or a Reference Watershed (=2) and is required information that must be selected from the pick-list. This field is required because non-structural BMP studies can be set-up with two basic approaches:
1) BMP Performance Comparisons Over Time. This involves a before-and-after type of approach where measurements are taken in the same watershed prior to non-structural BMP implementation and then taken again after BMP implementation. In this case, the first set of measurements serve as the reference, and the second set serve as the BMP test.
2) BMP Performance Comparisons in Space. This involves setting up a non-structural BMP test using two or more geographically separate watersheds that have similar watershed characteristics. The watershed without BMPs in place serves as the reference and the watershed with BMPs in place serves as the test.
Some structural BMP tests may also incorporate a reference watershed. For example, porous pavement effectiveness may be evaluated by comparing water quality data from a watershed with porous pavement in place to a watershed without porous pavement in place. Typically, structural BMPs are simply evaluated by collecting inflow and outflow data for the subject BMP and comparing the water quality; therefore, a reference watershed is not required.
Watershed Description enables the data provider to narratively describe the watershed and identify any unique or important conditions that may be present. This information is nice to have if available.
Total Watershed Area is the topographically defined area drained by an urban system, channel, gulch, stream, etc., such that all outflow is directed to a single point. This is required information. Units of measurement must also be selected from the provided pick list.

International Stormwater BMP Database Data Entry Spreadsheets User’s Guide
Release Version 2.0 Page 21 December 2007
Total Length of Watershed is the length of the watershed along the main drainage path to the furthest point on the watershed divide. Although not essential, this information is nice to have if available. Units of measurement must also be selected from the provided pick list.
Total Length of Grass-Lined Channel is the total length of grass-lined and natural channels in the watershed. This is the portion of the storm drainage network in the watershed that is not conveyed in concrete channels, storm sewers or pipes. Units of measurement must also be selected from the provided pick list.
For non-structural BMPs, LID sites, and structural BMPs that are based on minimizing directly connected impervious area, this is required information.
For infiltration/percolation type structural BMPs, this is essential information. If it is currently unavailable, it should be collected in future monitoring efforts.
For non-infiltrating structural BMPs, this information is not essential for inclusion into the database, but it is nice to have if available.
Total Watershed Area Disturbed is the total watershed area that is disturbed or under construction. This parameter may be useful in indicating the types and levels of pollutant loads in stormwater. Units of measurement must also be selected from the provided pick list.
For non-structural BMPs, LID sites, and structural BMPs that are based on minimizing directly connected impervious area, this is required information.
For infiltration/percolation type structural BMPs, this is essential information. If it is currently unavailable, it should be collected in future monitoring efforts.
For non-infiltrating structural BMPs, this information is not essential for inclusion into the database, but it is nice to have if available.
Percent (%) Irrigated Lawn and/or Agriculture in Watershed is particularly important in arid areas where vegetation may be difficult to establish without irrigation.
For non-structural BMPs, LID sites, and structural BMPs that are based on minimizing directly connected impervious area, this is required information.
For infiltration/percolation type structural BMPs, this is essential information. If it is currently unavailable, it should be collected in future monitoring efforts.
For non-infiltrating structural BMPs, this information is not essential for inclusion into the database, but it is nice to have if available.
Percent (%) Total Impervious Area in Watershed represents the percentage of watershed that is impervious. Impervious or impermeable surfaces either prevent or retard the entry of water into the soil mantle as would occur under natural conditions prior to development. Impermeable surfaces cause water to run off the surface in greater quantities or at an increased rate relative to natural conditions. Common impervious surfaces include, but are not limited to, rooftops, walkways, patios, driveways, parking lots, storage areas, concrete or asphalt paving, gravel roads, packed earthen materials, and macadam or other surfaces that similarly impede the natural infiltration of urban runoff. Rainfall on impervious areas can cause rapid overland

International Stormwater BMP Database Data Entry Spreadsheets User’s Guide
Release Version 2.0 Page 22 December 2007
flow to drainage inlets. The percent of the total watershed that is impervious can be determined as the total impervious area divided by the total area of the watershed. This is required information.
Percent (%) of Total Impervious Area (above) that is Hydraulically Connected is calculated by dividing the hydraulically connected impervious area by the total impervious area. An example of hydraulically connected impervious area includes building rooftops that drain onto paved areas. This is essential information. If it is currently unavailable, it should be collected in future monitoring efforts.
Percent (%) of Watershed Served by Storm Sewers is the percentage of the total watershed area directly served by storm sewers. Storm sewers are conduits designed for the principal purpose of conveying storm or combined (sanitary and storm) flows to either treatment facilities or receiving water bodies. The percentage of watershed area served by storm sewers is typically higher in urbanized areas than in rural areas.
For non-structural BMPs, LID sites, and structural BMPs that are based on minimizing directly connected impervious area, this is required information.
For infiltration/percolation type structural BMPs, this is essential information. If it is currently unavailable, it should be collected in future monitoring efforts.
For non-infiltrating structural BMPs, this information is not essential for inclusion into the database, but it is nice to have if available.
Storm Sewer Design Return Period (yrs) is the most common design storm return period for the storm sewers in the watershed provided in years. The design storm is the storm for which a storm drainage system, flood protection project, spillway or other engineering structure is designed. For example, the storm sewers may be designed to handle flows generated by the 25-year storm.
For LID sites and structural BMPs that are based on minimizing directly connected impervious area, this is required information.
For infiltration/percolation type structural BMPs and non-structural BMPs, this is essential information. If it is currently unavailable, it should be collected in future monitoring efforts.
For non-infiltrating structural BMPs, this information is not essential for inclusion into the database, but it is nice to have if available.
Average Watershed Slope is the average unitless slope of the watershed (i.e., ft fall/ft run or m fall/m run--unitless). Calculate slope by dividing the vertical distance (or fall) by the linear length of the flow path (or run). Slope for each linear reach can be determined as the elevation difference for the reach divided by the length of the reach. An average slope for the watershed can then be calculated as a weighted sum of the slopes of individual reaches using the length of the individual reaches relative to the total length of the channel as the weighting factor.
For LID sites and structural BMPs that are based on minimizing directly connected impervious area, this is required information.

International Stormwater BMP Database Data Entry Spreadsheets User’s Guide
Release Version 2.0 Page 23 December 2007
For infiltration/percolation type structural BMPs and non-structural BMPs, this is essential information. If it is currently unavailable, it should be collected in future monitoring efforts.
For non-infiltrating structural BMPs, this information is not essential for inclusion into the database, but it is nice to have if available.
Average Runoff Coefficient is based on runoff and rainfall data collected in the watershed using the area-weighted average runoff coefficient. If data permit, calculate the average of individual storm runoff coefficients using each storm’s runoff volume divided by its rainfall volume. If data are insufficient for this approach, estimate using Figure 3, adopted from the Water Environment Federation Manual of Practice No. 23 and ASCE Manual and Report on Engineering Practice No. 87 titled Urban Runoff Quality Management, 1998:
Figure 3. Relationship Between Imperviousness and Runoff Coefficient
For non-structural BMPs, LID sites, and structural BMPs that are based on minimizing directly connected impervious area, this is required information.
For infiltration/percolation type structural BMPs, this is essential information. If it is currently unavailable, it should be collected in future monitoring efforts.
For non-infiltrating structural BMPs, this information is not essential for inclusion into the database, but it is nice to have if available.
Hydrologic Soil Group is the dominant Natural Resource Conservation Service (NRCS--formerly Soil Conservation Service) hydrologic soil group--A, B, C, or D. The appropriate soil group can be selected from a drop-down box. Hydrologic soil groups are used to estimate runoff from precipitation. Soils are placed in one of four groups on the basis of the infiltration of

International Stormwater BMP Database Data Entry Spreadsheets User’s Guide
Release Version 2.0 Page 24 December 2007
water after the soils have been wetted and have received precipitation from long-duration storms. The four groups include:
1. Group A soils have a high infiltration rate (low runoff potential) when thoroughly wet. These consist chiefly of deep, well drained to excessively drained sands or gravels. These soils have a high rate of water transmission.
2. Group B soils have a moderate infiltration rate when thoroughly wet. These consist chiefly of moderately deep or deep, moderately well drained or well drained soils that have moderately fine texture to moderately coarse texture. These soils have a moderate rate of water transmission.
3. Group C soils have a slow infiltration rate when thoroughly wet. These consist chiefly of soils that have a layer that impedes the downward movement of water or soils that have moderately fine texture to fine texture. These soils have a slow rate of water transmission.
4. Group D soils have a very slow infiltration rate (high runoff potential) when thoroughly wet. These consist chiefly of clays that have a high shrink-swell potential, soils that have a permanent high water table, soils that have a clay pan or clay layer at or near the surface, and soils that are shallow over nearly impervious material. These soils have a very slow rate of water transmission.
For LID sites and structural BMPs that are based on minimizing directly connected impervious area, this is required information.
For infiltration/percolation type structural BMPs and non-structural BMPs, this is essential information. If it is currently unavailable, it should be collected in future monitoring efforts.
For non-infiltrating structural BMPs, this information is not essential for inclusion into the database, but it is nice to have if available.
Soil Type is the general NRCS soil type: (c)lay (s)ilt, or s(a)nd. Clay particles are smaller than 0.002 millimeters (mm) in diameter. Silt particles are between 0.002 and 0.05 mm in diameter. Sand particles range from 0.05 mm to 2.0 mm. The appropriate soil type can be selected from a drop-down box.
For non-structural BMPs, LID sites, and structural BMPs that are based on minimizing directly connected impervious area, this is required information.
For infiltration/percolation type structural BMPs, this is essential information. If it is currently unavailable, it should be collected in future monitoring efforts.
For non-infiltrating structural BMPs, this information is not essential for inclusion into the database, but it is nice to have if available.
Type of Vegetation predominant in pervious areas (grass turf, dryland grasses, etc.) influences the rate and efficiency of stormwater infiltration and filtration.
For non-structural BMPs, LID sites, and structural BMPs that are based on minimizing directly connected impervious area, this is required information.

International Stormwater BMP Database Data Entry Spreadsheets User’s Guide
Release Version 2.0 Page 25 December 2007
For infiltration/percolation type structural BMPs, this is essential information. If it is currently unavailable, it should be collected in future monitoring efforts.
For non-infiltrating structural BMPs, this information is not essential for inclusion into the database, but it is nice to have if available.
8. Roads and Parking Lots in Watershed
Separate data sets are requested for 1) roads, streets and alleys in the watershed and 2) parking lots in the watershed. Several fields pertaining to highways are also requested. The requested information is described below. For each of the fields below, the priority level for the data varies depending on the type of BMP being tested. The priority level of all of the data requested below can be categorized as follows according to BMP type:
For non-structural BMPs, LID sites, and structural BMPs that are based on minimizing directly connected impervious area, this is required information.
For infiltration/percolation type structural BMPs, this is essential information. If it is currently unavailable, it should be collected in future monitoring efforts.
For non-infiltrating structural BMPs, this information is not essential for inclusion into the database, but it is nice to have if available.
The following fields request information on streets, roads and alleys present in the watershed. Do not include parking lots in this information because it is requested separately.
Streets, Roads and Alleys
Total Paved Roadway Area includes the total area of paved roads, streets and alleys in the watershed as a component of the total impervious area of the watershed. Associated paved shoulders should be included in this area. Units of measurement must also be selected from the provided pick list.
Total Length Curb/Gutter on Paved Roads includes the total length of curb & gutter along paved roads, streets, and alleys. Curbs and gutters are man-made stormwater conveyance systems that remove stormwater from paved roads, streets and alleys; however, they also concentrate stormwater runoff with minimal opportunity for infiltration, filtering or settling of pollutants. Units of measurement must also be selected from the provided pick list.
Total Unpaved Roadway Area is the total area of unpaved roads, streets, and alleys in the watershed. Unpaved shoulders should be included in this area. Units of measurement must also be selected from the provided pick list.
Total Length Curb/Gutter on Unpaved Roads is the total length of curb & gutter along unpaved roads, streets, and alleys. Curbs and gutters are man-made stormwater conveyance systems that remove stormwater from roads, streets and alleys; however, they also concentrate stormwater runoff with minimal opportunity for infiltration, filtering or settling of pollutants. Units of measurement must also be selected from the provided pick list.
% Paved Roads Draining to Grass Swales/Ditches can be calculated by dividing the length of paved roads, etc., draining to grass swales and ditches by the total length of paved roads,

International Stormwater BMP Database Data Entry Spreadsheets User’s Guide
Release Version 2.0 Page 26 December 2007
streets and alleyways in the watershed. Well-vegetated and maintained grass swales and ditches typically provide more infiltration and filtering of pollutants from stormwater than curb and gutter systems.
% Unpaved Roads Draining to Grass Swales/Ditches is the percentage of unpaved roads, street and alley areas draining to grass swales/ditches that can be calculated by dividing the length of unpaved roads, etc., draining to grass swales and ditches by the length of unpaved roads, streets and alleyways in the watershed. Well-vegetated and maintained grass swales and ditches typically provide more infiltration and filtering of pollutants from stormwater than curb and gutter systems.
Type of Pavement on Roads, streets and alleys can be (C)oncrete, (A)sphalt, or a Mix of (B)oth. These values can be selected from a drop-down box.
Parking Lots in Watershed
The following fields request information on parking lots in the watershed. Do not include the previously entered road, street and alley information.
Total Paved Parking Lot Area includes the total area of all paved parking lots within the watershed. Paved parking lots can be a significant component of total impervious area within a watershed. Units of measurement must also be selected from the provided pick list.
Total Length Curb/Gutter on Paved Lots is the total length of curb & gutter along paved parking lots. Curbs and gutters are man-made stormwater conveyance systems that remove stormwater from paved roads, streets, alleys and parking areas; however, they also concentrate stormwater runoff without opportunity for infiltration, filtering or settling of pollutants. Units of measurement must also be selected from the provided pick list.
Total Unpaved Parking Lot Area is the total area of all unpaved parking lots within the watershed. Units of measurement must also be selected from the provided pick list.
Total Length Curb/Gutter on Unpaved Lots is the total length of curb & gutter along unpaved parking lots. Units of measurement must also be selected from the provided pick list.
% Paved Lot Area Draining to Grass Swales is the percentage of parking lot areas draining to grass swales or ditches. This can be calculated by dividing the total parking lot area draining to swales by the total parking lot area.
% Unpaved Lot Area Draining to Grass Swales is the percentage of unpaved parking lot areas draining to grass swales or ditches. This can be calculated by dividing the total unpaved parking lot area draining to swales by the total unpaved parking lot area.
Type of Pavement in Parking Lots can be (C)oncrete,(A)sphalt, or a Mix of (B)oth. Select the type of pavement present in parking lots in the watershed from the pick list. Additionally, provide the percentages of porous concrete, porous asphalt and porous modular pavement present relative to the total paved parking lot area.

International Stormwater BMP Database Data Entry Spreadsheets User’s Guide
Release Version 2.0 Page 27 December 2007
Highway Data
Average Annual Daily Traffic (AADT) traffic volumes should be provided for highways. This information is nice to have in terms of BMP performance, but is considered essential for many departments of transportation.
Highway Characterization should be described narratively addressing the presence of features such as: cruising, acceleration, deceleration, intersections, parking/high turnover (e.g., toll plazas, rest stops, etc), parking/low turnover (e.g., park and rides). This information is nice to have in terms of BMP performance, but is considered essential for many departments of transportation.
Number of Lanes. This information is nice to have in terms of BMP performance, but is considered essential for many departments of transportation.
Type of Deicer Used should be selected from a drop-down box that includes the following options: 1) Sand; 2) Sand/Salt; 3) Magnesium Chloride; 4) Other Chemical; 5) None; 6) All of the above. This information is nice to have in terms of BMP performance, but is considered essential for many departments of transportation.
9. Land Use
Land Use Information should be provided for each land use present in the watershed by selecting land use from the drop-down pick list. The percent of each land use in the watershed can be categorized according to % Light Industrial, % Heavy Industrial, % Multi-family Residential, % Office Commercial, % Retail, % Restaurants, % Automotive Services, % Rangeland, % Orchard, % Vegetable Farming, % Highway, etc. A running total is provided as a check on the reported percentages of land uses. This parameter may be useful in indicating the type and level of pollutant loads in stormwater.
For non-structural BMPs, this is required information.
For structural BMPs, this is essential information. If it is currently unavailable, it should be collected in future monitoring efforts.

International Stormwater BMP Database Data Entry Spreadsheets User’s Guide
Release Version 2.0 Page 28 December 2007
Part 4. General BMP Information
10. General BMP Information3
A structural BMP includes constructed facilities or measures to help protect receiving water quality and control stormwater quantity. Representative practices include storage, vegetation, infiltration and filtration. If multiple BMPs are present at a test site, they must have the same unique tributary watershed, otherwise they should be set-up as separate test sites as discussed under Instructions for General Test Site Information.
Watershed Name must be provided, as previously defined by the user, in order to place BMP data in the proper watershed context. This is required information.
BMP Name must be provided in terms of the common name or code used to identify this BMP at your test site (e.g., Shop Creek wetland or Southglenn Mall detention pond). Enter the structural BMPs in place at your test site from upstream to downstream.
Type of BMP Being Tested must be selected from the codes in the BMP type pick-list. If a non-structural BMP is being used, select Non-structural from the pick list. If no BMPs are in place because data are being entered for a reference watershed, enter ―Control BMP.‖ If multiple BMPs are in place in a watershed and the site is being monitored as an overall site, then enter each BMP in place in the watershed, as well as ―Composite BMP‖ to enable entry of monitoring stations for the site. This is required information.
Date Facility Placed in Service must be provided in terms of month, day and 4-digit year (e.g., 04/05/1998). If the exact day is unknown, use the first day of the month. This is required information for all BMPs. For non-structural BMPs, use this field to enter the date that the non-structural measure began being implemented.
Number of Separate Inflow Points to the Facility is required information for structural BMPs. For example, a wet pond may receive flow from two storm sewers and one natural drainage, for a total of three separate inflow points. This field is not applicable to non-structural BMPs.
BMP Designed to Bypass or Overflow identifies how the BMP functions when full. Select ―Bypass‖ (B) or ―Overflow‖ (O) from the pick-list. This is required information for structural BMPs, but is not required for non-structural BMPs.
Upstream Treatment Provided must be answered by a yes or no from the drop-down box. This field is important in primarily two situations. The first often occurs in highway settings where roadside drainage may travel over a grass road shoulder or grass ditch prior to reach the primary facility being monitored such as a detention pond. The second situation occurs where a treatment train of BMPs is being monitored and the BMP received outflow from an upstream BMP. This is required information.
Describe Upstream Treatment, if any, enables the data provider to narratively describe the upstream treatment that may be present at a site. This is essential information and should be provided where upstream treatment is present.
3 This spreadsheet corresponds to the database table “Struct Info” for backend database users.

International Stormwater BMP Database Data Entry Spreadsheets User’s Guide
Release Version 2.0 Page 29 December 2007
Name of Upstream BMPs enables the user to provide a comma-separated list of BMP names entered into the BMP Database. This is designed to allow a future data user to re-create the BMP treatment train present at the site. This is essential information and should be provided where upstream treatment is present.
Maintenance Type and Frequency provides a brief narrative description of maintenance activities. For example, provide the number of times per year that the following maintenance practices and other site-specific practices not included in this list were conducted:
Tree/Shrub/Invasive Vegetation Control Pump Cleaning/Repair
Mowing Valve Cleaning/Repair
Algae Reduction Pipe Cleaning/Repair
Sediment Removal/Dredging General Maintenance
Litter/Debris Control Odor Control
Erosion Control/Bank Stability Mosquito Control
Inlet Cleaning Vector Control
Outlet Cleaning Other Practice
Media Replacement/Regeneration
This is essential information. If it is currently unavailable, it should be collected in future monitoring efforts, but is not required for non-structural BMPs.
Last Rehabilitation Date is used to identify when the facility was last rehabilitated. Enter month, day and 4-digit year (e.g., 04/05/1998) of rehabilitation. If the exact day is unknown, use the first day of the month. Rehabilitation activities are more extensive than routine maintenance practices. While the goal of maintenance practices are to ensure proper functioning and efficiency of a BMP, rehabilitation is required when a BMP no longer functions properly, in some cases due to lack of routine maintenance. Examples include replacing an outlet structure that has been washed out in a large storm; making repairs needed to put a BMP back on-line that has been out of use for an extended time period due to neglect, lack of funding, etc.; or modifying an existing water quantity control BMP to provide water quality functions. This is essential information for structural BMPs, but is not required for non-structural BMPs. If it is currently unavailable, it should be collected in future monitoring efforts.
Type of Rehabilitation includes a brief narrative description of the type of rehabilitation such as dredging a permanent pool. This is essential information for Structural BMPs, but is not required for non-structural BMPs. If it is currently unavailable, it should be collected in future monitoring efforts.
Descriptions of Types and Designs of Outlets may include information such as perforated riser, pipe or plate with a horizontal orifice overflow, three vertical orifices that control quarter quality volume, 2-year and 10-year volumes, etc. This is essential information for structural

International Stormwater BMP Database Data Entry Spreadsheets User’s Guide
Release Version 2.0 Page 30 December 2007
BMPs, but is not required for non-structural BMPs. If it is currently unavailable, it should be collected in future monitoring efforts.
Describe BMP/Comments enables the user to describe aspects of the BMP that are important to interpreting BMP performance or provide other comments on the BMP. This information is nice to have.
11. BMP Cost Data
BMP Cost Data should be provided whenever possible so that researchers, local governments and others can begin to conduct cost/benefit analysis for various BMP types and designs. The type of cost data varies slightly depending on the BMP type; nonetheless, a common set of BMP cost parameters has been consolidated for all BMP types to enable facilitation of comparisons across BMP types. If a particular parameter is not applicable, then it may be left blank. All cost data are considered nice to have.
BMP Name must be entered to associate the cost data with the appropriate BMP. This is required information if cost data are provided.
Year of Cost Estimate. Four-digit year (e.g., 1998) for which the above estimates were made. This is required information if cost data are provided.
Total Facility Costs (Base Cost of Original Design, Construction and Installation of BMP, Including Capital and Associated Costs). This is the overall initial cost of the facility. If an overall cost estimate is provided, then a description of items included in the total cost must also be provided.
Description of Items Included in Total Cost. If an overall initial cost of the facility is provided, then the individual cost components must be narratively described so that future comparisons of overall costs are accurately conducted.
Routine Maintenance Costs. Estimated average annual cost ($/year) of routine maintenance such as mowing, sediment removal, vacuuming, etc., at a frequency that ensures the continued function of the structure.
Periodic Rehabilitation Costs. Estimated average cost ($/event) of infrequent, rehabilitative maintenance. Examples include cost to revegetate or reseed the structure at a frequency that ensures the continued function of the structure. For media filters, this includes the cost of replacing the filter material at a frequency that ensures the continued function of the BMP. For porous pavement, this should include estimated average annual cost to revegetate void spaces in modular block pavement.
Supplemental Information. Several subcategories of cost data are requested, if available, as described below.
Excavation/ Clearing Costs. The estimated cost of all excavation-related activities, including stripping, drilling and blasting, trenching and shoring.
Structural Materials. The estimated cost of materials used in constructing the BMP, excluding vegetative cover and structural control devices. Specific cost components that should be included for various BMP types include:

International Stormwater BMP Database Data Entry Spreadsheets User’s Guide
Release Version 2.0 Page 31 December 2007
For media filters, provide the estimated cost of establishing the filter system itself, including filter material and the underdrain system. The estimated cost for construction of the media filter, including site survey and construction activities. Include costs of materials and construction.
For porous pavement, this should include the estimated cost of
establishing the structural and piping features of the BMP, including modular blocks, retaining concrete, sub-base material, and inlay material. Include costs of materials and construction;
establishing the granular fill for the BMP, including sand or gravel inlay materials, filter fabric, and perforated underdrain (if any); or
if poured-in-place porous concrete or asphalt paving was used, this is the estimated cost of establishing the paving.
For infiltration trenches, this should include the estimated cost of:
cost of materials used in the percolation trench, such as granular fill and geotextiles;
well drilling, if this is a dry well; or
trench construction , if it is a percolation trench.
Facility Installation/Construction Costs. The estimated cost of installing or constructing the structure.
Structural Control Devices Costs. The estimated cost of establishing all structural control devices, such as inlet and outlet structures, trash racks and energy dissipaters. For grass filters and porous pavement, this will also include control devices such as slotted curbing or other flow spreading devices, and outflow collection and conveyance systems. Reported costs should include both materials and construction.
Vegetation and Landscaping Costs. The estimated cost of establishing vegetation for the BMP, including acquiring landscape materials, establishing vegetation, and establishing the irrigation infrastructure, if any.
Engineering and Overhead Costs. The estimated engineering and associated overhead costs, including site, structural, and landscape design and engineering expenses.
Land Costs or Values. The estimated value of the land dedicated to this BMP or the cost of acquiring this land.
Comments Regarding Differential Cost of the BMP. This field enables the user to provide comments regarding the estimated portion of the BMP costs that would only be incurred due to the installation of the BMP itself. For example, a portion of landscaping, paving, curb and gutter and other similar components of site development would often be incurred even without installation of the BMP. (Differential Cost = All Costs Associated with BMP Installation/Construction – Portion of Costs Incurred Regardless of BMP Installation).

International Stormwater BMP Database Data Entry Spreadsheets User’s Guide
Release Version 2.0 Page 32 December 2007
Part 5. Monitoring Stations
12. Monitoring Stations
Two brief spreadsheets must be completed to identify the monitoring stations in place at each test site (spreadsheet 12a) and the relationship of each monitoring stations to each BMP (spreadsheet 12b). These spreadsheets are the basis for all subsequent data entry and are crucial to allow proper data retrieval. If a monitoring station is shared by two BMPs, the relationship of the monitoring station must be identified for each BMP in spreadsheet 12b. For example in Figure 4 below, the station monitoring outflow from BMP 1 also monitors the inflow to BMP 2, as indicated by "EI2". It is recommended that the user sketch the layout of the test site identifying the relative locations of the BMPs and associated monitoring stations as shown in Figure 4.
Figure 4. Example BMP Monitoring Station Site Sketch
P1=Precipitation gage
B1=By pass f or BMP 1
EI2=Outf low f rom BMP 1 &
Inf low to BMP 2
E2=Ouf low f rom BMP 2
I1=Inf low to BMP 1
Monitoring Stations
P1
B1
EI2
E2
I1
Shop Creek Test
Watershed
BMP 1: Wetland Channel
BMP 2: Detention Basin
BMP Site Sketch
All fields described below are required information, unless otherwise noted. Absence of this information will cause the test record to be rejected and prevent proper linkage of data to the BMP.
12a. Monitoring Station ID
This spreadsheet is used to identify all monitoring stations in place at the test site.
Monitoring Station Name. The user-identified monitoring station name must be provided. Each monitoring station must have a unique name. In this table, shared monitoring stations are entered only one time.
Comments should be used to provide any unique conditions or limitations associated with the monitoring station. This information is nice to have.

International Stormwater BMP Database Data Entry Spreadsheets User’s Guide
Release Version 2.0 Page 33 December 2007
Example for Figure 4:
Station Name Comments
P1 Precipitation gage for site
I1 Inflow to BMP 1
B1 Bypass to BMP 1
EI2 Outflow from BMP 1; Inflow to BMP 2
E2 Outflow to BMP 2
12b. Monitoring Station Relationships
This spreadsheet is used to identify the relationship of the monitoring stations defined in Spreadsheet 12a to each BMP at the site.
BMP Name must be provided in terms of the common name or code used to identify this BMP at your test site. This is required information.
Station Name is the user-assigned name for the subject monitoring station previously defined in Spreadsheet 12a. Stations shared by two BMPs should be entered twice (once for each BMP) in this spreadsheet. For example, if a station monitors outflow from one BMP and inflow to another BMP, then the monitoring station should be identified twice. This is required information.
Relationship to BMP identifies the function of each monitoring station for each BMP. This spreadsheet is completed by identifying each BMP and all monitoring stations associated with that BMP and then identifying the relationship of that monitoring station to each BMP. All fields in this table are completed by selecting entries from pick-lists. For the relationship to BMP field, the entries may include: 1) inflow, 2) outflow, 3) bypass, 4) intermediate or 5) not applicable. An intermediate location would be a sample taken from the middle of a pond. This is required information.
Example for Figure 4:
BMP Name Station Name Relationship to BMP
BMP 1 P1 5 (not applicable)
BMP 1 I1 1 (inflow)
BMP 1 B1 3 (bypass)
BMP 1 EI2 2 (outflow)
BMP 2 P1 5 (not applicable)
BMP 2 EI2 1 (inflow)
BMP 2 E2 2 (outflow)
13. Site Monitoring Instrumentation
The database requests information on the instruments present at the user-defined monitoring stations. More than one instrument may be present in a monitoring station. For example, a monitoring station may contain a flow gauge, a water quality sampler and a rain gauge.

International Stormwater BMP Database Data Entry Spreadsheets User’s Guide
Release Version 2.0 Page 34 December 2007
Station Name is the previously entered monitoring station where the instrument is located. A monitoring station that contains the instrument must be selected or defined before entering data on specific instruments. This is required information.
Date Instrument Was Installed requests the date (month, day and 4-digit year) the instrument was installed (e.g., 6/1/1998). This is essential information. If it is currently unavailable, it should be collected in future monitoring efforts.
Instrument Type Code is used to describe the type of instrument installed at the monitoring station. Select the instrument type from the list in the pick list, including: Bubble Gauge, Digital Recorder, Graphic Recorder, Land Line Telemetered, Radio Telemetered, Satellite Relayed, ADHAS, Crest Stage Indicator, Tide Gauge, Deflection Meter, Stilling Well, CR Type Recorder, Weighing Rain Gauge, Tipping Bucket Rain Gauge, Acoustic Velocity Meter, or Electromagnetic Flow Meter, Pressure Transducer, Unknown or Other. If ―Other‖ is selected, please describe in the Additional Comments field at the end of the form. This is essential information. If it is currently unavailable, it should be collected in future monitoring efforts.
Data Type Code provides information on the type of monitoring that is conducted. Select the type of data collected by the instrument based on U.S. Geological Survey (USGS) code. Data types may include: Tide, Water Flow/Stage Continuous, Water Flow/Stage Intermittent, Water Quality Continuous, Water Quality Grab, Precipitation Continuous, Precipitation Intermittent, Evaporation Continuous, Evaporation Intermittent, Wind Velocity Continuous, Wind Velocity Intermittent, Tide Stage Continuous, Tide Stage Intermittent, Water Quality Probe Continuous, Water Quality Probe Intermittent, Unknown, or Other. If ―Other‖ is selected, please describe in the Additional Comments field. This is essential information. If it is currently unavailable, it should be collected in future monitoring efforts.
Type of Control Structure provides information on features associated with the measurement device that controls or regulates the flow at the measurement location. This feature may be a natural constriction of the channel, an artificial structure, or a uniform cross-section over a long reach of the channel. Examples of artificial structures include weirs and flumes. This is essential information. If it is currently unavailable, it should be collected in future monitoring efforts.
Comments may be necessary to explain special features associated with the instrument or other information deemed important to the user. Although not essential, this information is nice to have if available.

International Stormwater BMP Database Data Entry Spreadsheets User’s Guide
Release Version 2.0 Page 35 December 2007
Part 6. Monitoring Results (Precipitation, Flow and Water Quality)
Monitoring results can include data collected for precipitation, flow (storm runoff or base flow), water quality and settling velocity distributions. All monitoring data must be entered with the previously identified monitoring station, BMP name and monitoring event in the following spreadsheets:
1) Precipitation Spreadsheet. Enter precipitation data for all precipitation monitoring stations included in the study.
2) Flow Spreadsheet. Enter required flow data at each monitoring station. Flows can be storm runoff into or from BMPs, bypass storm runoff or base flows. A monitored flow event may or may not have associated water quality data. If no surface flow is present for a monitored event, ―0‖ values must be entered in the flow spreadsheet. However, if these sites have no surface flows but have completed subsurface water level measurements, these should be entered into the water quality table.
3) Water Quality Spreadsheet. Enter water quality data for an event. Water quality parameters must be entered based on the appropriate Modern (―WQX‖) EPA STORET code. Properly formatted data may be pasted into the spreadsheet from Electronic Data Deliverables. Depth to water and particle size distribution data may also be entered into the water quality spreadsheet.
4) Settling Velocity Distribution. If settling velocity distributions were developed for a sampling event, the results can be entered into the settling velocity distribution spreadsheet.
14. Precipitation Data
Precipitation data should be provided when available. Precipitation may be entered for several gauging stations in the watershed, provided that the locations have been previously identified in the monitoring station spreadsheet. Enter data for each precipitation event monitored in the watershed. Individual precipitation events are separated by a period of at least six hours of no precipitation. Example: If rainfall ceases at 6:00 p.m. and begins again at 12:00 p.m., then two separate storm events have occurred. If rainfall had begun again at 10:00 p.m., then only one storm event would have occurred. In the a latter case, the total rainfall would be summed.
Event Number must be entered as previously defined by the user in spreadsheet 5-Monitoring Events. This is required information necessary to ensure accurate pairing of data associated with an event.
Enter Monitoring Station for Event from station list previously entered by the user. A station must be identified for each sampling event and is required information.
Start Date is the calendar date (month, day and 4-digit year) that storm started (e.g., 01/01/1998). This is essential information. If it is currently unavailable, it should be collected in future monitoring efforts. Even if precipitation data are unavailable, the user should still enter the start date of the precipitation event so that associated flow and water quality data can be linked to specific storm events.

International Stormwater BMP Database Data Entry Spreadsheets User’s Guide
Release Version 2.0 Page 36 December 2007
Start Time is the time that the storm started, e.g., 21:00. If only storm duration is provided, enter 00:00 for start time and enter the storm duration for end time. This is essential information. If it is currently unavailable, it should be collected in future monitoring efforts.
End Date is the calendar date (month, day and 4-digit year) that storm ended (e.g., 01/01/1998). Use six hours as the separation criteria to define a new storm. This is essential information. If it is currently unavailable, it should be collected in future monitoring efforts.
End Time is the time that the storm ended, e.g., 13:21. Use six hours between the end of one storm and the beginning of the next storm as the separation criteria to define a new storm. If only storm duration is provided, enter 00:00 for start time and enter the storm duration for end time. This is essential information. If it is currently unavailable, it should be collected in future monitoring efforts.
Total Depth is the total amount of precipitation that occurred during the storm. For example, a total of 4 inches of rain fell during a 12-hour storm. Units of measurement must also be selected from the provided pick list. For structural BMPs, this is essential information. If it is currently unavailable, it should be collected in future monitoring efforts. For non-structural BMPs, this is required information.
Peak One Hour Precipitation Rate is the most intense one-hour of rainfall for the storm. For storms with less than one-hour duration, divide the storm rainfall depth by one hour. This parameter is intended to form a basis for linking rainfall intensity with the performance of similar BMPs nationwide. Units of measurement must also be selected from the provided pick list. For structural BMPs, this is essential information. If it is currently unavailable, it should be collected in future monitoring efforts. For non-structural BMPs, this is required information.
15. Flow
Enter the following data collected for each flow monitoring event:
Event Number must be entered as previously defined by the user in spreadsheet 5-Monitoring Events. This is required information necessary to ensure accurate pairing of data associated with an event.
Enter monitoring station where flow event was monitored from the pick list. This is required information. Absence of this information will cause the test record to be rejected.
Select the type of flow: base flow (B) or storm runoff (R). Base flow occurs during dry weather conditions, while storm runoff includes flows generated by storm events. This is required information.
Flow Start Date is the date (month, day and 4-digit year) that the measurement began being taken (e.g., 01/01/1998). This is required information.
Flow Start Time is the time at beginning of measurement event, e.g., 23:30. If only flow duration is provided, enter 00:00 for start time and enter the flow duration for end time. This is essential information. If it is currently unavailable, it should be collected in future monitoring efforts.

International Stormwater BMP Database Data Entry Spreadsheets User’s Guide
Release Version 2.0 Page 37 December 2007
Flow End Date is the date (month, day and 4-digit year) that the measurement event ended (e.g., 01/01/1998). The end of runoff event can be defined as that point in time when the recession limb of the hydrograph is <2% of the peak or is within 10% of the pre-storm base flow, whichever is greater. This is essential information. If it is currently unavailable, it should be collected in future monitoring efforts.
Flow End Time is the time at the end of the measurement event, e.g., 01:30. The end of runoff event can be defined as that point in time when the recession limb of the hydrograph is <2% of the peak or is within 10% of the pre-storm base flow, whichever is greater. If only flow duration is provided, enter 00:00 for start time and enter the flow duration for end time. This is essential information. If it is currently unavailable, it should be collected in future monitoring efforts.
Total Storm Flow Volume into or from BMP is the Total Runoff Volume minus the Bypass Volume. Do not include any bypass volume in this field. Units of measurement must also be selected from the provided pick list. If a storm event occurred for which flow and water quality data are being entered into the database, then this is required information. If the BMP is designed to infiltrate storm runoff and no underdrain discharge is present, enter ―0‖ for the flow volume for the outflow monitoring station. If lysimeters are installed at the BMP, depth to groundwater may be entered in the Water Quality table along with the water quality data for the monitoring event.
Peak Storm Flow Rate into or from BMP is the greatest rate of storm flow into or from the BMP, for example 5 cubic feet/second (cfs). Units of measurement must also be selected from the provided pick list. This is essential information. If it is currently unavailable, it should be collected in future monitoring efforts.
Total Bypass Volume, if any, is equal to Total Runoff Volume minus the Runoff Volume Influent to the BMP. Units of measurement must also be selected from the provided pick list. If a storm event occurred for which flow and water quality data are being entered into the database, then this is required information. If the Bypass volume is not monitored, then this should be stated in the Comments field rather than entering ―0‖ values.
Peak Bypass Flow Rate, if any, is the peak rate of flow measured for flows bypassing the BMP. Units of measurement must also be selected from the provided pick list. This is essential information. If it is currently unavailable, it should be collected in future monitoring efforts.
Dry Weather Base Flow Rate is the flow rate during dry-weather conditions. Base flow is collected during non-wet weather conditions. Units of measurement must also be selected from the provided pick list. If base flow related data (i.e., water quality data) are being entered into the database, then this is required information.
Percent Hydrograph Captured reflects the portion of the hydrograph measured (or ―captured‖) in the sampling event. Typically, 100 percent of the hydrograph is targeted for capture in a monitoring event; however, in some cases, such as ―first flush‖ monitoring, only a portion of the rising limb of the hydrograph may be targeted. In other cases, prolonged storm events such as those that occur in the Pacific Northwest, may make capture of the entire hydrograph logistically challenging. In such cases, the portion of the hydrograph reported should be provided rather than omitting the data altogether. This is essential information. Enter data as a percent value rather than a decimal value (e.g., enter 99% rather than 0.99).

International Stormwater BMP Database Data Entry Spreadsheets User’s Guide
Release Version 2.0 Page 38 December 2007
Describe and Estimate De Minimus Flows (if any) is provided to acknowledge that even in well-designed BMP monitoring programs, there are often flows into a BMP that may not be fully captured in the inflow monitoring. Using 10 percent as a general rule of thumb to describe de minimus flows, identify flows that may not be fully reflected in monitored flows. Examples include high groundwater, limited sheet flow from adjacent road or facility slopes. If such water sources are present, describe the source of such flows. Understanding of this issue is often particularly important to Departments of Transportation which are also characterizing pavement runoff as part of their monitoring efforts. This is essential information. If it is currently unavailable, it should be collected in future monitoring efforts.
16. Water Quality Data for Sampling Event
A separate spreadsheet titled ―Water Quality Data‖ is provided that requests sampling event results, including water quality parameter as selected from a pick list of Modern STORET parameters, sample fraction, value, units, qualifier and analysis method. Data requested in this spreadsheet is described in more detail below.
Event Number must be entered as previously defined by the user in spreadsheet 5-Monitoring Events. This is required information necessary to ensure accurate pairing of data associated with an event.
Monitoring Station name must be entered as previously defined by the user in spreadsheet 12-Monitoring Stations. This is required information necessary to ensure accurate pairing of data associated with an event.
Date Water Quality Sample Collected is the date that the water quality sample began being collected. This is required information.
Time Water Quality Sample Collected is the time that the water quality sample began being collected. This is essential information. If it is currently unavailable, it should be collected in future monitoring efforts.
Sample medium can be selected from a drop-down pick list and includes: Groundwater, Surface Runoff/Flow, Soil, Dry Atmospheric Fallout, Wet Atmospheric Fallout, Pond/Lake Water, Accumulated Bottom Sediment, Biological, or Other. This is required information.
Type of samples collected can be selected from a drop-down pick list and includes the type of samples that the instrument including: Flow Weighted Composite EMCs (Event Mean Concentrations), Time Weighted Composite EMCs, Unweighted (mixed) Composite EMCs, or Grab Sample. This is essential information. If it is currently unavailable, it should be collected in future monitoring efforts.
Provide the Number of Samples, If Composite. A composite sample consists of multiple samples of water during a runoff-event that can be collected using a variety of methods such as flow-weighted, time-weighted, grab samples or other approaches. The purpose of a composite sample is to provide an overall picture of the characteristics of the water throughout the runoff event. The Comments field below can be used to describe the type of composite, if any. This is essential information. If it is currently unavailable, it should be collected in future monitoring efforts.

International Stormwater BMP Database Data Entry Spreadsheets User’s Guide
Release Version 2.0 Page 39 December 2007
Modern STORET Characteristic is the name of the constituent analyzed based on the USEPA’s ―modern STORET‖ nomenclature being used in USEPA’s Water Quality Exchange (WQX) database. The relevant constituent should be selected from the WQX pick list. WQX codes must be used to enter water quality data in this database to ensure consistency with other USEPA databases and to provide for standardization of constituent names for later data retrieval. If water quality data are being entered into the database, then this is required information.
Sample Fraction is the fraction of the water quality constituent that was analyzed (e.g., dissolved, total, total recoverable, etc.). This is required information for certain constituents that are reported in multiple forms (e.g., metals). See Spreadsheet 16a to determine whether sample fraction must be reported.
Value of the measured constituent should be provided. If the value is below detection limits, provide the reported detection limit with a ―U‖ qualifier in the qualifier field. Do not use minus signs to indicate values below the detection limit. If water quality data are being entered into the database, then this is required information.
Unit of the measured constituent must be provided. If water quality data are being entered into the database, then this is required information.
Qualifier, if any, for the data should be selected from the Water Quality Qualifier Codes pick list. If water quality data are being entered into the database and a qualifier is warranted to accurately describe the data, then this is required information. Observations in STORET are stored as numerical values usually representing the result of a laboratory or field analysis to quantify the concentration of a chemical in a water sample. In some cases, the numerical value stored represents something other than a normal outcome, and a "Remark Code," or Qualifier, is associated with the value as it is entered.
Detection Limit should be provided with sample results so that comparisons between sites can accurately conducted. This information is essential and is typically provided in most electronic data deliverables and hard-copy laboratory reports.
Detection Limit Type should be provided along with the detection limit. Detection limits are often provided as either Instrument Detection Limits (IDL) or Method Detection Limits (MDL). In some cases such as for bacteria result, an Upper Quantitation Limit (UQL) may be provided. A pick list from USEPA’s WQX Database is provided to complete this field. This information is essential and is typically provided in hard-copy laboratory reports.
Analysis Method should be provided for the constituent. For example: EPA 8270 or Standard Method 513. This information is typically reported in Electronic Data Deliverables and can be easily pasted into this spreadsheet. If water quality data are being entered into the database, then this is essential information. If it is currently unavailable, it should be collected in future monitoring efforts.
Identify Whether the Sample Result is Appropriate for Use in Performance Analysis. This field enables the data to identify data that may have quality limitations. If a ―No‖ flag is identified, it should be described in the comments field. This information is essential.
Provide Additional Comments, If Needed allows the user to clarify special circumstances associated with the sampling event. For example, if all constituents are reported as composite samples except bacteria samples are collected as grab samples. Describe these anomalies in

International Stormwater BMP Database Data Entry Spreadsheets User’s Guide
Release Version 2.0 Page 40 December 2007
the Comments field. This information is nice to have, unless anomalies in monitoring are presents, in such cases it is required information.
17. TSS Settling Velocity Distribution
Event Number must be entered as previously defined by the user in spreadsheet 5-Monitoring Events. This is required information necessary to ensure accurate pairing of data associated with an event.
Monitoring Station name must be entered as previously defined by the user in spreadsheet 12-Monitoring Stations. This is required information necessary to ensure accurate pairing of data associated with an event.
Settling Velocity Distributions are the rates at which suspended sediment settles over time. This can be determined through settling column tests. Based on the results of the test, enter the settling velocities at which various percentiles of the sediment settle. For example, 10 percent of the sediment may settle at a rate of 1 foot/minute or faster, 20 percent may settle at a rate of 1.5 feet/minute or faster, 30 percent may settle at a rate of 2 feet/minute or faster, etc. The Comments field is provided to enable the user to provide additional information about the test. Units of measurement must be provided for each test conducted. Although not essential, this information is nice to have if available. As an alternative to Settling Velocity Distribution tests, some entities may prefer to enter Particle Size Distributions, which can be entered into the Water Quality spreadsheet.
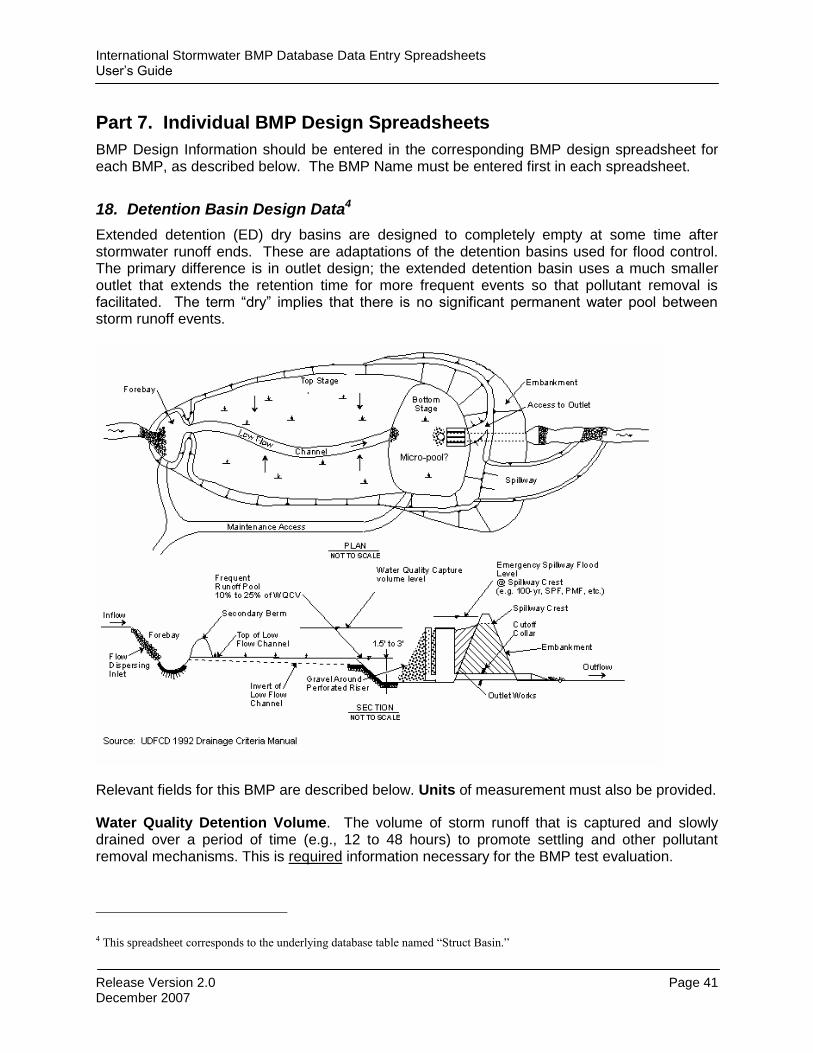
International Stormwater BMP Database Data Entry Spreadsheets User’s Guide
Release Version 2.0 Page 41 December 2007
Part 7. Individual BMP Design Spreadsheets
BMP Design Information should be entered in the corresponding BMP design spreadsheet for each BMP, as described below. The BMP Name must be entered first in each spreadsheet.
18. Detention Basin Design Data4
Extended detention (ED) dry basins are designed to completely empty at some time after stormwater runoff ends. These are adaptations of the detention basins used for flood control. The primary difference is in outlet design; the extended detention basin uses a much smaller outlet that extends the retention time for more frequent events so that pollutant removal is facilitated. The term ―dry‖ implies that there is no significant permanent water pool between storm runoff events.
Relevant fields for this BMP are described below. Units of measurement must also be provided.
Water Quality Detention Volume. The volume of storm runoff that is captured and slowly drained over a period of time (e.g., 12 to 48 hours) to promote settling and other pollutant removal mechanisms. This is required information necessary for the BMP test evaluation.
4 This spreadsheet corresponds to the underlying database table named “Struct Basin.”

International Stormwater BMP Database Data Entry Spreadsheets User’s Guide
Release Version 2.0 Page 42 December 2007
Water Quality Detention Surface Area When Full. The area of the water surface in the detention basin at full water quality detention volume. This is required information necessary for the BMP test evaluation.
Water Quality Detention Basin Length. Length of the water quality detention basin, measured as the distance between inflow and outflow. If there is more that one inflow point, use the average distance between the inflow points and the outflow weighted by the tributary impervious area. This is required information necessary for the BMP test evaluation.
Detention Basin Bottom Area. Area of the bottom of the entire detention basin, not including the side slopes but including the bottom stage area. This is required information necessary for the BMP test evaluation.
Brim-full Volume Emptying Time. Emptying time (in hours) of the water quality detention volume. This is required information necessary for the BMP test evaluation.
Half Brim-full Volume Emptying Time. Emptying time (in hours) of the lower half of the water quality detention volume. This is required information necessary for the BMP test evaluation.
Bottom Stage Volume, If Any. The volume of the lower ―bottom stage‖ portion (if applicable) of the detention basin, which is designed to fill with runoff from smaller, more frequent storm events. If a bottom stage is present, then this is required information necessary for the BMP test evaluation.
Bottom Stage Surface Area, If Any. The surface area of the lower ―bottom stage‖ portion (if applicable) of the detention basin, which is designed to fill with runoff from smaller, more frequent storm events. If a bottom stage is present, then this is required information necessary for the BMP test evaluation.
Is There a Micro Pool? Enter Y=Yes or N=No. Identify whether there is a small (i.e., micro) permanent pool within the bottom stage of the basin near the outlet. If a micro-pool is present, then this is required information necessary for the BMP test evaluation.
Forebay Volume. Volume of the forebay portion of the detention basin when filled to the point of overflow into the rest of the basin. The forebay (if it exists) captures the initial inflow entering the detention basin to remove the bulk of sediments, routing its overflow to the bottom stage. If a forebay is present, then this is required information necessary for the BMP test evaluation.
Forebay Surface Area. Surface area of water in the forebay at the level of overflow to the bottom stage. If a forebay is present, then this is required information necessary for the BMP test evaluation.
Describe Vegetation Cover Within Basin. Describe the types of vegetation on the basin sides and floor. This is required information necessary for the BMP test evaluation.
Flood Control Volume, If Any. It is often feasible and desirable to establish the water quality detention basin within a larger flood control facility. If this is the case for this basin, record the volume of the flood control detention volume in excess of the water quality detention basin volume (if any). If a flood control is present, then this is required information necessary for the BMP test evaluation.

International Stormwater BMP Database Data Entry Spreadsheets User’s Guide
Release Version 2.0 Page 43 December 2007
List Design Flood Return Periods. If the water quality detention basin is embedded within a larger flood control facility, list the flood return period (in years) for which the above flood control volume is designed (e.g., 25-year). If the basin is embedded in a flood control facility, then this is required information necessary for the BMP test evaluation.
Depth to Seasonal High Water Table, If Known. Report the minimum depth to the water table during the monitoring season. Although not essential, this information is nice to have if available.

International Stormwater BMP Database Data Entry Spreadsheets User’s Guide
Release Version 2.0 Page 44 December 2007
19. Retention Pond Design Data
Retention ponds are also commonly known as ―wet ponds‖ because they have a permanent pool of water, unlike detention basins, which dry out between storms. The permanent pool of water is replaced in part or in total by stormwater during a storm event. The design is such that any available surcharge capture volume is released over time. The hydraulic residence time (HRT) for the permanent pool over time can provide biochemical treatment. A dry weather base flow, pond liner and/or high groundwater table are required to maintain the permanent pool.
Relevant fields for this BMP are described below. Units of measurement must also be provided.
Volume of permanent pool. Volume of the permanent pool of water. This is required information necessary for the BMP test evaluation.
Permanent Pool Surface Area. Area of the water surface in the permanent pool. This is required information necessary for the BMP test evaluation.
Permanent Pool Length. Length of the permanent pool of water, measured as the distance between inflow and outflow. If more that one inflow point, use the average distance between the inflow points and the outflow weighted by the tributary impervious area. This is required information necessary for the BMP test evaluation.
Littoral Zone Surface Area. Surface area of the littoral zone. The littoral zone refers to the area above the level of the permanent pool that is periodically and temporarily covered by captured storm runoff. This is essential information, but absence of this information should not

International Stormwater BMP Database Data Entry Spreadsheets User’s Guide
Release Version 2.0 Page 45 December 2007
preclude inclusion of the data into the national database. However, this data should be collected in future monitoring efforts.
Littoral Zone Plant Species List. List plant species (by Latin name, if known), percent of cover and densities in the littoral zone. This is required information necessary for the BMP test evaluation.
Water Quality Surcharge Detention Volume When Full. Retention ponds may be designed to handle a specified volume of runoff above the permanent pool, releasing this surcharge volume to the pool over a specified period of time through an outlet structure. Specify the surcharge detention volume. This is required information necessary for the BMP test evaluation.
Water Quality Surcharge Surface Area When Full. The surface area of any supplementary water quality detention volume above the permanent pool, if applicable. This is required information necessary for the BMP test evaluation.
Water Quality Surcharge Basin Length. Length of the water quality detention volume, measured as the distance between inflow and outflow. If more that one inflow point, use the average distance between the inflow points and the outflow weighted by the tributary impervious area. This is required information necessary for the BMP test evaluation.
Brim-full Emptying Time For Surcharge. The period of time (in hours) required for the retention pond water quality surcharge detention volume to be released to the permanent pool. This is required information necessary for the BMP test evaluation.
Half Brim-full Emptying Time For Surcharge. Period of time (in hours) required for the lower half of the retention pond water quality surcharge detention volume to be released to the permanent pool. This is required information necessary for the BMP test evaluation.
Forebay Volume. Volume of the forebay portion of the retention basin when it is filled to the point of overflow into the lower part of the basin. The forebay captures the initial inflow entering the basin to remove the bulk of sediments, with overflow routed to the lower pond. This is required information necessary for the BMP test evaluation.
Forebay Surface Area. Surface area of water in the forebay when it is filled to the point of overflow into the lower part of the basin. This is required information necessary for the BMP test evaluation.
Describe Vegetation Cover Within Basin. Describe the types of vegetation (provide Latin names, if known) on the basin sides and floor. This is required information necessary for the BMP test evaluation.
Flood Control Volume, If Any. It is often feasible and desirable to incorporate the water quality retention basin within a larger flood control facility. If this is the case for this basin, record the volume of the flood control detention volume in excess of the retention basin volume. If a flood control volume is included, then this is required information necessary for the BMP test evaluation.
List Design Flood Return Periods (in years). If the water quality retention basin is embedded within a larger flood control facility, list the flood return periods (in years) for which the above

International Stormwater BMP Database Data Entry Spreadsheets User’s Guide
Release Version 2.0 Page 46 December 2007
flood control volume is designed (e.g., 25 for a 25-year flood). This is required information necessary for the BMP test evaluation.
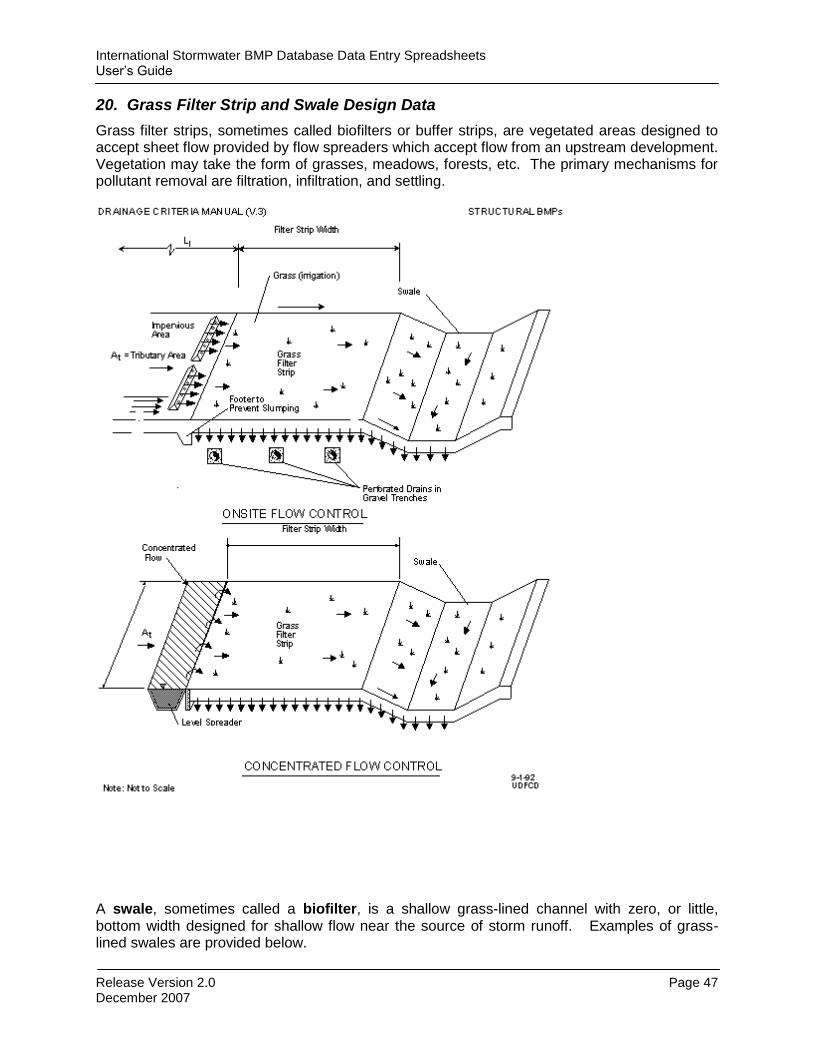
International Stormwater BMP Database Data Entry Spreadsheets User’s Guide
Release Version 2.0 Page 47 December 2007
20. Grass Filter Strip and Swale Design Data
Grass filter strips, sometimes called biofilters or buffer strips, are vegetated areas designed to accept sheet flow provided by flow spreaders which accept flow from an upstream development. Vegetation may take the form of grasses, meadows, forests, etc. The primary mechanisms for pollutant removal are filtration, infiltration, and settling.
A swale, sometimes called a biofilter, is a shallow grass-lined channel with zero, or little, bottom width designed for shallow flow near the source of storm runoff. Examples of grass-lined swales are provided below.
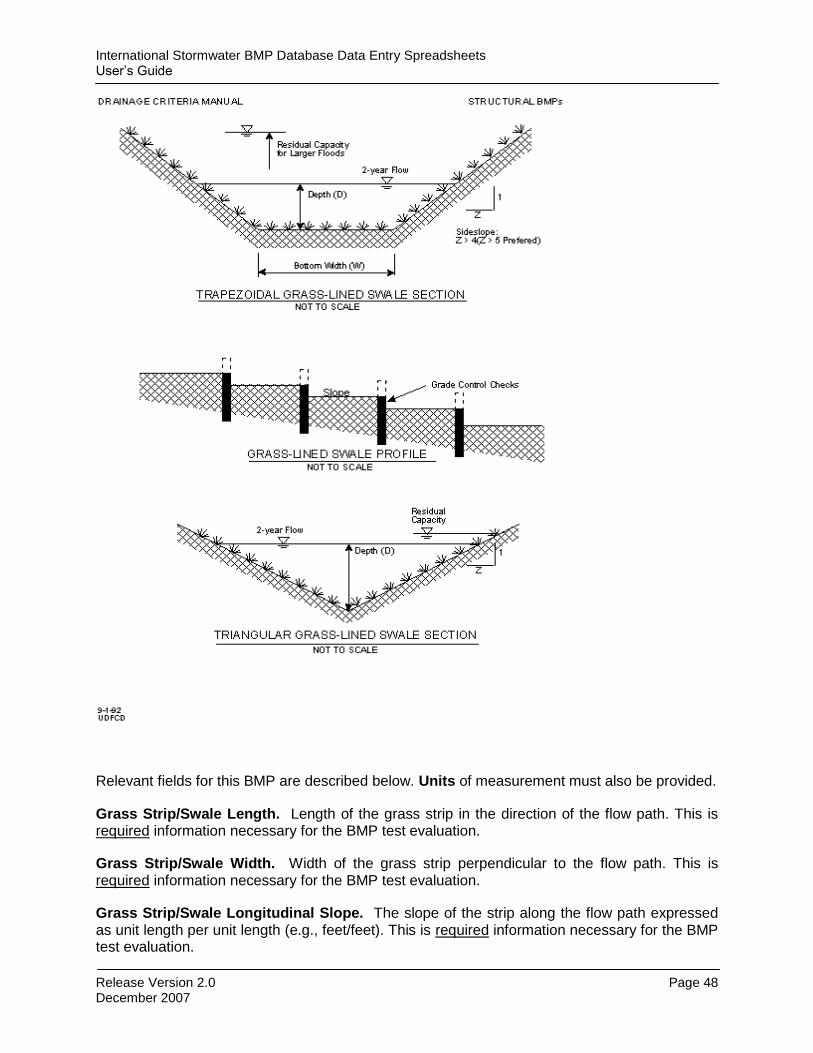
International Stormwater BMP Database Data Entry Spreadsheets User’s Guide
Release Version 2.0 Page 48 December 2007
Relevant fields for this BMP are described below. Units of measurement must also be provided.
Grass Strip/Swale Length. Length of the grass strip in the direction of the flow path. This is required information necessary for the BMP test evaluation.
Grass Strip/Swale Width. Width of the grass strip perpendicular to the flow path. This is required information necessary for the BMP test evaluation.
Grass Strip/Swale Longitudinal Slope. The slope of the strip along the flow path expressed as unit length per unit length (e.g., feet/feet). This is required information necessary for the BMP test evaluation.

International Stormwater BMP Database Data Entry Spreadsheets User’s Guide
Release Version 2.0 Page 49 December 2007
Flow Depth during 2-Year Storm. The design depth of flow over the strip during the 2-year storm peak flow. This is required information necessary for the BMP test evaluation.
2-Year Peak Flow Velocity. The design flow velocity over the strip during the 2-year peak flow. This is required information necessary for the BMP test evaluation.
Describe Grass Species and Densities. List the grass species and their densities. This is required information necessary for the BMP test evaluation.
Is Strip Irrigated? Enter Y=Yes if the strip is artificially watered during any part of the year, N=No if it is not. This is required information necessary for the BMP test evaluation.
Estimated Manning's n During 2-Year Flow. The Manning’s roughness factor n expresses the degree of resistance to flow over the surface due to filter strip vegetation; here n should be estimated for the 2-year peak runoff event. The Manning’s n is larger for rougher surfaces (e.g., high, dense vegetation) that increase flow friction. Although not essential, this information is nice to have if available.
Depth to Groundwater or Impermeable Layer. Depth to the seasonal high groundwater table and/or the impermeable layer, whichever is shallower. Although not essential, this information is nice to have if available.
Measured Saturated Infiltration Rate, if Known. Rate of infiltration into the filter strip under saturated soil conditions, based on soil surveys or infiltrometer measurements. Although not essential, this information is nice to have if available.
NRCS Hydrologic Soil Group. The Natural Resource Conservation Service Hydrologic Soil Group (e.g., A, B, C, or D) comprising the infiltrating surface. This classification reflects the infiltration rate of the soil, with Group A soils having the highest rates of infiltration and Group D soils having the lowest. This is essential information, but absence of this information should not preclude inclusion of the data into the national database. However, this data should be collected in future monitoring efforts.
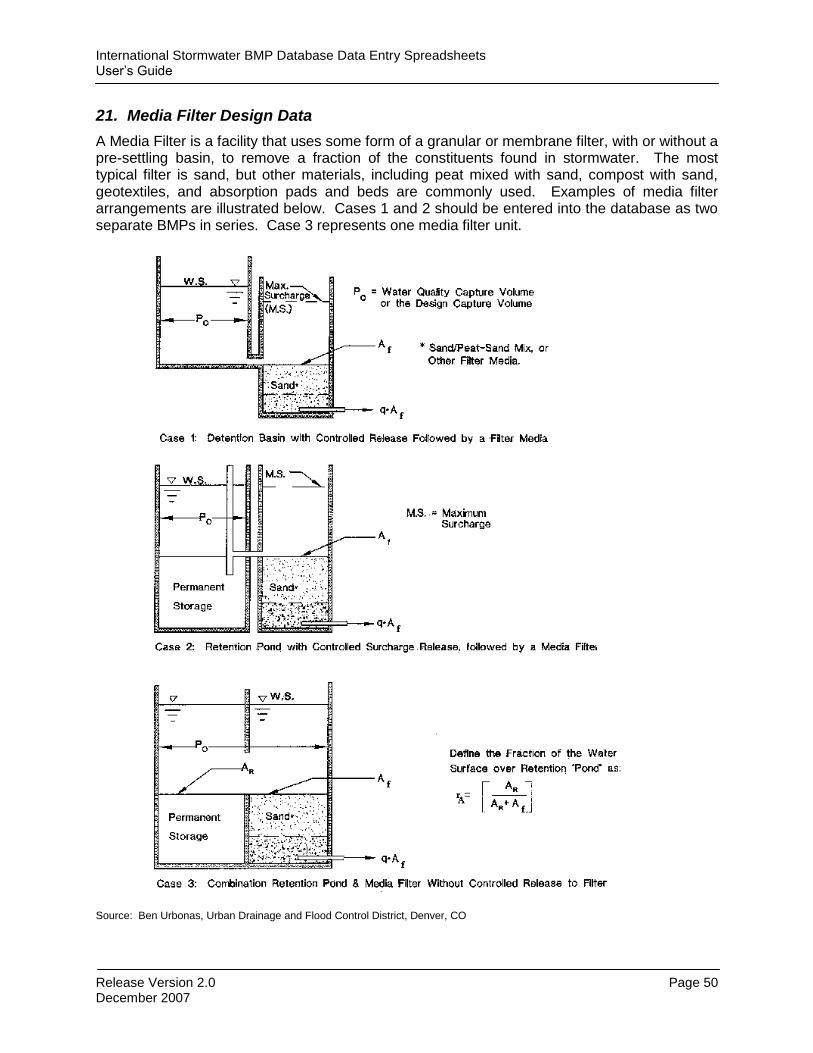
International Stormwater BMP Database Data Entry Spreadsheets User’s Guide
Release Version 2.0 Page 50 December 2007
21. Media Filter Design Data
A Media Filter is a facility that uses some form of a granular or membrane filter, with or without a pre-settling basin, to remove a fraction of the constituents found in stormwater. The most typical filter is sand, but other materials, including peat mixed with sand, compost with sand, geotextiles, and absorption pads and beds are commonly used. Examples of media filter arrangements are illustrated below. Cases 1 and 2 should be entered into the database as two separate BMPs in series. Case 3 represents one media filter unit.
Source: Ben Urbonas, Urban Drainage and Flood Control District, Denver, CO

International Stormwater BMP Database Data Entry Spreadsheets User’s Guide
Release Version 2.0 Page 51 December 2007
Relevant fields for this BMP are described below. Units of measurement must also be provided.
Permanent Pool Volume Upstream of Filter Media, If Any. Volume of the permanent pool (if any) if the pool is part of the filter basin installation and not a separate pretreatment retention pond or a detention basin. If a sedimentation basin is present, this is required information necessary for the BMP test evaluation.
Permanent Pool Surface Area of Sedimentation Basin Preceding Filter, If Any. Area of the water surface in the permanent pool (if any). If a sedimentation basin is present, this is required information necessary for the BMP test evaluation.
Permanent Pool Length of Sedimentation Basin Preceding Filter, If Any. Length of the permanent pool (if any) measured as the distance from pool inflow to outflow. If more than one inflow point, use the average length. If a sedimentation basin is present, this is required information necessary for the BMP test evaluation.
Surcharge Detention Volume, Including Volume Above the Filter Bed. The design water quality capture volume, including the volume above the filter. This is required information necessary for the BMP test evaluation.
Surcharge Detention Volume’s Surface Area. The surface area of the design water quality capture volume including the area above the filter. This is required information necessary for the BMP test evaluation.
Surcharge Detention Volume’s Length. The length of the design captured runoff volume, including the portion above the filter, measured as the distance along the flow path. If more than one inflow point, use the average length. Although not essential, this information is nice to have if available.
Surcharge Detention Volume’s Design Depth. The design depth of water quality capture volume that can be stored above the filter before overflow or runoff bypass occurs. This is required information necessary for the BMP test evaluation.
Surcharge Detention Volume's Design Drain Time, If Controlled and Known. The design time for complete drawdown (in hours) of the water quality capture volume if the drain time is controlled by a flow regulating device such as an orifice. Leave blank if the drain rate is only a fraction of the filter’s flow-through rate. This is required information necessary for the BMP test evaluation if the emptying time is controlled by a flow regulating device. Absence of this information will not cause the test record to be flagged as incomplete but should be provided if applicable.
Media Filter Surface Area. Total surface area of the media filter (e.g., the sand bed or geotextile filter) orthogonal to the flow. This is required information necessary for the BMP test evaluation.
Angle of Sloping or Vertical Filter Media. Is the media filter surface horizontal, sloping or vertical? Provide this information in degrees above the horizontal plane (i.e., 0 to 90 degrees). For example, a horizontal filter media would be entered as 0 degrees and a vertical filter would be entered as 90 degrees. This is required information necessary for the BMP test evaluation.

International Stormwater BMP Database Data Entry Spreadsheets User’s Guide
Release Version 2.0 Page 52 December 2007
Number of Media Layers in Filter. The number of layers of different filter materials in this BMP. This is required information necessary for the BMP test evaluation.
Describe Depth and Type of Each Filter Media Layer. Describe the type of media used in the filter. (Examples: ASTM C-33 Sand with d50 = 0.7 mm, 50% ASTM C-33 Sand with d50 = 0.6 mm and 50% Peat, Non-Woven Geotextile Fabric with 100 micron effective pore openings, Non-Woven Geotextile with 100 micron effective pore openings above the ASTM C-33 sand with d50 = 0.7 mm, etc.). Also, provide a depth or thickness of each layer. This is required information necessary for the BMP test evaluation.

International Stormwater BMP Database Data Entry Spreadsheets User’s Guide
Release Version 2.0 Page 53 December 2007
22. Porous Pavement Design Data
There are multiple forms of porous pavement that are generally categorized as: porous asphalt, pervious concrete, porous aggregate, porous turf, and modular block. Modular block is porous due to its structure, and poured-in-place concrete or asphalt is porous due to the mix of the materials. Modular block porous pavement consists of perforated concrete slab units underlain with gravel. The surface perforations are filled with coarse sand or sandy turf. It is used in low traffic areas to accommodate vehicles while facilitating stormwater runoff at the source. It should be placed in a concrete grid that restricts horizontal movement of infiltrated water through the underlying gravels.
Poured-in-place porous concrete or asphalt is generally placed over a substantial layer of granular base. The pavement is similar to conventional materials, except for the elimination of sand and fines from the mix.
If infiltration to ground water is not desired, a liner may be used below the porous media along with a perforated pipe and a flow regulator to slowly drain the water stored in the media over a 6 to 12 hour period.

International Stormwater BMP Database Data Entry Spreadsheets User’s Guide
Release Version 2.0 Page 54 December 2007
Relevant fields for this BMP are described below. Units of measurement must also be provided.
Porous Pavement Surface Area. Surface area of the porous pavement. This is required information necessary for the BMP test evaluation.
Depth to Seasonal High Groundwater. The minimum depth to the seasonal water table below the porous pavement. This is required information necessary for the BMP test evaluation.
Depth to Impermeable Layer. The depth to the first impermeable layer below the BMP, if known. This is required information necessary for the BMP test evaluation.
NRCS Hydrologic Soil Group. The Natural Resource Conservation Service Hydrologic Soil Group (e.g., A, B, C, or D) comprising the infiltrating surface. This classification reflects the infiltration rate of the soil, with Group A soils having the highest rates of infiltration and Group D soils having the lowest. This is essential information, but absence of this information should not preclude inclusion of the data into the national database. However, this data should be collected in future monitoring efforts.
Infiltration Rate. Rate of infiltration for site soils under saturated conditions, based on soil surveys or infiltrometer measurements. This is required information necessary for the BMP test evaluation.
Type of Granular or Other Materials Used in or Below Pavement. Describe the type and depth of each granular material layer under the porous pavement, if any. Include each layer of geotextile fabric used as though it was a granular layer. If such material is present, then this is required information necessary for the BMP test evaluation.
Porosity of Granular Materials, as a Percent. Porosity (in percent) of the granular or soil filter material. Porosity measures the volumetric portion of the filter material that is not occupied by solid material (for example, clean sands and gravels typically have porosities of 25-50%; this space is occupied by air or water). If the layer is geotextile fabric, give the effective pore size. This is required information necessary for the BMP test evaluation.
Is Grass Growing in Modular Pores? Enter Y=Yes or N=No. This is essential information, but absence of this information should not preclude inclusion of the data into the national database. However, this data should be collected in future monitoring efforts.
If Yes, is Grass Healthy? Enter Y=Yes or N=No. This is essential information, but absence of this information should not preclude inclusion of the data into the national database. However, this data should be collected in future monitoring efforts.
Total Storage Volume Above Pavement, If Any. Give the net available volume of storage above the porous pavement, if any. If present, this is required information necessary for the BMP test evaluation.
Estimated Drain Time of Storage Volume Above Pavement, If Any. Provide the total emptying time (in hours) for any detention volume above the pavement. If present, this is required information necessary for the BMP test evaluation.
Total Storage Volume Under Pavement, If Any. Give the net available volume of the pore spaces in the granular materials under the porous pavement, if any. This would normally equal the volume of the granular materials times their porosity adjusted for loss of volume due to sloping surfaces. If present, this is required information necessary for the BMP test evaluation.
Estimated Drain Time of Storage Volume Under Pavement, If Any. When granular materials under the pavement are used to detain surface runoff which is then released to the

International Stormwater BMP Database Data Entry Spreadsheets User’s Guide
Release Version 2.0 Page 55 December 2007
surface drainage system, similar to an underdrain, give the total emptying time (in hours) for this detention volume. If present, this is required information necessary for the BMP test evaluation.
Groundwater Hydraulic Conductivity. The hydraulic conductivity of the groundwater underlying the BMP. Hydraulic conductivity is an expression of the permeability of a porous material. This is essential information, but absence of this information should not preclude inclusion of the data into the national database. However, this data should be collected in future monitoring efforts.
Groundwater Flow Gradient. The flow gradient (in unit length per unit length, e.g. feet/feet). of groundwater below the infiltration basin. The flow gradient may be thought of as the slope of the local groundwater table. This is essential information, but absence of this information should not preclude inclusion of the data into the national database. However, this data should be collected in future monitoring efforts.
Does Porous Pavement Have Underdrains? The granular base under porous pavement is frequently drained with the aid of perforated pipes installed, for example, at set intervals. Enter Y=Yes if this BMP has underdrains, N=No if it does not. This is required information necessary for the BMP test evaluation.
Describe Depth of Each Soil Layer Below Pavement, If Known. Give the order of stratification (from the surface downward) and the depth of each layer of soils below the porous pavement, to a depth of at least ten feet (3.05 meters). This is essential information, but absence of this information should not preclude inclusion of the data into the national database. However, this data should be collected in future monitoring efforts.
Describe Purpose of Porous Pavement. Describe the purpose(s) of the porous pavement (examples: water quality treatment, reduction in peak surface runoff rate and volume, groundwater recharge, etc.) Although not essential, this information is nice to have if available.

International Stormwater BMP Database Data Entry Spreadsheets User’s Guide
Release Version 2.0 Page 56 December 2007
23. Infiltration Basin Design Data
An infiltration basin is a basin that can capture a given stormwater runoff volume and infiltrate it into the ground, transferring this volume from surface flow to groundwater flow. A schematic of an infiltration basin is provided below.
Relevant fields for this BMP are described below. Units of measurement must also be provided.
Capture Volume of Basin. The design runoff capture volume of the basin. This is required information necessary for the BMP test evaluation.
Surface Area of Capture Volume, When Full. The area of the water surface in the infiltration basin, when full. This is required information necessary for the BMP test evaluation.
Infiltrating Surface Area. The plan area of the surface used to infiltrate the water quality volume. This is required information necessary for the BMP test evaluation.
Basin Length. Length of the infiltration basin, measured as the distance between inflow and outflow. Although not essential, this information is nice to have if available.

International Stormwater BMP Database Data Entry Spreadsheets User’s Guide
Release Version 2.0 Page 57 December 2007
Depth to Seasonal High Groundwater Below Infiltrating Surface. Depth to the seasonal high groundwater table. This is required information necessary for the BMP test evaluation.
Depth to Impermeable Layer Below Infiltrating Surface. Depth to the impermeable layer, if any. If such a layer is present, then this is required information necessary for the BMP test evaluation.
NRCS Hydrologic Soil Group. The Natural Resource Conservation Service Hydrologic Soil Group (e.g., A, B, C, or D) comprising the infiltrating surface. This classification reflects the infiltration rate of the soil, with Group A soils having the highest rates of infiltration and Group D soils having the lowest. This is essential information, but absence of this information should not preclude inclusion of the data into the national database. However, this data should be collected in future monitoring efforts.
Depth and Type of Each Layer of Soil. Give the order of stratification (from the surface downward) and the depth of each layer of soils at the infiltration basin site, to a depth of at least ten feet (3.05 meters). This is essential information, but absence of this information should not preclude inclusion of the data into the national database. However, this data should be collected in future monitoring efforts.
Field Measured Infiltration Rate. The saturated soil infiltration rate, based on soil surveys, infiltrometer measurements or observed draw down of a new basin. This is essential information, but absence of this information should not preclude inclusion of the data into the national database. However, this data should be collected in future monitoring efforts.
List Plant Species on Infiltrating Surface. List the plant species (by Latin names, if known) and densities of cover on the bottom of the infiltration basin. This is required information necessary for the BMP test evaluation.
Describe Granular Material on Infiltrating Surface, If Any. Describe the granular material, if any, and its depth and porosity, if such material is used to cover basin’s bottom instead of grass. If such material is present, then this is required information necessary for the BMP test evaluation.
Hydraulic Conductivity of Underlying Soils. The hydraulic conductivity of the soils underlying the infiltration surface. Hydraulic conductivity is an expression of the permeability of a porous material. This is essential information, but absence of this information should not preclude inclusion of the data into the national database. However, this data should be collected in future monitoring efforts.
Groundwater Flow Gradient. The flow gradient (in unit length per unit length, e.g. feet/feet) of groundwater below the infiltration basin. The flow gradient may be thought of as the slope of the local ground water table. This is essential information, but absence of this information should not preclude inclusion of the data into the national database. However, this data should be collected in future monitoring efforts.
Flood Control Volume Above Water Quality Detention Volume. It is often feasible and desirable to establish the infiltration basin within a larger flood control facility. If this is the case for this basin, record the volume of the flood control detention volume above the infiltration basin volume. This is essential information, but absence of this information should not preclude
International Stormwater BMP Database Data Entry Spreadsheets User’s Guide
Release Version 2.0 Page 58 December 2007
inclusion of the data into the national database. However, this data should be collected in future monitoring efforts.
List All Design Flood Control Return Periods. List the flood return periods being controlled by the flood control volume, if the infiltration basin is incorporated within a larger flood control facility. This is essential information, but absence of this information should not preclude inclusion of the data into the national database. However, this data should be collected in future monitoring efforts.
Describe Purpose of Basin. Describe the purpose of the infiltration basin (e.g., surface water quality only, groundwater recharge, etc.). Although not essential, this information is nice to have if available.

International Stormwater BMP Database Data Entry Spreadsheets User’s Guide
Release Version 2.0 Page 59 December 2007
24. Percolation Trench and Dry Well Design Data
Percolation or infiltration trenches can be generally described as a ditch filled with porous media designed to encourage rapid percolation of runoff to the groundwater. A dry well is a drilled well, often drilled through impervious layers to reach lower pervious layers, filled with porous media designed to percolate surface water to groundwater. An illustration of an idealized percolation trench is provided below.
Relevant fields for this BMP are described below. Units of measurement must also be provided.
Percolation Trench/Well Surface Area. The top surface area of the percolation trench or well. This is required information necessary for the BMP test evaluation.
Percolation Trench/Well Length. The length of the percolation trench, or the diameter of the well. This is required information necessary for the BMP test evaluation.
Percolation Trench/Well Depth. The depth of the trench or the well that is exposed to permeable soils. This is required information necessary for the BMP test evaluation.
Depth to Seasonal High Groundwater Below Bottom of Trench/Well. The minimum depth to the seasonal high groundwater table below the trench or well. This is required information necessary for the BMP test evaluation.
Depth to Impermeable Layer Below Bottom of Trench/Well. The depth to the first impermeable layer below the trench or well. This is required information necessary for the BMP test evaluation.
Depth and Type of Each Soil Layer Adjacent To and Below Trench/Well. Give the order of stratification (from the surface downward) and the depth of each layer of soils at the BMP site. This is required information necessary for the BMP test evaluation.
International Stormwater BMP Database Data Entry Spreadsheets User’s Guide
Release Version 2.0 Page 60 December 2007
Type and Gradation of Granular Materials Used in Trench/Well. Describe the type and depth of granular material used in the trench or well. This is required information necessary for the BMP test evaluation.
Was Geotextile Used Above Granular Trench Fill? Enter Y=Yes or N=No. This is required information necessary for the BMP test evaluation.
Was Geotextile Used On the Sides of Granular Fill? Enter Y=Yes or N=No. This is required information necessary for the BMP test evaluation.
Was Geotextile Used On the Bottom of Granular Fill? Enter Y=Yes or N=No. This is required information necessary for the BMP test evaluation.
Porosity of Granular or Soil Materials, as a Percent. Give porosity (in percent) of the granular fill material. Porosity measures the portion of the fill material volume that is not occupied by solids (for example, clean sands and gravels typically have porosities of 25-50%; this volume is occupied by air or water). If the layer is geotextile fabric, give the effective pore size. This is required information necessary for the BMP test evaluation.
Total Storage Pore Volume in Trench. Give the volume of the available pore space in the granular materials. This will normally equal the product of the volume of granular material and its porosity. This is required information necessary for the BMP test evaluation.
Describe Type of Geotextile Used. Describe the types and locations of the geotextile fabrics used in the trench or well, if any. Include the effective pore opening of the fabrics. If used, this is required information necessary for the BMP test evaluation.
Hydraulic Conductivity of Adjacent Soils. The hydraulic conductivity of the soils adjacent to the trench or well infiltration surfaces. Hydraulic conductivity is an expression of the permeability of porous material. This is required information necessary for the BMP test evaluation.
Groundwater Flow Gradient. The flow gradient of groundwater below the infiltration basin (expressed as unit length per unit length, e.g., feet/feet). The flow gradient may be thought of as the slope of the local groundwater table. This is required information necessary for the BMP test evaluation.
Purpose of Trench or Well. Describe the purpose of the percolation trench or well (e.g., water quality treatment, reduction of surface runoff, groundwater recharge, etc.). Although not essential, this information is nice to have if available.

International Stormwater BMP Database Data Entry Spreadsheets User’s Guide
Release Version 2.0 Page 61 December 2007
25. Wetland Channel and Swale Design Data
A wetland channel is a channel designed to flow very slowly, probably less than two feet per second at the two-year flood peak flow rate. It has, or is designed to develop, dense wetland vegetation on its bottom.
Relevant fields for this BMP are described below. Units of measurement must also be provided.
Length of Channel/Swale. The length of the wetland channel or swale, from the stormwater inflow to outflow point. This is required information necessary for the BMP test evaluation.
Longitudinal Slope of Channel/Swale. The average longitudinal slope (in unit length per unit drop, e.g., feet per feet or meter per meter) of the wetland channel or swale, as measured between grade control structures. This is required information necessary for the BMP test evaluation.
Bottom Width of Channel/Swale. The average width of the nearly-flat bottom of the channel or swale between its side slopes. This is required information necessary for the BMP test evaluation.
Side Slope of Channel/Swale. The average (in vertical unit length per horizontal unit length) of the channel or swale’s side slopes. This is required information necessary for the BMP test evaluation.
Average Longitudinal Inflow Spacing. The average longitudinal spacing between all separate stormwater inflow points. This is essential information, but absence of this information should not preclude inclusion of the data into the national database. However, this data should be collected in future monitoring efforts.
2-Yr Flow Design Depth in Channel/Swale. The average depth of water in the channel or swale during the two-year flood peak flow. This is required information necessary for the BMP test evaluation.
2-Yr Peak Design Flow Velocity. The flow velocity in the channel or swale during the two-year flood peak flow. This is required information necessary for the BMP test evaluation.
2-Yr Manning's n. The Manning’s roughness factor n expresses the resistance to surface flow due to roughness such as vegetation; here n should be measured or estimated for the 2-year peak flow. The Manning’s factor is larger for rougher surfaces (e.g., high, dense vegetation) that increase flow friction. This is essential information, but absence of this information should not preclude inclusion of the data into the national database. However, this data should be collected in future monitoring efforts.
Depth to High Groundwater or Impermeable Layer. The minimum depth to the water table during the high water table season, or to the first impermeable layer. Although not essential, this information is nice to have if available.
Groundwater Hydraulic Conductivity. The hydraulic conductivity of the groundwater below the channel or swale. Hydraulic conductivity is an expression of the permeability of porous material. Although not essential, this information is nice to have if available.

International Stormwater BMP Database Data Entry Spreadsheets User’s Guide
Release Version 2.0 Page 62 December 2007
Type of Plant Species in Wetland Zone or Swale. List the plant species, percent of cover and densities. This is required information necessary for the BMP test evaluation.
Maximum Design Flow Capacity Return Period of Swale. The flood return period that the channel has been designed to convey within its banks in addition to the water quality design event. (Example: 2-year and 10-year flood). Although not essential, this information is nice to have if available.

International Stormwater BMP Database Data Entry Spreadsheets User’s Guide
Release Version 2.0 Page 63 December 2007
26. Wetland Basin Design Data
A wetland basin is a BMP similar to a retention pond (with a permanent pool of water) with more than 50 percent of its surface covered by emergent wetland vegetation, or similar to a detention basin (no significant permanent pool of water) with most of its bottom covered with wetland vegetation.
Relevant fields for this BMP are described below. Units of measurement must also be provided.
Volume of permanent pool. Volume of the permanent pool of water, if any. If present, this is required information necessary for the BMP test evaluation.
Permanent Pool Surface Area. Area of the water surface in the permanent pool, if any. If present, this is required information necessary for the BMP test evaluation.
Permanent Pool Length. Length of the permanent pool of water, if any, measured as the distance between inflow and outflow. If more that one inflow point, use the average distance between the inflow points and the outflow weighted by the tributary impervious area. If present, this is required information necessary for the BMP test evaluation.
Water Quality Surcharge Detention Volume When Full. Wetland basins may be designed to handle a specified volume of runoff above the permanent pool, releasing this surcharge volume to the pool over a specified period of time through an outlet structure. Specify the surcharge detention volume. This is required information necessary for the BMP test evaluation.
International Stormwater BMP Database Data Entry Spreadsheets User’s Guide
Release Version 2.0 Page 64 December 2007
Water Quality Surcharge Surface Area When Full. The surface area of any supplementary water quality detention volume above the permanent pool, if applicable. This is required information necessary for the BMP test evaluation.
Water Quality Surcharge Basin Length. Length of the water quality detention volume, measured as the distance between inflow and outflow. If more that one inflow point, use the average distance between the inflow points and the outflow weighted by the tributary impervious area. This is required information necessary for the BMP test evaluation.
Brim-full Emptying Time For Surcharge. The period of time (in hours) required for the wetland basins water quality surcharge detention volume to be released to the permanent pool. This is required information necessary for the BMP test evaluation.
Half Brim-full Emptying Time For Surcharge. Period of time (in hours) required for the lower half of the water quality surcharge detention volume to be released to the permanent pool. This is required information necessary for the BMP test evaluation.
Forebay Volume. Volume of the forebay portion of the wetland basin when it is filled to the point of overflow into the rest of the basin. The forebay captures the initial inflow entering the basin to remove the bulk of sediments. This is required information necessary for the BMP test evaluation.
Forebay Surface Area. Surface area of water in the forebay when it is filled to the point of overflow into the rest of the basin. This is required information necessary for the BMP test evaluation.
Flood Control Volume, If Any. It is often feasible and desirable to incorporate the wetland basin within a larger flood control facility. If this is the case for this basin, record the volume of the flood control detention volume above the wetland basin volume. If a flood control volume is included, then this is required information necessary for the BMP test evaluation.
List Design Flood Return Periods. If the wetland basin is embedded within a larger flood control facility, list the flood return periods (in years) for which the above flood control volume is designed (e.g., 25 for a 25-year flood). This is required information necessary for the BMP test evaluation.
Wetland Surface Area. Surface area of the wetland basin, including all pond areas and meadow wetland areas. Use permanent pool surface area if no other wetland area exists adjacent to the pool. This is required information necessary for the BMP test evaluation.
Percent of Wetland Pond with 12 inches (0.3 m) Depth. Percent of the wetland basin’s surface area typically having 12 inches (0.3 m) or less water depth. This is required information necessary for the BMP test evaluation.
Percent of Wetland Pond with 12 - 24” (0.3 - 0.6 m) Depth. Percent of the wetland basin’s surface area typically having 12 to 24 inches (0.3 - 0.6 m) water depth. This is required information necessary for the BMP test evaluation.
Percent of Wetland Pond with 24 - 48” (0.6 - 1.3 m) Depth. Percent of the wetland basin’s surface area typically having 24 to 48 inches (0.6 - 1.3 m) water depth. This is required information necessary for the BMP test evaluation.

International Stormwater BMP Database Data Entry Spreadsheets User’s Guide
Release Version 2.0 Page 65 December 2007
Percent of Wetland Pond with > 48” (> 1.3 m) Depth. Percent of the wetland basin’s surface area typically having greater than 48 inches (> 1.3 m) water depth. This is required information necessary for the BMP test evaluation.
Percent of wetland basin's area that is meadow wetland. Percent of the wetland basin that is meadow area, that is, area without standing water. This is required information necessary for the BMP test evaluation.
List All Known Plant Species in the Wetland. Provide type and percent cover of the wetland basin by each wetland species, and densities. This is required information necessary for the BMP test evaluation.

International Stormwater BMP Database Data Entry Spreadsheets User’s Guide
Release Version 2.0 Page 66 December 2007
27. Manufactured Device
The Manufactured Device (MD) category represents a wide range of various proprietary and non-proprietary device types. BMPs categorized as manufactured devices incorporate or emphasize a variety of different unit processes and design elements (e.g., storage versus flow-through designs, inclusion of media filtration, etc.) that vary significantly throughout the category.
Select Device Type from the following drop-down list:
1 Flow through – single-chamber
2 Flow through – multi-chamber
3 Volume Capture – extended detention w/ pool
4 Volume Capture – extended detention w/o pool
5 Media Filter – single-chamber
6 Media Filter – multi-chamber
7 Inlet Insert – screen
8 Inlet Insert – filter fabric
9 Inlet Insert – skimmer
10 Other
Characterize as Flow-through (F) or Capture and Release (C). Manufactured devices have two basic design approaches: 1) those that are basically flow-through devices and 2) those that capture or store runoff then release the runoff. This is an important distinction necessary to properly interpret BMP performance for manufactured devices. This is required information necessary for the BMP test evaluation.
Volume of Permanent Pool. The volume of storm runoff that is captured and released over a period of time (e.g., 12 to 48 hours) to promote settling and other pollutant removal mechanisms. This is required information necessary for the BMP test evaluation.
Permanent Pool Surface Area. The area of the water surface in the device at full water quality detention volume. This is required information necessary for the BMP test evaluation.
Permanent Pool Length. Length of the water quality device, measured as the distance between inflow and outflow. If there is more that one inflow point, use the average distance between the inflow points and the outflow weighted by the tributary impervious area. This is required information necessary for the BMP test evaluation.
Water Quality Surcharge Detention Volume When Full. Manufactured devices may be designed to handle a specified volume of runoff above a permanent pool, releasing this

International Stormwater BMP Database Data Entry Spreadsheets User’s Guide
Release Version 2.0 Page 67 December 2007
surcharge volume over a specified period of time through an outlet structure. This is required information necessary for the BMP test evaluation.
Brim-full Emptying Time (hrs) for Surcharge. Emptying time (in hours) of the water quality detention volume. This is required information necessary for the BMP test evaluation.
Half Brim-full Emptying Time (hrs) for Surcharge. Emptying time (in hours) of the lower half of the water quality detention volume. This is required information necessary for the BMP test evaluation
Inlet Chamber Volume. The volume of the inlet chamber to the device. This is required information necessary for the BMP test evaluation
Comments enables the user to narratively describe other aspects of the site that are relevant to understanding the study.

International Stormwater BMP Database Data Entry Spreadsheets User’s Guide
Release Version 2.0 Page 68 December 2007
28. Green Roof
Green roofs, also known as vegetated roof covers, eco-roofs or nature roofs, are multi-beneficial structural components that help to mitigate the effects of urbanization on water quality by filtering, absorbing or detaining rainfall. They are constructed of a lightweight soil media, underlain by a drainage layer, and a high quality impermeable membrane that protects the building structure. The soil is planted with a specialized mix of plants that can thrive in the harsh, dry, high temperature conditions of the roof and tolerate short periods of inundation from storm events5.
Reporting requirements for Green Roofs will be more fully developed when LID is integrated into the Database. The information requested below may be expanded in the future. See the LID website (http://www.lid-stormwater.net/greenroofs/greenroofs_home.htm) or the Green Roof (http://www.greenroofs.com/) website for more information. All fields associated with Green Roofs are required information.
(Diagram Source: American Wick Drain Corp.)
Describe Green Roof enables the user to describe the key features of the green roof design.
Describe Vegetation. Identify the types of vegetation planted on the roof.
Supplemental Irrigation Provided? Identify whether supplemental irrigation is provided on the green roof by answering yes (Y) or no (N).
Roof Media's Surface Area. Describe the area of the growing medium.
5 Definition from Exploring the Ecology of Organic Green Roof Architecture, Green Roofs Web Site, (www.greenroofs.com), Velazquez.

International Stormwater BMP Database Data Entry Spreadsheets User’s Guide
Release Version 2.0 Page 69 December 2007
Number of Media Layers. Identify the number of layers associated with the growing media.
Type and Depth (or Thickness) of Each Media Layer. Describe the type and depth or thickness of each media layer.
Detention Volume. The design water quality capture volume for the green roof.
Detention Volume's Design Drain Time, If Controlled and Known. The design time for complete drawdown (in hours) of the water quality capture volume if the drain time is controlled by a flow regulating device such as an orifice. Leave blank if the drain rate is only a fraction of the growing media’s flow-through rate. This is required information necessary for the BMP test evaluation if the emptying time is controlled by a flow regulating device. Absence of this information will not cause the test record to be flagged as incomplete but should be provided if applicable.
Underdrain Description. Describe the underdrain system provided for the green roof.
Comments. Provide any additional information needed to properly evaluate the green roof’s performance.

International Stormwater BMP Database Data Entry Spreadsheets User’s Guide
Release Version 2.0 Page 70 December 2007
29. Low Impact Development (LID)
Low Impact Development (LID) is an overall site design approach that is intended to mimic pre-development hydrology through the use of dispersed on-site controls called Integrated Management Practices (IMPs). These sites typically have multiple small IMPs dispersed at the lot level through a development, rather than having the traditional detention pond located at the low corner of the development. See http://www.lid-stormwater.net) for detailed information.
A spreadsheet for LID sites has been provided, primarily as a placeholder for more detailed integration of LID sites in the future. In the interim, if LID sites are submitted to the database, then a published or written report should be attached to the data submittal. All fields provided below are required.
List LID IMPs enables the user to list the individual IMPs present at the site. An example could include factors such as: preservation of naturally occurring infiltrating soils, 10 rain gardens on individual lots, two green roofs, no curb and gutter, narrow roadways, porous pavement in clubhouse parking lot, etc. In cases where IMP corresponds to another BMP category in the database such as porous pavement and green roofs, design information for these practices should also be provided.
Describe Site Design enables the user to narratively describe the key features of the site design.
Describe Monitoring Design enables the user to narratively describe the key features of the monitoring design. For example, the data provider may monitor a comparable development as a reference site. Monitoring may occur at multiple IMPs, or may occur at a few separate representative outflow locations. More detailed guidance on LID monitoring designs may be provided in the future.
Comments/Other Description enables the user to narratively describe other aspects of the LID site that are relevant to understanding the study.
International Stormwater BMP Database Data Entry Spreadsheets User’s Guide
Release Version 2.0 Page 71 December 2007
30. Non-structural BMPs
A non-structural BMP can generally be described as a preventative action to protect receiving water quality that does not require construction. Nonstructural BMPs rely predominantly on behavioral changes in order to be effective. Major categories of non-structural BMPs include education, recycling, maintenance practices and source controls, as described below.
Educational BMPs include efforts to inform city employees, the public, and businesses about the importance of using practices that protect stormwater from improper use, storage, and disposal of pollutants, toxics, household products, etc. The ultimate goal of educational BMPs is to cause behavioral changes.
Recycling BMPs include measures such as collecting and recycling automotive products, household toxics, leaves, landscaping wastes, etc.
Maintenance practices include measures such as catch basin cleaning, parking lot sweeping, road and street pavement repair, road salting and sanding, roadside ditch cleaning and restoration, street sweeping, etc.
Source controls include preventing rainfall from contacting pollutant-laden surfaces and preventing pollutant-laden runoff from leaving locations such as automobile maintenance, salvage and service stations; commercial, restaurant and retail sites; construction sites; farming and agricultural sites; industrial sites, etc.
The following non-structural BMP fields should be completed for each non-structural BMP present at the test site. Multiple non-structural BMPs may be present at a test site and be entered into the database. Enter all data for each non-structural BMP before entering the next non-structural BMP record.
BMP Name must be provided in terms of the common name or code used to identify this BMP at your test site. This is required information.
Select the Non-Structural BMP Present at the Site by reviewing the options provided in the pick list (e.g., recycling program). This is required information.
Enter a BMP Name for the subject non-structural BMP (e.g., Erosion and Sediment Control Pamphlets). This is required information.
Date Test Began is simply the date (month, day and 4-digit year) that the BMP test was begun (e.g., 01/01/1998). This is required information.
Describe the quantity or measure of the BMP being practiced in the space provided. This is required information. For example:
Educational BMP ―measurements‖ could include, as examples: the number of brochures distributed per resident and employee in watershed per year on the quantities of pesticide/herbicide application, automotive product disposal or recycling, household toxics use and disposal, yard waste management, etc. Other examples include the number of elementary school children living in the watershed reached through classes at local schools; number of public notices on TV, radio and/or major newspapers per year; number of

International Stormwater BMP Database Data Entry Spreadsheets User’s Guide
Release Version 2.0 Page 72 December 2007
billboards per acre of watershed used per year; percent of all stormwater inlets in the watershed stenciled.
Recycling BMP ―measurements‖ could include gallons of used oil collected per resident in the watershed; pounds of household toxics collected per resident in the watershed; tons of landscaping waste per resident collected, etc.
Maintenance BMP ―measurements‖ could include percent of stormwater catch basins cleaned once each year, twice each year, etc.; tons of materials removed per average inlet each year; lane miles of street swept each year and tons of material removed per lane mile each year; acres of parking lots swept each year and tons of material removed each year per acre of parking lot swept; type and pounds of deicing materials used per lane mile of road per year; percent of salt in deicing materials used during the year; number of de-icing applications during the year; percent of roadside ditch miles cleaned in watershed during the year; tons of solids removed during the year from roadside ditches; percent of roadside ditch miles stabilized for erosion control during year, etc.
Source Control ―measurements‖ could include percent of industrial storage area in watershed that is covered; percent of materials handling sites in watershed that are covered; percent of gasoline stations with pumps that have overhead cover and how far these covers extend beyond the pumps, etc. The total area, number or mass of sources should be provided as well as the percentages in order to facilitate comparison to other source control BMP tests.
Initial Costs include the time and measures necessary to design and implement a program. For example, if brochures were developed on proper disposal of household waste, the cost of development and initial printing would be the initial cost. Subsequent distribution and reprints of the brochures would be considered annual costs. Another example could include inventorying the types of maintenance practices that should be conducted, creating a routine schedule and assigning personnel to complete the work. Although not essential, this information is nice to have if available.
Annual Costs are the year-to-year costs once the initial program has been developed. Although not essential, this information is nice to have if available.

International Stormwater BMP Database Data Entry Spreadsheets User’s Guide
Release Version 2.0 Page 73 December 2007
31. Other
An ―Other‖ BMP type spreadsheet is provided to enable users to enter data for other BMP types not included in the database. A PDF report on the study must be attached to the data submittal in such cases. All fields are required information.
Describe Key Structural Features enables the user to narratively describe the key structural or design features that are relevant to understanding the study.
Describe Key Landscaping/Vegetation Features enables the user to narratively describe the key landscaping or vegetation features that are relevant to understanding the study.
Comments enables the user to narratively describe other aspects of the site that are relevant to understanding the study.

International Stormwater BMP Database Data Entry Spreadsheets User’s Guide
Release Version 2.0 Page 74 December 2007
Pick Lists
As described in the Data Elements section of this User’s Guide, certain fields are restrict to ―pick lists‖, which are provided as drop-down boxes in the spreadsheets.

International Stormwater BMP Database Data Entry Spreadsheets User’s Guide
Release Version 2.0 Page 75 December 2007
Units of Measure Codes
Units Type Units Name Abbrev. Units Type Units Name Abbrev.
Area acre ac Length centimeter cm
Area square feet ft² Length kilometer km
Area square mile mi² Length meter m
Area hectare ha Percent percent %
Area square kilometer km² Precip feet ft
Area square meter m² Precip inches in
Concentration colonies per 100 milliliters #/100mL Precip yards yd
Concentration micrograms per liter µg/L Precip centimeter cm
Concentration milligrams per liter mg/L Precip meter m
Concentration pH standard unit SU Precip millimeter mm
Conductivity micromhos per centimeter µmhos/cm Slope feet per feet ft/ft
Conductivity microsiemens per centimeter µS/cm Slope
meter per meter m/m
Flow cubic feet per second cfs Temperature Celsius °C
Flow gallons per minute gpm Time hours hrs
Flow cubic meter per second cms Time minute min
Flow liters per minute lpm Time second sec
Flow liters per second l/sec Velocity feet per hour ft/hr
Hyd Conductivity feet per second ft/sec Velocity
feet per second ft/sec
Hyd Conductivity
gallons per day per sq ft gal/day/ft² Velocity
inches per hour in/hr
Hyd Conductivity
centimeters per second cm/sec Velocity
miles per hour mi/hr
Hyd Conductivity meters per second m/sec Velocity
centimeter per hour cm/hr
Intensity inches per hour in/hr Velocity centimeters per second cm/sec
Intensity centimeter per hour cm/hr Velocity meters per second m/sec
Intensity liters per second per hectare l/sec/ha Volume acre-feet ac ft
Intensity millimeter per hour mm/hr Volume cubic feet ft³
Length feet ft Volume gallon gal
Length inches in Volume cubic meter m³
Length miles mi Volume liter l

International Stormwater BMP Database Data Entry Spreadsheets User’s Guide
Release Version 2.0 Page 76 December 2007
Test Site, Agency and Location Spreadsheet Codes
Code Type of Study
1 Structural
2 Non-Structural
3 Both
Code Unit System
1 English
2 SI
US Time Zones -5 Eastern Standard -6 Central Standard -7 Mountain Standard -8 Pacific Standard
Horizontal Reference Datum Codes
Code Name Description
1 NAD27 North American Datum 1927
2 NAD83 North American Datum 1983
3 OTHER Other
4 UNKWN Unknown
5 AMSMA American Samoa Datum
6 ASTRO Midway Astro 1961
7 GUAM Guam 1963
8 JHNSN Johnson Island 1961
9 OLDHI Old Hawaiian Datum
10 PR Puerto Rico Datum
11 SGEOR St. George Island Datum
12 SLAWR St. Lawrence Island Datum
13 SPAUL St. Paul Island Datum
14 WAKE Wake-Eniwetok 1960
15 WGS72 World Geodetic System 1972
16 WGS84 World Geodetic System 1984
Code Agency Responsibility
1 Sponsoring
2 Monitoring
3 Both

International Stormwater BMP Database Data Entry Spreadsheets User’s Guide
Release Version 2.0 Page 77 December 2007
Code Agency Type Notes
0 PRIVATE INDUSTRY A private (non-government) organization representing an industrial operation.
1 US GOVERNMENT/FEDERAL A United States Federal (National) Government organization.
2 PUBLIC UNIVERSITY/COLLEGE An organization representing a public college or university.
3 US GOVERNMENT/INTERSTATE COMSN
A United States Interstate Government organization or commission.
4 CANADIAN GOVERNMENT/FEDERAL
Canadian Federal Government (National) Organization
5 MEXICAN GOVERNMENT/FEDERAL
Mexican Federal Government (national) Organization
6 INTERNATIONAL/UNITED NATIONS
An International organization with direct tie to the United Nations
7 CANADIAN GOVERNMENT/PROVINCIAL Canadian Provincial Government Organization
8 US GOVERNMENT/STATE United States State Government Organization
9 VOLUNTEER An organization whose members are not compensated for their activities.
10 US GOVERNMENT/LOCAL A United States Local (City, county, etc.) government organization
11 TRIBAL An organization representing a Tribe or other Native American governing body.
12 MEXICAN GOVERNMENT/STATE Mexican State Government Organization.
13 PRIVATE UNIVERSITY/COLLEGE An organization representing a private college or university.
14 INTERNATIONAL/INTL COMMISSIONS
Organization with international jurisdiction and/or responsibilities.
15 US GOVERNMENT/TRUST TERRITORY
United States Trust Territory Government organization.
16 MULTI-UNIV/COLLEGE CONSORTIA
Organization consisting of a consortium or multiplicity of Colleges and/or Universities.
17 PRIVATE NON-INDUSTRIAL A private organization NOT representing an industrial operation.
18 OTHER None of the above
19 VENDOR Vendor or manufacturer of proprietary device.
Monitoring Event Spreadsheet Codes
Code Event Type Description
B Base Flow
R Runoff
O Other

International Stormwater BMP Database Data Entry Spreadsheets User’s Guide
Release Version 2.0 Page 78 December 2007
Watershed, Roads and Parking Lots, and Land Use Spreadsheet Codes
Code Type of Watershed
1 Test
2 Reference
Code Deicing Method
1 Sand
2 Sand/Salt
3 Magnesium Chloride
4 Other Chemical
5 None
Land Use Spreadsheet Codes
Code Type of Pavement on Roadways
C Concrete
A Asphalt
B Both
Code Land Use Description
0 Unknown
1 Light Industrial
2 Heavy Industrial
3 Multi-Family Residential
4 High Density Residential
5 Medium Density Residential
6 Low Density Residential
7 Office Commercial
8 Retail
9 Restaurants
10 Automotive Services
11 Rangeland
12 Orchard
13 Vegetable Farming
14 Open Space
15 Forest
16 Highway
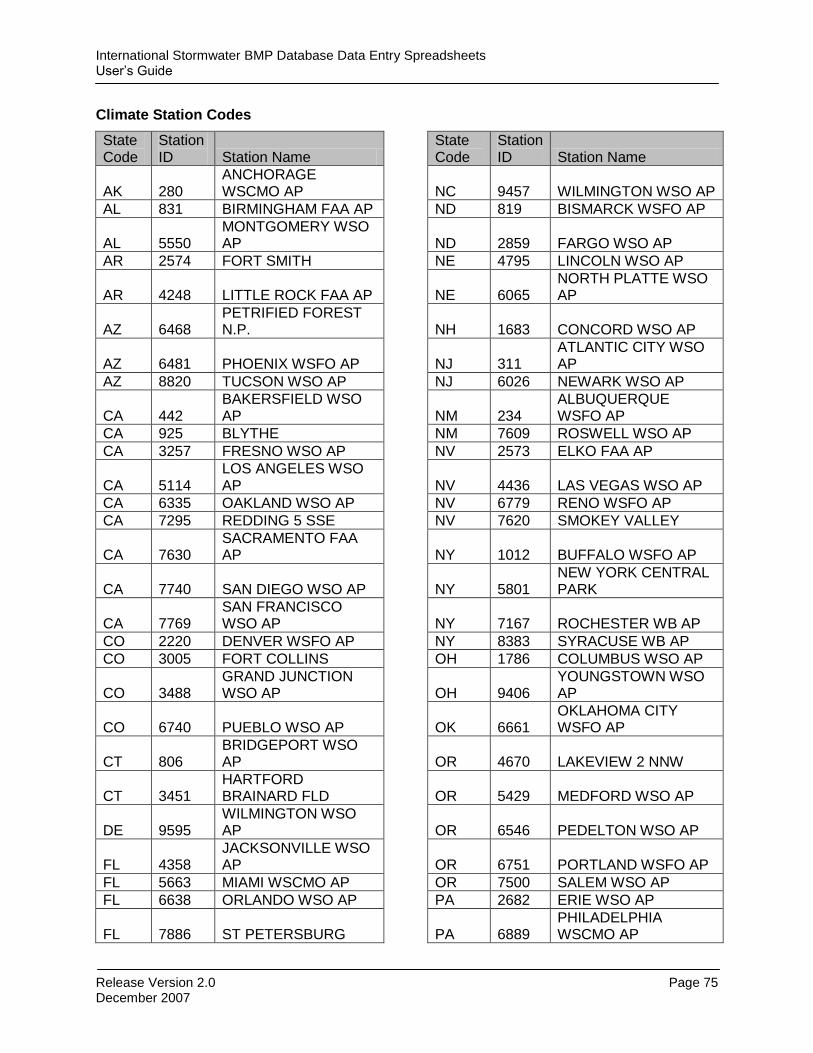
International Stormwater BMP Database Data Entry Spreadsheets User’s Guide
Release Version 2.0 Page 75 December 2007
Climate Station Codes
State Code
Station ID Station Name
State Code
Station ID Station Name
AK 280 ANCHORAGE WSCMO AP NC 9457 WILMINGTON WSO AP
AL 831 BIRMINGHAM FAA AP ND 819 BISMARCK WSFO AP
AL 5550 MONTGOMERY WSO AP ND 2859 FARGO WSO AP
AR 2574 FORT SMITH NE 4795 LINCOLN WSO AP
AR 4248 LITTLE ROCK FAA AP NE 6065 NORTH PLATTE WSO AP
AZ 6468 PETRIFIED FOREST N.P. NH 1683 CONCORD WSO AP
AZ 6481 PHOENIX WSFO AP NJ 311 ATLANTIC CITY WSO AP
AZ 8820 TUCSON WSO AP NJ 6026 NEWARK WSO AP
CA 442 BAKERSFIELD WSO AP NM 234
ALBUQUERQUE WSFO AP
CA 925 BLYTHE NM 7609 ROSWELL WSO AP
CA 3257 FRESNO WSO AP NV 2573 ELKO FAA AP
CA 5114 LOS ANGELES WSO AP NV 4436 LAS VEGAS WSO AP
CA 6335 OAKLAND WSO AP NV 6779 RENO WSFO AP
CA 7295 REDDING 5 SSE NV 7620 SMOKEY VALLEY
CA 7630 SACRAMENTO FAA AP NY 1012 BUFFALO WSFO AP
CA 7740 SAN DIEGO WSO AP NY 5801 NEW YORK CENTRAL PARK
CA 7769 SAN FRANCISCO WSO AP NY 7167 ROCHESTER WB AP
CO 2220 DENVER WSFO AP NY 8383 SYRACUSE WB AP
CO 3005 FORT COLLINS OH 1786 COLUMBUS WSO AP
CO 3488 GRAND JUNCTION WSO AP OH 9406
YOUNGSTOWN WSO AP
CO 6740 PUEBLO WSO AP OK 6661 OKLAHOMA CITY WSFO AP
CT 806 BRIDGEPORT WSO AP OR 4670 LAKEVIEW 2 NNW
CT 3451 HARTFORD BRAINARD FLD OR 5429 MEDFORD WSO AP
DE 9595 WILMINGTON WSO AP OR 6546 PEDELTON WSO AP
FL 4358 JACKSONVILLE WSO AP OR 6751 PORTLAND WSFO AP
FL 5663 MIAMI WSCMO AP OR 7500 SALEM WSO AP
FL 6638 ORLANDO WSO AP PA 2682 ERIE WSO AP
FL 7886 ST PETERSBURG PA 6889 PHILADELPHIA WSCMO AP

International Stormwater BMP Database Data Entry Spreadsheets User’s Guide
Release Version 2.0 Page 76 December 2007
State Code
Station ID Station Name
State Code
Station ID Station Name
FL 8758 TALLAHASSEE WSO AP PA 6993
PITTSBURGH WSCMO2 AP
GA 451 ATLANTA WSO AP SC 1549 CHARLESTON WSO CI
GA 2166 COLUMBUS WSO AP SC 1939 COLUMBIA WSFO AP
HI 1919 HONOLULU WSFO 703 AP SD 5691 MOBRIDGE
IA 2203 DES MOINES WSFO AP SD 6937 RAPID CITY WSO AP
IA 2367 DUBUQUE WSO AP SD 7667 SIOUX FALLS WSFO AP
IA 7700 SIOUX CENTER 2 SE TN 1094 BRISTOL WSO AP
ID 1022 BOISE WSFO AP TN 1656 CHATTANOOGA WSO AP
ID 7211 POCATELLO WSFO AP TN 4950 KNOXVILLE WSO AP
IL 1577 CHICAGO MIDWAY AP 3 SW TN 5954 MEMPHIS FAA-AP
IL 8179 SPRINGFIELD WSO AP TN 6402 NASHVILLE WSO AP
IN 3037 FORT WAYNE WSO AP TX 16 ABILENE WSO AP
IN 4259 INDIANAPOLIS WSFO TX 211 AMARILLO WSO AP
KS 1699 COLBY 1 SW TX 428 AUSTIN WSO AP
KS 2543 EMPORIA TX 1136 BROWNSVILLE WSO AP
KY 4746 LEXINGTON WSO AP TX 2015 CORPUS CHRISTI WSO AP
KY 4954 LOUISVILLE WSFO TX 2244 DALLAS FAA AP
LA 98 ALEXANDRIA TX 2797 EL PASO WSO AP
LA 6660 NEW ORLEANS WSCMO AP TX 3284
FTWORTH MEACH WSO AP
LA 8440 SHREVEPORT WSO AP TX 4311 HOUSTON-ALIEF
MA 770 BOSTON WSO AP TX 4329 HOUSTON-SATSUMA
MA 9923 WORCESTER WSO AP TX 5411 LUBBOCK WSFO AP
MD 465 BALTIMORE WSO AP TX 5890 MIDLAND/ODESSA WSO AP
ME 6905 PORTLAND WSMO AP TX 7945 SAN ANTONIO WSFO
MI 2103 DETROIT METRO WSO AP UT 3418 GREEN RIVER
MI 4641 LANSING WSO AP UT 7516 ST GEORGE
MN 2248 DULUTH UT 7598 SALT LAKE CITY NWSFO AP
MN 5435 MINN-ST PAUL WSO AP VA 5120 LYNCHBURG WSO AP
MO 4379 KANSAS CITY U of VA 6139 NORTHFOLK WSO AP
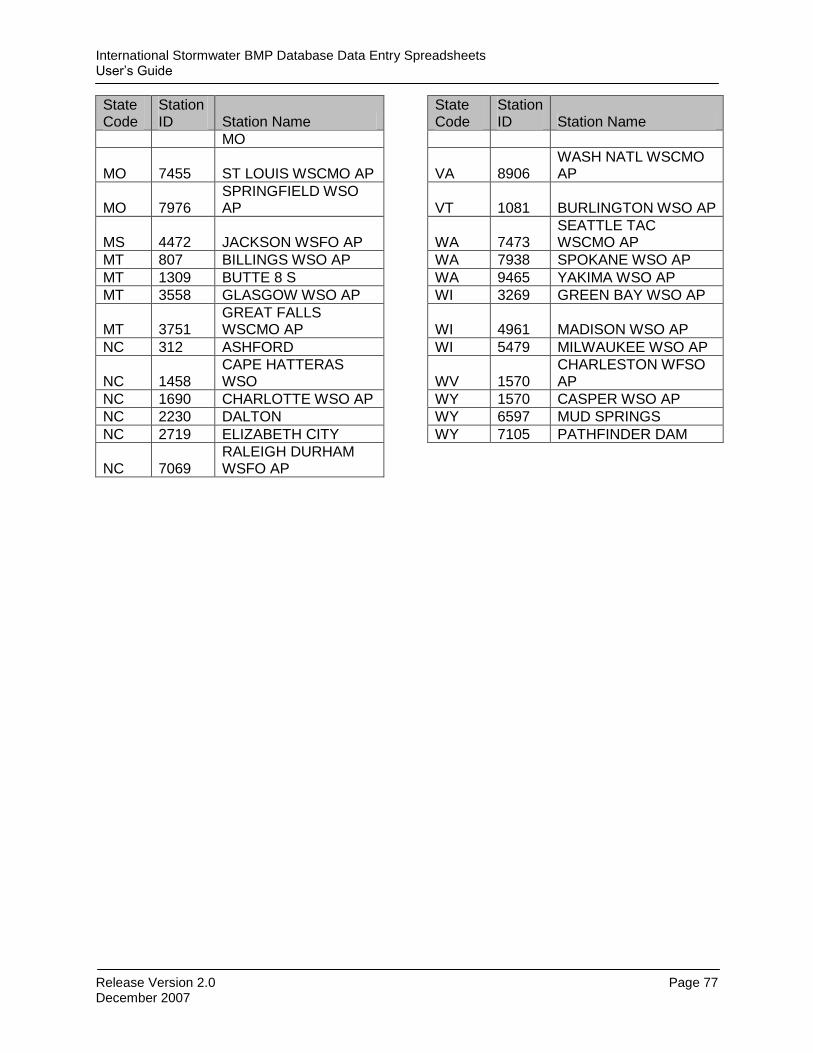
International Stormwater BMP Database Data Entry Spreadsheets User’s Guide
Release Version 2.0 Page 77 December 2007
State Code
Station ID Station Name
State Code
Station ID Station Name
MO
MO 7455 ST LOUIS WSCMO AP VA 8906 WASH NATL WSCMO AP
MO 7976 SPRINGFIELD WSO AP VT 1081 BURLINGTON WSO AP
MS 4472 JACKSON WSFO AP WA 7473 SEATTLE TAC WSCMO AP
MT 807 BILLINGS WSO AP WA 7938 SPOKANE WSO AP
MT 1309 BUTTE 8 S WA 9465 YAKIMA WSO AP
MT 3558 GLASGOW WSO AP WI 3269 GREEN BAY WSO AP
MT 3751 GREAT FALLS WSCMO AP WI 4961 MADISON WSO AP
NC 312 ASHFORD WI 5479 MILWAUKEE WSO AP
NC 1458 CAPE HATTERAS WSO WV 1570
CHARLESTON WFSO AP
NC 1690 CHARLOTTE WSO AP WY 1570 CASPER WSO AP
NC 2230 DALTON WY 6597 MUD SPRINGS
NC 2719 ELIZABETH CITY WY 7105 PATHFINDER DAM
NC 7069 RALEIGH DURHAM WSFO AP

International Stormwater BMP Database Data Entry Spreadsheets User’s Guide
Version 2.0 Page 78 December 2007
BMP Info Spreadsheet: BMP Type Codes
BMP Code
Description Category BMP Category Type
BI Biofilter - Grass Strip GS Biofilter S
BS Biofilter - Grass Swale GS Biofilter S
BW Biofilter - Wetland Vegetation Swale WC Wetland Channel
S
CO Composite—Overall Site BMPs CO Composite Site B
CX Control—No BMP/Control Site NA Not Applicable B
DB Detention Basin (Dry) - Surface Grass-Lined Basin That Empties Out After A Storm
DB Detention Basin S
DC Detention Basin (Dry) - Concrete or Lined Tank/Basin With Open Surface
DB Detention Basin S
DT Detention - Deep Tunnel DB Detention Basin S
DU Detention - Underground Vault, Tank or Pipe(s)
DB Detention Basin S
FB Filter - Carbon Granules MF Media Filter S
FC Filter - Compost Mixed With Sand MF Media Filter S
FH Filter - Geotextile Fabric Membrane (Horizontal)
MF Media Filter S
FL Filter - Combination of Media or Layered Media
MF Media Filter S
FO Filter - Other Media MF Media Filter S
FP Filter - Peat Mixed With Sand MF Media Filter S
FS Filter - Sand MF Media Filter S
FV Filter - Geotextile Fabric Membrane (Vertical) MF Media Filter S
GR Green Roof GR Green Roof S
MD Manufactured Devices (e.g. Swirl Concentrator, Separation Systems, etc..)
MD Manufactured Device
S
IB Infiltration Basin IB Infiltration Basin S
IT Infiltration (Percolation) Trench PT Percolation Trench/Well
S
IW Infiltration (Dry) Well PT Percolation Trench/Well
S
LD Low Impact Development LD LID S
OS Oil & Water Separator HD Manufactured Device
S
OT Other OT Other S
PA Porous Pavement – Porous Asphalt PP Porous Pavement
S
PG Porous Pavement - Porous Aggregate PP Porous Pavement
S
PT Porous Pavement - Porous Turf PP Porous Pavement
S
PC Porous Pavement - Pervious Concrete PP Porous S
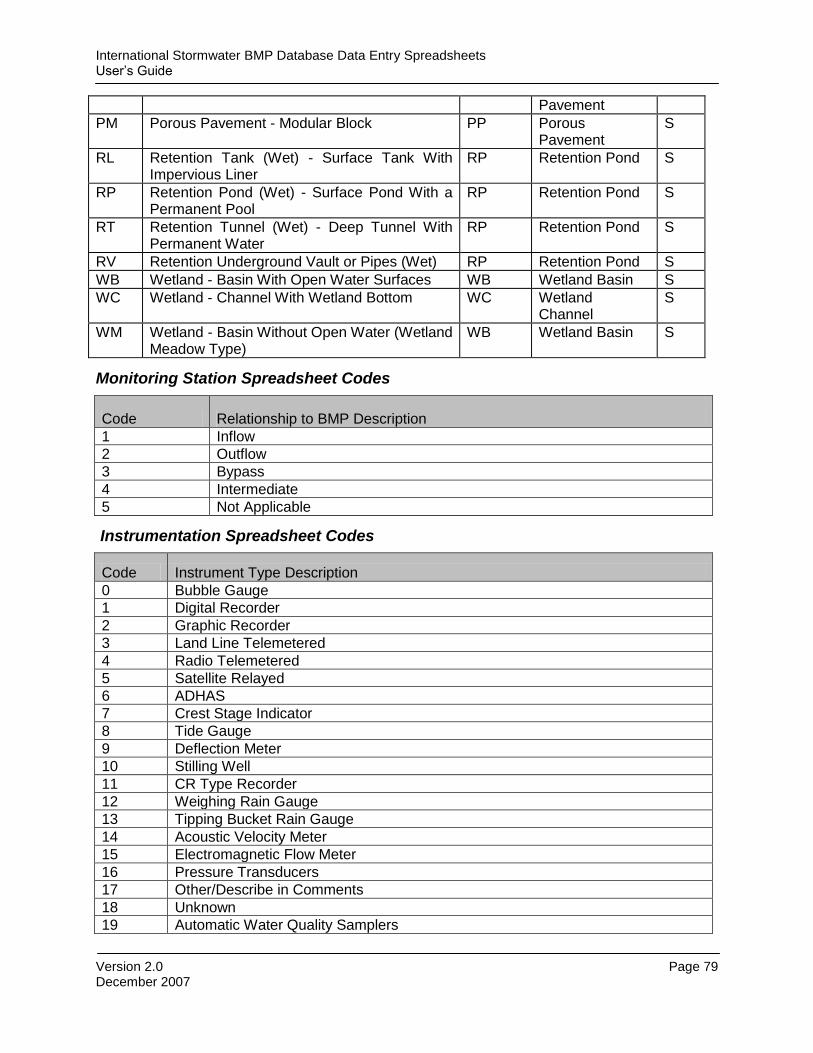
International Stormwater BMP Database Data Entry Spreadsheets User’s Guide
Version 2.0 Page 79 December 2007
Pavement
PM Porous Pavement - Modular Block PP Porous Pavement
S
RL Retention Tank (Wet) - Surface Tank With Impervious Liner
RP Retention Pond S
RP Retention Pond (Wet) - Surface Pond With a Permanent Pool
RP Retention Pond S
RT Retention Tunnel (Wet) - Deep Tunnel With Permanent Water
RP Retention Pond S
RV Retention Underground Vault or Pipes (Wet) RP Retention Pond S
WB Wetland - Basin With Open Water Surfaces WB Wetland Basin S
WC Wetland - Channel With Wetland Bottom WC Wetland Channel
S
WM Wetland - Basin Without Open Water (Wetland Meadow Type)
WB Wetland Basin S
Monitoring Station Spreadsheet Codes
Code Relationship to BMP Description
1 Inflow
2 Outflow
3 Bypass
4 Intermediate
5 Not Applicable
Instrumentation Spreadsheet Codes
Code Instrument Type Description
0 Bubble Gauge
1 Digital Recorder
2 Graphic Recorder
3 Land Line Telemetered
4 Radio Telemetered
5 Satellite Relayed
6 ADHAS
7 Crest Stage Indicator
8 Tide Gauge
9 Deflection Meter
10 Stilling Well
11 CR Type Recorder
12 Weighing Rain Gauge
13 Tipping Bucket Rain Gauge
14 Acoustic Velocity Meter
15 Electromagnetic Flow Meter
16 Pressure Transducers
17 Other/Describe in Comments
18 Unknown
19 Automatic Water Quality Samplers

International Stormwater BMP Database Data Entry Spreadsheets User’s Guide
Version 2.0 Page 80 December 2007
Code Data Type Description
0 Tide Stage Continuous
1 Water Flow/Stage Continuous
2 Water Flow/Stage Intermittent
3 Water Quality Continuous (Automatic)
4 Water Quality Grab
5 Precipitation Continuous
6 Precipitation Intermittent
7 Evaporation (Pan) Continuous
8 Evaporation (Pan) Intermittent
9 Wind Velocity Continuous
10 Wind Velocity Intermittent
11 Air Temperature Continuous
12 Air Temperature Intermittent
13 Tide Stage Intermittent
14 Water Quality Probe Continuous
15 Water Quality Probe Intermittent
16 Other/Describe in Comments
17 Unknown
Water Quality Spreadsheet Codes
Code Sample Medium Description
0 Groundwater
1 Surface Runoff/Flow
2 Soil
3 Dry Atmospheric Fallout
4 Wet Atmospheric Fallout
5 Pond/Lake Water
6 Accumulated Bottom Sediment
7 Biological
8 Other/Describe in Comments
Code Sample Type Description
1 Flow Weighted Composite EMCs
2 Time Weighted Composite EMCs
3 Unweighted (Mixed) Composite EMCs
4 Grab Sample (Single, No Compositing)

International Stormwater BMP Database Data Entry Spreadsheets User’s Guide
Version 2.0 Page 81 December 2007
Sample Fraction
Description
Total The total of all fractions of the analyte.
Dissolved That portion of the analyte found in the liquid medium. Cannot be removed by filtration.
Suspended That portion of the analyte which is suspended in the sampled medium, either as, or adsorbed to, particles which are more or less uniformly dispersed within the medium.
Settleable That portion of the analyte which is found in or absorbed to that part of the sample which has settled (fallen out of suspension) to the bottom of the sample container.
Non-settleable
That portion of the analyte which is in or absorbed to particles remaining in suspension in the sample container after a settling process.
Filterable That portion of the analyte which is extracted from the liquid medium by filtration.
Non-filterable That portion of the analyte which is in or absorbed to material which passes through the filter during sample filtration.
Volatile That portion of the analyte which evaporates readily at normal temperature and pressure.
Non-volatile That portion of the analyte which is in a liquid or solid state under normal temperature and pressure.
Acid Soluble That portion of the analyte which becomes dissolved within the sample following treatment with an appropriate acid.
Vapor That portion of the analyte which exists in a gaseous state and that under ordinary conditions is liquid or solid.
Supernate That portion of the analyte found in the liquid layer above a precipitate produced from the sample.
Fixed That portion of the analyte found in the liquid layer above a precipitate produced from the sample.
Total Recoverable
Total Recoverable
Comb Available
Combined Available
Total Residual
Total Residual
Free Available
Free Available
Pot. Dissolved
Potentially Dissolved

International Stormwater BMP Database Data Entry Spreadsheets User’s Guide
Version 2.0 Page 82 December 2007
Code WQX/Modern STORET Qualifier Description
J Estimated: The analyte was positively identified and the associated numerical value is the approximate concentration of the analyte in the sample.
R Rejected: The sample results are unusable due to the quality of the data generated because certain criteria were not met. The analyte may or may not be present in the sample.
U Not Detected: The analyte was analyzed for, but was not detected at a level greater than or equal to the level of the adjusted Contract Required Quantitation Limit (CRQL) for sample and method.
UJ Not Detected/Estimated: The analyte was not detected at a level greater than or equal to the adjusted CRQL or the reported adjusted CRQL is approximate and may be inaccurate or imprecise.
Code Detection Limit Description
1 Instrument Detection Level (IDL)
2 Method Detection Level (MDL)
3 Estimated Detection Level
4 Upper Quantitation Limit
5 Lower Quantitation Limit
6 Long Term Method Detection Level
7 Drinking Water Maximum
8 Water Quality Standard or Criteria
9 Upper Reporting Limit
10 Lower Reporting Limit

International Stormwater BMP Database Data Entry Spreadsheets User’s Guide
Version 2.0 Page 83 December 2007
Water Quality Spreadsheet Commonly Reported Characteristic (Water Quality Constituent) Codes
A commonly reported list of Modern STORET characteristics is provided in Worksheet 16b and is also repeated below. For a complete list of STORET characteristics, see the STORET Characteristics Excel file, which is provided separately.
Common WQX Water Quality Characteristic
(Pick List)
Sample Fraction
Required?
WQX Characteristics (for Reporting Water Level Data)
Sample Fraction
Required?
Alkalinity, Bicarbonate as CaCO3 N Water level in well, depth from a reference point N
Alkalinity, Carbonate as CaCO3 N Water level in well, measured from ground surface N
Alkalinity, Hydroxide as CaCO3 N Water level in well, measured from MSL N
Alkalinity, Total (total hydroxide+carbonate+bicarbonate) N
Aluminum Y
Ammonia N
WQX Characteristics (for Reporting Particle Size Distribution)
Sample Fraction
Required?
Arsenic Y
Particle size, Sieve No. 04, 4 mesh, (4.75mm) N
BOD, Biochemical oxygen demand N
Particle size, Sieve No. 05, 5 mesh, (4.00mm) N
Cadmium Y
Particle size, Sieve No. 06, 6 mesh, (3.35mm) N
Calcium Y
Particle size, Sieve No. 07, 7 mesh, (2.80mm) N
Carbon Fraction, Particulate Organic Material N
Particle size, Sieve No. 08, 8 mesh, (2.36mm) N
Chemical oxygen demand (COD) N
Particle size, Sieve No. 10, 9 mesh, (2.00mm) N
Chloride Y Particle size, Sieve No. 100, 100
mesh, (0.150mm) N
Chromium Y
Particle size, Sieve No. 12, 10 mesh, (1.70mm) N
Chromium(III) Y Particle size, Sieve No. 120, 115
mesh, (0.125mm) N
Chromium(VI) Y
Particle size, Sieve No. 14, 12 mesh, (1.40mm) N
Copper Y
Particle size, Sieve No. 140, 150 mesh, (0.106mm) N
Cyanide N
Particle size, Sieve No. 16, 14 mesh, (1.18mm) N
Dissolved oxygen (DO) N Particle size, Sieve No. 170, 170
mesh, (0.090mm) N
Escherichia coli N
Particle size, Sieve No. 18, 16 mesh, (1.00mm) N
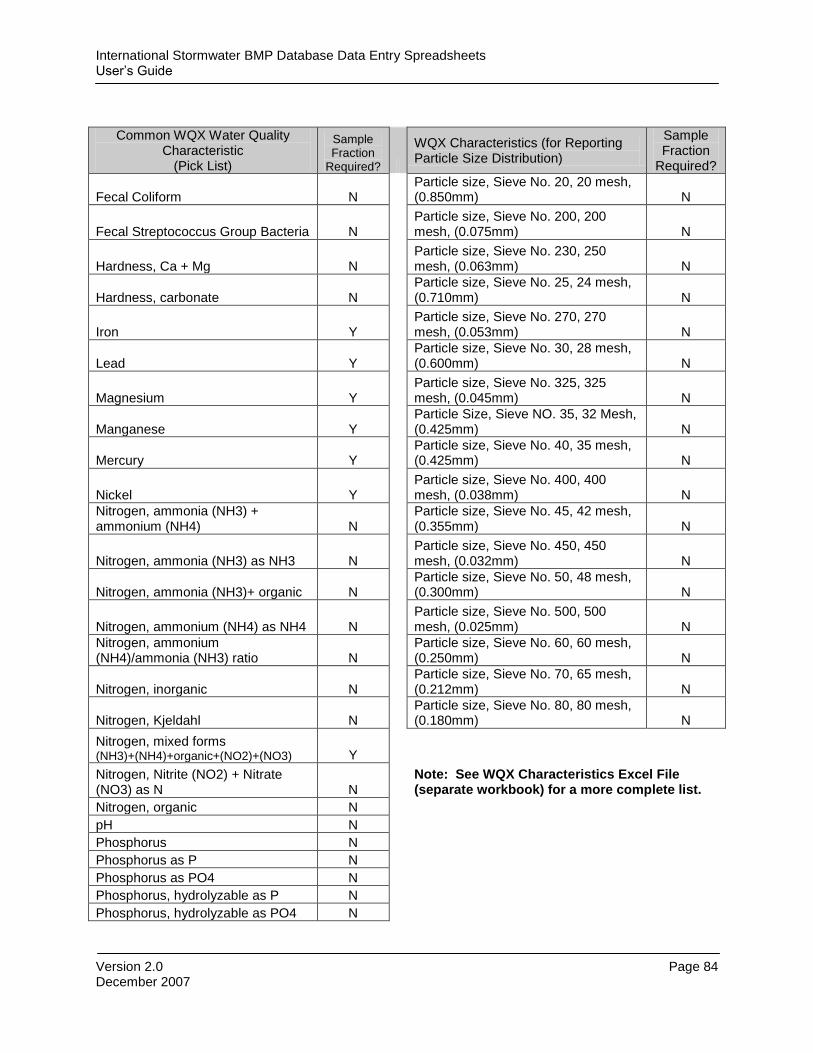
International Stormwater BMP Database Data Entry Spreadsheets User’s Guide
Version 2.0 Page 84 December 2007
Common WQX Water Quality Characteristic
(Pick List)
Sample Fraction
Required?
WQX Characteristics (for Reporting Particle Size Distribution)
Sample Fraction
Required?
Fecal Coliform N
Particle size, Sieve No. 20, 20 mesh, (0.850mm) N
Fecal Streptococcus Group Bacteria N Particle size, Sieve No. 200, 200
mesh, (0.075mm) N
Hardness, Ca + Mg N Particle size, Sieve No. 230, 250
mesh, (0.063mm) N
Hardness, carbonate N
Particle size, Sieve No. 25, 24 mesh, (0.710mm) N
Iron Y
Particle size, Sieve No. 270, 270 mesh, (0.053mm) N
Lead Y
Particle size, Sieve No. 30, 28 mesh, (0.600mm) N
Magnesium Y Particle size, Sieve No. 325, 325
mesh, (0.045mm) N
Manganese Y
Particle Size, Sieve NO. 35, 32 Mesh, (0.425mm) N
Mercury Y
Particle size, Sieve No. 40, 35 mesh, (0.425mm) N
Nickel Y Particle size, Sieve No. 400, 400
mesh, (0.038mm) N
Nitrogen, ammonia (NH3) + ammonium (NH4) N
Particle size, Sieve No. 45, 42 mesh, (0.355mm) N
Nitrogen, ammonia (NH3) as NH3 N Particle size, Sieve No. 450, 450
mesh, (0.032mm) N
Nitrogen, ammonia (NH3)+ organic N
Particle size, Sieve No. 50, 48 mesh, (0.300mm) N
Nitrogen, ammonium (NH4) as NH4 N Particle size, Sieve No. 500, 500
mesh, (0.025mm) N
Nitrogen, ammonium (NH4)/ammonia (NH3) ratio N
Particle size, Sieve No. 60, 60 mesh, (0.250mm) N
Nitrogen, inorganic N
Particle size, Sieve No. 70, 65 mesh, (0.212mm) N
Nitrogen, Kjeldahl N
Particle size, Sieve No. 80, 80 mesh, (0.180mm) N
Nitrogen, mixed forms (NH3)+(NH4)+organic+(NO2)+(NO3) Y
Nitrogen, Nitrite (NO2) + Nitrate (NO3) as N N
Note: See WQX Characteristics Excel File (separate workbook) for a more complete list.
Nitrogen, organic N
pH N
Phosphorus N
Phosphorus as P N
Phosphorus as PO4 N
Phosphorus, hydrolyzable as P N
Phosphorus, hydrolyzable as PO4 N

International Stormwater BMP Database Data Entry Spreadsheets User’s Guide
Version 2.0 Page 85 December 2007
Common WQX Water Quality Characteristic
(Pick List)
Sample Fraction
Required?
Phosphorus, hydrolyzable plus orthophosphate as P N
Phosphorus, organic as P N
Phosphorus, orthophosphate as P N
Phosphorus, orthophosphate as PO4 N
Phosphorus, polyphosphate as PO4 N
Selenium Y
Settleable Solids N
Silver Y
Sodium Y
Soluble Reactive Phosphorus (SRP) N
Specific conductance N
Sulfate Y
Temperature, water N
Total Coliform N
Total Inorganic Carbon N
Total Organic Carbon (TOC) N
Total Solids N
Total Suspended Solids (TSS) N
Zinc N

International Stormwater BMP Database Data Entry Spreadsheets User’s Guide
Version 2.0 Page 86 December 2007
Non-structural BMP Spreadsheet Type Codes
BMP Code
Description Category BMP Category Type
EA Education - Automotive Product Disposal ED Education N
EC Education - Construction Site BMP Design, Installation, Maintenance Training
ED Education N
EE Education - Schools (Elementary) ED Education N
EG Education - General Community Outreach ED Education N
EH Education - Schools (High School) ED Education N
EI Education - Industrial Good Housekeeping ED Education N
EJ Education - Schools (Jr. High School) ED Education N
EO Education - Commercial, Restaurant, and Retail Districts Good Housekeeping
ED Education N
EP Education - Pesticide/Herbicide Use ED Education N
ES Education - Inlet Stenciling ED Education N
MC Maintenance Practices - Catch Basin Cleaning MP Maintenance Practice
N
MD Maintenance Practices - Roadside Ditch Cleaning and Restoring
MP Maintenance Practice
N
MP Maintenance Practices - Parking Lot Sweeping
MP Maintenance Practice
N
MR Maintenance Practices - Road and Street Pavement Repair, Sealing, Overlay, etc.
MP Maintenance Practice
N
MS Maintenance Practices - Road Salting and Sanding
MP Maintenance Practice
N
MT Maintenance Practices - Street Sweeping MP Maintenance Practice
N
RA Recycling - Automotive Products RC Recycling N
RH Recycling - Household Toxics Collection & Recycling Programs
RC Recycling N
SA Source Controls - Automobile Service Stations SC Source Controls N
SC Source Controls - Construction Activities SC Source Controls N
SF Source Controls - Farming and Agricultural Sites
SC Source Controls N
SI Source Controls - Industrial Sites SC Source Controls N
SM Source Controls - Automobile Maintenance Sites
SC Source Controls N
SO Source Controls - Commercial, Restaurant and Retail Sites
SC Source Controls N
SS Source Controls - Automobile Salvage Facilities
SC Source Controls N
C:\Documents and Settings\jclary\Desktop\2007 BMP Database User's Guide 2 0.doc