Embed Size (px)
Citation preview
1
COMMISSION OF THE EUROPEAN COMMUNITIES
REGIONS 2020
GLOBALISATION CHALLENGES FOR EUROPEAN REGIONS♦
Brussels, January 2009
DIRECTORATE GENERAL FOR REGIONAL POLICY BACKGROUND DOCUMENT TO
COMMISSION STAFF WORKING DOCUMENT SEC(2008)2868 FINAL REGIONS 2020 AN ASSESSMENT OF FUTURE CHALLENGES FOR EU REGIONS
♦ The Paper was prepared by Marina Mastrostefano, Lewis Dijkstra and Hugo Poelman. The views expressed in this document are the collective views of the authors and do not necessarily reflect the opinions of the European Commission.

2
TABLE OF CONTENTS
EXECUTIVE SUMMARY ..........................................................................................................................3
1. INTRODUCTION...............................................................................................................................6
2. GROWING INTEGRATION AND INTERDEPENCY OF WORLD ECONOMIES.................7
3. CHALLENGES AND OPPORTUNITIES FACING THE EU REGIONS .................................10
4. KEYS TO SUCCESS: PRODUCTIVITY, JOBS AND EDUCATION........................................12
5. THE "GLOBALISATION VULNERABILITY INDEX" ............................................................18
MAIN REFERENCES ...............................................................................................................................24

3
EXECUTIVE SUMMARY
Globalisation is a complex phenomenon. It is the synthetic expression of a large variety of economic, social and technological factors. Its measurement and the notion of its impact are not universal, but vary accordingly to the specific interests of the analysis. In the context of this paper globalisation is mainly understood as a process where local economies and social systems experience a rapid increase in their sphere of action and their reciprocal interdependence.
According to this definition, globalization assumes the character of a structural development of the economic system. Cyclical events or adjustments with profound consequences, such as the recent financial and economic crisis, will themselves reflect the structural characteristics of individual regions and therefore are not expected to fundamentally change the pattern of the analysis.
One of the most direct expressions of globalisation is the increase in the share of trade value in GDP. In the last twenty it has grown in the EU15 more than 15%. In the 10 new member states, it was greater than 100% mainly due to the increase of intra EU export. Comparable figures for other main global economies show that it is over 50% in emerging countries - China and India – whereas in other developed economies like the US the share of trade in GDP remains below 30%. Also the shares of FDI in capital formation recorded remarkable increases, both in developed and developing countries.
As for future developments, the question is how the main economies of the world are going to develop their capacity to confront increasing globalisation. One of the crucial prerequisites to take advantage of the globalisation process is good productivity growth, which in turn is linked to suitable demographic trends and to a production structure mostly oriented to the most dynamic sectors. In this regard, international projections indicate some weakness of developed economies compared to developing countries both due to slow productivity growth – US and the EU 15 – and to the issue of ageing population which will affect Japan and the EU, but also - among the developing countries - China.
To assess the diverse levels of vulnerability of the European regions vis-à-vis globalisation, the paper starts by identifying the tangible elements which best describe the changes induced by globalisation and their likely impacts. The analysis suggests two main elements for reflection. The first is that aggregate effects of globalisation appear rather positive for all the EU fundamentals. The second is that this overall impact may hide profound differences among regions and sectors. In particular, the asymmetry of shocks may be worsened by cyclical events as the recent financial and economic crisis making the case for even greater need for structural adjustments.
In particular, we observe that a good part of our territory is confronted with the need to restructure and modernise. Despite impressive growth rates, the economic structure of the new Member States is still concentrated in sectors where competition from emerging economies is high. Many regions in the old Member States also have a high share of employment in traditional sectors, where competitive advantage is based on low cost factors. This means that Europe must increase productivity, invest more in R&D and new technologies, and draw on its ability to compete in products and services with high knowledge content.

4
To translate this argument about the challenges and opportunities of globalisation into an analysis directly applicable to the EU regions, five key indicators available at a regional level have been selected and projected to the year 2020: productivity growth, employment and unemployment rate, high and low educational attainment.
To allow a synthetic reading these indicators have then been combined into a globalisation vulnerability index. Results of the analysis are multifaceted. A first indication is that there are no radical changes in the position of the EU regions vis-à-vis each other between 2005 and 2020. However, some important differences exist. Regions scoring lower than the EU average vis-à-vis globalisation in 2005 and 2020 are both Convergence and Objective 2 regions. In the paper these are defined "lagging" regions. They represent 43% of EU population and – for the large majority - they are projected to improve their relative position between 2005 and 2020. Regions scoring higher than the EU average both in 2005 and 2020 are mostly non-convergence regions, belonging to the old Northern member states. In the paper these are defined "leading" regions although a large share of these regions is projected to slow down in relative terms between the 2005 and the 2020. Regions lagging in 2005 but expected to be leading in 2020 are located both in the old and the new Member States and represent about 11% of the EU population. Finally, regions leading in 2005 but expected to be lagging in 2020 represents about 8% of EU population and are mostly non-convergence regions.
The number of regions - and the share of population - at the two extremes of the globalisation index (best/worst index value) are projected to shrink between 2005 and 2020 in favour of an increase in the number of regions – and share of population – included in the intermediate positions.
To conclude, the main elements emerging from the analysis of the globalisation vulnerability index can be described as following:
• Many regions located in the North-West periphery of the European Union appear to be in a rather favourable position. These regions are largely in Finland, Sweden, Denmark, the UK and Ireland. They are expected to benefit from a workforce with a high level of educational attainment, a high level of employment, a high share of employment in advanced sectors and a high level of labour productivity.
• Many regions located in the Southern and Eastern parts of the Union, stretching from Latvia, Eastern Slovakia, Hungary, Bulgaria and Romania to Greece, Italy, Spain and Portugal, still appear in 2020 to be much more exposed to the challenge of globalisation despite some regions which substantially improve their the globalisation index between 2005 and 2020. This persistent vulnerability is predominantly due to the relatively large share of low value added activities in these regions and the low level of qualification of their labour force, which may lead to difficulties in attracting investment and creating or maintaining jobs.
• No clear pattern emerges in Western and Central Europe, where there are often strong sub-national variations. Some areas are expected to be in a less favourable position (e.g. some regions in the North of Germany) than others which are expected to achieve higher levels of productivity, employment and educational attainment (e.g. parts of Austria, Germany, France).

5
• At the sub-national level, the analysis reveals that, in many Member States, regions with major urban centres and metropolitan areas should be relatively well placed to respond to the challenges linked to globalisation. These areas tend to benefit from a large share of highly educated residents, highly dynamic sectors and leading-edge economic activities. Yet, the concentration of economic activities in agglomerations may also create negative externalities (such as congestion, urban sprawl, drain on natural resources and ecosystem services) and may also lead to underutilised economic potential elsewhere.
6
1. INTRODUCTION
The definition of the globalisation process is particularly difficult. Globalisation is not an unequivocally defined statistical variable which is directly measurable (like GDP and Trade) or indirectly computable (like Ageing and Migration), but rather the multifaceted synthesis of a vast number factors of different nature - economic, social, technological etc. – which are often difficult to find into current statistics. Beside, globalisation is a bundle of different dynamics, which means that it became quickly impossible to operate a clear cut distinction between its causes and effects1.
One of the consequences of these complexities is that the measurement of globalisation and the notion of its impact are not universal, but vary accordingly to the specific interests of the analysis. In the context of our exercise, we look at globalisation as a process of international (market) integration, where local economies and social systems experience a rapid increase of their sphere of action and their reciprocal interdependence.
According to this definition, globalization assumes the characters of a structural development of the economic system. Cyclical events, though with profound consequences as the recent financial and economic crisis, do not modify the pattern of the analysis since it is believed that their influence is temporary and will not change the direction of long term trends.
A first way of sketching globalisation according to this definition is by measuring the evolution of the share of trade in GDP. In addition, the role of investments is of ever-increasing importance, since companies have supplemented trade with investments and moved from geographically concentrated goods and services production networks to geographically disperse ones. The brief analysis presented in the next section attempts to offer an idea of "the openness boom" spreading around the world and the EU with its Member states.
Section 3 attempts to identify the main advantages and disadvantages of globalisation for EU stakeholders. Globalization gives the EU greater access to other countries' markets and resources, while granting other countries greater access to the EU, one of the largest and wealthiest markets in the world. Overall, this process has been mutually beneficial. However, the benefits have not always been evenly distributed across the EU territory and economic sectors.
Considering that productivity, employment and education are the main elements which transform the challenge posed by globalisation into an opportunity, section 4 briefly presents the projected regional pattern of these variables for the 2020.
Finally, section 5 presents the main findings of the regional analysis carried out with the "globalisation vulnerability index". The index synthesises the overall position of the EU regions in respect of the variables analysed in section 4 and compares their different position vis-à-vis the challenges posed by the globalisation process.
1 This idea reflects the notion of eigenvectors used by P. Krugman in the New Economic Geography. A
traditional example is Internet which is certainly a cause of globalisation, but at the same time a consequence of globalisation.
7
Share of total trade (Imp + Exp) in GDP
Brazil
World
0
10
20
30
40
50
60
70
80
1995 1996 1997 1998 1999 2000 2001 2002 2003 2004 2005 2006
US
India
China
%
Source: World Bank
0
2
4
6
8
10
12
14
16
18
World EuropeanUnion
NorthAmerica
Developingeconomies
China India
Av. 1994-1996
Av. 2004-2006
Share of Direct Investment (FDI Inward) in gross fixed capital formation
Source: Unctad
%
0%
20%
40%
60%
80%
100%
120%
1995 1996 1997 1998 1999 2000 2001 2002 2003 2004 2005 2006 2007
EU 15 10 new MS Rom+Bul
Share of Total trade* on GDP
* Total Trade is the sum of Imp and Exp for Intra and Extra EU trade flows Source: Comext - New Cronos
in
2. GROWING INTEGRATION AND INTERDEPENCY OF WORLD ECONOMIES
Before going into the challenges posed by globalization for the European regions, the present section offers a brief overview of the growing integration and interdependency of Europe and other main world economies.
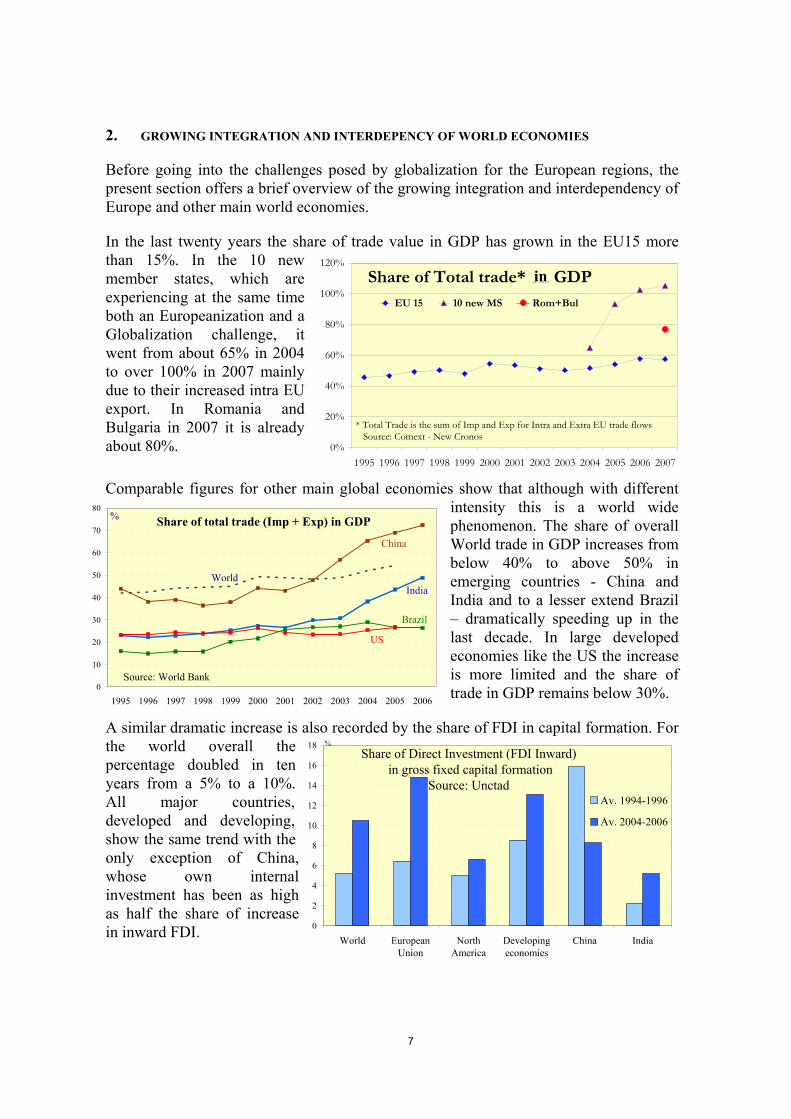
In the last twenty years the share of trade value in GDP has grown in the EU15 more than 15%. In the 10 new member states, which are experiencing at the same time both an Europeanization and a Globalization challenge, it went from about 65% in 2004 to over 100% in 2007 mainly due to their increased intra EU export. In Romania and Bulgaria in 2007 it is already about 80%.
Comparable figures for other main global economies show that although with different intensity this is a world wide phenomenon. The share of overall World trade in GDP increases from below 40% to above 50% in emerging countries - China and India and to a lesser extend Brazil – dramatically speeding up in the last decade. In large developed economies like the US the increase is more limited and the share of trade in GDP remains below 30%.
A similar dramatic increase is also recorded by the share of FDI in capital formation. For the world overall the percentage doubled in ten years from a 5% to a 10%. All major countries, developed and developing, show the same trend with the only exception of China, whose own internal investment has been as high as half the share of increase in inward FDI.

8
The question is then how EU's main economic competitors, the US, Japan, China and India are expected to evolve over the next decade and a half. Because of data constraints the projections are limited to labour productivity growth, GDP growth, GDP per capita growth and labour force. Given that these figures originate from different sources and that they are thus the result of different projection methodologies, they are not totally comparable. However, they give a rough indication of expected future tendencies.
EU output growth rates are projected to be considerably higher in the EU 10 (on average 4% per annum) as compared to the EU15 (2.3%) which clearly illustrates the expected economic catch-up process of the EU10 Member States. This catching-up process is reflected in significantly higher rates of labour productivity growth in the EU10, especially due to capital deepening2.
Table 1 Long term projections/annual average growth rates Labour productivity GDP GDP per capita Labour force 2005-2012 (1) 2004-2020 (1) 2004-2020 (1) 2005-2020 (2) EU25 1.6 2.3 2.2 0.3 EU 15 (5) 1.4 2.2 1.9 0.36 EU10 (6) 3.5 4.0 4.1 0.15 2005-2012 (3) 2006-2020 (4) 2006-2020 (4) 2006-2020 (4) USA 1.4 2.8 1.9 0.7 Japan 2.2 1.4 1.6 -0.3 China 8.3 5.5 5.1 0.35 India 5.7 5.0 3.6 1.7
Sources: (1) Economic Papers N° 253 June 2006: Long-term labour productivity and GDP projections for the EU25 Member States : a
production function framework. DG ECFIN. (2) Economic Papers N° 235 November 2005: Long-term labour force projections for the 25 EU Member States: A set of data for
assessing the economic impact of ageing. DG ECFIN (3) Economist Intelligence Unit WorldData database. (4) Long term forecast of global economy and population 2006-2050. Demographic change and the Asian economy. Economic
Research Department/ Japan Center for Economic research. March 2007 (5) Austria, Belgium, Denmark, Finland, France, Germany, Greece, Ireland, Italy, Luxembourg, Netherlands, Portugal, Spain,
Sweden, United Kingdom (6) Czech Republic, Estonia, Hungary, Latvia, Lithuania, Poland, Slovakia, Slovenia, Malta and Cyprus.
In the US, the projected trend of productivity growth averages 1.4% per year between 2005 and 2020. This expected productivity increase is mainly due to the maintained strength of technological progress and the importance of investment in IT equipment and software. It can be considered as a continuation of the US gains in labour productivity brought about by IT sectors.
Less positive though, is the ageing of the US labour force which will be responsible for slowing down the increase in labour quality which will act as a drag on productivity growth. But overall, it is expected that technological progress in industries producing IT equipment and software and a continued trend by firms towards the purchase of relatively cheap and highly productive IT equipment will considerably contribute to net labour productivity gains.
2 The growth accountancy exercise allows us to decompose labour productivity into three factors: (1) capital
deepening, i.e. more and better capital equipment, (2) increase in labour quality, i.e. a more human capital intensive labour force, and (3) total factor productivity growth, often associated with technological progress.
9
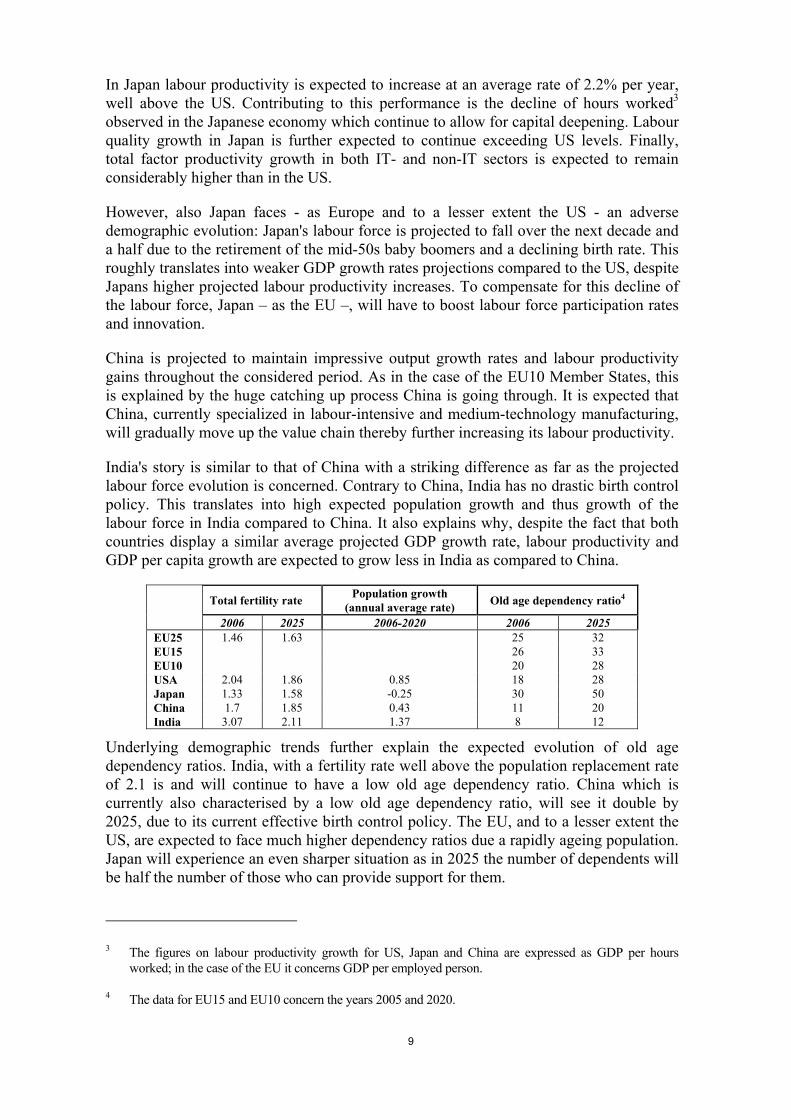
In Japan labour productivity is expected to increase at an average rate of 2.2% per year, well above the US. Contributing to this performance is the decline of hours worked3 observed in the Japanese economy which continue to allow for capital deepening. Labour quality growth in Japan is further expected to continue exceeding US levels. Finally, total factor productivity growth in both IT- and non-IT sectors is expected to remain considerably higher than in the US.
However, also Japan faces - as Europe and to a lesser extent the US - an adverse demographic evolution: Japan's labour force is projected to fall over the next decade and a half due to the retirement of the mid-50s baby boomers and a declining birth rate. This roughly translates into weaker GDP growth rates projections compared to the US, despite Japans higher projected labour productivity increases. To compensate for this decline of the labour force, Japan – as the EU –, will have to boost labour force participation rates and innovation.
China is projected to maintain impressive output growth rates and labour productivity gains throughout the considered period. As in the case of the EU10 Member States, this is explained by the huge catching up process China is going through. It is expected that China, currently specialized in labour-intensive and medium-technology manufacturing, will gradually move up the value chain thereby further increasing its labour productivity.
India's story is similar to that of China with a striking difference as far as the projected labour force evolution is concerned. Contrary to China, India has no drastic birth control policy. This translates into high expected population growth and thus growth of the labour force in India compared to China. It also explains why, despite the fact that both countries display a similar average projected GDP growth rate, labour productivity and GDP per capita growth are expected to grow less in India as compared to China.
Total fertility rate Population growth (annual average rate) Old age dependency ratio4
2006 2025 2006-2020 2006 2025 EU25 1.46 1.63 25 32 EU15 26 33 EU10 20 28 USA 2.04 1.86 0.85 18 28 Japan 1.33 1.58 -0.25 30 50 China 1.7 1.85 0.43 11 20 India 3.07 2.11 1.37 8 12
Underlying demographic trends further explain the expected evolution of old age dependency ratios. India, with a fertility rate well above the population replacement rate of 2.1 is and will continue to have a low old age dependency ratio. China which is currently also characterised by a low old age dependency ratio, will see it double by 2025, due to its current effective birth control policy. The EU, and to a lesser extent the US, are expected to face much higher dependency ratios due a rapidly ageing population. Japan will experience an even sharper situation as in 2025 the number of dependents will be half the number of those who can provide support for them.
3 The figures on labour productivity growth for US, Japan and China are expressed as GDP per hours
worked; in the case of the EU it concerns GDP per employed person.
4 The data for EU15 and EU10 concern the years 2005 and 2020.
10
3. CHALLENGES AND OPPORTUNITIES FACING THE EU REGIONS
Globalization can be described as a process of greater and faster economic integration and interdependence where new agents with different production modalities and different cost structures access the local markets and increasing mobility of both factors of production and final goods imposes economic and social adjustments.
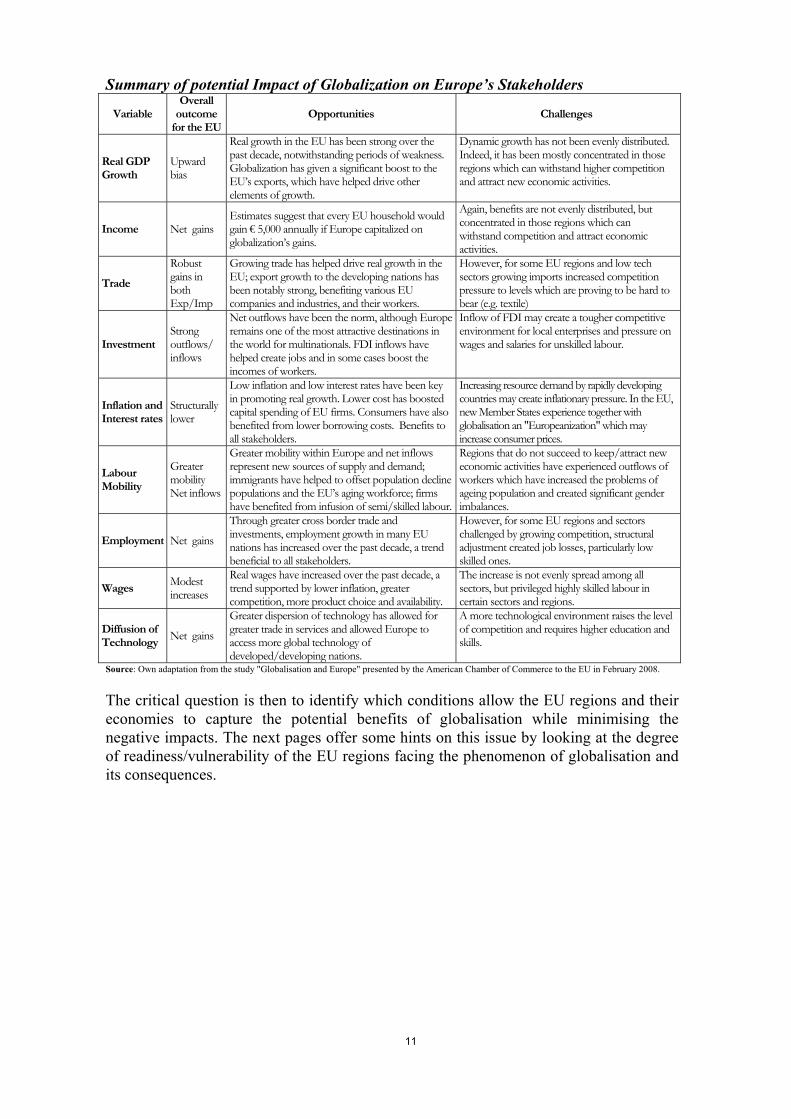
To investigate how globalisation will affect the EU we need to define the elements which best describe these changes and their likely impacts. The table on the next page tries to synthesise the potential impacts of globalisation on Europe vis-à-vis the most crucial economic variables: GDP, trade and investment, inflations and interest rates, employment and wages and, last but not least, dissemination of technology. The table suggests two main elements of reflection. The first is that aggregate effects of globalisation appear rather positive to all the EU fundamentals. The second is that this overall impact may hide profound differences among regions and sectors.
In particular, globalisation can provide better opportunities for producers, consumers, labour force and entrepreneurs, etc. who are in a position to exploit larger markets and competition. Under these conditions, living standards would be improved by lower prices and a wider choice of goods. A general increase in economic activity enhances labour demand and real wages for skilled labour. The diffusion of innovation and know-how would also increase productivity and favour enterprises and companies. However, if economic agents are not dynamic enough, negative impacts would be observed forcing a number of painful structural adjustments. Living standards would be lowered by the reduction of economic activities now free to delocalise to where conditions are more favourable. Rising import competition will further threaten local enterprises. Decline in economic activity generates job losses, a reduction of real wages for unskilled jobs and/or overall reduction of social welfare.
For the EU we observe that a large part of our territory is confronted with the need to restructure and modernise to face the challenge of globalisation. Despite impressive growth rates, the economic structure of the new Member States is still concentrated in sectors where competition from the emerging Asian economies is high. Many regions in the old Member States also have a high share of employment in traditional sectors, where competitive advantage is based on low cost factors. China and India, on the other hand, are increasingly attracting research investment and rapidly shedding their image as "low cost, low value" economies. This means that Europe must keep increasing productivity and quality, drawing on its technological strengths and its ability to compete in products and services with high knowledge content.
At the same time, the performance gap between the European Union and the US has hardly narrowed. This applies not only in terms of living standards, growth and employment, but also in key areas such as investment in R&D and new technologies, the numbers of patents issued and the percentage of the population with a tertiary education. Europe is also lagging in the uptake of new technologies, which helps to improve productivity.
11
Summary of potential Impact of Globalization on Europe’s Stakeholders
Variable Overall
outcome for the EU
Opportunities Challenges
Real GDP Growth
Upward bias
Real growth in the EU has been strong over the past decade, notwithstanding periods of weakness. Globalization has given a significant boost to the EU’s exports, which have helped drive other elements of growth.
Dynamic growth has not been evenly distributed. Indeed, it has been mostly concentrated in those regions which can withstand higher competition and attract new economic activities.
Income Net gains Estimates suggest that every EU household would gain € 5,000 annually if Europe capitalized on globalization’s gains.
Again, benefits are not evenly distributed, but concentrated in those regions which can withstand competition and attract economic activities.
Trade
Robust gains in both Exp/Imp
Growing trade has helped drive real growth in the EU; export growth to the developing nations has been notably strong, benefiting various EU companies and industries, and their workers.
However, for some EU regions and low tech sectors growing imports increased competition pressure to levels which are proving to be hard to bear (e.g. textile)
Investment Strong outflows/ inflows
Net outflows have been the norm, although Europe remains one of the most attractive destinations in the world for multinationals. FDI inflows have helped create jobs and in some cases boost the incomes of workers.
Inflow of FDI may create a tougher competitive environment for local enterprises and pressure on wages and salaries for unskilled labour.
Inflation and Interest rates
Structurally lower
Low inflation and low interest rates have been key in promoting real growth. Lower cost has boosted capital spending of EU firms. Consumers have also benefited from lower borrowing costs. Benefits to all stakeholders.
Increasing resource demand by rapidly developing countries may create inflationary pressure. In the EU, new Member States experience together with globalisation an "Europeanization" which may increase consumer prices.
Labour Mobility
Greater mobility Net inflows
Greater mobility within Europe and net inflows represent new sources of supply and demand; immigrants have helped to offset population decline populations and the EU’s aging workforce; firms have benefited from infusion of semi/skilled labour.
Regions that do not succeed to keep/attract new economic activities have experienced outflows of workers which have increased the problems of ageing population and created significant gender imbalances.
Employment Net gains
Through greater cross border trade and investments, employment growth in many EU nations has increased over the past decade, a trend beneficial to all stakeholders.
However, for some EU regions and sectors challenged by growing competition, structural adjustment created job losses, particularly low skilled ones.
Wages Modest increases
Real wages have increased over the past decade, a trend supported by lower inflation, greater competition, more product choice and availability.
The increase is not evenly spread among all sectors, but privileged highly skilled labour in certain sectors and regions.
Diffusion of Technology Net gains
Greater dispersion of technology has allowed for greater trade in services and allowed Europe to access more global technology of developed/developing nations.
A more technological environment raises the level of competition and requires higher education and skills.
Source: Own adaptation from the study "Globalisation and Europe" presented by the American Chamber of Commerce to the EU in February 2008.
The critical question is then to identify which conditions allow the EU regions and their economies to capture the potential benefits of globalisation while minimising the negative impacts. The next pages offer some hints on this issue by looking at the degree of readiness/vulnerability of the EU regions facing the phenomenon of globalisation and its consequences.
12
4. KEYS TO SUCCESS: PRODUCTIVITY, JOBS AND EDUCATION
As it has been already mentioned, the process of globalization is seen in this analysis as a structural development of the economic system. In this frame, cyclical events such as the contraction of the economic activity and international exchange due to the recent crisis do not modify the analytical approach since it is believed that they are transitory. Beside, the crisis may make the case for even greater need for structural adjustments reinforcing the importance of elements such as, e.g., knowledge based economies for being able to transform challenges into opportunities.
To take into account these elements into an analysis directly applicable to the EU regions, five key indicators available at a regional level have been selected and projected to the year 20205. The table below breakdowns the indicators and their rationale.
INDICATOR RATIONALE
(1) Productivity growth 2020
Productivity growth is not only key to ensuring a competitive economy in a global context, it will soon also be the only source of growth as demographic decline will make it difficult to increase total employment
(2) employment rate 2020
(3) unemployment rate 2020
The employment rate projections show a substantial increase by 2020 to 70% from 63% in 2005. Nevertheless, major disparities will remain with several regions with levels below 55%.
(4) high educational attainment 2020
(5) low educational attainment 2020
As the EU's economy moves towards a more service based economy and away from manufacturing, it will create less jobs for low skilled labour. Currently in the EU 29% of the people aged 25-64 lack a complete secondary education, this will only drop to 25% in 2020. The challenge will be to provide training to people without a complete secondary education and to find new ways of creating more low skilled jobs. Labour productivity depends to a large degree on the education level of the labour force. The education level projections indicate that the growth of tertiary education levels will not be sufficient to catch up with other large developed countries such as the US and that large disparity between EU regions will remain.
A number of other factors will also strongly influence the extent of regional exposure and adaptive capacity to globalisation, such as R&D and innovation performance. However, due to data limitations (i.e. the absence of projected values at a regional scale) these variables are not yet available for applied regional analysis.
The fourth Cohesion Report stated that by 2020 the EU's working age population will be shrinking to an extent that can no longer be compensated by increased participation rates. This suggests that a strong productivity dynamic is an irreplaceable source of economic growth. Projections of the productivity index for the EU regions at the year 2020 are presented on the map on the following page. The index has a free range of variation against an EU average equal to 100. The map indicates a strong dynamic in Scandinavian regions that – together with some scattered region of the old EU member states (Ireland, UK, France, Austria, etc.) - will reach a much higher level than the EU average. On the other side, the productivity index of the Member States on the Far East (the Baltic, Romania,
5 The projections utilised in the paper are based on a national economic forecasts published by DG
ECFIN in Economic Papers N° 253 June 2006: Long-term labour productivity and GDP projections for the EU25 Member States : a production function framework. DG REGIO has added projections for RO and BG based on average trends for the 10 new Member States

13
Bulgaria Poland and Slovakia) and, to a lesser extent, of Spain and Greece will remain below the EU average.

14
REGIONAL LABOUR PRODUCTIVITY IN 2020 (EU-27=100)
15
Projections of regional employment and unemployment rate are presented on the maps on the next page. On the one hand, it appears that several regions could still be faced with employment rates below 55% for the year 2020. These are Southern Italy and parts of Romania, Hungary and France. Employment rates would still be relatively low in Poland Romania, Bulgaria, Greece the Centre of Italy, the South of Spain.
On the other hand, unemployment is expected to decline, but substantial regional variation, as it is already the case today, will remain in 2020. Applying the current structure of regional unemployment levels to the assumed national unemployment levels in 2020 provides a rough indication of where unemployment may still be high. Unemployment may still be close to 10% or higher in Southern Spain, Southern Italy and in most regions in Poland, and Eastern Germany.
Finally, together with these numbers it is worth introducing a key qualitative consideration. In 2005, several regions in the EU still had a high share (more than 15%) of their jobs in low-tech manufacturing sectors which are vulnerable to increasingly global competition.
In terms of higher education, at the international level the EU27 scores low with only 22% of people aged 25-64 with a tertiary education (data OECD 2004) compared to a 45% in Canada, 39% in the US and 30% in Australia and Korea. In the EU only the three Nordic countries obtain similar records. To accomplish the goal of being a strong knowledge-based economy, the EU would need ever more knowledge workers to attract and retain growing share of global R&D expenditure and facilitate the shift to higher value added economic activities.
For the future, the projections indicate that by 2020, regions in the Nordic Member States, Benelux, UK, Ireland, France and Northern Spain will mostly have more than 35% of tertiary educated aged 25-64. However, regions in Portugal, Italy, Romania, Hungary, Austria and the Czech Republic will still have quite low levels, especially outside the capital region, with a still notable number of regions with less than 20% of tertiary educated.
The share of people aged 25-64 without a complete secondary education is expected to be very low in the Nordic Member States, the Baltic States, Poland, the Czech Republic and Slovakia. On the other hand, these levels will still be quite high in Portugal, Spain, France, Italy, Greece and parts of Romania and Bulgaria. Needless to say this may create a double pressure on the regions where a significant share of employment may be lost due to globalisation.

16
REGIONAL EMPLOYMENT RATE IN 2020 REGIONAL UNEMPLOYMENT RATE IN 2020

17
HIGH EDUCATIONAL LEVEL OF POPULATION AGED 25-64 IN 2020 LOW EDUCATIONAL LEVEL OF POPULATION AGED 25-64 IN 2020

18
5. THE "GLOBALISATION VULNERABILITY INDEX"
To allow a synthetic reading of key factors relevant to the challenges posed by globalization, the five indicators analysed in the previous pages have been combined into a globalisation vulnerability index.
The index is built based on how regions score on the selected indicators6 both in 2005 and - on the basis of the 15 year projections - 2020. The index is presented in the form of a relative comparison among EU regions – that is, it varies within a fix range 0-100 being 0 the best score and 100 the worst.
Results of the analysis are multifaceted. A first indication is that there are no radical changes in the relative positioning of the regions. This is clearly illustrated in the graph on the next page which represents the value of the index in 2005 on the horizontal (X) axis and the values of the index in 2020 on the vertical (Y) axis. In the graph the EU regions tend to align along the bisecting line indicating a substantial stationary relative position of the points representing the regions in 2005 and 20207.
By moving the axes it is possible to split the graph in four sections with different features. On the one hand, the large majority of observations placed in the first and third quadrants (up/right and bottom/left) indicates continuity – that is, regions with an index below average in 2005, will keep being better off in 2020 and vice versa. On the other hand, the much less populated second and fourth quadrants (top/left and bottom/right) indicate that only few lagging regions in 2005 will be able to lead in 2020 and that an equally small number of those which were leading in 2005 will be lagging in 2020.
This relatively static picture hides, however, some important differences relating to the dynamics of the different regions. If we look at the graph from the perspective of splitting it along the bisector we can identify all regions which are projected to have an improvement of their globalisation index between 2005 and 2020 (represented by the points placed below the bisecting line) or to worsen it (points above the line). Beside, a further element can be introduced to give a sense of the performance of the EU regions vis-à-vis international competition. The very basic assumption adopted here is that a hypothetical international competitor would be characterised by a performance, in terms of globalisation index, 10% more dynamic than average8. This hypothesis is represented on the graph by a line 10% less inclined than the bisector. Those regions which are placed below this line will have not only a relatively good dynamic vis-à-vis the EU internal standard, but also against a stylised international benchmark.
6 Depending on the indicator the region ranked at the bottom/top are allocated an increasing number of
points. The synthetic index is the sum of the points allocated to each region for the different indicators standardized for a range of variation 0-100. The robustness of the index is confirmed by the fact that the shares of each indicator in the overall index result quite balanced.
7 A linear interpolation, not reported in the text, results in an equation y=0.81x+7.3 - that is, very close to the bisector.
8 The threshold of 10% is the result of a qualitative estimate based on current data and projections for the globalisation index elements (GDPpc, education, etc.) in some developed and developing countries.

19
Globalisation Index2005 and 2020
BE10BE21
BE22
BE23
BE24
BE25
BE31
BE32
BE33
BE34
BE35
BG11BG12
BG13
BG21
BG22
BG23
CZ01
CZ02
CZ03
CZ04
CZ05CZ06
CZ07
CZ08
DK00DK00DK00DK00DK00
DE11
DE12
DE13
DE14
DE21
DE22
DE23
DE24
DE25
DE26
DE27
DE30
DE41
DE42
DE50
DE60
DE71
DE72
DE73
DE80
DE91
DE92
DE93
DE94
DEA1
DEA2
DEA3
DEA4
DEA5
DEB1
DEB2
DEB3
DEC0
DED1
DED2
DED3
DEE0
DEF0
DEG0
EE00
IE01
IE02
GR11
GR12
GR13GR14
GR21
GR22
GR23
GR24
GR25
GR30
GR41
GR42
GR43
ES11
ES12ES13
ES21
ES22
ES23
ES24
ES30
ES41
ES42
ES43
ES51
ES52
ES53
ES61ES62
ES63
ES64
ES70
FR10
FR21FR22
FR23
FR24
FR25
FR26
FR30
FR41
FR42
FR43
FR51
FR52
FR53
FR61
FR62
FR63
FR71
FR72
FR81
FR82
FR83
ITC1
ITC2
ITC3
ITC4
ITD1
ITD2
ITD3
ITD4
ITD5ITE1
ITE2
ITE3
ITE4
ITF1
ITF2
ITF3
ITF4
ITF5ITF6
ITG1
ITG2
CY00
LV00
LT00
LU00
HU10
HU21
HU22
HU23
HU31
HU32
HU33
MT00
NL11
NL12NL13
NL21
NL22
NL23
NL31
NL32
NL33
NL34
NL41
NL42
AT11
AT12
AT13
AT21
AT22
AT31AT32
AT33
AT34
PL11
PL12
PL21
PL22
PL31
PL32
PL33
PL34
PL41PL42
PL43
PL51
PL52
PL61
PL62
PL63
PT11
PT15
PT16
PT17
PT18
PT20
PT30
RO11
RO12
RO21
RO22
RO31
RO32
RO41
RO42
SI00SI01
SK01
SK02
SK03
SK04
FI13
FI18FI19
FI1A
FI20
SE11
SE12
SE21
SE22
SE23
SE31
SE32
SE33
UKC1UKC2UKD1
UKD2
UKD3
UKD4
UKD5
UKE2
UKE3
UKE4
UKF1
UKF2
UKF3
UKG1
UKG2
UKG3
UKH1
UKH2
UKH3
UKI1
UKI2
UKJ1
UKJ2
UKJ3
UKJ4
UKK1
UKK2
UKK3
UKK4
UKL1
UKL2
UKM1
UKM2
UKM3
UKM4
UKN0
UKE5
0
10
20
30
40
50
60
70
80
90
100
0 10 20 30 40 50 60 70 80 90 100
Globalisation Index 2005
Glo
balis
atio
n in
dex
2020
leading todayand tomorrow
leading today but lagging tomorrow
International benchmark
lagging today but leading tomorrow
lagging todayand tomorrow
Bisecting line

20
Synthetic results n° regions %EU pop Lagging in 2005 and 2020 (up right section in the graph) 115 43%
of which Conv/Ph.out 65 22% Rce/Ph. in 50 21%
Leading in 2005 and 2020 (bottom left section in the graph) 104 37% of which Conv/Ph.out 11 3%
Rce/Ph. in 93 34% Lagging in 2005, leading in 2020 (bottom right section in the graph) 28 11%
of which Conv/Ph.out 16 8% Rce/Ph. in 12 4%
Leading in 2005, lagging in 2020 (up left section in the graph) 20 8% of which Conv/Ph.out 3 1%
Rce/Ph. in 17 7% The table above breakdowns a synthetic reading of the graph whose main findings can be synthesised into four main elements:
(1) Regions for which the index suggests a lagging position both in 2005 and 2020 - are both Convergence and Objective 2 regions. The share of EU population living in these regions is around 43% and it is fairly divided between the two groups. The large majority (80%) of the regions in this group are positioned below the bisecting line, indicating that in dynamic terms they are projected to improve their relative position between 2005 and 2020 - that is, the index value in 2020 will be lower than in 2005. However, if we look at the position vis-à-vis the line of the international benchmark the share of regions in a relative good position is reduced by half with a majority of those belonging to the new member states.
(2) Regions in a leading position both in 2005 and 2020 are mostly non-convergence regions, belonging to the old Northern member states. However, the large majority (70%) of these regions positioned above the bisecting line indicates that their performance is projected to slow down – that is, that in 2020 they will score worse on the globalisation index than in 2005.
(3) Regions lagging in 2005 but expected to have such a strong dynamic to be leading in 2020 represent about 11% of the EU population. They are located both in the old and the new Member States. In particular, the best performing regions in this group belong to Poland, Slovenia and Slovakia which are also projected to exceed the international benchmark threshold.
(4) Finally, regions leading in 2005 but expected to be lagging in 2020 are mostly non-convergence regions representing about 8% of the EU population. The position of these regions is not extreme (the points are mainly positioned close to the EU average) and they belong mostly to Germany, with some UK and one Finnish region plus, from the new Member States, Lithuania.

21
0
10
20
30
40
50
60
70
0-29 30-39 40-49 50-59 60-74 75-1000%
5%
10%
15%
20%
25%
30%
35%
40%
n° regions 2005 n° regions 2020 pop % 2005 pop % 2020
2005-2020 changes of the globalization index grouped by classes
b l
Index value
n° o
f reg
ions
% population
From the point of view of the dynamic of the globalisation index the graph above helps comparing the position of the regions – grouped by their index value – in 2005 and 2020. The graph shows how the number of regions and the share of population at the two extremes of the distribution – best index value (0-29) and worst index value (60-74 and 100-75) - are projected to shrink between 2005 and 2020 in favour of an increase in the number of regions – and share of population – included in the three intermediate classes (30-39;40-49;50-59).
To conclude this section, the map on the next page offers a geographical view of the projected value of the index for the year 2020 again grouped by the same six classes. The main elements emerging from the map confirm the findings already discussed and can be described as following:
– Many regions located in the North-West periphery of the European Union appear to be in a rather favourable position. These regions are largely in Finland, Sweden, Denmark, the UK and Ireland. They are expected to benefit from a workforce with a high level of educational attainment, a high level of employment, a high share of employment in advanced sectors and a high level of labour productivity.
– Most regions located in the Southern and Eastern parts of the Union, stretching from Latvia, Eastern Slovakia, Hungary, Bulgaria and Romania to Greece, Italy, Spain and Portugal, still appear in 2020 to be much more exposed to the challenge of globalisation despite a relatively good dynamic of the globalisation index between 2005 and 2020 in some cases. This persistent vulnerability is predominantly due to the relatively large share of low value added activities in these regions and weaknesses in workforce qualifications, which may lead to difficulties in attracting investment and creating or maintaining jobs.

22
– No clear pattern emerges in Western and Central Europe, where there are often strong sub-national variations. Some areas are expected to be in a less favourable position (e.g. some regions in the North of Germany) than others projected to achieve higher levels of productivity, employment and educational attainment (e.g. parts of Austria, Germany, France).

23
– At the sub-national level, the analysis reveals that, in many Member States, regions with major urban centres and metropolitan areas9 should be relatively well placed to respond to the challenges linked to globalisation10. These areas tend to benefit from a large share of highly educated residents, highly dynamic sectors and leading-edge economic activities. Yet, the concentration of economic activities in agglomerations may also create negative externalities (such as congestion, urban sprawl, drain on natural resources and ecosystem services) and may also lead to underutilised economic potential elsewhere.
9 Metropolitan areas are defined as large agglomeration zones consisting of several urban centres or a
very large city. In a number of Member States these are the capital region (e.g. Ile de France, Greater London, Madrid, Warsaw). In a number of other Member States these are more dispersed (e.g. Amsterdam-Rotterdam, the Rhein-Main area, Munich).
10 There are however a number of rural and remote regions, which will fare well in response to globalisation. These regions are characterised by a high employment rate and an equally high educational attainment of the workforce.

24
MAIN REFERENCES
American Chamber of Commerce - Globalisation and Europe - February 2008
DG Ecfin in Economic Papers N° 253 June 2006: Long-term labour productivity and GDP projections for the EU25 Member States : a production function framework
DG Ecfin Long-term labour productivity and GDP projections for the EU25 Member States : a production function framework. Economic Paper N° 253. June 2006.
DG Ecfin Long-term labour force projections for the 25 EU Member States: A set of data for assessing the economic impact of ageing. Economic Papers N° 235 November 2005
Economist Intelligence Unit World Data online database @ http://www.eiu.com/WorldData.
Krugman P. The "new" Economic Geography: Where are we? – Unpublished manuscript available @ http://www.ide.go.jp/Japanese/Lecture/Sympo/pdf/krug_summary.pdfn
Japan Centre for Economic research - Economic Research Department Long term forecast of global economy and population 2006-2050. Demographic change and the Asian economy. March 2007
Rumford C. European Cohesion? Globalization, Autonomization, and the Dynamics of EU Integration Innovation: The European Journal of Social Sciences, Volume 13, Number 2, 1 July 2000 , pp. 183-197(15)
Salvatore D. Globalization, International Competitiveness, and European Regions Economia politica - Journal of analytical and institutional economics n° 1, April 2008