Embed Size (px)
Citation preview

7/31/2019 Global Wage Report
http://slidepdf.com/reader/full/global-wage-report 1/139

7/31/2019 Global Wage Report
http://slidepdf.com/reader/full/global-wage-report 2/139
Global Wage Report 2010/11
Wage policies in times o crisis

7/31/2019 Global Wage Report
http://slidepdf.com/reader/full/global-wage-report 3/139

7/31/2019 Global Wage Report
http://slidepdf.com/reader/full/global-wage-report 4/139
Global Wage Report
2010/11Wage policies in times o crisis
International Labour Ofce · Geneva
7/31/2019 Global Wage Report
http://slidepdf.com/reader/full/global-wage-report 5/139
Copyright © International Labour Organization 2010First published 2010
Publications o the International Labour Oce enjoy copyright under Protocol 2 o the Universal Copyright Convention. Never-theless, short excerpts rom them may be reproduced without authorization, on condition that the source is indicated. For rights o reproduction or translation, application should be made to ILO Publications (Rights and Permissions), International Labour Oce,CH-1211 Geneva 22, Switzerland, or by email: [email protected]. The International Labour Oce welcomes such applications.Libraries, institutions and other users registered with reproduction rights organizations may make copies in accordance with thelicences issued to them or this purpose. Visit www.irro.org to nd the reproduction rights organization in your country.
ILOGlobal Wage Report 2010/11: Wage policies in times o crisis
Geneva, International Labour Oce, 2010
wage policy / wages / wage dierential / low wages / economic recession / developed countries / developing countries1 v.13.07
ISBN 978-92-2-123621-4 (print)ISBN 978-92-2-123622-1 (pd)ISBN 978-92-2-024146-2 (CD-ROM)
Also available in Chinese: ISBN 978-92-2-523621-0; French: ISBN 978-92-2-223621-3; Portuguese: ISBN 978-92-2-823621-7;
Russian: ISBN 978-92-2-423621-1; and Spanish: ISBN 978-92-2-323621-2.
ILO Cataloguing in Publication Data
The designations employed in ILO publications, which are in conormity with United Nations practice, and the presentation o material therein do not imply the expression o any opinion whatsoever on the part o the International Labour Oce concerningthe legal status o any country, area or territory or o its authorities, or concerning the delimitation o its rontiers.
The responsibility or opinions expressed in signed articles, studies and other contributions rests solely with their authors, andpublication does not constitute an endorsement by the International Labour Oce o the opinions expressed in them.
Reerence to names o rms and commercial products and processes does not imply their endorsement by the International LabourOce, and any ailure to mention a particular rm, commercial product or process is not a sign o disapproval.
ILO publications and electronic products can be obtained through major booksellers or ILO local oces in many countries, ordirect rom ILO Publications, International Labour Oce, CH-1211 Geneva 22, Switzerland. Catalogues or lists o new publica-tions are available ree o charge rom the above address, or by email: [email protected] our website: www.ilo.org/publns
Photocomposed in Switzerland JMB
Printed in Switzerland SRO

7/31/2019 Global Wage Report
http://slidepdf.com/reader/full/global-wage-report 6/139
Preface
The global economic crisis has had devastating consequences on labour markets.Unemployment has increased to 210 million, the highest level ever recorded, and manymillions more have simply dropped out of the labour force because they are too discour-aged to continue looking for work. Paychecks have been affected too.
This second ILO Global Wage Report provides some evidence about the impactof the crisis on wages around the world. It shows in particular that the global growth inreal average wages was reduced by half in 2008 and 2009, compared to earlier years.This highlights how while the crisis has been dramatic for those who lost their jobs,smaller than expected paychecks have also severely affected the purchasing power andwell-being of those who managed to stay in work.
In the future, a jobs- and income-based growth strategy is urgently needed to bringthe global economy back on track, to redress past imbalances and to place economicgrowth on more solid foundations. This has also been the message of other ILO reports,such as the report submitted to the G20 in September 2009, the annual World of Work
Report by the International Institute for Labour Studies, or the message delivered at theJoint ILO–IMF Conference in Oslo, in September 2010.
Among the most pressing challenges to be dealt with are rising wage inequality,the growing disconnect between wages and productivity, and the 330 million or soemployees who are now amongst the low paid in their country.
The present report provides policy-makers with some practical illustrations of how collective bargaining, minimum wages and income policies can help to addressthe fairness challenge which confronts policy-makers today. We hope these illustrationscan assist policy-makers and the social partners in advancing their decent work objec-tives and contribute to converting into practice the internationally agreed ILO Declara-tion on Social Justice for a Fair Globalization and the Global Jobs Pact, which receivedvigorous support from governments and from employers’ and workers’ organizationsfrom all regions of the world.
Manuela Tomei Director
Conditions of Work and Employment Programme

7/31/2019 Global Wage Report
http://slidepdf.com/reader/full/global-wage-report 7/139

7/31/2019 Global Wage Report
http://slidepdf.com/reader/full/global-wage-report 8/139
Contents
Preace. . . . . . . . . . . . . . . . . . . . . . . . . . . . . . . . . . . . . . . . . . . . . . . . . . . . . . . . . . . . . . . v
Acknowledgements . . . . . . . . . . . . . . . . . . . . . . . . . . . . . . . . . . . . . . . . . . . . . . . . . . . . xiii
Introduction . . . . . . . . . . . . . . . . . . . . . . . . . . . . . . . . . . . . . . . . . . . . . . . . . . . . . . . . . . xv
Part I Major trends in wages
1 Growth o average wages . . . . . . . . . . . . . . . . . . . . . . . . . . . . . . . . . . . . . . . . . . . . 1
1.1 Global estimates . . . . . . . . . . . . . . . . . . . . . . . . . . . . . . . . . . . . . . . . . . . . . . . . 1
1.2 Regional estimates . . . . . . . . . . . . . . . . . . . . . . . . . . . . . . . . . . . . . . . . . . . . . . 6
1.3 Average wages and productivity. . . . . . . . . . . . . . . . . . . . . . . . . . . . . . . . . . . . 18
2 The wage share . . . . . . . . . . . . . . . . . . . . . . . . . . . . . . . . . . . . . . . . . . . . . . . . . . . . 18
2.1 Recent trends in national wage shares . . . . . . . . . . . . . . . . . . . . . . . . . . . . . . . 22
2.2 Trends at the sectoral level . . . . . . . . . . . . . . . . . . . . . . . . . . . . . . . . . . . . . . . . 25
3 Wage inequality and low pay . . . . . . . . . . . . . . . . . . . . . . . . . . . . . . . . . . . . . . . . . 31
3.1 Recent trends: Increasing incidence o low pay . . . . . . . . . . . . . . . . . . . . . . . 34
3.2 Characteristics o low-paid workers . . . . . . . . . . . . . . . . . . . . . . . . . . . . . . . . . 47
Part II Wage policies in times o crisis
4 The role o wage policies . . . . . . . . . . . . . . . . . . . . . . . . . . . . . . . . . . . . . . . . . . . . 47
4.1 Social justice and equity. . . . . . . . . . . . . . . . . . . . . . . . . . . . . . . . . . . . . . . . . . 47
4.2 The macroeconomic eects o wages . . . . . . . . . . . . . . . . . . . . . . . . . . . . . . . 48
4.3 Market imperections . . . . . . . . . . . . . . . . . . . . . . . . . . . . . . . . . . . . . . . . . . . . 50
4.4 Vulnerable workers: Low-wage jobs . . . . . . . . . . . . . . . . . . . . . . . . . . . . . . . . 53
5 Wage policies . . . . . . . . . . . . . . . . . . . . . . . . . . . . . . . . . . . . . . . . . . . . . . . . . . . . . . 54
5.1 Collective bargaining . . . . . . . . . . . . . . . . . . . . . . . . . . . . . . . . . . . . . . . . . . . . 56
Collective bargaining and average wages 56
Collective bargaining and low pay 57
The challenge o inclusive systems 59
5.2 Minimum wages 63
Recent trends 64
Can minimum wages reduce low pay? 67

7/31/2019 Global Wage Report
http://slidepdf.com/reader/full/global-wage-report 9/139
viii Global Wage Report 2010 / 11
5.3 From minimum wages to minimum income or low-income households 74
Policies to weaken the linkage between low pay and poverty 74
What policies? Scope and potentials 75
Part III Summary and conclusions
6 Main fndings and policy implications 79
7 Emerging issues and the way orward 81
Appendices
Technical appendix I: Global wage trends: Methodological issues 83
Technical appendix II: Denition and measurement o the wage shareand shit-share analysis 94
Statistical appendix 109
Bibliography
Background papers 99
Reerences 99
Tables
1. Cumulative wage growth, by region since 1999 (1999 = 100) 15
2. The wage share in OECD countries or the real economy 23
3. Selected list o low-wage studies and their methodologies 38
4. Dierent reasons why women are more vulnerable to low wages:Arguments and implications rom a literature review 51
5. Minimum wages during the crisis 65
6. Minimum wages and infation in selected countriesin Latin America (in percentages) 66
7. Recent developments in minimum wage policies in selected countries 67
8. Poverty rates by pay and employment in China, 2002–07 (in per cent) 75
9. In-work benets programmes in selected industrialized countries 76
10. Examples o cash transer policies in selected countries 77
B1. Sources o employment-related income data in Arica 16
B2. Variables increasing the risk o low pay in selected developing countries 44
B3. Domestic workers as a percentage o total employment by sex 62

7/31/2019 Global Wage Report
http://slidepdf.com/reader/full/global-wage-report 10/139
ixContents
Figures
1. The global recession and recovery, 1995–2010(year-on-year changes in GDP at constant prices, in per cent) 2
2. Global wage growth, 2006–09 (year-on-year changes, real terms, in per cent) 3
3. Wage growth in the G20, 2006–09 (year-on-year changes, real terms, in per cent) 4
4. Nominal wage growth and infation in our selected countries, 2006–09(in per cent) 6
5. Regional wage growth, 2000–09 (in per cent p.a.) 7
6. Index o nominal and real average weekly earnings in the United States(all non-arm employees), March 2006 to March 2010 (March 2006 = 100) 9
7. Wage growth in selected advanced countries, 2007–09 (in per cent) 10
8. Weekly hours worked or paid in selected advanced countries, 2007–09(changes in annual averages) 10
9. Wage growth in selected countries in Central and Eastern Europeand Central Asia, 2007–09 (in per cent) 13
10. Wage growth in selected countries in Asia, 2007–09 (in per cent) 14
11. Wage growth in selected countries in Latin America and the Caribbean,2007–09 (in per cent) 14
12. Wage growth in selected countries and territories in Arica and the Middle East,2007–09 (in per cent) 15
13. Regional growth in GDP, employment and labour productivity, 2000–09(in per cent) 19
14. Wages and productivity during the crisis, 2008–09 (in per cent) 21
15. Explaining changes in the wage share: A “shit-share” analysis(in percentage points) 27
16. Changes in wage shares in the manuacturing sector (in percentage points) 28
17. Changes in wage shares in the construction sector (in percentage points) 29
18. Changes in wage shares in nancial intermediation, real estate,renting and other business activities (in percentage points) 30
19. Changes in wage inequality (selected countries), 1995–2000 and 2007–09 32
20. Changes in low-wage employment in selected countries, 1995–2000and 2007–09 (in percentage points) 35
21. Low-wage employment: A global comparison, latest available year(in per cent) 36
22. Output per worker (productivity) and low-wage employmentin 34 countries, latest available year 37
23. Incidence o low-wage employment by major demographic characteristics,selected countries, various years (in per cent) 39
24. Female share o low-wage employment in selected countries, latest year(percentage o total low-wage employment) 42

7/31/2019 Global Wage Report
http://slidepdf.com/reader/full/global-wage-report 11/139
x Global Wage Report 2010 / 11
25. Comparison o low-pay incidence and the average gender pay gap,17 OECD countries, 2007 (in per cent) 43
26. Predicted transition rates rom low-wage jobs to higher wage jobsand non-employment in selected countries (in per cent) 54
27. Incidence o low-wage employment and mobility in European countries 55
28. Sound wage policies make a dierence: An illustration 56
29. The average incidence o low pay by trade union density in 33 countries,2009 or latest year (in per cent) 59
30. Union membership by pay level in our selected countries
(as percentage o workers) 6131. Minimum wages and the incidence o low pay in selected countries 69
32. Cross-country comparison: Minimum wages and the incidenceo low-wage employment in 27 countries 71
Boxes
1. Wages in the public and the private sectors . . . . . . . . . . . . . . . . . . . . . . . . . . . . . . . 11
2. Wage growth in Arica . . . . . . . . . . . . . . . . . . . . . . . . . . . . . . . . . . . . . . . . . . . . . . . 16
3. The determinants o the wage share in total income . . . . . . . . . . . . . . . . . . . . . . . . 26
4. Determinants o low-pay incidence: The statistical results o a logit modelin selected countries . . . . . . . . . . . . . . . . . . . . . . . . . . . . . . . . . . . . . . . . . . . . . . . . . 44
5. The perverse eects o declining wages . . . . . . . . . . . . . . . . . . . . . . . . . . . . . . . . . . 49
6. Germany: Bargaining over short-time work . . . . . . . . . . . . . . . . . . . . . . . . . . . . . . . 58
7. Collective bargaining or domestic workers: Is it possible?. . . . . . . . . . . . . . . . . . . 62
8. Reintroduction o wage councils in Uruguay . . . . . . . . . . . . . . . . . . . . . . . . . . . . . . 63
9. Do minimum wages hurt employment? . . . . . . . . . . . . . . . . . . . . . . . . . . . . . . . . . . 68
10. The minimum wage debate in India . . . . . . . . . . . . . . . . . . . . . . . . . . . . . . . . . . . . . 72
Technical appendix I tables
A1. Regional groups . . . . . . . . . . . . . . . . . . . . . . . . . . . . . . . . . . . . . . . . . . . . . . . . . . . . 84
A2. Coverage o the Global Wage Database (in per cent). . . . . . . . . . . . . . . . . . . . . . . . 85
A3. Coverage o the Global Wage Database, 2006–09 (in per cent). . . . . . . . . . . . . . . . 93
Technical appendix II fgure
A4. Germany: Wage share adjustments, 1980–2009 (ratio) . . . . . . . . . . . . . . . . . . . . . . 97

7/31/2019 Global Wage Report
http://slidepdf.com/reader/full/global-wage-report 12/139
xiContents
Statistical appendix tables
SA1. Average wages . . . . . . . . . . . . . . . . . . . . . . . . . . . . . . . . . . . . . . . . . . . . . . . . . . . . 111
SA2. Minimum wages . . . . . . . . . . . . . . . . . . . . . . . . . . . . . . . . . . . . . . . . . . . . . . . . . . . 116
SA3. Inequality . . . . . . . . . . . . . . . . . . . . . . . . . . . . . . . . . . . . . . . . . . . . . . . . . . . . . . . . 120

7/31/2019 Global Wage Report
http://slidepdf.com/reader/full/global-wage-report 13/139

7/31/2019 Global Wage Report
http://slidepdf.com/reader/full/global-wage-report 14/139
Acknowledgements
Main contributors
The report was prepared by the Conditions o Work and Employment Programme
(TRAVAIL) o the ILO Social Protection Sector, together with the Regional Oceso the ILO and the Department o Statistics. The report is a result o teamwork byPatrick Belser, Rebecca Freeman, Sangheon Lee, Malte Luebker, Andrés Marinakis,Aude Mellet, Jean-Michel Pasteels, Kristen Sobeck, Manuela Tomei and DanielVaughan-Whitehead. Patrick Belser was the principal editor. Charlotte Beauchampcoordinated editing and publication. Christian Olsen designed the cover page.
Specic contributions
Methodology or estimating global wage growth: Farhad Mehran (ILO consultant)provided guidance on the methodology or estimating global wage trends, which was
subject to a peer review by Proessor Yves Tillé (University o Neuchatel), Proes-sor Yujin Jeong (HEC Montreal), Proessor Joseph L. Gastwirth (George WashingtonUniversity) and Dr Joyup Ahn (Korea Labor Institute). Their contributions were gener-ously supported by the ILO/EC project on “Monitoring and Assessing Progress onDecent Work” (MAP) as part o the development o decent work databases. MalteLuebker (ILO, TRAVAIL) ormulated the nal methodology in collaboration withRaael Diez de Medina and Monica Castillo (both ILO, Department o Statistics). Kris-ten Sobeck (ILO, TRAVAIL) compiled the Global Wage Database.
Low pay: The ollowing people provided country-specic background papers onthe subject o low pay: A. Damayanti (Indonesia), Q. Deng and S. Li (Urban China),A. Fontes and V. Pero (Brazil), Damien Grimshaw (literature review), B.H. Lee and D.
Hwang (Republic o Korea), M. Oosthuizen and S. Goga (South Arica), T. Peralta andE. Guirao (Philippines) and Mario D. Velásquez Pinto (Chile). This research projectwas coordinated by Sangheon Lee (ILO, TRAVAIL) and was generously supported bythe Government o the Republic o Korea.
Wage share analysis: Rebecca Freeman and Jean-Michel Pasteels (ILO, Departmento Statistics) computed and analysed changes in sectoral wage shares in OECD countriesand Estonia. We are grateul to the OECD or its collaboration and or granting us accessto its Database or Structural Analysis (STAN) and National Accounts databases. MonicaCastillo (ILO, Department o Statistics) provided overall supervision or this project.
Special thanks
At dierent stages o the preparation o the report, useul comments and inputs werereceived rom a great many people, including: Scott Barklamb, Janine Berg, Carlos

7/31/2019 Global Wage Report
http://slidepdf.com/reader/full/global-wage-report 15/139
xiv Global Wage Report 2010 / 11
Carrion-Crespo, Assane Diop, Chris Donnges, Philippe Egger, Lawrence Egulu, ClaireHarasty, Nelien Haspels, Susan Hayter, Jane Hodges, Frank Hoer, Phu Huynh, StevenKapsos, Chang-Hee Lee, Susan Maybud, Bill Salter, Theodoor Sparreboom, GyorgySziraczki, Raymond Torres and Jacobo Velasco. Our special thanks go to the wholeteam o the ILO/SIALC (Inormation System and Labour Analysis) in Panama, inparticular Bolívar Pino, or providing wage data on Latin America and the Caribbean,and to Proessor Marc Lavoie or his box on “The perverse eects o declining wages”.Finally, we wish to thank the six anonymous peer reviewers, who helped us to greatlyimprove the report, as well as our numerous contacts in national statistical oces andMinistries o Labour around the world who provided us with wage data.

7/31/2019 Global Wage Report
http://slidepdf.com/reader/full/global-wage-report 16/139
Introduction
The Global Wage Report 2008/091 reviewed wages during the generally avourableeconomic period between 1995 and 2007. The present report looks at wages in a verydierent context. The years 2008–09 were characterized by the deepest economicdownturn since the 1930s. Following a housing bubble and a nancial crisis, the United
States entered into recession in December 2007, ater a 73-month long economic expan-sion that had started in November 2001.2 Thereater, the recession spread rapidly romits epicentre to the rest o the world, with global GDP shrinking in 2009 or the rsttime since the Second World War.3 Unprecedented global policy eorts contributed toa stronger than expected recovery in 2010, but the outlook remains uncertain.4
The crisis had a serious adverse impact on labour markets. Most dramatically, theglobal unemployment rate has increased rom 5.7 per cent o the labour orce in 2007to 6.4 per cent in 2009.5 This represents an increase o nearly 29 million persons, roman estimated 177.8 million people unemployed in 2007 to 206.7 million in 2009. Whileunemployment has increased primarily in advanced economies, the impact o the crisisin low- and middle-income developing countries (which generally have weaker socialprotection systems) can be seen in a deterioration in the quality o employment and ashit towards more vulnerable orms o employment.6 Evidence rom advanced coun-tries also indicates that the crisis has aected the level o wages, the number o hoursworked and other dimensions o what the ILO calls “decent work”. However, littlesystematic evidence has been presented to date on the eects o the crisis on these indi-cators o the conditions o work and employment.
What has been the overall eect o the crisis on average wages in dierent partso the world? To what extent has wage growth slowed in the context o alling labourproductivity? Furthermore, how has the crisis altered the distribution o national incomebetween labour and capital? These are some o the key questions that Part I o ourreport seeks to address. Based on available data rom as many countries as possible,we provide an overview o global wage trends during the crisis. However, it is still tooearly to oer a denitive picture: many national statistical oces are still processingand analysing the most recent data, particularly on the structure o earnings.
Wage trends during the crisis should be considered against a backdrop o wagemoderation and widespread and increasing wage inequality in the years beore thecrisis. In the current context, one particular concern is that the economic crisis may lead
1 ILO (2008a).
2 See NBER (2008).
3 See IMF (2010a).
4 As this report goes to press in November 2010, downside risks remain elevated according to the IMF (2010c).
5 See ILO (2010a).
6 See Khanna et al. (2010).

7/31/2019 Global Wage Report
http://slidepdf.com/reader/full/global-wage-report 17/139
xvi Global Wage Report 2010 / 11
to an increase in workers earning low wages, either in the short or the medium term.This report thereore provides data on the share o workers on low wages, which aredened as wages below two-thirds o median wages. Low pay is a concern because itincreases the risk o poverty, even though not all low-paid workers are poor. Low-wageworkers are disproportionately emale and are also more likely to be members o disad-vantaged groups. And, while low-wage employment can represent a rst stepping stonetowards better paid employment, especially or young workers, it can also turn into atrap rom which workers nd it dicult to extricate themselves due to lack o opportu-nities or skills development and other actors. When the situation arises where a largeproportion o people eel let behind, with little prospect o catching up with those in
more remunerative work, the risk o increased social and political tensions increases.Part II o this report discusses wage policies in times o crisis. Deteriorating wagetrends have always been a concern or policy-makers who care about social justice andwho wish to advance their national decent-work goals. In addition, the crisis seemsto have brought back into ocus Keynesian insights on the role o wages in sustain-ing domestic consumption and aggregate demand or goods and services. Our reportsuggests that instruments such as minimum wage policies and collective bargainingcan contribute to reducing the number o low-wage earners, while also redressing someimbalances by strengthening aggregate demand in countries that rely excessively onexports or, alternatively, on household debt to nance consumption. Part III o thereport concludes with a summary highlighting some issues that are o key importance
or improving wage policies.

7/31/2019 Global Wage Report
http://slidepdf.com/reader/full/global-wage-report 18/139
1 Growth o average wages
Since the publication o the rst Global Wage Report in 2008, the economic contexthas changed dramatically. Figure 1 shows that, ater some years characterized by stronggrowth rom 2003 to mid-2007, the world economy slowed down in 2008 and contractedby –0.6 per cent in 2009,7 primarily as a result o the collapse in international tradeand oreign investment that ollowed the nancial crisis.8 However, while growth inadvanced economies – and in the world as a whole – turned negative in 2009, this hasnot generally been the case in emerging and developing economies, where growth hasmerely decelerated.9 There have also been considerable dierences among countrieswithin regions. Dynamic policy intervention contributed to a stronger than expectedrecovery in 2010, with anticipated world economic output rising by 4.8 per cent. 10 Inemerging and developing economies, growth was anticipated to increase rom 2.5 per
cent in 2009 to 7.1 per cent in 2010, in contrast to a recovery in advanced economiesrom –3.2 per cent in 2009 to 2.7 per cent in 2010. However, the recovery remains rag-ile, with considerable downside risks to uture global economic growth.
1.1 Global estimates
To what extent have these economic trends aected wage developments in the globaleconomy? To provide an answer to this question, we have collected and processed wagedata rom a large and diverse number o countries worldwide.11 Our primary aim is tocapture trends in monthly average wages or all employees. “Wages”, as dened bythe ILO, reers to “remuneration or earnings which are payable in virtue o a writtenor unwritten contract o employment by an employer to an employed person”. 12 The
concept o wages thereore excludes the earnings o sel-employed workers and is appli-cable only to wage earners. Wage earners account or about 86 per cent o the employedpopulation in advanced economies, but this proportion alls to about 35 per cent in Asia
7 According to IMF data (IMF, 2010c).
8 According to short-term trade statistics rom the World Trade Organization (WTO), world exports ell by 38 percent (in nominal terms), rom US$4,315 billion in the third quarter o 2008 to a low point o US$2,685 billion in therst quarter o 2009.
9 This is also emphasized in Majid (2009).
10 See IMF (2010c).
11 The Global Wage Database is available at www.ilo.org/travail
12 See ILO Convention No. 95, Article 1.
Major trends in wages Part i

7/31/2019 Global Wage Report
http://slidepdf.com/reader/full/global-wage-report 19/139
2 Global Wage Report 2010 / 11
and to less than 30 per cent in Arica. 13 Whereas in advanced countries the ractionso men and women in wage employment are roughly equal, the proportion o womenemployees in South Asia and sub-Saharan Arica is substantially less than that o men.
Altogether, we ound wage data or 115 out o the 177 countries and territories inour database, or 65 per cent o the total.14 However, since we have data or all the majoreconomies, the wage data cover 94 per cent o the world’s wage earners and approximately98.5 per cent o the global wage bill. As might be expected, there are large variations indata availability between regions. The database has ull coverage or the advanced coun-tries, or Central and Eastern Europe and or Eastern Europe and Central Asia. However,the database covers only 29 per cent o all Arican countries, although they account or57 per cent o the region’s total wage employment and approximately 76 per cent o itswage bill. This highlights the act that, although a great deal o data is available, signi-cant gaps remain in terms o wage statistics in many developing countries. While themost advanced countries carry out regular establishment surveys and specic surveys onthe structure o earnings, other countries collect wage data through labour orce surveysthat are implemented at irregular and unpredictable intervals. A number o low-incomecountries, particularly in Arica, do not collect any wage data at all.
13
Based on ILO, Key Indicators o the Labour Market (KILM) database, January 2010 update. For regionalgrouping see Technical appendix I.
14 Our database matches the countries included in the ILO’s KILM database. For details see Technical appendix I.
10
8
6
4
2
0
–2
–4
1 9 9 5
1 9 9 6
1 9 9 7
1 9 9 8
1 9 9 9
2 0 0 0
2 0 0 1
2 0 0 2
2 0 0 3
2 0 0 4
2 0 0 5
2 0 0 6
2 0 0 7
2 0 1 0
2 0 0 9
2 0 0 8
Emerging and developing economiesAdvanced economiesWorld
C h a n g e i n
G D P ( % )
Figure 1 The global recession and recovery, 1995–2010(year-on-year changes in GDP at constant prices, in per cent)
Source: IMF, World Economic Outlook database.

7/31/2019 Global Wage Report
http://slidepdf.com/reader/full/global-wage-report 20/139
3PART I Growth of average wages
Based on a broader dataset than in the past, our current report provides a globalestimate which reers to a weighted average growth rate o monthly wages. To avoidbias in our global and regional estimates, our report uses a methodology to adjust orresponse bias, which arises when non-responding countries have dierent character-istics rom those o responding countries. This standard methodology is explained indetail in Technical appendix I. It ensures that all regions are represented in the globalwage trend in proportion to their size, and that the global wage trend is not distorted bydierences in data availability between regions.
Results are shown in gure 2. Globally, we nd that real monthly wages grewat 2.8 per cent in 2007, 1.5 per cent in 2008 and 1.6 per cent in 2009. These guresare heavily infuenced by ocial wage statistics rom China. China’s ocial guresor wage growth (defated by the IMF consumer price index (CPI)) are 13.1 per centin 2007, 11.7 per cent in 2008 and 12.8 per cent in 2009. It should be noted, however,that ocial statistics on wage growth published in the China Yearbook o Statisticsreer only to “urban units”, which in practice cover mostly State-owned enterprises,collective-owned units and other types o companies linked to the State. An initial pilotsurvey o all enterprises conducted by China’s National Bureau o Statistics shows thataverage annual salaries in the private sector rose by only 6.6 per cent in 2009,15 which
15 “Dierent disparity”, China Daily, 24–25 July 2010. The same source highlights the act that average annualwages in the private sector in 2009 were also lower than in “urban units” (18,199 yuan versus 32,736 yuan).
3.0
2.5
2.0
1.5
1.0
0.5
0.02006
2.7
2.1
1.8
2007 20092008
Median valueGlobal wage growth (excluding China)Global wage growth
W a g e g r o w t h ( % )
2.8
2.2 2.2
1.5
0.8
1.2
1.6
0.7
1.6
Figure 2 Global wage growth, 2006–09 (year-on-year changes, real terms, in per cent)
Note: The global wage growth is calculated as a weighted average o actual or estimated year-on-year growth in real average monthly wages in 115 countries and
territories, covering 94 per cent o all employees in the world (see description o the methodology in Technical appendix I).
Source: ILO Global Wage Database.

7/31/2019 Global Wage Report
http://slidepdf.com/reader/full/global-wage-report 21/139
4 Global Wage Report 2010 / 11
may explain the discrepancy between the general perception o the situation and theocial gures and suggests that our global estimate may be an overestimate. Exclud-ing China rom the analysis results in much lower rates o global wage growth o 2.2per cent in 2007, 0.8 per cent in 2008 and 0.7 per cent in 2009 (see gure 2). 16
Restricting our sample to the G20 countries, which account or about 70 per cento the world’s wage earners, we nd very similar results (see gure 3). Including China
in the analysis, we estimate that average wages grew by 2.8 per cent in 2007, 1.5 percent in 2008 and 1.7 per cent in 2009 in G20 countries. Excluding China rom thegrouping, we would nd real wages growing at 1.8 per cent in 2007, 0.5 per cent in2008 and 0.5 per cent in 2009 in the remaining countries.
16 For the sake o comparability with our previous publications, we also report an estimation o a global wagetrend based on the median o the national wage trends or countries and territories included in our sample. The useo the median rather than the weighted average has the eect o limiting the infuence o outliers, such as errors inthe underlying national data or extremely high or extremely low growth rates o wages in particular countries. Themedian value must be interpreted as the value o wage growth which separates countries into two groups: hal being
countries with higher wage growth and the other hal countries with lower wage growth. We can observe that 50 percent o the countries and territories in our sample grew by less than 2.2 per cent in 2007, 1.2 per cent in 2008 and1.6 per cent in 2009.
3.0
2.5
2.0
1.5
1.0
0.5
0.02006
2.5
1.6
2007 20092008
G20 wage growth (excluding China)G20 wage growth
W a g e
g r o w t h ( % )
2.8
1.8
1.5
0.5
1.7
0.5
Figure 3 Wage growth in the G20, 2006–09 (year-on-year changes, real terms, in per cent)
Note: The wage growth is calculated as a weighted average o actual or estimated year-on-year growth in real average monthly wages in the 19 countries thatare members o the G20, i.e. Argentina, Australia, Brazil, Canada, China, France, Germany, India, Indonesia, Italy, Japan, Mexico, Russia, Saudi Arabia, South
Arica, the Republic o Korea, Turkey, the United Kingdom and the United States (see description o the methodology in Technical appendix I).
Source: ILO Global Wage Database.

7/31/2019 Global Wage Report
http://slidepdf.com/reader/full/global-wage-report 22/139
5PART I Growth of average wages
When interpreting these trends in average wages, it is important to note thatmonthly average wages can alter as a result o changes in either hourly wages or inthe number o hours worked, or both. Also, one should bear in mind that the use o aggregate wage data (as opposed to tracking a panel o individuals) gives rise to whatis known as a “composition eect”. This eect is acknowledged by national statis-tical oces across the world. So, or example, the Australian Bureau o Statisticsexplains in its publication o average weekly earnings17 that changes in averages maybe aected not only by changes in the level o earnings o individual employees, butalso by changes in the overall composition o the wage-earner segment o the labourorce. This can occur because o variations in the occupational distribution within
and across industries, variations in the distribution o employment between industriesor variations in the relative proportions o male and emale employees. Composi-tion eects may also occur as a result o variations in the proportion o ull-timeand part-time employees. A systematic bias, known as the “countercyclical bias”,arises as a result o the tendency or aggregate data to underestimate the downwardtrend in monthly wages during recessions and to underestimate the upward trend inwages during recoveries.18 This occurs when a majority o those who lose their jobsduring recessions are low paid (a phenomenon that mechanically increases the meano wages o those workers who remain employed) and when a recovery leads to therehiring o these low-paid workers (which, by contrast, mechanically decreases themean o wages).19
Notwithstanding these caveats, two observations can be made about globalwage trends. The rst observation is that wage growth has declined considerablyduring the crisis. However, even though overall wage growth has slowed downduring the crisis, we estimate that wage growth has remained positive throughoutthe crisis in 73 per cent o countries in 2008 and in 80 per cent o countries in 2009.The second observation is that real wage growth seems to have suered as much in2008, the rst year o the crisis, as in 2009, when the crisis was in ull swing. Whatis the explanation or this paradox? We suggest that the behaviour o infation during2008 and 2009 was a signicant contributory actor. For the purposes o illustration,gure 4 shows both nominal wage growth and infation in a sample o our largecountries. We see that, in 2008, nominal wages continued to grow almost as ast asin earlier years, but unusually high infation (due mainly to the spike in oil prices)eroded real wages. In contrast, in 2009, as GDP contracted and the crisis becamemore apparent to employers and workers, the growth in nominal wages declined,but infation ell at an even aster rate. These sharp declines in infation preventedthe all in real wages in 2009.
17 See, or example, Australian Bureau o Statistics (2009), explanatory notes 28 and 29.
18
See Solon et al. (1994), Peng and Siebert (2008, p. 571), Devereux and Hart (2006) or Bils (1985).19 The opposite is also possible i the crisis aected the employment o median and high-wage earners more thanlow-paid workers.

7/31/2019 Global Wage Report
http://slidepdf.com/reader/full/global-wage-report 23/139
6 Global Wage Report 2010 / 11
1.2 Regional estimates
There are considerable regional variations in the rates o wage growth. In advanced coun-tries,20 we estimate that, ater having grown at about 0.8 per cent per year beore the crisis,real wages actually ell by –0.5 per cent at the onset o the crisis in 2008, beore growingat a rate o 0.6 per cent in 2009 (see gure 5). Altogether, the level o real wages ell in 12o the 28 advanced countries in 2008 and in seven o the advanced countries in 2009.
Examples o countries which experienced negative wage growth in 2008 and/or2009 include some major G20 countries. In the United States, or example, the simpleannual average o real weekly earnings was 1.1 per cent lower in 2008 than in 2007,beore recovering and increasing by 1.5 per cent in 2009 compared with 2008. Figure 6illustrates the impact o prices on real earnings in the United States. We observe that,in 2008, the consumer price index or all urban consumers (CPI-U) increased relativelyquickly during the rst part o the year, thereby eroding the purchasing power o wagesin that period. The all in consumer prices during the last part o 2008 then provided aboost to real earnings (even though nominal earnings increased only modestly), whichexplains why the average level o real earnings was higher in 2009 than in 2008.
20 Note that our group o advanced countries is not identical to the IMF group o advanced economies and esti-mates should thereore not be directly compared; see Technical appendix I.
Nominal wages
4.0
3.0
3.5
2.5
2.0
1.5
1.0
0.5
0.02006 2007 20092008
P e r c
e n t
Inflation
Figure 4 Nominal wage growth and ination in our selected countries, 2006–09(in per cent)
Note: Infation and nominal wages are calculated as a population-weighted average (using the number o wage earners as population weight) or a sample o
our advanced countries (Canada, Germany, the United States and the United Kingdom).
Source: ILO Global Wage Database.

7/31/2019 Global Wage Report
http://slidepdf.com/reader/full/global-wage-report 24/139
7PART I Growth of average wages
18
10
12
14
16
8
6
4
2
0.50.9 0.8
-0.50.6
0
–2
–4
2000–05 2006 2007 2008 2009
W a g e g r o w t h ( %
)
Advanced countries Latin America and the Caribbean
Central and Eastern Europe Eastern Europe and Central Asia
18
10
12
14
16
8
6
4
2
5.3 6.26.6
4.6
-0.1
0
–2
–4
2000–05 2006 2007 2008 2009
W
a g e g r o w t h ( % )
18
10
12
14
16
8
6
4
2
15.1
13.4
17.0
10.6
-2.2
0
–2
–4
2000–05 2006 2007 2008
2009
W
a g e g r o w t h ( % )
18
10
12
14
16
8
6
4
2
0.4
4.2
3.3
1.9 2.2
0
–2
–4
2000–05 2006 2007 2008 2009
W a g e g r o w t h ( %
)
Figure 5 Regional wage growth, 2000–09 (in per cent p.a.)

7/31/2019 Global Wage Report
http://slidepdf.com/reader/full/global-wage-report 25/139
8 Global Wage Report 2010 / 11
18
10
12
14
16
8
6
4
2
3.2
1.9
0.5
1.6 1.8**
0
–2
–4
2000–05 2006 2007 2008 2009
W a g e g r o w t h ( % )
18
10
12
14
16
8
6
4
21.3*
2.8*
1.4*
0.5**
2.4**
0
–2
–4
2000–05 2006 2007 2008 2009
W a g e g r o w t h ( % )
Asia Africa
Asia (without China)
18
10
12
14
16
8
6
4
2
0.3-0.1
0.4**(..) (..)
0
–2
–4
2000–05 2006 2007 2008 2009
W a g e g r o w t h ( % )
Middle East
18
10
12
14
16
8
6
4
2
7.8 7.6
7.2 7.1
8.0*
0
–2
–4
2000–05 2006 2007 2008 2009
W a g e g r o w t h ( % )
Figure 5 Regional wage growth, 2000–09 (in percentages p.a.) (continued)
* Provisional estimates (based on coverage o ca. 75 per cent). ** Tentative estimates (based on coverage o ca. 40 per cent to ca. 60 per cent). (..) = No estimate
available.
Note: See Technical appendix I or inormation on regional classications and methodology.
Source: ILO Global Wage Database.

7/31/2019 Global Wage Report
http://slidepdf.com/reader/full/global-wage-report 26/139
9PART I Growth of average wages
Figure 7 presents inormation on real wage growth or our selected industrializedcountries. We see that New Zealand maintained positive real wage growth throughout thecrisis. By contrast, in the United Kingdom, weekly pay rates held their ground in 2008,but nominal pay rose by less than the CPI in 2009, leading to a decline in real terms. InJapan, a all in real wages o nearly –2.0 per cent in both 2008 and 2009 renewed concerns
about wage and price defation. For the sake o comparison, gure 7 also includes Iceland,which was perhaps most adversely aected by the crisis in 2009, and where it can be seenthat real wages collapsed. Inormation rom available countries suggests that, usually,wages suered more in the private sector than in the public sector (see box 1).
In general, shorter work weeks seem to have played an important role in damp-ening wage growth in advanced countries. Figure 8 shows that the average numbero hours worked, or paid, per week decreased between 2007 and 2009 in almostall countries or which such data were available. This occurred either as a resulto company-level arrangements, such as in the United States, where the decline inweekly earnings between February 2009 and February 2010 was the result o bothalling hourly wages and shorter working time,21 or was one measure within broader
21 US Department o Labor, BLS (2010).
115
110
105
100
95
90
2006
M a r J u
n S e
p D e
c M a r J u
n S e
p D e
c M a r J u
n S e
p D e
c M a r J u
n S e
p D e
c M a r
2007 20102008 2009
Prices (CPI-U)Nominal earnings Annual averageReal earnings
A v e r a g e w e e k l y e a r n i n
g s ( M a r c h 2 0 0 6 = 1 0 0 )
Figure 6 Index o nominal and real average weekly earnings in the United States(all non-arm employees), March 2006 to March 2010 (March 2006 = 100)
Note: Nominal earnings reer to average weekly earnings or all employees rom the Current Employment Statistics survey. Real earnings or all employees is
calculated using the 1982–84 based consumer price index or all urban consumers (CPI-U). The annual average is not an ocial series and was calculated as
the simple annual average o real weekly earnings.
Source: US Bureau o Labor Statistics (BLS) and authors’ calculations.

7/31/2019 Global Wage Report
http://slidepdf.com/reader/full/global-wage-report 27/139
10 Global Wage Report 2010 / 11
8
6
4
2
0
–2
–4
–6
–8
–10Iceland New Zealand JapanUnited Kingdom
200920082007
W a g e g r o w t h ( % )
Figure 7 Wage growth in selected advanced countries, 2007–09 (in per cent)
Note: Wage growth reers to year-on-year growth in real average monthly wages.
Source: ILO Global Wage Database.
–1 –0.8 –0.6 –0.4 –0.2 0 0.2 0.4 0.6
Malta
Singapore
Norway
Republic of Korea
United Kingdom
Sweden
New Zealand
Spain
United States
Germany
Canada
Change in weekly hours
Figure 8 Weekly hours worked or paid in selected advanced countries, 2007–09(changes in weekly hours)
Source: ILO Global Wage Database.

7/31/2019 Global Wage Report
http://slidepdf.com/reader/full/global-wage-report 28/139
11PART I Growth of average wages
schemes known as “work sharing”, which promote a reduction in working time inorder to avoid lay-os by redistributing a reduced volume o work.22 In Germany,or example, monthly real wages o all employees ell or three consecutive years,including 2009, when monthly nominal wages ell or the rst time in the country’s
22 In such schemes, the reduction in working hours is oten coupled with proportional reductions in wages. Dependingon the countries involved, the reduction in wages may be compensated (at least partially) through wage subsidiesrom general government revenues or through partial unemployment compensation. See Messenger (2009).
Box 1 Wages in the public and the private sectors
It is still too early to know precisely which sectors and which occupations have been most aected by
the crisis, as too ew countries have published data on the structure o wages. The principal source
o such data at the international level, the ILO’s “October Inquiry”, is being revised to capture trends
in occupational wages: in particular, a wide consultation is seeking to determine the most relevant
industries and occupations or which labour market variables are to be collected globally, and the
units in which these variables should be reported. The consultation seeks to take into account the
signifcant dierences in industry structures and stafng patterns in dierent economies around the
world by consulting with experts rom a wide range o developing and developed countries.
In the meantime, country-specic data nevertheless suggest that wages may have been moreadversely aected in the private sector than in the public sector. According to calculations by
the Public Services International Research Unit, largely based on Eurostat’s Labour Cost Index
dataset, nominal earnings in the public sector have risen aster – or allen less – than earnings in
the private sector in 11 out o 18 European countries or which data are available. The same is
true in the United States, where, in the two-year period rom March 2008 to March 2010, private
sector workers were ound to have experienced a slower rise in earnings than state and municipal
workers. Preliminary data or 2010 suggest, however, that this trend may be reversed in some o
the countries that have implemented austerity measures to contain public debt and/or which have
signed recent agreements with the IMF.
The more robust nature o public sector wages is probably linked to the higher level o unionization
in the public sector than in the private sector, and also to a higher degree o coordination amongpublic sector employees. At the same time, the evolution o the public sector to private sector wage
ratio also refects some sector-specic actors. In the United States, or example, during the past
two years pay has risen aster than average in the education and health sectors, in both the public
and the private sectors. By contrast, wage growth in the nancial sector – which had outpaced
average wage growth beore the crisis – has allen behind in recent quarters. In Europe, too, wages
and salaries in nancial services grew more slowly than the general movements in wages. In the
United Kingdom, or instance, nominal gross average weekly pay increased by an average o 1.6
per cent in 2009, compared to 1.4 per cent in nancial and insurance activities, –0.4 per cent in
manuacturing and –3.5 per cent in accommodation and ood service activities.1 Also, UK bonus
payments declined sharply by more than 25 per cent during the rst year o the crisis to £19 billion
at the end o 2008/early 2009, beore climbing back to £22 billion one year later.
Note: 1 See http://www.statistics.gov.uk/StatBase/Product.asp?vlnk=15313
Source: Based on Hall et al. (2010).

7/31/2019 Global Wage Report
http://slidepdf.com/reader/full/global-wage-report 29/139
12 Global Wage Report 2010 / 11
post-war history.23 This decline was largely due to a reduction in working hours topreserve jobs (as emphasized in Part II, box 6 o this report). Restricting the sampleto ull-time workers shows monthly real wage growth in Germany to be 0 per cent in2008 and 0.8 per cent in 2009.24
The sharpest declines in real wage growth appear to be ound in Eastern Europeand Central Asia, where – according to ocial gures – real wage growth ell roman average o about 17.0 per cent in 2007 to 10.6 per cent in 2008 and to –2.2 percent in 2009.25 Real wage growth has also allen in Central and Eastern Europe, rom6.6 per cent in 2007 to 4.6 per cent in 2008 and –0.1 per cent in 2009. Figure 9 showssome country examples rom these regions. We see that, in the Russian Federation and
the Ukraine, which have large populations, wage trends refected the severe economiccontraction in 2009. While Poland was able to maintain positive wage growth, Hungaryillustrates a case where the combination o an infation rate o 4 per cent and massivenominal wage reezes eroded the purchasing power o wages in 2009.
In contrast, wages have held up better in other regions. In Asia, the crisis is barelynoticeable in our weighted average. Real wages in Asia have grown in excess o 7 percent throughout the period 2006–09, with rates o 7.2 per cent in 2007 to 7.1 per centin 2008 and 8.0 per cent in 2009. As in the case o our global estimate, this regionaltrend is heavily infuenced by China, which accounts or more than hal o total wageemployment in the region. These regional gures, however, must be balanced againstthe experience o other countries, such as Thailand, Malaysia or the Philippines, which
were much more adversely aected by the global economic crisis and where real wagesactually ell during the crisis (see gure 10).In Latin America and the Caribbean, it is estimated that real wage growth slowed
rom 3.3 per cent in 2007 to 1.9 per cent in 2008 and 2.2 per cent in 2009. Figure 11shows that this regional pattern strongly refects the pattern o wage growth in Brazil,which accounts or almost 39 per cent o the region’s wage earners. Chile and Uruguayalso seem to have weathered the crisis relatively unscathed. In contrast, some o theCaribbean countries, such as Jamaica, experienced large wage declines in 2008.
Finally, we also provide some provisional and tentative estimates or Arica and theMiddle East, which are based on a weaker data set (see gure 5 and database coveragein Technical appendix I). In Arica, we provisionally estimate that, in 2007, real monthlywages grew at about 1.4 per cent – similar to the average wage growth during 2000–05.During the past two years, we tentatively estimate that wage growth ell to 0.5 per cent in2008 beore rebounding to 2.4 per cent in 2009. Figure 12 illustrates wage trends in twocountries with data rom establishment surveys (South Arica and Botswana). In general,however, wage data remains a challenge in Arica and technical cooperation work is plannedto gradually increase both the quantity and quality o wage data over time (see box 2).
23 Federal Statistical Oce o Germany (2010).
24 Quarterly earnings survey.
25 As highlighted in our previous Global Wage Report 2008/09 (ILO 2008a, p. 13), ast wage growth prior to thecrisis in countries o the Commonwealth o Independent States (CIS) was an intrinsic part o the recovery process
that ollowed the collapse in wages which took place in the early stage o economic transition at the beginning o the 1990s. In addition, employment growth in the CIS countries was relatively weak in the years beore the crisis, sothat GDP growth was driven mainly by productivity gains, which, in turn, allowed or wage growth (see gure 13).
7/31/2019 Global Wage Report
http://slidepdf.com/reader/full/global-wage-report 30/139
13PART I Growth of average wages
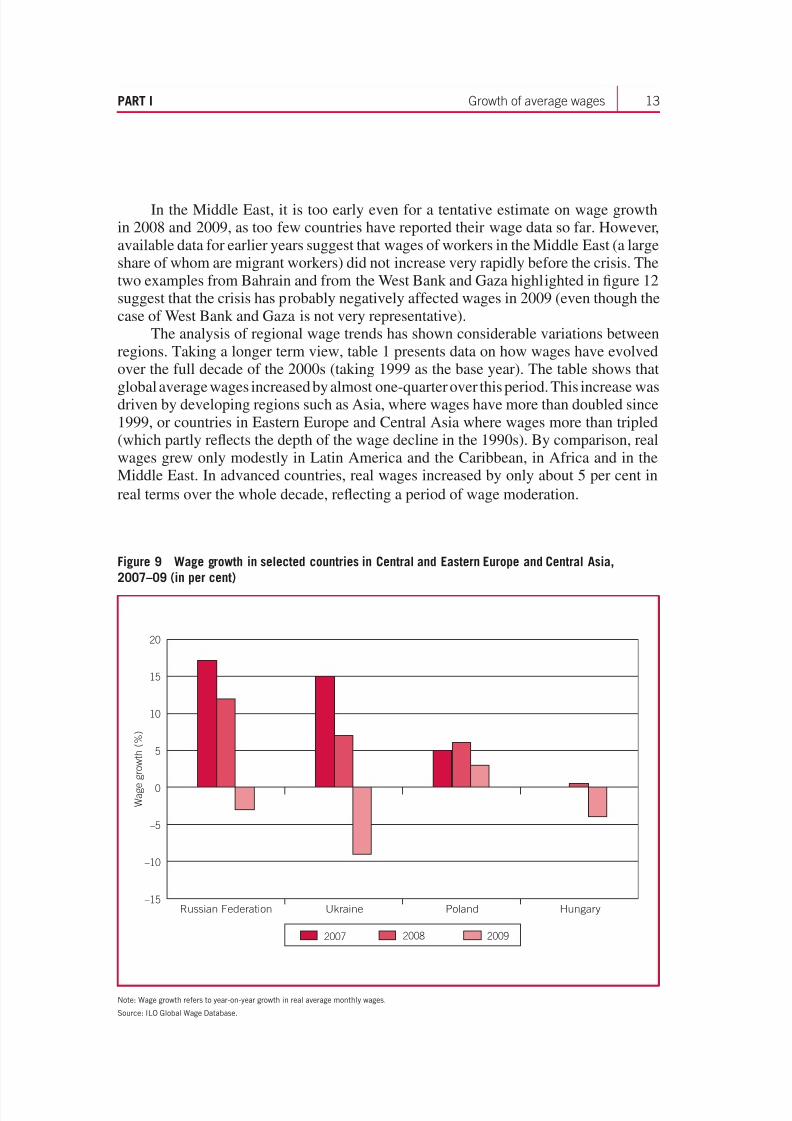
In the Middle East, it is too early even or a tentative estimate on wage growthin 2008 and 2009, as too ew countries have reported their wage data so ar. However,available data or earlier years suggest that wages o workers in the Middle East (a largeshare o whom are migrant workers) did not increase very rapidly beore the crisis. Thetwo examples rom Bahrain and rom the West Bank and Gaza highlighted in gure 12suggest that the crisis has probably negatively aected wages in 2009 (even though thecase o West Bank and Gaza is not very representative).
The analysis o regional wage trends has shown considerable variations betweenregions. Taking a longer term view, table 1 presents data on how wages have evolvedover the ull decade o the 2000s (taking 1999 as the base year). The table shows that
global average wages increased by almost one-quarter over this period. This increase wasdriven by developing regions such as Asia, where wages have more than doubled since1999, or countries in Eastern Europe and Central Asia where wages more than tripled(which partly refects the depth o the wage decline in the 1990s). By comparison, realwages grew only modestly in Latin America and the Caribbean, in Arica and in theMiddle East. In advanced countries, real wages increased by only about 5 per cent inreal terms over the whole decade, refecting a period o wage moderation.
20
15
10
5
0
–5
–10
–15Russian Federation Ukraine HungaryPoland
200920082007
W a g e
g r o w t h ( % )
Figure 9 Wage growth in selected countries in Central and Eastern Europe and Central Asia,
2007–09 (in per cent)
Note: Wage growth reers to year-on-year growth in real average monthly wages.
Source: ILO Global Wage Database.

7/31/2019 Global Wage Report
http://slidepdf.com/reader/full/global-wage-report 31/139
14 Global Wage Report 2010 / 11
8
6
4
2
0
–2
–4
–6
–8
–10Brazil Jamaica ChileUruguay
200920082007
W a g e g r o w
t h ( % )
Figure 11 Wage growth in selected countries in Latin America and the Caribbean, 2007–09 (in per cent)
Note: Wage growth reers to year-on-year growth in real average monthly wages.
Source: ILO Global Wage Database.
16
14
12
10
8
6
4
2
0
–2
–4
–6China Thailand MalaysiaPhilippines
200920082007
W a g e g r o w t h ( % )
Figure 10 Wage growth in selected countries in Asia, 2007–09 (in per cent)
Note: Wage growth reers to year-on-year growth in real average monthly wages.
Source: ILO Global Wage Database.

7/31/2019 Global Wage Report
http://slidepdf.com/reader/full/global-wage-report 32/139
15PART I Growth of average wages
8
6
4
2
0
–2
–4
–6
–8
–10Botswana South Africa West Bank and GazaBahrain
200920082007
W a g e g r o w t h
( % )
Figure 12 Wage growth in selected countries and territories in Arica and the Middle East,2007–09 (in per cent)
Note: Wage growth reers to year-on-year growth in real average monthly wages.
Source: ILO Global Wage Database.
Table 1 Cumulative wage growth, by region since 1999 (1999 = 100)
1999 2006 2007 2008 2009
Advanced countries 100 104.2 105.0 104.5 105.2
Central and Eastern Europe 100 144.8 154.4 161.4 161.3
Eastern Europe and Central Asia 100 264.1 308.9 341.6 334.1
Asia 100 168.8 180.9 193.8 209.3*
Latin America and the Caribbean 100 106.7 110.3 112.4 114.8
Arica 100 111.2* 112.8* 113.4** 116.1**
Middle East 100 101.9* 102.4* … …
World 100 115.6 118.9 120.7 122.6
* Provisional estimate. ** Tentative estimate. … = No estimate available.
Note: For coverage and methodology, see Technical appendix I.
Source: ILO Global Wage Database.

7/31/2019 Global Wage Report
http://slidepdf.com/reader/full/global-wage-report 33/139
16 Global Wage Report 2010 / 11
Box 2 Wage growth in Arica
Ater two decades o stagnation, and beore the outbreak o the global nancial crisis in 2008, eco-
nomic indicators in Arica improved considerably. From about 2004, sub-Saharan Arica constantly
outperormed the more advanced economies, achieving annual growth rates o around 6.5 per cent
over the period 2004–08 compared with a world average o around 4.5 per cent. Given the ast
increase in the population, this has translated into growth in GDP per capita o about 4.3 per cent
per year in sub-Saharan Arica. The global economic and nancial crisis has slowed growth in this
subregion to 2.1 per cent in 2009.1
How have these trends aected wage growth? While the Globl Wge repo 2008/09 did not
include much data at all rom Arica, a substantial eort has been made since then to collect wage
statistics rom national statistical oces in sub-Saharan Arica and collate them into the ILO Global
Wage Database. Two major stocktaking exercises have been carried out in the context o two sub-
regional workshops on the use o labour market indicators in policy-making, hosted by the ILO in
Addis Ababa in July 2009 and in Dakar in December 2009,2 in which a total o 25 Arican coun-
tries participated. Available data sources in these countries are highlighted in table B1.
Table B1 Sources o employment-related income data in Arica
Country Mid-1990s
or beore
Mid-1990s/
early 2000
Latest year Source
Household surveys
Benin – 2000/01 2007/08 Enquête ménages
[Household survey]
Botswana 1984/85 1995/96 2005/06 Labour orce survey
Burkina Faso – 2003 2007 Enquête emploi
[Labour orce survey]
Burundi – – 2006/07/08 Enquête 1-2-3 [Survey 1-2-3]
Cameroon – 2001 2007 Enquête ménages
[Household survey]
Congo, Dem.
Rep. o
– – –
Côte d’Ivoire 1998 2002 2008 Enquête niveau de vie
[Standard o living survey]Ethiopia – 1999/2000 2005 Labour orce survey
Gabon – – –
Ghana 1992 1998 2006 Household survey
Liberia – – 2007 Labour orce survey
Madagascar – 2001 2005 Enquête ménages
[Household survey]
Malawi 1998 2004/05 2009 Household survey
Mali – 2004 2007 Enquête ménages
[Household survey]
Namibia 1993/94 – 2003/04 Household survey
Niger – – –
(continued)
7/31/2019 Global Wage Report
http://slidepdf.com/reader/full/global-wage-report 34/139
17PART I Growth of average wages
Country Mid-1990s
or beore
Mid-1990s/
early 2000
Latest year Source
Nigeria – 2003/04 – Living standard survey
Rwanda – 2000/01 2005/06 Household survey
Senegal 1994/95 2001/02 2005/06 Enquête ménages
[Household survey]
Sierra Leone – – –
South Arica – 2001 2007 Labour orce survey
Somalia – – –
Tanzania, UnitedRep. o
1990/91 2000/01 2006 Labour orce survey
Tanzania
(Zanzibar)
– – –
Togo – – –
Uganda – 2002/03 2005/06 Labour orce survey
Zambia 1986 2005/06 2008 Labour orce survey
Establishment surveys
Country Frequency Source
Botswana Quarterly Survey o employment and employees
South Arica Quarterly Quarterly employment statistics
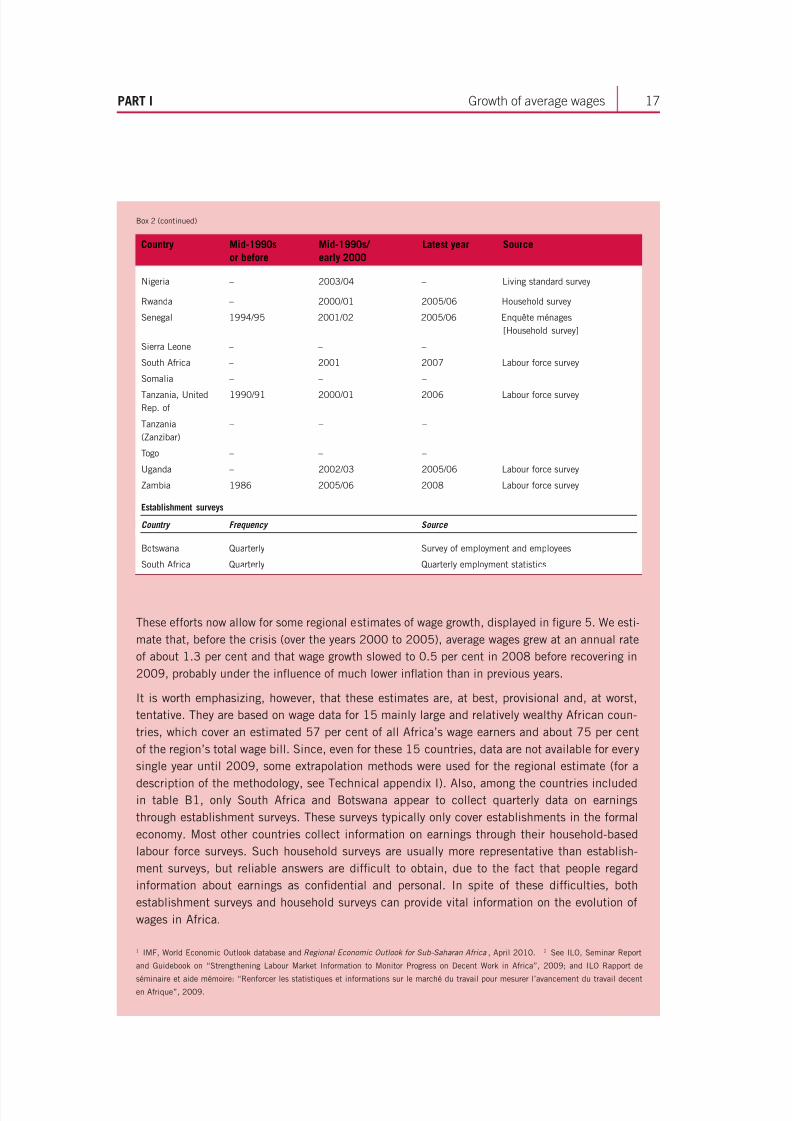
These eorts now allow or some regional estimates o wage growth, displayed in gure 5. We esti-
mate that, beore the crisis (over the years 2000 to 2005), average wages grew at an annual rate
o about 1.3 per cent and that wage growth slowed to 0.5 per cent in 2008 beore recovering in
2009, probably under the infuence o much lower infation than in previous years.
It is worth emphasizing, however, that these estimates are, at best, provisional and, at worst,
tentative. They are based on wage data or 15 mainly large and relatively wealthy Arican coun-
tries, which cover an estimated 57 per cent o all Arica’s wage earners and about 75 per cent
o the region’s total wage bill. Since, even or these 15 countries, data are not available or every
single year until 2009, some extrapolation methods were used or the regional estimate (or a
description o the methodology, see Technical appendix I). Also, among the countries includedin table B1, only South Arica and Botswana appear to collect quarterly data on earnings
through establishment surveys. These surveys typically only cover establishments in the ormal
economy. Most other countries collect inormation on earnings through their household-based
labour orce surveys. Such household surveys are usually more representative than establish-
ment surveys, but reliable answers are dicult to obtain, due to the act that people regard
inormation about earnings as condential and personal. In spite o these diculties, both
establishment surveys and household surveys can provide vital inormation on the evolution o
wages in Arica.
1 IMF, World Economic Outlook database and regionl Economic Outlook fo Sub-Shn afic , April 2010. 2 See ILO, Seminar Report
and Guidebook on “Strengthening Labour Market Inormation to Monitor Progress on Decent Work in Arica”, 2009; and ILO Rapport de
séminaire et aide mémoire: “Renorcer les statistiques et inormations sur le marché du travail pour mesurer l’avancement du travail decenten Arique”, 2009.
Box 2 (continued)

7/31/2019 Global Wage Report
http://slidepdf.com/reader/full/global-wage-report 35/139
18 Global Wage Report 2010 / 11
1.3 Average wages and productivity
The decline in global wage growth documented in the previous section is hardly surpris-ing in light o the decline in labour productivity during the crisis. Figure 13 illustrates thedecline in the growth o labour productivity – measured as GDP per person employed26 – inthe dierent regions o the world. We see that, parallel to the decline in GDP growth, theglobal economic crisis o 2008 and 2009 also led to a decline in labour productivity in allregions, apart rom Asia. This lower level o labour productivity highlights the reducedcapacity o companies to pay higher salaries. Indeed, when the demand or goods and serv-ices alls, the output per worker can only be maintained i companies reduce employmentproportionally to the decline in demand. I companies keep their workers on the payroll,
lower labour productivity will have to be refected in lower prots, lower compensation o workers or a combination o the two. Nonetheless, many companies did lay o workers,resulting in higher unemployment, particularly in advanced economies and in trade-depend-ent economies. Yet, overall in the countries analysed, declines in GDP outpaced declines inemployment during the 2008–09 period, resulting in declining labour productivity.
The link between changes in average wages and changes in labour productivity isillustrated in gure 14. We see that, although there is wide cross-country variation, thereis a generally positive relationship between labour productivity growth and real wagegrowth. Most countries which experienced declines in real wages during 2008 or 2009also suered declines in labour productivity (the lower let corner o gure 14), while amajority o countries with increasing labour productivity also had increasing wages (the
upper right corner o the gure). It is interesting to note, however, that in a considerablenumber o countries, real wages increased in spite o alling productivity (the upper letcorner), which shows that there is no inevitable short-term link between wages and labourproductivity. However, statistical analysis shows that, in advanced countries, changes inproductivity and changes in infation rates, when considered together, account or abouthal o the cross-country variation in wage growth in 2008 and 2009.27
2 The wage share
How have the trends in average wages discussed in the previous section infuenced the wageshare during the crisis? This section o the report examines the “labour income share” orthe “wage share”; its analysis is restricted to the largest consistent dataset available, whichcovers 30 OECD Member countries and Estonia.28 Most requently, the “unadjusted” wage
26 While there are a number o dierent ways to measure labour productivity, they all dene economic output in relation to
labour input (see OECD, 2001). In line with the United Nation’s Millennium Development Goals, this report uses GDP per
person employed as a simple measure o labour productivity. While more rened approaches that adjust or hours worked
are oten useul or single-country studies (see, or example, the labour productivity gures published by the United States
Bureau o Labor Statistics at www.bls.gov/lpc/), our simple measure is better suited or studies such as the Global Wage
Report that cover a large number o countries, or many o which no reliable data on hours worked are available.
27 This conclusion is based on the ollowing regression: real wage growth = a + (b x labour productivity growth) + (c x
infation), which yields a coecient b o 0.45, a coecient c o –0.47 and an adjusted R2 o 0.48.
28 All data used in this analysis draw upon the OECD Database or STructural ANalysis (www.oecd.org/sti/stan) andthe OECD System o National Accounts (www.oecd.org/std/ana). Chile, Israel and Turkey have been excluded rom the
analysis due to a lack o data.

7/31/2019 Global Wage Report
http://slidepdf.com/reader/full/global-wage-report 36/139
19PART I The wage share
10
8
6
4
2
0
–2
–4
–6 –6
–6 –6
2 0 0 0
2 0 0 1
2 0 0 6
2 0 0 5
2 0 0 4
2 0 0 3
2 0 0 2
2 0 0 7
2 0 0 8
2 0 0 9
G r o w t h ( % )
Employment
Real GDP
Labour productivity
10
8
6
4
2
0
–2
–4
2 0 0 0
2 0 0 1
2 0 0 6
2 0 0 5
2 0 0 4
2 0 0 3
2 0 0 2
2 0 0 7
2 0 0 8
2 0 0 9
G r o w t h ( % )
Employment
Real GDP
Labour productivity
10
8
6
4
2
0
–2
–4
2 0 0 0
2 0 0 1
2 0 0 6
2 0 0 5
2 0 0 4
2 0 0 3
2 0 0 2
2 0 0 7
2 0 0 8
2 0 0 9
G r o w t h ( %
)
Employment
Real GDP
Labour productivity
10
8
6
4
2
0
–2
–4
2 0 0 0
2 0 0 1
2 0 0 6
2 0 0 5
2 0 0 4
2 0 0 3
2 0 0 2
2 0 0 7
2 0 0 8
2 0 0 9
G r o w t h ( %
)
Employment
Real GDP
Labour productivity
World Advanced countries
Central and Eastern Europe Eastern Europe and Central Asia
Figure 13 Regional growth in GDP, employment and labour productivity, 2000–09(in per cent)

7/31/2019 Global Wage Report
http://slidepdf.com/reader/full/global-wage-report 37/139
20 Global Wage Report 2010 / 11
10
8
6
4
2
0
–2
–4
–6 –6
–6 –6
2 0 0 0
2 0 0 1
2 0 0 6
2 0 0 5
2 0 0 4
2 0 0 3
2 0 0 2
2 0 0 7
2 0 0 8
2 0 0 9
G r o w t h ( % )
Employment
Real GDP
Labour productivity
10
8
6
4
2
0
–2
–4
2 0 0 0
2 0 0 1
2 0 0 6
2 0 0 5
2 0 0 4
2 0 0 3
2 0 0 2
2 0 0 7
2 0 0 8
2 0 0 9
G r o w t h ( % )
Employment
Real GDP
Labour productivity
10
8
6
4
2
0
–2
–4
2 0 0 0
2 0 0 1
2 0 0 6
2 0 0 5
2 0 0 4
2 0 0 3
2 0 0 2
2 0 0 7
2 0 0 8
2 0 0 9
G r o w
t h ( % )
Employment
Real GDP
Labour productivity
10
8
6
4
2
0
–2
–4
2 0 0 0
2 0 0 1
2 0 0 6
2 0 0 5
2 0 0 4
2 0 0 3
2 0 0 2
2 0 0 7
2 0 0 8
2 0 0 9
G r o w
t h ( % )
Employment
Real GDP
Labour productivity
Asia Latin America and the Carribean
Africa Middle East
Figure 13 Regional growth in GDP, employment and labour productivity, 2000–09(in per cent) (continued)
Source: ILO calculations based on GDP data rom the World Bank (GDP in constant 2005 purchasing power parity (PPP)$) and employment data rom the ILO’s
KILM database (ILO, 2009a, table 2a).

7/31/2019 Global Wage Report
http://slidepdf.com/reader/full/global-wage-report 38/139
21PART I The wage share
share is measured as the ratio o the total compensation o employees to gross value added(the latter being a measure o total output), both measured in nominal terms, which canbe calculated rom national accounts. By highlighting the amount o income accruing topaid labour (as opposed to capital), the share o labour compensation in national outputcan shed light on various issues o interest, including the extent to which economic growthtranslates into higher incomes or workers. In periods o economic recession, the wageshare provides an indication o the extent to which alling output reduces labour incomes
relative to prots. I labour incomes all at a greater rate than prots, the wage share will beexpected to all. By contrast, i there is a sharper decline in prots than in labour incomes,the wage share will rise. For any given level o value added and prots, the wage share canall as a result o alling wage employment, alling wages or a combination o both.
While the concept o the wage share may appear to be straightorward, there ismuch debate on the implications o this “crude” measure. In particular, standard meas-ures o employee compensation in national accounts (i.e. wages plus salaries and socialcontributions paid by the employer) omit the labour income o the sel-employed. Assuch, the “unadjusted” wage share ignores the labour income o proprietors o their ownbusinesses. In countries or sectors where there is a high proportion o sel-employmentin total employment,29 the exclusion o sel-employed workers can cause a signicant
29 This is oten the case in the agriculture, hunting, orestry and shing and construction sectors o the economy.
–15 –10
45°
–5 0 5 10 2015
–15
–10
–5
0
5
10
20
15
Labour productivity growth (%)
R e a l w a g e
g r o w t h ( % )
Figure 14 Wages and productivity during the crisis, 2008–09 (in per cent)
Note: Figure reers to 94 countries and economies or which data are available.
Source: ILO Global Wage Database.

7/31/2019 Global Wage Report
http://slidepdf.com/reader/full/global-wage-report 39/139
22 Global Wage Report 2010 / 11
underestimation o the actual share o national income which rewards workers. Techni-cal appendix II provides more detail on the measurement o the wage share and possiblemethods o taking into account the sel-employed, highlighting both positive elementsand drawbacks and limitations o each method. Technical appendix II also shows that thetrends do not change signicantly when dierent adjustments are applied. Consequently,the analysis that ollows ocuses on the trends rather than on the values o wage shares.
2.1 Recent trends in national wage shares
Table 2 shows the trends in the unadjusted wage share or all the countries included inour analysis.30 In order to capture changes in the “real economy”, the gures displayedin this table concern the whole economy with the exclusion o nancial intermediation,real estate, renting and other business services. In addition, the share o wage employ-ment in total employment is provided as complementary inormation or all countries.A high share o wage employment (e.g. 80 per cent and above, as is the case in mostOECD countries) implies that the measurement issues related to the estimation o wageshare o own-account workers are not a major concern or the country under analysis.Based on this table, we see that, during the years o the global economic crisis, the wageshare has demonstrated a clear upward trend. Table 2 shows that most o the countriesreporting data or 2009 experienced an increase in the wage share o output rom 2008to 2009. This nding o an increasing wage share during periods o economic contrac-tion is consistent with ndings rom previous studies showing that fuctuations o thewage share in the short term are usually countercyclical (i.e. decreasing during expan-sions and increasing during recessions).31 These ndings point towards the act that,during the crisis, prots were more volatile than the total wage bill.
Another observation is the contrast between the evolution o the wage share duringthe years o the global economic crisis and the long-term trends. Table 2 shows that,or the countries included in this analysis, there was a predominantly negative long-term trend in the wage share. Overall, or the period 1980–2007, 17 out o 24 countriesregistered a alling wage share. The table also shows that, since 1980 and in the yearspreceding the crisis, the proportion o countries with a stable or decreasing wage sharewas consistently higher than the proportion o countries that experienced an increas-ing trend. However, the downward trend was by no means universal. For example,
during the period 2000–07, about one-third o the countries in our sample registered anincrease in the wage share. This disparity is also observed at the regional level, althoughthere are more common patterns within the EU15 than in the OECD area as a whole.Note also the countries (such as Iceland, Ireland and Mexico) with extremely volatilewage shares, as opposed to the group o economies with relatively stable wage shares(including the Czech Republic, France, Japan, Switzerland and the United States).
What are the explanations or these trends? In the short run, labour hoarding isoten considered to be a major actor in the countercyclical pattern o the wage share.Labour hoarding reers to the act that companies preer to retain skilled workers
30
For the remainder o this analysis, the term “wage share” will reer to the unadjusted wage share, unless other-wise specied.
31 See Krueger (1999) or Russell and Duour (2007).

7/31/2019 Global Wage Report
http://slidepdf.com/reader/full/global-wage-report 40/139
23PART I The wage share
T a
b l e 2
T h e w a g e s
h a r e
i n O E C D c o u n
t r i e s
o r
t h e r e a
l e c o n o m y
C o u n t r y
g r o u p i n
g
C o u n
t r y a n
d l a s
t
a v a
i l a b l e y e a r
W a g e s h a r e ( W S ) i n t o t a l i n c o m e
T r e n
d s
i n w a g
e s
h a r e
( W S ) 3
V o l a
t i l i t y o
W S
S h a r e o f w a g e
e m p l o y e e s i n t o t a l
e m p l o y m e n t
( a v e r a g e o v e r 2 0 0 0 s )
A v e
r a g e
1 9 8
0 –
8 5
A v e r a g e
2 0 0 4 – 0 7
A v e r a g e
2 0 0 8 –
0 9
1 9 8 0 s
1 9 9 0 s
2 0 0 0 – 0 7
2 0 0 8
2 0 0 9
C o e
f c
i e n
t
o v a r i a
t i o n
2
E U 1 5
A u s t r i a
2 0 0 9
6 4 . 4
6 0 . 6
6 1 . 3
❍
❍
➘
❍
➚
2 . 8
8 3 . 9
B e l g i u m
2 0 0 9
6 6 . 4
6 5 . 2
6 7 . 9
➘ ➘
❍
➘
➚
➚
2 . 6
8 7 . 3
D e n m a r k
2 0 0 9
6 9 . 0
6 9 . 4
7 4 . 7
❍
❍
❍
➚
➚
2 . 8
9 3 . 9
F i n l a n d
2 0 0 9
6 3 . 2
6 1 . 1
6 5 . 3
➚
➘ ➘
❍
➚
➚
4 . 8
8 8 . 9
F r a n c e
2 0 0 9
6 8 . 2
6 6 . 2
6 6 . 5
➘ ➘
❍
❍
❍
…
2 . 0
9 0 . 3
G e r m a n y
2 0 0 9
7 1 . 4
6 5 . 5
6 6 . 2
❍
➘
➘ ➘
❍
➚
3 . 4
8 9 . 9
G r e e c e 1
2 0 0 9
3 2 . 4
3 8 . 8
3 9 . 8
❍
➚
❍
❍
➚
7 . 6
…
I r e l a n d 1
2 0 0 9
5 9 . 4
4 5 . 9
4 8 . 5
➘ ➘
➘ ➘
➚
➚
❍
1 0 . 5
8 2 . 4
I t a l y
2 0 0 9
5 5 . 4
5 3 . 0
5 5 . 5
➘
➘
➚
➚
➚
3 . 4
7 6 . 5
L u x e m b o u r g 1
2 0 0 9
5 4 . 9
5 0 . 3
5 0 . 5
➘
➘ ➘
➘ ➘
❍
➚
5 . 8
9 3 . 5
N e t h e r l a n d s
2 0 0 9
6 1 . 9
5 8 . 4
5 9 . 7
➘
❍
➘
❍
➚
2 . 7
8 5 . 2
P o r t u g a l 1
2 0 0 6
5 6 . 0
5 7 . 9
5 8 . 0
➘ ➘
❍
❍
❍
…
3 . 5
8 0 . 6
S p a i n
2 0 0 9
5 6 . 4
5 7 . 4
5 7 . 8
➘ ➘
❍
❍
❍
❍
3 . 5
8 5 . 4
S w e d e n
2 0 0 9
7 5 . 8
6 9 . 0
6 8 . 7
➘
➘ ➘
➘
❍
➚
4 . 2
9 4 . 5
U n i t e d K i n g d o m
2 0 0 8
6 4 . 3
6 6 . 9
6 6 . 6
➘
➘
❍
❍
…
3 . 0
8 6 . 2
R e c e n
t E U
m e m
b e r s
C z e c h R e p u b l i c
2 0 0 8
…
4 9 . 9
5 1 . 2
…
❍
❍
➚
…
1 . 8
8 3 . 7
E s t o n i a
2 0 0 8
…
5 7 . 4
6 4 . 0
…
➘
➚
➚
…
6 . 9
…
H u n g a r y
2 0 0 8
…
5 8 . 2
5 8 . 2
…
➘ ➘
❍
❍
…
6 . 6
8 7 . 6
P o l a n d
2 0 0 8
…
4 3 . 6
4 5 . 8
…
➚
➘ ➘
➚
…
5 . 8
7 3 . 1
S l o v a k i a
2 0 0 9
…
4 3 . 6
4 4 . 0
…
➚
➘ ➘
❍
➚
6 . 1
…
S l o v e n i a
2 0 0 8
…
6 1 . 9
6 2 . 0
…
…
➘
➚
…
4 . 7
…
( c o n t i n u e d )

7/31/2019 Global Wage Report
http://slidepdf.com/reader/full/global-wage-report 41/139
24 Global Wage Report 2010 / 11
T a
b l e 2
T h e w a g e s
h a r e
i n O E C D c o u n
t r i e s
o r
t h e r e a
l e c o n o m y
( c o n
t i n u e
d )
C o u n t r y
g r o u p i n g
C o u n
t r y a n
d l a s
t
a v a
i l a b l e y e a r
W a g e s h a r e ( W S ) i n t o t a l i n c o m e
T r e n
d s
i n w a g
e s
h a r e
( W S ) 3
V o l a
t i l i t y o
W S
S h a r e o f w a g e
e m p l o y e e s i n t o t a l
e m p l o y m e n t
( a v e r a g e o v e r 2 0 0 0 s )
A v e
r a g e
1 9 8
0 –
8 5
A v e r a g e
2 0 0 4 – 0 7
A v e r a g e
2 0 0 8 –
0 9
1 9 8 0 s
1 9
9 0 s
2 0 0 0 – 0 7
2 0 0 8
2 0 0 9
C o e
f c
i e n
t
o v a r i a
t i o n
2
O t h e r
E u r o p e
I c e l a n d
2 0 0 8
5 9 . 8
7 7 . 2
7 0 . 4
❍
➚
➚
➘ ➘
…
1 0 . 5
8 4 . 5
N o r w a y
2 0 0 9
5 6 . 4
4 9 . 1
5 0 . 0
➚
❍
➘ ➘
➘
➚
8 . 3
9 2 . 8
S w i t z e r l a n d 1
2 0 0 9
…
6 5 . 0
…
…
❍
➘
…
…
1 . 9
…
A m e r i c a
C a n a d a
2 0 0 6
6 2 . 2
5 9 . 7
…
❍
➘ ➘
❍
…
…
3 . 4
9 1 . 6
M e x i c o 1
2 0 0 8
3 8 . 5
2 9 . 9
…
➘ ➘
➘
➘
…
…
1 1 . 0
…
U n i t e d S t a t e s
2 0 0 7
6 5 . 8
6 3 . 7
…
❍
❍
➘
…
…
1 . 6
9 3 . 8
A s
i a a n d
O c e a n
i a
A u s t r a l i a
2 0 0 7
6 2 . 3
5 6 . 7
…
➘ ➘
❍
➘
…
…
3 . 4
8 5 . 9
J a p a n
2 0 0 5
5 7 . 3
5 6 . 3
…
➘
➚
➘
…
…
2 . 2
8 5 . 3
R e p u b l i c
o f K o r e a
2 0 0 8
4 4 . 8
5 5 . 0
5 5 . 0
➚
➚
➚
❍
…
8 . 2
6 3 . 2
N e w Z e a l a n d
2 0 0 6
5 5 . 7
5 2 . 4
…
➘
❍
➚
…
…
4 . 8
9 2 . 7
1
C o v e r s t h e t o t a l e c o n o m y ( i n c l u d i n g f n a n c i a l a n d b u s i n e s s s e r v i c e s ) .
2
S t a n d a r d d e v i a t i o n o L S d i v i d e d b y m e a n .
3
S y m b o l s
o r t r e n d s :
❍
s t a b i l i t y ( c h a n g e l e s s t h a n ± 1 % )
…
d a t a n o t a v a i l a b l e
➚
i n c r e a s e > 1 % b u t < o r = 3 %
➘
d e c r e a s e < – 1 % b u t > o r = – 3 %
➚ ➚
i n c r e a s e > 3 %
➘ ➘
d e c r e a s e < – 3 %
S o u r c e s : O
E C D , S T A N d a t a b a s e O E C D , A N A d a t a b a s e .

7/31/2019 Global Wage Report
http://slidepdf.com/reader/full/global-wage-report 42/139
25PART I The wage share
throughout a downturn because rehiring and retraining new employees once the recov-ery is underway would be even costlier. This practice causes labour demand to all byless than output during downturns and to rise by less than output during upswings. Italso explains why short-term deviations o the wage share rom its long-term trend areusually temporary and not very persistent – pointing to the act that, in the uture, pro-its are likely to recover aster than employment and wages.32
In the long run, the determinants o the wage share are more complex and dicultto disentangle. In general, the trend towards lower wage shares in OECD countriesater the mid-1980s is attributed to the introduction o new technology, the eects o globalization, the increased infuence o nancial institutions and/or the weakening o
labour market institutions (see box 3).33
The Global Wage Report 2008/09 argued thatincreased openness to trade may have unctioned as a wage-moderation actor, particu-larly in light o the increased presence o large low-wage exporters in the market orlabour-intensive products. Some authors have pointed out that a declining wage sharecould also simply be a orm o statistical quirk, arising rom a general shit in economicactivity rom sectors with high wage shares to sectors with lower wage shares (“shiteects”).34 Our own analysis shows, however, that the structural decline in the wageshare was primarily due to declining wage shares within sectors (“share eects”). Ingure 15 we see that, in most cases, both the “shit eect” and the “share eect” havehad a negative impact on the wage share since the 1980s. 35 In a majority o countries,however, the “share” eect outweighs the “shit” eect. A more detailed explanation o
the methodology o our “shit-share” analysis can be ound in Technical appendix II.
2.2 Trends at the sectoral level
The contrast between long-term and short-term changes in the wage share can also be seenat the sector level, particularly in the manuacturing sector. Figures 16, 17 and 18 showtrends in the wage share or three selected sectors:36 manuacturing, construction and abroad service sector that covers nancial intermediation, real estate, renting and otherbusiness services (reerred to as the FIRE sector). Manuacturing and construction are twoo the sectors which were most adversely aected by the recent crisis in OECD countries,in terms o both employment and output. The changes in the FIRE sector are also interest-ing to highlight, since the global recession started with a shock o a nancial nature. The
period used or this analysis is 1990–2009, unless otherwise indicated. The long-termchange has been calculated as the dierence between the wage share in the rst year o analysis and in the year 2007. The recent change during the crisis years is calculated as thedierence between 2007 and the last year or which there are available data.
32 See the study on Canada by Morel (2006).
33 See ILO (2008a), Harrison (2002), Guscina (2006) or Stockhammer (2009).
34 De Serres et al. (2002) underline the act that “changes in the sectoral composition could induce an aggregationbias in the aggregate [labour share] i the shares o wages vary signicantly across sectors” (p. 6). Bagnoli (2009)stresses that such a composition eect is more likely or countries that have undergone large structural changesquickly or where large dierences are present in the labour share across sectors.
35 Switzerland has been excluded rom this analysis due to a lack o sectoral data.
36 The results or all sectors are available at www.ilo.org/travail.

7/31/2019 Global Wage Report
http://slidepdf.com/reader/full/global-wage-report 43/139
26 Global Wage Report 2010 / 11
As gure 16 shows, the long-term change in the wage share in the manuactur-ing sector has been negative or all countries except France, Iceland and the UnitedKingdom. This shows that, in most countries, sectoral value added in manuacturingincreased more rapidly than total employee compensation over the period 1990–2007.Similar to the trend in manuacturing, the long-term change in the wage share is alsomostly negative in the construction sector (gure 17), even though the situation inthat sector is more varied than or manuacturing. Overall, 17 out o the 30 countriesanalysed display a negative long-term change in construction, compared to 26 in manu-acturing. However, in some countries (such as the Czech Republic, Poland and Slova-kia) the negative long-term trend was much larger in the construction sector than in themanuacturing sector.
By contrast, or the bulk o countries with data available post-2007, we notice acountercyclical movement, with increasing wage shares. This indicates an increase inthe share o employee compensation in value added in times o crisis. Specically, we
Box 3 The determinants o the wage share in total income
In the long run, the determinants o the wage share can be grouped into our main areas: (1) pro-
duction technology; (2) institutions/policies; (3) globalization; and (4) the sectoral composition o
the economy.1
1. The production technology is an important determinant o the distribution o income between
the owners o dierent actors o production. Technological progress, such as the introduction
o computers in the workplace, may or example reduce the demand or relatively low-skilled
workers and lead to a decline in the wage share. While capital-intensive technological progress
may hurt the overall wage share, it is also usually seen as increasing the demand or skilled
workers who can work with computers.
2. Regarding institutions and policies, the existence o imperect competition in the product
market creates a surplus or “rent”, which is distributed between capital and labour depending
on workers’ relative bargaining power. The existence o stronger and well-coordinated unions is
a actor explaining a more stable wage share over time (see OECD, 2009a).
3. Globalization can reduce the wage share through dierent channels. First, it may lead to increased
specialization in the production and export o capital-intensive goods, thereby increasing the
returns to capital relative to labour. Second, threats to relocate actories abroad adversely aect
the bargaining position o workers. Third, globalization is also requently accompanied by tech-
nological progress and an increased infuence o nancial institutions, which in turn have put
pressure on wages and tended to increase returns on capital.
4. The changes in the sectoral composition o the economy also aect the wage share over time.
So, or example, i a country’s economic growth is accompanied by a shit rom labour-intensive
sectors to more capital-intensive sectors, the wage share can be expected to decline.
As suggested above, it is plausible that the our actors are correlated with each other. For instance,
technological change, globalization and the restructuring o the economy tend to go hand in hand.
For this reason, it is oten dicult to isolate the net eect o each actor on the wage share.
1 For more details, see European Commission (2007) and OECD (2009a).

7/31/2019 Global Wage Report
http://slidepdf.com/reader/full/global-wage-report 44/139
27PART I The wage share
observe a positive recent change in the wage share or the manuacturing sector or 19o 23 countries. In construction, by contrast, just over hal o the countries in the sampleshow positive changes ater 2007. This nding probably refects the mixed impact o the economic crisis on the construction sector. For certain countries, such as Spain andIreland, a much aster decline in compensation o employees relative to value added
was experienced. This was not the case or other European countries, such as Finland,which experienced more rapid declines in value added relative to labour compensationover the same period.
Canada (1980–2005)
Spain
Portugal (1980–2006)
Estonia (1993–2007)
Denmark
Mexico (1988–2007)
Greece (1995–2007)
Czech Republic (1992–2007)
Republic of Korea
Iceland
–20 –15 –10 –5 0 5 10 15 20
Ireland (1986–2007)
New Zealand (1980–2006)
Sweden
Germany
Austria
Finland
Australia
Slovenia (1995–2007)
Netherlands
Hungary (1992–2007)
Belgium
Italy
France
Norway
Luxembourg (1985–2007)
United States
United Kingdom
Poland (1992–2007)
Change in wage share
Change in wage share
within sectors
(share effect)
Change in sectoral
composition (shift effect)
Figure 15 Explaining changes in the wage share: A “shit-share” analysis (in percentage points)
Note: ILO calculations based on sectoral labour share at the broad sectoral level. The broad sector “agriculture, hunting, shing and orestry” is excluded rom
the analysis. The residual eect, which has no particular meaning, is not shown here. Sample period 1980–2007 unless otherwise specied.
Sources: OECD, STAN database; OECD, ANA database.

7/31/2019 Global Wage Report
http://slidepdf.com/reader/full/global-wage-report 45/139
28 Global Wage Report 2010 / 11
Finland
Luxembourg
Mexico (1990–2007)
Canada (1990–2005)
United States (1990–2007)
New Zealand (1990–2006)
Australia (1990–2007)
Portugal (1990–2006)
Japan (1990–2006)
–25 –20 –15 –10 –5 0 5 10 15 20 25
United Kingdom (1990–2008)
Republic of Korea (1990–2008)
France (1990–2008)
Iceland (1990–2008)
Spain (1990–2008)
Belgium (1990–2008)
Slovenia (1995–2008)
Poland (1994–2008)
Estonia (1993–2008)
Ireland (1990–2008)
Hungary (1992–2008)
Norway
Denmark
Greece
Czech Republic (1993–2008)
Austria
Netherlands
Slovakia (1993–2009)
Sweden
Italy
Germany
Change in wage share
Short-term change
(since 2007)
Long-term trend
Positive changes since 2007
No recent data
Negative changes since 2007
Figure 16 Changes in wage shares in the manuacturing sector (in percentage points)
Notes: Based on unadjusted wage shares. The countries are sorted by descending order o short-term change. For countries or which data are not available or
all years rom 1990 to 2009, the sample o available data is indicated in brackets. Long-term changes are based on 1990–2007 unless the sample o avail-
able data indicates another starting period (e.g. 1993 or Slovakia). Short-term changes are based on 2007–09 unless the sample o available data indicates
another end period (e.g. 2008 or France).
Sources: OECD, STAN database; OECD, ANA database.

7/31/2019 Global Wage Report
http://slidepdf.com/reader/full/global-wage-report 46/139
29PART I The wage share
Greece (1995–2009)
Finland
Mexico (1990–2007)
Australia (1990–2007)
Canada (1990–2005)
United States (1990–2007)
New Zealand (1990–2006)
Portugal (1990–2006)
Japan (1990–2006)
–55 –45 –35 –25 -15 -5 5 15 25
Germany
Iceland (1990–2008)
Spain
Ireland
Norway
Slovakia (1993–2009)
France (1990–2008)
Netherlands
Republic of Korea (1990–2008)
Hungary (1992–2008)
Czech Republic (1992–2008)
Poland (1992–2008)
Italy
Austria
Sweden
United Kingdom (1990–2008)
Luxembourg
Slovenia (1995–2008)
Belgium
Estonia (1993–2008)
Denmark
Change in wage share
Short-term change
(since 2007)
Long-term trend
Negative changes since 2007
Positive changes
since 2007
No recent data
Figure 17 Changes in wage shares in the construction sector (in percentage points)
Notes: Based on unadjusted wage shares. The countries are sorted by descending order o short-term change. For countries or which data are not available or
all years rom 1990 to 2009, the sample o available data is indicated in brackets. Long-term changes are based on 1990–2007 unless the sample o avail-
able data indicates another starting period (e.g. 1993 or Slovakia). Short-term changes are based on 2007–09 unless i the sample o available data indicates
another end period (e.g. 2008 or France).
Sources: OECD, STAN database; OECD, ANA database.
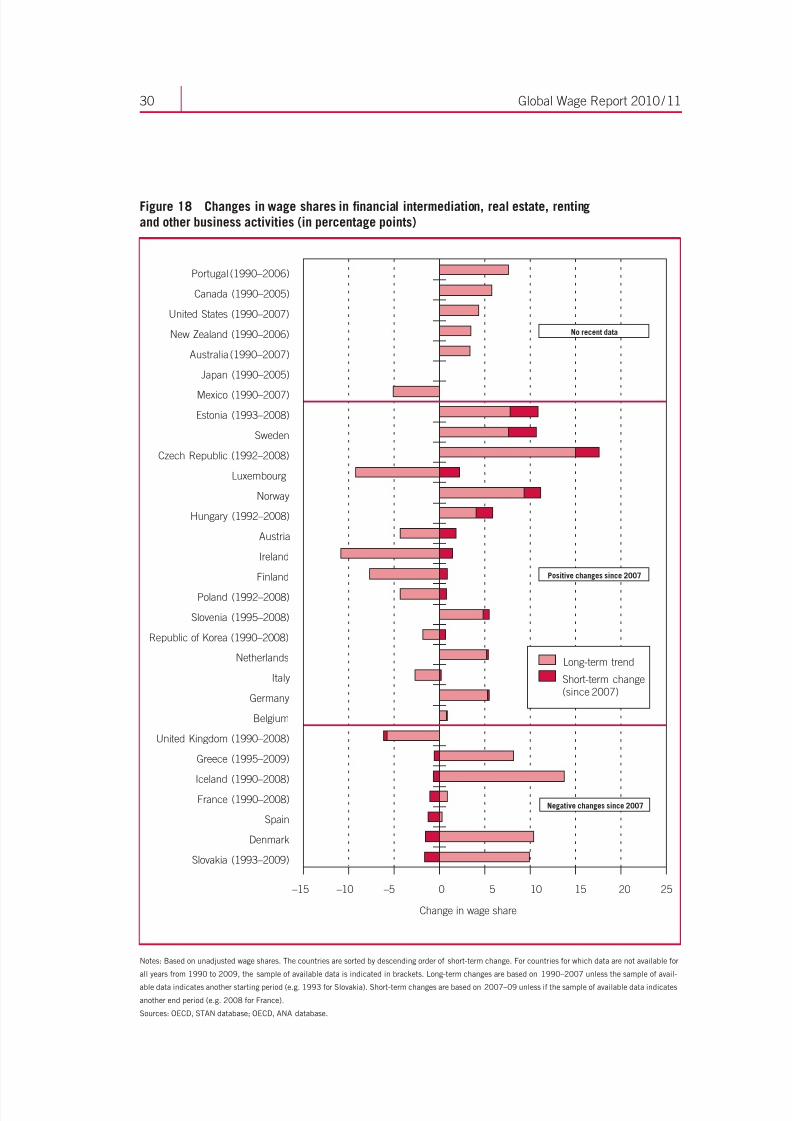
7/31/2019 Global Wage Report
http://slidepdf.com/reader/full/global-wage-report 47/139
30 Global Wage Report 2010 / 11
Sweden
Estonia (1993–2008)
Mexico (1990–2007)
Japan (1990–2005)
Australia (1990–2007)
New Zealand (1990–2006)
United States (1990–2007)
Canada (1990–2005)
Portugal (1990–2006)
–15 –10 –5 0 105 15 20 25
France (1990–2008)
Spain
Denmark
Slovakia (1993–2009)
Iceland (1990–2008)
Greece (1995–2009)
United Kingdom (1990–2008)
Belgium
Germany
Italy
Netherlands
Republic of Korea (1990–2008)
Slovenia (1995–2008)
Poland (1992–2008)
Finland
Ireland
Austria
Hungary (1992–2008)
Norway
Luxembourg
Czech Republic (1992–2008)
Change in wage share
Short-term change
(since 2007)
Long-term trend
Negative changes since 2007
Positive changes since 2007
No recent data
Figure 18 Changes in wage shares in fnancial intermediation, real estate, rentingand other business activities (in percentage points)
Notes: Based on unadjusted wage shares. The countries are sorted by descending order o short-term change. For countries or which data are not available or
all years rom 1990 to 2009, the sample o available data is indicated in brackets. Long-term changes are based on 1990–2007 unless the sample o avail-
able data indicates another starting period (e.g. 1993 or Slovakia). Short-term changes are based on 2007–09 unless i the sample o available data indicates
another end period (e.g. 2008 or France).
Sources: OECD, STAN database; OECD, ANA database.

7/31/2019 Global Wage Report
http://slidepdf.com/reader/full/global-wage-report 48/139
31PART I Wage inequality and low pay
Finally, gure 18 provides evidence on the wage share in the FIRE industries. Wesee that two-thirds o the countries show a positive long-term change, which refectsaster growth in employee compensation compared to value added or this sector. Thewage share in the FIRE sector has continued to increase during the crisis in the majorityo countries. In interpreting these trends, it should be borne in mind that bonuses arecounted as part o the wage share, not as prots.
3 Wage inequality and low pay
The recent global trends in wages and in the wage share should be seen against a back-drop o widespread and rising wage inequality, characterized by rapidly increasingwages at the top and stagnating wages at the median and bottom o the distribution.37 An analysis o gure 19 shows that the distance between the lowest paid 10 per cent o workers and the best paid 10 per cent has increased in 17 out o 30 selected countriesor which at least one data point is available to compare the periods 1995–2000 and2007–09 (panel A). Although the largest part o this increase in inequality was dueto top earners “fying away” rom the majority, another part was due to the so-called“collapsing bottom”, where the distance between median workers and low-paid work-ers has increased in 12 out o 28 countries (panel B). 38
While some o these trends have been documented in our previous Global Wage
Report , this report examines the issue o wage distribution in greater depth rom theperspective o low pay, dened as the proportion o workers whose hourly wages wereless than two-thirds o the median wage across all jobs.39 This indicator captures asense o the degree o social and economic inclusion among a country’s workorce thatis sensitive to societal notions o relative deprivation or relative disadvantage. It high-lights groups which are particularly vulnerable in times o economic crisis. Althoughnot all low-paid workers are poor, a all in the purchasing power o wages at the lowerend o the distribution denitely increases the risk o poverty.40 It may also underminepublic perception that policies are air or lead to a better uture. 41
37 See also ILO (2010b, p. 14). The ILO 2009 Report VI discusses the gender implications o these wage typolo-
gies (ILO, 2009b, paras. 289–294).38 See also the decomposition o wage inequality or selected countries in ILO (2008a).
39 This denition has been adopted or the ILO’s decent work indicators (Decent Work Indicator or “low pay rate”:http://www.ilo.org/wcmsp5/groups/public/---dgreports/---integration/documents/meetingdocument/wcms_115402.pd [9 Sep. 2010]). An alternative measure which can be used to measure low pay is the proportion o workers whoearn less than an absolute wage level that would be necessary or a household to live above the income povertythreshold (or example, Anker et al. (2003); Anker (2006)). While the rst measure is most useul or understandingthe link between low wages and household poverty (see, or example, Altman (2006)), it also poses some ormidablechallenges or cross-country comparisons since the denition o what basket o goods is required to meet subsist-ence varies rom one country to another. For the purpose o inter-country comparison, thereore, a relative measureo low pay is more reliable. For a review o the denitions o low pay, see Grimshaw (2010). Note also that theconcept o low-wage employment by denition leaves out the sel-employed and unpaid amily workers, who areoten in even more vulnerable orms o employment.
40 See also ILO (2010b).
41 See ILO (2010c).

7/31/2019 Global Wage Report
http://slidepdf.com/reader/full/global-wage-report 49/139
32 Global Wage Report 2010 / 11
–4 –3 –2 –1 0 1 2 3 4 5
Australia
United States
Czech Republic
Azerbaijan
Denmark
Ireland
Canada
Switzerland
Finland
Belgium
Israel
Portugal
Peru
Costa Rica
Indonesia
Panama
Paraguay
Mexico
New Zealand
Brazil
Ecuador
Kazakhstan
Venezuela
Uruguay
Argentina
Norway
Republic of Korea
Honduras
Poland
United Kingdom
Change in D9/D1 ratio
Figure 19 Changes in wage inequality (selected countries), 1995–2000 and 2007–09
Panel A. Change in D9/D1 ratio

7/31/2019 Global Wage Report
http://slidepdf.com/reader/full/global-wage-report 50/139
33PART I The wage share
–2.5 –2.0 –1.5 –1.0 –0.5 0.0 0.5 1.0 1.5
Mexico
Brazil
Peru
Paraguay
Portugal
Switzerland
Canada
Belgium
Finland
United Kingdom
United States
Honduras
Ireland
Panama
Czech Republic
Denmark
Australia
Republic of Korea
Norway
Azerbaijan
Poland
Uruguay
Argentina
Ecuador
Venezuela
New Zealand
Costa Rica
Israel
Change in D5/D1 ratio
Figure 19 Changes in wage inequality (selected countries), 1995–2000 and 2007–09 (continued)
Note: Changes in inequality (D9/D1 and D5/D1 ratios) are estimated by comparing the simple average o low-pay incidence or the periods o 1995–2000 and
2007–09.
Source: ILO Global Wage Database; see also Statistical appendix.
Panel B. Change in D5/D1 ratio

7/31/2019 Global Wage Report
http://slidepdf.com/reader/full/global-wage-report 51/139
34 Global Wage Report 2010 / 11
It should be noted that the concerns about low-wage work are not conned to lowlevels o wages but also ocus on instability o earnings. In the case o advanced coun-tries, such as European Union (EU) Members, the risk o being unemployed or inactiveis sometimes two or three times higher among low-wage workers than higher wageworkers.42 Not surprisingly, volatility in earnings is relatively high among low-wageworkers. This means that these workers suer more than others rom the eects o sudden economic downturns. Furthermore, there are indications that sources o earn-ing instability documented in some countries, such as the United States, are largelyconned to low-income earners.43 Thereore, one important test or the eectivenesso counter-crisis policy measures is how successully low-wage workers are able to
cope with the recession.
3.1 Recent trends: Increasing incidence o low pay
Looking at the changes within countries over time, the overall long-term trend is obvi-ous: the majority o countries have witnessed increases in low-wage employment overthe past 15 years. Overall, gure 20 shows that, since the second hal o the 1990s, lowpay has increased in about two-thirds o countries or which data are available (25 outo 37 countries). While the increase in low pay was relatively small in countries suchas the Philippines, the United Kingdom or Switzerland, increases were substantiallygreater in countries such as Luxembourg, Honduras or Panama, indicating that, in thelatter group o countries, low-wage earners lost ground compared to the median-wageearners. By contrast, Chile, Peru and Venezuela succeeded in considerably reducingtheir share o low-wage employment. While it is too soon or an assessment o theshort-term eect o the crisis on low pay (since ew countries have published their dataon low pay in 2009), there is little reason to believe that a global recession will havebrought about any improvement in the overall situation o low-paid workers.
While there is a global trend o increasing low-pay employment, the incidenceo low-wage employment shows considerable variation across countries. The latestnational estimates o low-wage incidence are provided in gure 21. While some coun-tries provide estimates that reer to all wage earners, others restrict the sample to ull-time employees. It is known that the estimates which exclude part-time employmenttend to underestimate the scale o low-wage employment, because part-time workers
oten receive lower hourly earnings in comparison to their ull-time counterparts. Forthis reason, the estimates are grouped separately to allow more meaningul compari-sons. When only ull-time workers are considered, the incidence o low-wage employ-ment varies rom about 6 per cent in Sweden to about 25 per cent in the United Statesor in the Republic o Korea. The size o variations is even larger in the case o the esti-mates or all wage employment, which includes a number o developing countries. Insome countries, such as Austria, Honduras or Panama, at least one out o three employ-ees is in a low-paid job. In Finland, by contrast, low wages aect only about 5 per cento employees.
42 European Commission (2005; data or gure 6).
43 See, or example, Gottschalk and Mott (2009).

7/31/2019 Global Wage Report
http://slidepdf.com/reader/full/global-wage-report 52/139
35PART I The wage share
–6 –4 –2 0 2 4 6 8 1410 12
Sweden
Uruguay
Spain
Paraguay
Philippines
Belgium
Japan
United Kingdom
New Zealand
Switzerland
Finland
China (local)
United States
Canada
Hungary
Mexico
South Africa
Israel
Ecuador
Brazil
Venezuela
Peru
Chile
Panama
Republic of Korea
Australia
Denmark
Argentina
Poland
Germany
Costa Rica
Poland (full-time)
Luxembourg
Honduras
Czech Republic
Ireland
Indonesia
Austria
Change in low-wage employment
Figure 20 Changes in low-wage employment in selected countries, 1995–2000 and 2007–09(in percentage points)
Notes: Changes in low pay are estimated by comparing the simple average o low-pay incidence or the periods 1995–2000 and 2007–09. The gures or some
countries reer to ull-time wage earners only. See Statistical appendix or details. For the Philippines, data rom 2001 were used or the period o 1995–2000;
or Spain, data rom 2004 were used or 1995–2000; or Poland (ull-time) and Sweden, data rom 2004 were used or 2007–09; or Luxembourg, data rom
2006 were used or 2007–09; or Brazil, data rom 2002 were used or 1995–2000.
Source: ILO Global Wage Database; see also Statistical appendix.

7/31/2019 Global Wage Report
http://slidepdf.com/reader/full/global-wage-report 53/139
36 Global Wage Report 2010 / 11
50 10 15 20 25 4030 35
Israel
Brazil
Philippines
Spain
Chile
Belgium
Denmark
Switzerland
Finland
Sweden
New Zealand
Finland
Japan
Czech Republic
Australia
LuxembourgIreland
United Kingdom
Germany
Hungary
Canada
United States
Republic of Korea
Panama
Venezuela
Argentina
Ecuador
Paraguay
South Africa
Uruguay
Austria
Honduras
Peru
Costa Rica
Mexico
Poland
% of employees
Full-time employees only
All employees
Figure 21 Low-wage employment: A global comparison, latest available year (in per cent)
Source: ILO Global Wage Database; see also Statistical appendix.

7/31/2019 Global Wage Report
http://slidepdf.com/reader/full/global-wage-report 54/139
37PART I Wage inequality and low pay
While the incidence o low-wage employment tends to be high in developingcountries, the relationship between the level o economic development and the relativeproportion o workers on low pay is not clear-cut. As can be observed in gure 21, someadvanced countries have a relatively high level o low-wage employment. The complexrelationship between economic development and low pay is illustrated in gure 22,in which productivity levels (measured by the natural log o GDP per worker) on thehorizontal axis are compared to the incidence o low-wage employment on the verti-cal axis. The two dotted circles represent developed and developing countries. We see
that the proportion o low pay is generally higher in less advanced countries, but thatthe incidence o low-wage employment varies quite considerably within each group o countries. In some regions, such as in Latin America, no discernible pattern is observ-able with regard to low-wage employment and national income levels. These widedierences between countries with relatively similar levels o economic developmenthave inspired a growing body o research in recent years (see table 3).
3.2 Characteristics o low-paid workers
Studies o the demographics o low-wage employment reveal common key charac-teristics. Research in advanced countries shows that low pay tends to be concen-
trated within certain groups o workers, revealing that workers in low-wage jobshave low levels o education, tend to be young, are disproportionately emale and aremore likely to be members o a disadvantaged ethnic minority, racial or immigrant
8.5 9.0 9.5 10.0 10.5 11.0 12.011.5
0
10
20
30
40
60
50
y = –6.4301x + 90.235
R 2 = 0.268
Productivity: GDP per worker (log)
Developing countries
Developed countries
I n c i d e n c e o f l o w - w a g e
e m p l o y m e n t ( % )
Figure 22 Output per worker (productivity) and low-wage employment in 34 countries, latest avail-able year
Source: ILO Global Wage Database.
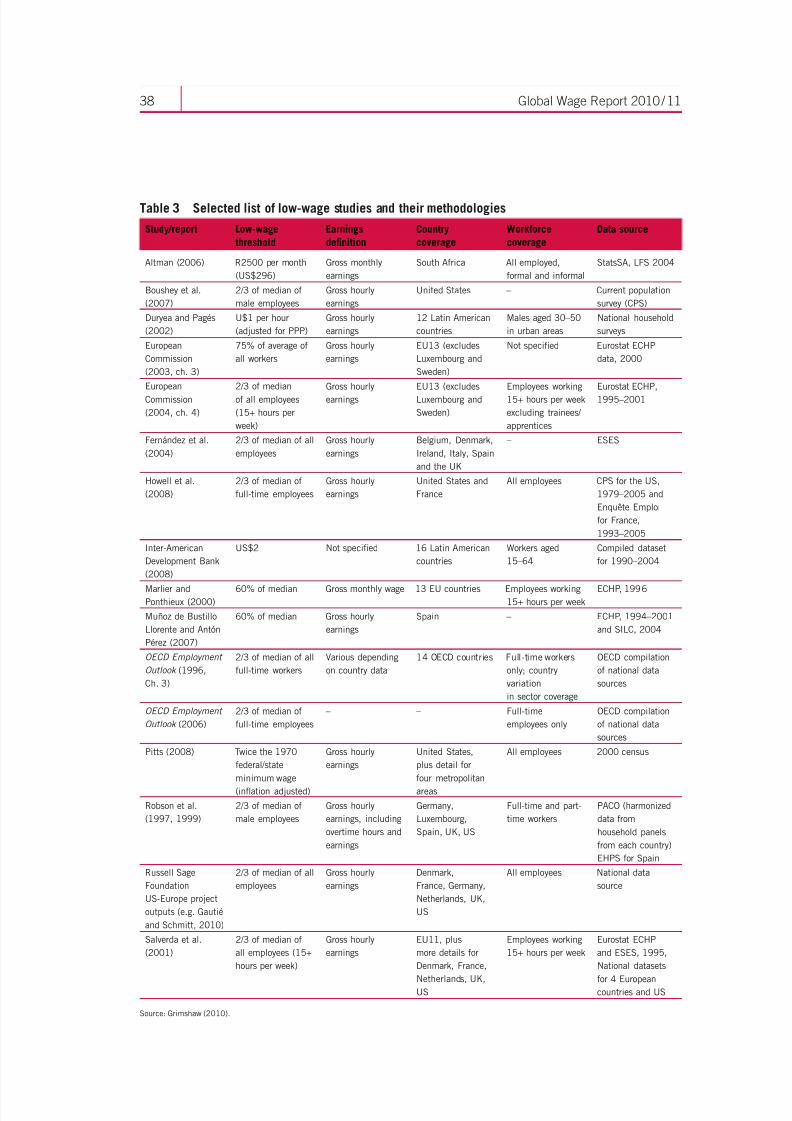
7/31/2019 Global Wage Report
http://slidepdf.com/reader/full/global-wage-report 55/139
38 Global Wage Report 2010 / 11
Table 3 Selected list o low-wage studies and their methodologies
Study/report Low-wage
threshold
Earnings
defnition
Country
coverage
Workorce
coverage
Data source
Altman (2006) R2500 per month
(US$296)
Gross monthly
earnings
South Arica All employed,
ormal and inormal
StatsSA, LFS 2004
Boushey et al.
(2007)
2/3 o median o
male employees
Gross hourly
earnings
United States – Current population
survey (CPS)
Duryea and Pagés
(2002)
U$1 per hour
(adjusted or PPP)
Gross hourly
earnings
12 Latin American
countries
Males aged 30–50
in urban areas
National household
surveys
European
Commission
(2003, ch. 3)
75% o average o
all workers
Gross hourly
earnings
EU13 (excludes
Luxembourg and
Sweden)
Not specied Eurostat ECHP
data, 2000
European
Commission
(2004, ch. 4)
2/3 o median
o all employees
(15+ hours per
week)
Gross hourly
earnings
EU13 (excludes
Luxembourg and
Sweden)
Employees working
15+ hours per week
excluding trainees/
apprentices
Eurostat ECHP,
1995–2001
Fernández et al.
(2004)
2/3 o median o all
employees
Gross hourly
earnings
Belgium, Denmark,
Ireland, Italy, Spain
and the UK
– ESES
Howell et al.
(2008)
2/3 o median o
ull-time employees
Gross hourly
earnings
United States and
France
All employees CPS or the US,
1979–2005 and
Enquête Emploi
or France,
1993–2005
Inter-American
Development Bank
(2008)
US$2 Not specied 16 Latin American
countries
Workers aged
15–64
Compiled dataset
or 1990–2004
Marlier andPonthieux (2000)
60% o median Gross monthly wage 13 EU countries Employees working15+ hours per week
ECHP, 1996
Muñoz de Bustillo
Llorente and Antón
Pérez (2007)
60% o median Gross hourly
earnings
Spain – ECHP, 1994–2001
and SILC, 2004
OECD Employmen
Oulook (1996,
Ch. 3)
2/3 o median o all
ull-time workers
Various depending
on country data
14 OECD countries Full-time workers
only; country
variation
in sector coverage
OECD compilation
o national data
sources
OECD Employmen
Oulook (2006)
2/3 o median o
ull-time employees
– – Full-time
employees only
OECD compilation
o national data
sources
Pitts (2008) Twice the 1970
ederal/state
minimum wage
(infation adjusted)
Gross hourly
earnings
United States,
plus detail or
our metropolitan
areas
All employees 2000 census
Robson et al.
(1997, 1999)
2/3 o median o
male employees
Gross hourly
earnings, including
overtime hours and
earnings
Germany,
Luxembourg,
Spain, UK, US
Full-time and part-
time workers
PACO (harmonized
data rom
household panels
rom each country)
EHPS or Spain
Russell Sage
Foundation
US-Europe project
outputs (e.g. Gautié
and Schmitt, 2010)
2/3 o median o all
employees
Gross hourly
earnings
Denmark,
France, Germany,
Netherlands, UK,
US
All employees National data
source
Salverda et al.
(2001)
2/3 o median o
all employees (15+
hours per week)
Gross hourly
earnings
EU11, plus
more details or
Denmark, France,
Netherlands, UK,US
Employees working
15+ hours per week
Eurostat ECHP
and ESES, 1995,
National datasets
or 4 Europeancountries and US
Source: Grimshaw (2010).

7/31/2019 Global Wage Report
http://slidepdf.com/reader/full/global-wage-report 56/139
39PART I Wage inequality and low pay
0
5
10
15
20
50
25
30
35
40
45
F e m a
l e
Total Gender Age Education Sector (selected) Type of employment Firm size
M a
l e
1 5 –
2 4
2 5 –
4 9
5 0 o r o v e r
U p t o
3 y e a r s o
f s c
h o o
l i n g
4 –
7 y e a r s
8 –
1 0 y e a r s
1 1 y e a r s o r m o r e
I n d u s
t r y
C o n s
t r u c
t i o n
F i n
a n c
i a l i n t e r m e
d i a t i o n
D o m e s
t i c s e r v
i c e s
P u
b l i c s e r v a n
t
F o r m a
l e m p
l o y e e
I n f o r m a
l e m p
l o y e e
1 –
5 e m p
l o y e e s
6 –
1 0 e m p
l o y e e s
1 1 e m p
l o y e e s o r m o r e
A
l l m e
t r o p o
l i t a n a r e a s
21.0
25.4
16.8
30.5
18.5 19.4
44.0
34.3
29.4
11.1
17.0
23.2
13.1
45.1
2.6
14.3
32.0
25.0
2.9
4.4
I n c
i d e n c
e ( % )
Figure 23 Incidence o low-wage employment by major demographic characteristics,selected countries, various years (in per cent)
Panel A. Brazil (2009)
Panel B. Philippines (2008)
0
10
20
30
40
80
50
60
70
M e n
Total Gender Age Education Industry
Hours
of work
Type
of contract
W o m e n
1 5 – 2 4
2 5 – 4 4
5 4 – 6 4
6 5 a n d o v e r
N o g r a d e c o m p l e t e d
P r i m a r y
S e c o n d a r y
T e r t i a r y
A g r i c u l t u r e
I n d u s t r y
S e r v i c e s
H o t e l s a n d r e s t a u r a n t s
P r i v a t e H o u s e h o l d s
P e r m a n e n t
T e m p o r a r y
P a r t - t i m e
( l e s s t h a n 4 0 h o u r s )
F u l l - t i m e
( 4 0 h o u r s o r m o r e )
N a t i o n a l a v e r a g e
I n c i d e n
c e ( % )
14.612.4
18.1
28.8
12.79.4
5.4
12.2
18.0 18.0
5.9
14.212.7
15.5
21.7
75.0
11.4
27.5
10.0
17.3

7/31/2019 Global Wage Report
http://slidepdf.com/reader/full/global-wage-report 57/139
40 Global Wage Report 2010 / 11
0
10
20
30
40
80
50
60
70
A f r i c a n
Total Race Gender Age EducationProvince (selected)
C o
l o u r e
d
A s
i a n
W h i t e
M a
l e
F e m a
l e
1 5 –
2 4 y e a r s
2 5 –
3 4 y e a r s
3 5 –
4 4 y e a r s
4 5 –
5 4 y e a r s
5 5 –
6 5 y e a r s
W e s
t e r n
C a p e
E a s
t e r n
C a p e
N o r t h e r n
C a p e
G a u
t e n
g
M p u m a
l a n
g a
L i m p o p o
N o n e
G r a
d e s
0 –
6
G r a
d e s
7 –
1 1
G r a
d e s
1 2
D i p
l o m a w
i t h o u
t G r
1 2
D i p l o m a w
i t h G r
1 2
D e
g r e e
O v e r a
l l
32.5
41.9
26.1
7.2
1.8
29.7
36.4
41.2
35.2
29.6
26.8
30.4
20.1
44.8
64.6
44.9
21.4
6.74.4
45.5
20.4
45.2
50.4
67.5
1.2
I n c
i d e n c e
( % )
Panel C. South Arica (2007)
0
10
20
30
40
70
50
60
M a l e
Total Gender Age RegionOwnershipIndustryType of contractEducation
F e m a l e
1 6 – 2 0
2 1 – 2 5
2 6 – 3 0
P
r i m a r y s c h o o l o r b e l o w
J u n i o r h i g h s c h o o l
S e n i o r h i g h s c h o o l
C o l l e g e o r a b o v e
F i x e d o r l o n g - t e r m
S h o r t - t e r m
O t h e r
M a n u f a c t u r i n g
C o n s t r u c t i o n
S e r v i c e
O t h e r
S
t a t e - o w n e d e n t e r p r i s e s
C o l l e c t i v e e n t e r p r i s e s
P r i v a t e o r i n d i v i d u a l
F o r e i g n e n t e r p r i s e s
E a s t e r n
M i d d l e
W e s t e r n
O v e r a l l
28.2
22.5
35.8
63.3
29.6
23.8
63.9
51.1
36.5
12.9
21.9
65.3
43.8
29.1
42.7
18.3
16.5
41.0
21.0
28.5
22.320.2 21.0
37.0
I n c i d e n
c e ( % )
Panel D1. China (local workers, 2008)
Figure 23 Incidence o low-wage employment by major demographic characteristics,selected countries, various years (in per cent) (continued)

7/31/2019 Global Wage Report
http://slidepdf.com/reader/full/global-wage-report 58/139
41PART I Wage inequality and low pay
0
10
20
30
40
90
80
50
60
70
M a l e
Total EducationGender Age Ownership RegionIndustryType of contract
F e m a l e
1 6 – 2 0
2 1 – 2 5
2 6 – 3 0
P r i m a
r y s c h o o l o r b e l o w
J u n i o r h i g h s c h o o l
S e n i o r h i g h s c h o o l
C o l l e g e o r a b o v e
F i x e d o r l o n g - t e r m
S h o r t - t e r m
O t h e r
M a n u f a c t u r i n g
C o n s t r u c t i o n
S e r v i c e
O t h e r
S t a t e - o w n e d e n t e r p r i s e s
C o l l e c t i v e e n t e r p r i s e s
P r i v a t e o r i n d i v i d u a l
F
o r e i g n e n t e r p r i s e s
O t h e r
E a s t e r n
M i d d l e
W e s t e r n
O v e r a l l
60.8
56.4
67.6
73.8
58.1
50.3
77.8
63.2
53.2
38.1
53.4
69.1
30.8
48.9
67.0
25.2
77.8
48.3
77.3
55.6
66.7
44.4
52.3
44.4
81.0
I n c i d e n c e
( % )
Panel D2. China (migrant workers, 2007)
Sources: ILO’s country studies on low-wage employment in the developing world (see list o background papers in the bibliography; Damayanti (2010); Fontes
and Pero (2010); Grimshaw (2010); Hall et al. (2010); Lee and Hwang (2010); Deng and Li (2010); Oosthuizen and Goga (2010); Peralta and Guirao (2010);
Velásquez Pinto (2010)).
group. In order to understand the characteristics o low-paid workers in developingcountries, we have undertaken a series o case studies in countries that have seendynamic changes in the labour market in recent years, including Brazil, Chile, China,
Indonesia, the Philippines and South Arica. The case studies show that the patternsobserved in high-income countries are, to a large extent, replicated in developingcountries. Figure 23 shows how the incidence o low-wage employment varies alongwith demographic, occupational and enterprise characteristics in our o these devel-oping countries. (The results o a more rigorous analysis based on a logit model areprovided in box 4.)
From an analysis o the case studies, we rst observe a strong association betweena worker’s level o education and the risk o low pay. In Brazil, or instance, 44 per cento employees with only three years o schooling or less are paid low wages, while theincidence o low pay decreases to 29 per cent or those with 8–10 years o schooling.In South Arica, more than 60 per cent o workers with no or little education end up in
low-paid employment, compared to a national average o 32.5 per cent. Similarly, inChina, about 64 per cent o low-educated local workers (i.e. non-migrants) are in low-paid employment, relative to a national average o 28.2 per cent or all local workers in
Figure 23 Incidence o low-wage employment by major demographic characteristics,selected countries, various years (in per cent) (continued)

7/31/2019 Global Wage Report
http://slidepdf.com/reader/full/global-wage-report 59/139
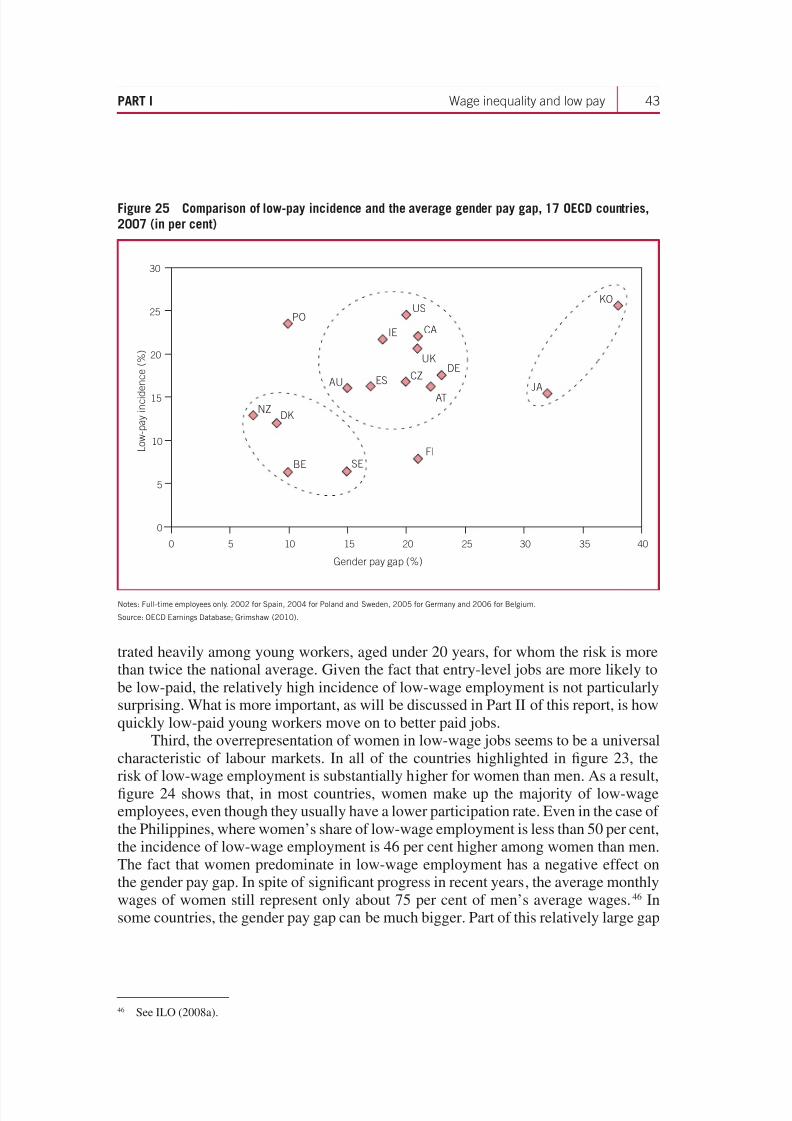
7/31/2019 Global Wage Report
http://slidepdf.com/reader/full/global-wage-report 60/139
43PART I Wage inequality and low pay
trated heavily among young workers, aged under 20 years, or whom the risk is morethan twice the national average. Given the act that entry-level jobs are more likely tobe low-paid, the relatively high incidence o low-wage employment is not particularlysurprising. What is more important, as will be discussed in Part II o this report, is howquickly low-paid young workers move on to better paid jobs.
Third, the overrepresentation o women in low-wage jobs seems to be a universalcharacteristic o labour markets. In all o the countries highlighted in gure 23, therisk o low-wage employment is substantially higher or women than men. As a result,gure 24 shows that, in most countries, women make up the majority o low-wageemployees, even though they usually have a lower participation rate. Even in the case o the Philippines, where women’s share o low-wage employment is less than 50 per cent,the incidence o low-wage employment is 46 per cent higher among women than men.The act that women predominate in low-wage employment has a negative eect onthe gender pay gap. In spite o signicant progress in recent years, the average monthlywages o women still represent only about 75 per cent o men’s average wages.46 Insome countries, the gender pay gap can be much bigger. Part o this relatively large gap
46 See ILO (2008a).
0 5 10 15 20 25 4030
0
5
10
15
20
30
25
Gender pay gap (%)
PO
NZDK
BE SE
KOUS
JA
IE
AU ES
CA
UK
CZDE
AT
FI L o w - p a y i n c i d e n c e ( % )
35
Figure 25 Comparison o low-pay incidence and the average gender pay gap, 17 OECD countries,2007 (in per cent)
Notes: Full-time employees only. 2002 or Spain, 2004 or Poland and Sweden, 2005 or Germany and 2006 or Belgium.
Source: OECD Earnings Database; Grimshaw (2010).

7/31/2019 Global Wage Report
http://slidepdf.com/reader/full/global-wage-report 61/139
44 Global Wage Report 2010 / 11
Box 4 Determinants o low-pay incidence: The statistical results
o a logit model in selected countries
In order to determine the actors which infuence the likelihood o low pay, a series o regressions
based on a logit model has been undertaken. The model used is expressed as:
Prob( y =1|x ) = Λ(x β ) = –––––––––––, where
y is the dependent variable ( y = 1 i low paid, y = 0 otherwise)
x are the independent variables, including demographic characteristics
β are the coecients andΛ is the cumulative standard logistic distribution unction.
Table B2 below presents a list o variables which are ound to increase the risk o low pay (includes
only those which are statistically signifcant). Whenever possible, selection bias has been addressed
by using conditional probability, based on the methodology proposed by Cuesta (2008). Further details
are available rom the country reports commissioned or the Global Wage repot .
Table B2 Variables increasing the risk o low pay in selected developing countries
Brazil China Indonesia Rep. o Korea Philippines South Arica
Gender Women Women Women Women Women Women
Age Youth Youth Youth Youth
and elderly
Youth Youth
Ethnicity,
race and migrant
status
Non-white Internal
migrants
NI NI NI Non-white
and non-Asian
Education Low education Low education Low education Low education Low education Low education
Marital status Not household
head
Not married NI Not household
head
Not married NI
Region North-east
region
Middle
and Western
Rural NI Outside Manila Rural
Employment
type
(or contract
type)
Inormal
employees
Short-term or
other atypical
contracts
NI Non-standard
contracts
Temporary
contact
Inormal
employees
(without a written
contract)
Industry Services
(including
private
households)
Manuacturing Service Service Service Wholesale and
retail, private
households
Types o rms NI Private
enterprises
NI Small rms Private
households
Small rms
exp(x β)
1+ exp(x β)
(continued)

7/31/2019 Global Wage Report
http://slidepdf.com/reader/full/global-wage-report 62/139
45PART I Wage inequality and low pay
can be explained by the act that women work ewer hours, but another part is related towomen’s overrepresentation in low-paid jobs and to discriminatory wage practices. 47
This gendered distribution o low-wage employment is, in itsel, an importantcause o gender pay gaps. Indeed, there is evidence o the strong association betweenthe overall incidence o low pay in a country and its average gender pay gap. Ingure 25, which ocuses on industrialized countries, a cluster o our countries in thebottom let-hand corner is characterized by a below-average incidence o low pay anda below-average gender pay gap. A second group o nine countries combines a level o low pay and gender pay gap at or above the average or all countries, and a third groupis represented by the Republic o Korea and Japan, which have a high level in both vari-ables. Country exceptions to this pattern include Poland, which has a narrower genderpay gap than expected – pointing to a relatively high representation o men amonglow-wage work – and Finland, where the gender pay gap is surprisingly wide, given itsoverall low incidence o low-wage work.
The gendered distribution o low-wage employment is also related to the vulner-ability o women-dominated occupations to low-pay risk. As our regression analysis(see box 4) shows, domestic workers are exposed to an extremely high risk o low pay,notably in Brazil, South Arica and the Philippines. In the Philippines, three out o ourdomestic workers were low paid. In many countries, including the Philippines, lowpay among domestic workers is partly caused by the lack o proper wage protection,notably the airly common practice o excluding such workers rom the application o minimum wages.48
In addition to these personal characteristics, it is important to note that the typeso employment and contract are also signicant. So, or example, permanent and
47 See Grimshaw (2010) or a review.
48 See Peralta and Guirao (2010) or the case o the Philippines.
Brazil China Indonesia Rep. o Korea Philippines South Arica
Occupation NI Manual and
other service
workers
Trade-related
and service
NI Trade-related
and service
Domestic workers
Working time Full-time NI Long hours
(>60 hours)
Part time Full time NI
Union
membership
status
NI NI NI NI NI Workers
without union
membership
Data set PME/IBGE CHIP LFS (Skens) LFS LFS LFS
Sources Fontes and Pero
(2010)
Deng and Li
(2010)
Damayanti
(2010)
Lee and Hwang
(2010)
Peralta and
Guirao (2010)
Oosthuizen and
Goga (2010)
NI = “not included” in regressions.
Box 4 (continued)

7/31/2019 Global Wage Report
http://slidepdf.com/reader/full/global-wage-report 63/139
46 Global Wage Report 2010 / 11
ormal jobs are associated with lower incidences o low wages. Job insecurity, ar rombeing compensated through higher wages, actually tends to go hand in hand with lowpay. The striking dierence in low-wage risk between stable and short-term contractsamong local workers in China – 22 per cent and 65 per cent, respectively – is a casein point. Not surprisingly, low-wage employment is concentrated in small enterprises,such as enterprises with 1–5 employees in the Philippines. Aside rom the speciccircumstances o agriculture and the inormal economy, low-wage employment is alsoconcentrated in key sectors – common in developed and less developed countries – typi-cally including the retail trade, hotels and restaurants, transport, social services (includ-ing household activities) and some areas o manuacturing, such as ood processing and
textiles; again, many o these sectors are emale-dominated.Finally, ethnic and geographical actors are signicant as well, particularly in acountry such as South Arica. China provides another interesting case, where the urban-ization o the labour market makes rural migrant workers vulnerable to low wages. In2008, the risk o low-wage employment was at least twice as high or rural migrantworkers as or local workers. It is estimated that about 60 per cent o this large dier-ential is attributable to the characteristics o workers, such as the level o education, andthe remaining 40 per cent is due to the discriminatory treatment o migrant workers. 49 This points towards the general observation that migrant workers tend to be particu-larly vulnerable to low pay, not only because o their personal characteristics but alsobecause they are more likely to suer rom pay discrimination in the labour market.
49 Deng and Li (2010).

7/31/2019 Global Wage Report
http://slidepdf.com/reader/full/global-wage-report 64/139
4 The role o wage policies
4.1 Social justice and equity
Why should policy-makers care about wage policies during the crisis and the recoveryprocess? One reason concerns social justice and the hardship that inequality and lowwages impose on households, particularly at the lower end o the wage distribution.Even in 2007, beore the economic crisis, 79 million EU citizens were estimated tobe “at risk o poverty”, and 32 million were “materially deprived”.50 While people inemployment are less exposed to the risks o poverty than the unemployed, “in-work”poverty aected no ewer than 17.5 million workers.51 In the United States, it was esti-mated that 37.3 million people lived on or below the poverty line in 2007, o which7.5 million held a job and were thereore counted among the working poor. 52 For allthese workers, even small pay cuts during the crisis could trigger large reductions inliving standards.
Related to this is the act that, even though inequality refects dierences in thelevel o education, ability or motivation between individuals, the increasing return onskills mentioned in Part I o this report can be problematic rom a societal point o view.A report by the International Institute or Labour Studies (IILS) highlights the actthat, while the costs o the nancial crisis and the rescue packages were borne by all,the benets o the earlier expansionary period were unevenly shared, with inequalitiesincreasing at a pace that has probably been excessive.53 The same IILS report points outthat social conficts tend to increase when inequalities are perceived as being too wide.54 More recent events, including a series o labour disputes over wages in China, highlightthe act that low-paid workers are determined to demand an equitable distribution o thebenets o economic growth.
50 Eurostat, Statistics in Focus (46/2009).
51 The total o 17.5 million workers is estimated on the basis o two separate Eurostat reports which document,respectively, that 8 per cent o the employed population in the EU27 had an income below the poverty line in 2007(Wol, 2009) and that total employment in 2007 was 218,451,000 (Romans and Preclin, 2008).
52 US Department o Labor (2009).
53
IILS (2008).54 There is a gender dimension: i young men in particular cannot nd work and become marginalized, oten theconsequences are delinquency and social unrest. See ILO (2009b).
Part ii Wages policies
in times of crisis

7/31/2019 Global Wage Report
http://slidepdf.com/reader/full/global-wage-report 65/139
48 Global Wage Report 2010 / 11
4.2 The macroeconomic eects o wages
Another concern which has recently re-emerged is related to the macroeconomic eecto wages. While much past research on wage policy has ocused on the eects o wageinstitutions and regulations on rm-level or industry-level employment, another impor-tant question concerns the link between the level o wages in a country and its aggre-gate demand or goods and services. The latter is equal to the sum o consumption,investment, net exports and government spending. While a country’s low wages rela-tive to its productivity may help to boost its exports, and also encourage investment toa certain extent, it is important to keep in mind the act that low wages depress house-hold consumption. Hence, whenever a all in wages reduces domestic consumption
more than it increases exports and investment, it has a negative eect on a country’seconomic growth. This explains why declining wages in periods o crisis may actuallylead to a spiral o alling aggregate demand and price defation, rather than to a quickereconomic recovery (see box 5).55
In act, a number o observers have established links between the long-termdecline in the wage share, the increase in wage inequality and the global economiccrisis. While there are, o course, many actors which have triggered the crisis, a groupo 30 distinguished experts led by Jean-Paul Fitoussi and Joseph Stiglitz consideredthat the crisis had its structural roots in the decline in aggregate demand that precededthe crisis and which was due to changes in income distribution. They argue that theincrease in inequality in the years beore the crisis depressed aggregate demand by
transerring money rom low-income households – which have a high propensity tospend – to households with higher incomes, which tend to spend less and save more.56 In the United States, this all in aggregate demand was compensated or by increasedborrowing, so that growth was maintained at the cost o increased indebtedness. Asimilar argument is made by others,57 who contend that the decline in the wage sharebeore the crisis underlies the development o the United States’ “debt-led consumptionmodel”, which ultimately proved to be unsustainable.
Looking orward, the macroeconomic link between wages and aggregate demandalso indicates that the pace o the recovery will depend, at least partly, on the extent towhich households are able to use their wages to consume whatever the global economyproduces. And, while it may be possible or some countries to rely on export-led growth
rather than on their own internal demand, such policies create global imbalances, sincethe world as a whole cannot rely on exports. Another disadvantage o export-led growthstrategies based on low wages is that they may generate economic growth but with adeclining wage share (see the cases o China and Germany, or example). This situationcalls or the implementation o policies to rebalance global growth in at least two ways.On one side, export-oriented countries, such as China, which now ace weaker demandrom countries with external decits, need to strengthen aggregate demand rom domes-tic sources. On the other side, countries such as the United States, which had a large
55 The act that wage moderation can lead to defationary pressures or lower aggregate demand has also beenrecently highlighted in IMF (2010a) and UNCTAD (2010).
56 See Fitoussi and Stiglitz (2009).
57 See or example Onaran (2009), Palley (2009) or Horn et al. (2009).

7/31/2019 Global Wage Report
http://slidepdf.com/reader/full/global-wage-report 66/139
49PART II The role of wage polices
external decit beore the crisis, need to anchor uture aggregate demand more rmly inearned income and broad access to employment, rather than in increasing debts.
While generalized wage cuts across countries could spread competitive defation-
ary pressures and threaten the global economic recovery, there are, o course, limits inany country on the extent to which wages can be increased without harming the econ-omy. When wages increase too quickly relative to productivity, their adverse impact
Box 5 The perverse eects o declining wages
Following the nancial crisis that hit the world in mid-August 2007, downward pressures on nom-
inal wages, arising rom ailing business enterprises and rising unemployment rates, have become
more and more apparent since early 2009. According to the textbook view, there is nothing to
worry about, since decreasing wages are part o the market orces that should be instrumental in
bringing the economy back to ull employment. It is oten claimed that the more fexible wages are,
the aster the economy will adjust to the negative shock and return to ull employment. This view,
however, is subject to a problem called the “allacy o composition”. It is certainly in the interest
o each rm and each country, taken individually, to reduce nominal and real wages when others do
not. The rms that have reduced wages will benet rom higher prot margins. However, i all rmsand all countries choose the path o wage defation, overall economic activity is likely to be reduced,
and sales and employment will drop. In 1936, Keynes (2007) argued that alling wages result in
declining aggregate demand and that, ar rom rectiying the situation, the downward fexibility o
wages and prices compounds the problem, prolonging and worsening the recession.
Two historical examples are worth recalling. Japan during the 1994–2004 period is an illustration
o monetary policy impotence under wage and price defation. The Bank o Japan tried almost any-
thing that was suggested by economic experts to get the Japanese economy back on track, but to
no avail. Even the non-conventional monetary policies now suggested to bring Western economies
out o the current crisis turned out to be useless in the Japanese case. The Japanese experience
has shown that wage and price defation does not restore ull-employment activity, and probably
only makes matters worse. Central bankers, despite their preerence or low infation rates, appearto have learned the lesson. They ear wage and price defation, realizing that expansionary monetary
policies become impossible once infation alls into the negative range, because o the zero-interest
lower-bound problem experienced in many advanced countries during the crisis. Expansionary scal
policy is then the only way out.
Another lesson rom history is that o the Great Depression, when prices in the United States ell by
nearly 10 per cent in 1932. As pointed out by Lawrence Summers, an Obama adviser and director
o the White House National Economic Council, it is doubtul that the Depression would have been
less severe had prices dropped even aster. “Rather more plausible is the belie that i the price
level had allen at 20 percent per year, the contraction would have been even more serious as very
high real interest rates would have drastically reduced the level o economic activity” (De Long
and Summers, 1986, p. 1043). Hence, the experience o the Great Depression o the 1930s giveslittle comort and lends little support to the idea that wage and price defation will quickly put the
economy back on track.
Source: Proessor Marc Lavoie, Department o Economics, University o Ottawa, Canada.

7/31/2019 Global Wage Report
http://slidepdf.com/reader/full/global-wage-report 67/139
50 Global Wage Report 2010 / 11
on investment and exports outweighs their positive eect on domestic householdconsumption. This can lead to economic stagnation. Also, excessively high wages rela-tive to productivity discourage rm-level employment and risk increasing unemploy-ment, even under lax monetary and scal policies. The challenge or policy-makers isthereore to strike a balance by targeting a level o wage share and income distributionwhich maximizes aggregate demand but also translates into decent work or all.
4.3 Market imperections
A third concern relates to the act that market orces alone will not necessarily deliver thebest outcomes in respect o decent work. Indeed, sound or balanced wage policies arethe result o institutional settings and practices that are able to strike a balance betweenwages that are high enough to sustain consumption consistent with overall economicgrowth and moderate enough to ensure adequate returns on investment. Without eec-tive wage policies there is a risk that the work o some labourers will be undervalued orthat employers will capture a disproportionate share o the economic surplus that inevi-tably arises rom any employment relationship in “imperect” labour markets.58
The imperect nature o labour markets is particularly obvious in the case o gender pay gaps. We have already noted the considerable overrepresentation o womenin low-wage employment in the bulk o countries or which we have data. Part o theexplanation in some countries surely has to do with women’s disadvantageous situationin terms o educational opportunities and, hence, their lower levels o skills and produc-tivity; a situation which calls or policy measures to improve the education and skills(or “employability”) o women. At the same time, in many countries the gender paygap has decreased only slowly in spite o women’s educational achievements and theprogressive closing o the gap in work experience.59 This highlights the act that labourmarket imperections are also a key actor. For instance, there is evidence that whenwomen have a lower elasticity in labour supply (due, or example, to lower mobility)than men, employers may choose to pay lower wages to women than men even thoughboth groups have the same level o productivity.60
Hence, the literature on imperect labour markets draws attention to the tendencyto undervalue women’s work. First, many women are paid less than men or the sameproductivity within a given job or occupation. This is particularly evident in the case o
dierent starting salaries or men and women. Second, women are still oten concentratedin jobs or occupations which are themselves undervalued, such as domestic work. Evenwhen requiring higher qualications and more complex work, emale-dominated occupa-
58 This economic surplus or “rent” arises as a result o rictions and idiosyncrasies (or “labour market imperec-tions”) , which explain that it takes time and money or a worker to nd another employer who is a good substitute,and that it is also costly or employers to nd other workers who are good substitutes. In act, a growing body o eco-nomic literature now takes imperect competition as a starting point or analysis. See or example Manning (2003,2010); Boeri and van Ours (2008); Kauman (2007); and see also Ashenelter et al. (2010) and other contributionsto the special issue o Journal o Labor Economics, 28(2).
59 See ILO (2008a).
60 For instance, see Manning (2010) and Ransom and Oaxaca (2010).

7/31/2019 Global Wage Report
http://slidepdf.com/reader/full/global-wage-report 68/139
51PART II The role of wage polices
tions are sometimes lower paid than male-dominated occupations (see table 4 or dierentexplanations about the high risk o low-paid employment among women workers).
Undervaluation aects all groups o women in the labour market and henceexplains part o the gender pay gap in many countries, but women with relatively lowlevels o ormal education are especially at risk o suering rom a lack o recogni-tion o their skills, experience and responsibilities. Perhaps the archetypal example o undervalued, low-wage women’s work is paid care work, which involves the complexinteraction between gender relations, amily structure, emotional labour and employ-ment relations.61 Studies show that care work tends to be devalued, despite evidencethat emotional work is psychologically stressul, in part because it is associated with
discriminatory notions o “women’s work”, where care work is denigrated even amongriends and amily o emale care workers.62
Table 4 Dierent reasons why women are more vulnerable to low wages:Arguments and implications rom a literature review
Argument Key principles Implications or low-wage work
1. Women’s work may be undervalued
because women’s economic lives
ollow dierent patterns
Low valuation o skill and status
Low valuation because women assumed
to be second earners
Low valuation because women
concentrated in low-paying rms in the
secondary labour market
Low valuation because women’s livesperceived to ollow dierent patterns to
men’s, obliging non-commensurate orms
o work (e.g. part-time)
Women’s skills in caring work regarded
as “natural”, deriving rom women’s role as
mothers/carers; low pay thereore justied
by high job satisaction o women in caring
jobs
Women’s low pay results rom concentration
in low value added industries
Women’s low pay justied as “pin money”
since male partner’s wage accounts or bulk
o household income
Women’s low pay in part-time jobs
refects a notion that part-time work is
non-commensurate with men’s work
2. Women tend to have a lower
reservation wage than men
Gender bias in eligibility rules or
unemployment benets and social
protection in general (e.g. hours/earnings
thresholds, duration o employment, etc.)
Insucient maternity protection
Gender inequality in dependence on amily
income (especially during periods o
child-rearing)
Lower reservation position (through weaker
claims to unemployment benets/assistance
and lower social benets, including
maternity protection) weakens women’s wage
bargaining position compared to men
Low wages or women in part-time work
especially infuenced by their limited
eligibility to unemployment benets/ assistance
Presumption o amily income pooling
(transer o income rom male employed
partner) seen to justiy discriminatory
notions o women’s low pay as “pin money”
and urther penalizing o single emale
headed households
61
See, or example, England (2005); Folbre (2001); Wharton (1999); Zelizer (2002).62 See Lee-Trewheek (1997); Hochschild (1983).

7/31/2019 Global Wage Report
http://slidepdf.com/reader/full/global-wage-report 69/139
52 Global Wage Report 2010 / 11
Argument Key principles Implications or low-wage work
3. Gender-bias in wage-setting institutions
may have uneven gender eects
Female-dominated sectors and occupations
less likely to be covered
Statutory national minimum wage more
likely to benet women’s pay than men’s
Positive impact on gender pay equity in
the more centralized public sector wage
systems
Women’s low pay in emale-dominated
sectors shaped by lack o collective
bargaining coverage
Collective agreements in emale-dominated
sectors may have lower minimum rates than
in male-dominated sectors
Female part-timers most likely to be
excluded rom collective bargaining
coverage, weakening pay prospects
Women’s low pay uplited (and gender
pay gap narrowed) by raising the statutory
minimum wage
4. Women are oten disadvantaged
by independent workplace eects
(i.e. by workplace-specifc practices)
Ability and willingness o employer to pay
varying levels o wages according
to the gender composition o workplace
Monopsonistic employer power
Barriers to women’s mobility exposes their
risk o exploitation
Inter-rm contracting and cost
minimization in emale-dominated private
services
Women’s low pay may result rom
concentration in rms with less economic
rent
Low pay reinorced by strong monopsonist
employers (e.g. or care work, unqualied
nursing)
Risk o low pay may be higher in emale-
dominated (and part-time dominated)
workplaces
Cost-minimizing outsourcing o low-skill
activities puts downwards pressureon emale-dominated, low-wage jobs
(e.g. cleaning, catering) despite protability
o large client rms
Source: Adapted rom Grimshaw (2010).
Undervaluation o work is not limited to the gender dimension but is airly common,particularly in combination with certain characteristics o workers. For instance, inChina, the risk o low pay is more than three times higher or migrant workers than orlocal workers. It is not dicult to see that such a discrepancy is partly due to dier-
ences in “human capital” (e.g. education and training) or other job-related character-istics between the two groups o workers. Our analysis (based on the Oaxaca–Blinderdecomposition technique) shows that, in 2007, 59.6 per cent o the dierence betweenmigrant and local workers in the incidence o low pay is attributable to productivity-related actors (such as education, which alone explains 31.0 per cent o the dierence),while the sizable remainder o 40.4 per cent can be attributed to dierential treatments.63 This nding is largely in line with the increasing concern about migrant workers inChina, especially in relation to the Hukou (household registration) system.64
63 The results are robust to dierent model specications. See Deng and Li (2010).
64 See Jiang et al. (2009); Chen and Hou (2008).
Table 4 (continued)

7/31/2019 Global Wage Report
http://slidepdf.com/reader/full/global-wage-report 70/139
53PART II The role of wage polices
4.4 Vulnerable workers: Low-wage jobs
It has been argued that distributional dimensions are crucial or both normativeand economic reasons, and that policy interventions are needed in the presence o labour market imperections. The need or such policies is particularly strong in thecase o vulnerable workers who are exposed to low and unstable income and thussuer greatly during economic downturns. Policy eorts should be made to securedecent incomes or these vulnerable low-paid workers in both the level and stabilityo income.
Certainly, low pay might be less o a concern i it were only a transitory stageor young people rather than a persistent outcome or adults, whose social well-being
would be adversely aected or lie. Unortunately, evidence about the extent to whichlow-wage jobs are transitory or dead-end is rather mixed and cross-country varia-tions are also signicant.65 Figure 26 shows, or instance, that in European countries12-month transitions out o low-wage employment and into more highly paid jobs areonly experienced by one in three workers. Around hal o low-wage workers are still ina low-wage job the ollowing year and close to one in ve moves into an unpaid labourmarket status, such as inactivity or unemployment.66
Gender dierences are again notable, such that the opportunity to move out o low-wage jobs is relatively limited among women (26.1 per cent compared to 37.6 percent or men). This gender dierence in the risk o being trapped in low-wage employ-ment explains the high concentration o women in low-wage employment. It is also
interesting to note that there is a constant fow between non-employment and low-wageemployment and that this exit behaviour is particularly strong among emale low-wageearners (19.4 per cent compared to 16.5 per cent or men). To summarize, it appears tobe relatively easy or women to enter into low-wage employment, but relatively di-cult to move into better jobs.
There is considerable intercountry variation in mobility out o low-wage work,both in terms o 12-month transitions and the probability o transition over severalyears. Similar to the gender dierence noted above, one striking nding is that thosecountries with a relatively high incidence o low-wage work are also more likely toexperience smaller shares o low-wage workers progressing into higher paid work; thisnding suggests that countries with higher stocks o low-wage workers also ace prob-
lems o limited fows out o low-wage work, as illustrated in gure 27.The situation appears to be more dynamic in the ast-growing developing
countries. In China, or example, about hal o low-wage workers can move intohigher paid jobs within a year, while the risk o being caught in a trap betweennon-employment and low-wage jobs is relatively small. Similarly, in Brazil,44.2 per cent o low-paid workers were estimated to stay in low-paid jobs, while37.5 per cent succeeded in moving on to higher paid jobs. One important aspect o low pay in Brazil is the relatively high risk o being unemployed or inactive aterworking in low-paid jobs. About 18 per cent o low-paid workers were ound tobe in non-employment one year later. Not surprisingly, the risk o being trapped
65 See also International Labour Review (2009).
66 European Commission (2005).

7/31/2019 Global Wage Report
http://slidepdf.com/reader/full/global-wage-report 71/139
54 Global Wage Report 2010 / 11
in low-paid jobs or being inactive or unemployed is particularly high or womenand or those with low levels o education. The risk is also high or part-time and
domestic workers.
67
5 Wage policies
What can be done to improve labour market outcomes? Evidence shows that productiv-ity growth and education or all would be signicant steps in improving both the leveland the distribution o wages. This report has shown that productivity, in particular, isa key determinant o the level o wages, and that people with low education are at highrisk o ending up in low-paid work. At the same time, productivity growth and educa-
67 See Fontes and Pero (2010). Mobility patterns among low-wage workers in developing countries have beenpoorly understood. New evidence and insights on this subject in selected developing countries will be provided in aorthcoming edition o the International Labour Review.
100
80
90
70
60
50
40
30
20
10
0
T r a n s
i t i o n
r a t e ( % )
30.7 26.1
37.6
28.0
34.0
25.0 24.0 27.0
50.9
37.5
51.1 54.5
45.9
49.0
49.0
60.0
62.0 58.0
43.2
44.2
18.2 19.416.5
23.017.0 15.0 14.0 15.0
5.9
18.3
E U
( 1 9 9 5 –
2 0 0 1 ) ,
a l l w o r k e r s
E U
( 1 9 9 5 –
2 0 0 1 ) ,
w o m e n
E U
( 1 9 9 5 –
2 0 0 1 ) ,
m e n
D e n m a r k
( 1 9 9 5 –
2 0 0 1 )
F r a n c e
( 1 9 9 5 –
2 0 0 1 )
B r a z
i l
( 2 0 0 3 –
2 0 0 9 )
G e r m a n y
( 1 9 9 5 –
2 0 0 1 )
N e
t h e r l a n
d s
( 1 9 9 5 –
2 0 0 1 )
U n
i t e d K i n g
d o m
( 1 9 9 5 –
2 0 0 1 )
C h i n a
( 2 0 0 7 –
2 0 0 8 ) ,
l o c a
l w o r k e r s
Moving to higher wage jobsStaying in low-wage jobsNon-employment
Figure 26 Predicted transition rates rom low-wage jobs to higher wage jobs and non-employmentin selected countries (in per cent)
Note: The gures reer to the estimated probability o changes in earning status (higher wage jobs or non employment) within the period o one year among
low-wage workers.
Sources: European Commission (2004); Mason and Salverda (2010); ILO estimates or China and Brazil.

7/31/2019 Global Wage Report
http://slidepdf.com/reader/full/global-wage-report 72/139
55PART II Wage policies
tion alone are insucient to explain all the variations across dierent countries’ wageoutcomes. This is why the present report argues that a number o key labour and socialpolicy measures are also necessary to improve wage outcomes, labour market perorm-ance and overall macroeconomic results.
Some o these policies are highlighted in gure 28.68 They range rom collectivebargaining and minimum wages to in-work benets and other income support poli-cies. Altogether, these policies should be placed within the overarching regulatory
ramework which aims to address the discriminatory practices which at least partiallyaccount or wage inequality and low pay. While collective bargaining benets all work-ers who are covered and can contribute to an improved link between wage growthand productivity growth, the minimum wage is a policy tool to provide an eectivebackstop at the lower end o the wage distribution. In-work benets can provide incen-tives or workers to take up low-paid jobs by providing additional income through taxcredits or other schemes. And, nally, broader income transers, which are unrelated toemployment status, are necessary to reach the poorest households. Taken together, thesemeasures can promote more inclusive labour markets, stable consumption demand and,ultimately, a more sustainable economic growth. The next sections will discuss thesepolicies in more detail, highlighting the potential, but also the challenges aced, in
68 Because o space limitation, one important policy measure concerning education and training is not discussed inthis report. For details see Grimshaw (2010).
8 10 12 14 16 18 20
24
26
32
34
36
40
38
Incidence of low pay (%)
GRIT
DK
BE
AVG
NL
IE
ES
UK
FR
DE
AT
FI PT
S h a r e o f l o w p a i d m o v i n
g t o h i g h e r p a i d j o b s
30
28
Figure 27 Incidence o low-wage employment and mobility in European countries
Note: Incidence o low pay reers to 2000 ECHP data; mobility data reer to 12-month transition based on an average or pooled 1994–2001 data.
Source: Compiled using published data rom European Commission (2004, tables 51 and 55); Grimshaw (2010).

7/31/2019 Global Wage Report
http://slidepdf.com/reader/full/global-wage-report 73/139
56 Global Wage Report 2010 / 11
implementing these policies. One particular challenge is to structure the system in sucha way as to ensure that synergies between these policies are maximized and to avoid thesituation where one set o policies undoes the benets o another.
5.1 Collective bargaining
Collecve bgnng nd vege wges
Collective bargaining has a crucial impact on the link between overall wages andproductivity growth, and will thereore play a vital part in the recovery process. TheGlobal Wage Report 2008/09 calculated that, beore the crisis (or the period rom 1995to 2007), the growth in average wages generally lagged behind the growth in GDP percapita. The report ound that each 1 per cent increase in the annual GDP per capita wasassociated, on average, with a 0.75 per cent increase in average wages. This so-called“wage elasticity” o 0.75 was interpreted as an indication that increases in productiv-ity ailed to translate ully into higher wages. Another key result was the nding thatthe connection between wages and productivity was more apparent in countries where
collective bargaining covers more than 30 per cent o employees. In particular, wecalculated that a 1 per cent increase in the annual GDP per capita translated into averagewage growth o 0.87 per cent in countries with superior collective bargaining coverage,compared to wage growth o only 0.65 per cent in countries with weak coverage. 69
Recent examples show that the role o unions in linking average monthly wages tolabour productivity also remains strong in periods o crisis. It is interesting to see, orexample, that Germany’s response to the crisis seems to have reinorced its core institu-tions and the willingness o major stakeholders to work together. With the help o statesubsidies, employers kept their long-term commitments to core workers and, in return,trade unions and work councils agreed to make concessions in terms o pay and work-
69 Collective bargaining is also a critical method or addressing the gender pay gap in wage negotiations. See theJoint Working Papers on “Gender equality and social dialogue in selected countries” (ILO, orthcoming).
Sustainable
economic growth
Wages Non-wage
benefits
High income
Solid, equitable wage growth
More inclusive labour market
Stable consumption demands
Low income Vulnerable, low-pay jobs
Income
support
Minimum
wages*
Collective bargaining
In-work
benefits
Figure 28 Sound wage policies make a dierence: An illustration
* In some countries, minimum wages are xed by collective bargaining at sectoral or national levels.

7/31/2019 Global Wage Report
http://slidepdf.com/reader/full/global-wage-report 74/139
57PART II Wage policies
ing conditions (see box 6).70 Industry-wide collective bargaining also brought aboutconsiderable real wage cuts.71 The model o close cooperation explains, at least in part,the low number o job losses during the crisis, in spite o a sharp economic contraction.The question is how employment security achieved through wage restraint will aectaggregate demand, and what impact this will have – together with Germany’s ability tomaintain strong exports – on the pace o the recovery rom recession. 72
The German experience contrasts with that o other countries, including countriesin Central and Eastern Europe, where cutting employment shortly ater the beginningo the crisis was the typical reaction in enterprises, and where wage and hours adjust-ment played a marginal role. This can be explained by the act that institutions encour-
aging the combination o employment, hours and wage adjustment are underdevelopedin many countries. Experience rom Hungary shows, or example, that between May2008 and May 2009, rms covered by collective agreements shed slightly ewer jobsthan other rms o the same size. 73 However, because o the small raction o work-ers covered by collective bargaining, the typical adjustment in private sector enter-prises was to keep hours and nominal wages constant, while reducing employmentlevels. Overall, these examples show that collective bargaining can strengthen the linkbetween wages and productivity, even in times o crisis, and hence contribute to morerather than less fexible labour markets. Collective bargaining will also help to ensurethat wages recover when economic indicators improve.
Collecve bgnng nd low py Collective bargaining not only strengthens the link between wages and productivity,it also helps to reduce inequality. The Global Wage Report 2008/09 showed that high-coverage countries have signicantly less wage inequality than low-coverage countries,both overall and in the lower hal o the wage distribution. By reducing the dispersion o wages and by raising wage foors, collective bargaining can contribute to reducing therisk o low pay (i.e. through wage compression).74 A review o evidence or 20 OECDcountries shows, or example, that there is a strong negative correlation between theincidence o low-wage employment and several variables that measure the regulatorystrength o wage-setting institutions.75 For the countries covered, the simple one-varia-ble regressions show that an increase o 1 per cent in union density (the share o union
members as a proportion o employees) is associated with a 1.5 per cent reduction inthe incidence o low-wage employment.
While data limitations make it dicult to generalize this nding at the global level,gure 29 shows that higher union membership is correlated with a lower incidence o
70 See Beck and Scherrer (2010).
71 The industry-level agreements oten included clauses which allowed the actual implementation o the wageagreements at the industry level to be negotiated at an enterprise level, providing additional fexibility to rms andworkers in distress (“opening clauses”).
72 See Flassbeck (2010).
73 See Köllo (orthcoming).
74 For a literature review, see Hayter and Weinberg (orthcoming).
75 Luciora et al. (2005).

7/31/2019 Global Wage Report
http://slidepdf.com/reader/full/global-wage-report 75/139
58 Global Wage Report 2010 / 11
Box 6 Germany: Bargaining over short-time work
In Germany, the nancial crisis gave rise to sharp declines in orders and to considerable liquidity
shortages. Even or healthy companies, it became increasingly dicult to obtain credit, so that
immediate cost reductions became the main ocus o company policy. The Government and social
partners have prevented higher unemployment through a combination o dierent orms o working-
time reduction.
At the beginning o the crisis, companies used the cheapest orms o working-time reductions (i.e.
cuts in overtime and the use o working-time accounts). Almost hal o German companies had
introduced working-time accounts in recent years and, in the economic boom years between 2005and 2008, these accounts accrued substantial credits. At the beginning o the crisis, these credits
were worked o and overtime was reduced.
When these measures were exhausted, policy-makers relaxed the conditions o the short-time work
(or “Kurzarbeit”) scheme. Under this scheme, companies which temporarily reduce the working
hours o their employees can apply or wage subsidies (67 per cent o monthly net income or
hours not worked). Policy-makers extended the maximum period or claiming subsidies rom six
to 24 months until the end o 2010. They also reduced the employers’ share o the costs by reim-
bursing employers’ social security contributions rom the seventh month onwards (or rom the rst
month i companies provided training). In some instances, the social partners negotiated improve-
ments in the short-time working allowance. In some collective bargaining areas, particularly in the
metalworking and chemical industries, an agreement on topping up the allowance to 90 per cent othe previous net wage was concluded.
The use o the scheme reached a peak in May 2009, when 1,516,000 workers (mostly in manu-
acturing) were on short time, with an estimated average decline in hours worked o 31 per cent.
Although short-time working is not without costs or companies (employers have to pay social
security contributions or the rst six months as well as wages on public holidays and during annual
leave), the alternative – namely the costs o redundancies and hiring new employees ater the
recession – are oten even more expensive. With average redundancy payments and hiring costs or
skilled workers, 500,000 redundancies during the crisis and re-employing a corresponding number
o workers ater the crisis would have cost rms a total o €22 billion. Short-time work, by contrast,
is estimated to have cost rms €5 billion, while the Federal Labour Agency paid €6 billion (Institut
ür Arbeitsmarkt und Berusorschung).
I sta requirements are expected to reach similar levels again in the uture, short-term working
is attractive to both rms and workers. This is why short-time working has been used as a buer
or short-term fuctuations in Germany ever since 1924. The programme can be used fexibly
depending on the economic circumstances. In times o severe economic crisis, conditions can be
relaxed, while in boom periods the rules can be tightened to prevent companies rom using the
scheme simply to postpone employment decisions.
Source: Proessor Gerhard Bosch, Institute or Labour and Skills, University Duisburg-Essen, in Vaughan- Whitehead (ed.) (orthcoming).

7/31/2019 Global Wage Report
http://slidepdf.com/reader/full/global-wage-report 76/139
59PART II Wage policies
low pay in the countries or which both sets o data are available. We estimate that incountries with a union density o less than 15 per cent, the incidence o low pay is, onaverage, close to 25 per cent. This low-pay incidence is reduced by 3 percentage pointsor the countries with a medium level o union density (between 15 and 50 per cent) andis almost halved to 12.3 per cent in countries with high coverage (higher than 50 percent). It is striking that the eects o union membership become particularly strong
when the majority o workers are aliated with trade unions, in comparison to therelatively small dierence between the countries with low and medium levels.
the chllenge o nclusve sysems
One particular challenge or policy-makers seeking to maximize the eects o collectivebargaining is to design inclusive systems which cover the maximum number o people. 76 Through either active coordination o wage agreements or government use o extensionmechanisms, inclusive systems can spread the benets o collective bargaining agree-ments to rms across an entire sector. Hence, such systems are able to extend the wageagreements o the relatively powerul groups o workers to those in weaker positions. 77
76 See Grimshaw (2010) or a review.
77 Bosch et al. (2010).
30
25
20
15
10
5
0Less than 15%
24.6
15–50%
Union membership
Higher than 50%
U n i o n d e n s
i t y ( % )
21.6
12.3
Figure 29 The average incidence o low pay by trade union density in 33 countries, 2009 or latestyear (in per cent)
Notes: The averages reer to the men averages o national average incidences. For low-pay incidences, the latest available gures are used. For country cover-
age, see gure 21 (concerning global comparison o low pay).
Source: Hayter and Stoevska (2010) or union density data; ILO Global Wage Database.

7/31/2019 Global Wage Report
http://slidepdf.com/reader/full/global-wage-report 77/139
60 Global Wage Report 2010 / 11
This potentially encompasses rms where union membership is weak or workplaceproductivity is relatively low, and discourages business strategies such as outsourcingto non-unionized rms in order to save on labour costs. In addition, inclusive systemstend to “take wages out o competition”. This encourages domestic competition amongrms on the basis o quality rather than price and reduces pressure on rms to restrainwage growth. Evidence also shows that, in general, coordination and centralization cansignicantly reduce the incidence o low pay.78 In practice, however, designing inclu-sive systems has proven challenging or at least three reasons.
First, inclusive systems generally imply wage determination at the sector level,possibly with urther coordination among sectors. At this higher level, social partners
are able to negotiate wage and job rules that relate to the wider occupational identity o the workorce, limiting employer (and union) infuence on pay within the workplace.79 At the same time, there are limits to how ar such a model can protect against low-wage employment. Contemporary globalization and the internationalization o productmarkets make it dicult to take wages out o competition, unless cross-national wagesettlements can be ormed. Industry wage agreements also depend upon employermembership o associations, which can be dicult to sustain, especially where lead-ing rms in a sector may be oreign-owned rms with home-country oriented wagebargaining strategies.
Second, it also remains a challenge or trade unions to organize low-paid workers.Low participation rates o women in workers’ organizations compound this challenge.
The rather moderate eect o a shit rom low coverage to medium coverage on theincidence o low pay shown in gure 29 may be related to the act that, even in countrieswith medium coverage, ew low-paid workers are union members. This may, at leastin part, be explained by the act that many low-paid workers do not have a recognizedemployment relationship. As an illustration, gure 30 shows the proportion o low-paidworkers who are union members in the Republic o Korea, a country with low uniondensity, and in South Arica, a country with medium union density. In both countries,union membership among low-paid workers is low. This is particularly striking in theRepublic o Korea, where overall union membership ell to 12.2 per cent in 2009 andwhere union membership is almost non-existent among low-paid workers (2.2 per cent).But even in South Arica, where about 31.4 per cent o wage earners were estimated tobelong to trade unions in 2007, union membership is much lower among low-paid work-ers. Union density among low-wage workers was only slightly higher than one-third o the national average (13.2 per cent), which itsel represents a signicant decrease rom17.0 per cent in 1995.80 Similar trends are observed or Brazil and Indonesia.
Third, inclusive systems depend not only on the level o union density but also onthe existence o mechanisms to extend collective agreements to unorganized workers.This point is particularly important in the light o the act that low-wage workers otenhave great diculty in organizing or joining existing unions (see box 7 on the case o domestic workers). While this remains problematic, a number o promising experiments
78 See, or example, Luciora et al. (2005).
79 See Brown (2010).
80 Oosthuizen and Goga (2010); see also Altman (2006).

7/31/2019 Global Wage Report
http://slidepdf.com/reader/full/global-wage-report 78/139
61PART II Wage policies
have been attempted in recent years. In India (state o West Bengal), or example, oneimportant reason or the relatively high collective bargaining coverage is linked to theincreasing inclusion o unorganized sector workers into the ambit o industry-widecollective bargaining. So, or example, many small units in the sponge iron industry,
cold storage enterprises and hosiery workers have now been covered as a result o theGovernment acilitating the signing o agreements in industries previously not coveredby collective agreements.81 Similarly in Uruguay, where labour relations have changedsignicantly since 2005, a wage council or domestic work was created in August 2008in which workers and employers (represented by the League o Housewives82) negoti-ated their rst ever wage agreement. In the same country, the Government also createdbargaining institutions or rural workers and employers, where wages have been nego-tiated or workers in sugar cane plantations, rice plantations, vineyards, orestry and thearming sector (box 8).83
81 Sen (2009).
82 Liga de Amas de Casa
83 Mazzuchi (2009).
0
5
10
15
45
20
25
30
35
40
A l l w a g e e a r n e r s
South Africa (2007) Republic of Korea (2009) Indonesia (2007) Brazil (2008)
L o w - w a g e e a r n e r s
M i d - w a g e e a r n e r s
M i d - w a g e e a r n e r s
H i g h - w a g e e a r n e r s
L o w - w a g e e a r n e r s
M i d - w a g e e a r n e r s
H i g h - w a g e e a r n e r s
L o w - w a g e e a r n e r s
H i g h - w a g e e a r n e r s
L o w - w a g e e a r n e r s
13.2
31.4
2.2
8.7
27.4
4.3
9.9
19.7
16.6
24.4
39.4
U n i o n m e m b e r
s h i p ( % o
f w o r k e r s )
Figure 30 Union membership by pay level in our selected countries (as percentage o workers)
Note: Mid-wage earners reers to workers earning between 2/3 and 4/3 o the median wages. All the gures reer to union members as a percentage o total wage
earners, except Brazil where only ormal wage earners are considered.
Source: ILO estimates rom national labour orce surveys (“national technical reports” and estimation by Janine Berg or Brazil).

7/31/2019 Global Wage Report
http://slidepdf.com/reader/full/global-wage-report 79/139
62 Global Wage Report 2010 / 11
Box 7 Collective bargaining or domestic workers: Is it possible?
Domestic work is one o the oldest occupations or women in many countries. Recent surveys in
ten Latin American countries show that domestic work represents on average more than 6 per cent
o total employment, and almost 15 per cent o women’s employment. On the assumption that the
same averages apply to other countries in the region, we can estimate that there are about 16 mil-
lion domestic workers in Latin America and the Caribbean. Although in some countries a signicant
number o men are employed as gardeners, guards or chaueurs, an overwhelming majority o
around 90 per cent o domestic workers are women.
Table B3 Domestic workers as a percentage o total employment by sexTotal Men Women Year o data
Argentina 7.9 0.3 18.3 2006
Bolivia 6.1 0.4 13.2 2000
Brazil 7.7 0.9 17.1 2005
Chile 6.1 0.9 15.8 2002
Costa Rica 7.2 1.2 17.8 2006
Ecuador 4.2 0.4 9.8 2006
El Salvador 5.0 0.8 10.6 2006
Mexico 4.2 0.5 10.3 2006
Panama 6.2 1.0 15.5 2006
Uruguay 8.7 1.4 18.9 2006
Average 6.3 0.8 14.7
Data on wages conrm that domestic work is oten poorly paid, and this report highlights the high
risk o low pay or domestic workers. In rapidly growing countries such as Brazil and South Arica,
domestic work has become one o the key sources o low-wage work. One reason is that the work o
domestic workers is typically undervalued because it includes activities such as cooking, cleaning
or taking care o children, which are seen as gendered amily responsibilities. Another reason is
the deeply rooted historical tendency to remunerate domestic workers by payments in kind. For
live-in domestic workers, ood and lodging has always been considered as in-kind remuneration. On
average, across a sample o 11 countries rom the region, the wages o domestic workers stand at
less than hal (46 per cent) o average wages.
In recent years, domestic workers have increasingly acted collectively. In Brazil, or example, a National
Federation o Domestic Workers (FENATRAD) was created in 1997 and now has 35 union afliations.
In Uruguay, the establishment o a new tripartite wage board to negotiate wages and conditions o
work gave urther impetus to the consolidation o workers’ and employers’ organizations representing
domestic workers and their employers. Overall, the Latin America and Caribbean Conederation o
Household Workers (CONLACTRAHO), which was ounded in 1988 on what is now Domestic Workers’
Day in much o the region (30 March), has member organizations rom 13 countries. In general,
however, the isolation o domestic workers in households, their poor working conditions and low pay,
as well as the corresponding limited resources o their organizations, make it a real challenge or
domestic workers to organize, limiting their ability to negotiate collectively or higher wages.
Source: ILO (2010c) and ILO SIALC.

7/31/2019 Global Wage Report
http://slidepdf.com/reader/full/global-wage-report 80/139
63PART II Wage policies
5.2 Minimum wages
In light o the challenges conronting unions trying to reach out to low-paid workers,minimum wages can play an important complementary role. Ater years o consciousneglect during the 1980s and 1990s, our previous Global Wage Report 2008/09 providedindications o a more vigorous use o minimum wage policies in both developed anddeveloping countries. Among developed countries, the United Kingdom (1999), Ireland(2000) and Austria (2009) all introduced a national minimum wage during the past ten
years or so. In the United Kingdom, this was done in light o the increase in childpoverty, as well as part o an attempt to implement policies to attract more adults intothe labour orce by “making work pay”. Developing countries, too, increasingly rely
Box 8 Reintroduction o wage councils in Uruguay
Ater more than a decade’s absence, in March 2005 a new government reintroduced the wage
council system to determine minimum wages by sector o activity. Initially, these tripartite councils
were organized around 20 economic groups, and 170 subgroups, with the responsibility or setting
minimum wages by category or each subsector. Negotiations in all sectors took place simultane-
ously and took into consideration guidelines issued by the Ministry o Economy. The agreements
were extended to the whole sector through presidential decrees.
During the period 2005–09, three rounds o negotiation took place. While the rst agreement was
o only one year’s duration and included two adjustments, the ollowing rounds extended the dura-
tion o the agreements and reduced the requency o wage adjustments, as well as including more
alternatives or dierentiation. The guidelines proposed a range o increases, based on expected
infation and economic perormance. Finally, the last round took place during the second hal o
2008, when the nancial crisis emerged and there was great uncertainty concerning how it would
aect the dierent economic sectors in Uruguay. To address this concern, the government included
a contingency clause in every agreement, establishing that, i economic developments shited, a
revision o the agreements would be possible.
At the time o wage council reintroduction, Uruguay was just coming out o the deepest recession
in its recent history, with very high unemployment (18 per cent in 2002 and 2003) and a dramatic
reduction o real wages (around –22 per cent between 2001 and 2004). Economic recovery was
strong, beneting rom the international context. Including 2009 (the year o international nancial
crisis), economic growth averaged 6 per cent per annum during 2005–09. The employment rateincreased rom 51.5 per cent in 2004 to 58.6 per cent in 2009, resulting in a drop in unemploy-
ment to 7.6 per cent in that nal year. The recovery o wages was also impressive, with a real annual
increase o 5 per cent. Last, but not least, all these results were reached while maintaining scal
and price stability.
During this period, the wage councils operated as a sectoral bargaining system, with strong coor-
dination provided by the guidelines and supervision o the Government. This system managed to
achieve economic recovery, as well as an improvement in employment take-up and wages, bringing
into question the understanding that there is an inevitable sequence which requires consolidated
growth rst, ollowed by employment creation and only nally by wage improvement. In act, the
strong recovery o wages and employment appears to have played a key role in the signicant eco-
nomic growth experienced.

7/31/2019 Global Wage Report
http://slidepdf.com/reader/full/global-wage-report 81/139
64 Global Wage Report 2010 / 11
on minimum wages. Regional players, such as Brazil, China and South Arica, are allamong the main drivers o this trend. South Arica, or example, introduced new mini-mum wage foors in 2002 to support the wages o millions o low-paid workers in avariety o economic sectors, including domestic workers. China issued new regulationson minimum wages in 2004. Overall, minimum wages are applied in about 90 per cento countries in the world.
recen ends
The trend towards reconsideration o minimum wages has continued during the pasttwo years. In June 2009, ILO Member States adopted a Global Jobs Pact, which
encourages governments to consider options such as minimum wages that can reducepoverty and inequity, increase demand and contribute to economic stability – empha-sizing also that minimum wages should be regularly reviewed and updated. Later, thetripartite actors rom various Central and Eastern European countries recognized, inNovember 2009,84 the insucient development o wage institutions and agreed on theneed to have minimum wages as a wage foor to protect the most vulnerable workers.The same conclusion was reached by the tripartite delegations in the countries o theCaucasus and central Asia.85 In Western Europe, too, there is a growing public debateon the possibility o using statutory minimum wages in countries which have tradition-ally relied exclusively on collective agreements.
During the crisis, low aggregate demand and high unemployment in advanced
countries have oten limited the scope or governments and social partners to negoti-ate higher minimum wages. To individual employers, an increase in wages which isnot oset by a corresponding rise in productivity can be problematic, particularly intimes o increased competitive pressures. At the same time, as an ILO report to the G20points out,86 the role o statutory minimum wage systems in protecting low-paid workersis well-recognized, including during periods o recession and weak recovery. Indeed,even during periods o economic diculty, there are strong reasons or governments towant to protect the consumption levels o the lowest paid workers or both economicgrowth and equity reasons. While in-work benet schemes act as a complement toincome rom work, mainly in the higher income countries, maintaining or preventing aall in the purchasing power o wages at the lower end o the spectrum is important to
avoid both a rise in poverty and an added downward twist to the recession.The extent to which minimum wages were uprated in 2009 diered widely across
countries. Overall, table 5 shows that about hal o the 108 countries in our sample letthe nominal value o their statutory minimum wage unchanged in 2009. This includescountries which have let their policy instrument dormant or several years or adjustedtheir rates only every two years, as well as countries which have decided to reezetemporarily their minimum wages in 2009. Among advanced countries, this course wasollowed, or example, in Australia, where the Fair Pay Commission roze the nationalminimum wage at A$543.78 per week in 2009, and in Ireland, where the rate has
84 ILO (2009c).
85 See ILO (2009d).
86 See ILO (2010b, p. 14).

7/31/2019 Global Wage Report
http://slidepdf.com/reader/full/global-wage-report 82/139
65PART II Wage policies
remained unchanged at €8.65 per hour since July 2007. Among developing countries,examples o rozen minimum wages include China, where minimum wage increaseswere suspended between the end o 2008 and early 2010. It should be noted, however,that some o these countries reactivated their minimum wages with early signs o therecovery. So, or example, Australia announced an increase in its national minimumwage to A$569.90 in July 2010. In China, where labour unrests have led to some highlypublicized strikes, Provincial Governments have raised minimum wages, sometimes
considerably. Bangladesh, too, increased minimum wages in the garment sector in2010, ater a spate o worker protests.
By contrast, the other hal o the 108 countries in our sample – including the major-ity o advanced countries – choose to increase minimum wages even in 2009, so as toimplement medium-term objectives or to prevent deterioration in the purchasing powero the lowest paid workers during the crisis. So, or example, Brazil, Japan, the RussianFederation, the United Kingdom and the United States all raised the minimum wagein 2009, in the midst o the crisis. In the United Kingdom, the Low Pay Commissionrecommended a cautious 1.2 per cent increase in the minimum wage, which sought toprotect both the real earnings o low-paid workers and their jobs. 87 The United Stateswent ahead with the objective o the 2007 Fair Minimum Wage Act to gradually increase
its ederal minimum wage rom US$5.15 per hour to US$7.25 per hour over three years.And Brazil increased its minimum wage by 12 per cent, compared to an infation rate o about 5 per cent in 2009. However, Brazil’s decision to considerably increase minimumwages remains an exception in Latin America. Table 6 shows that, within a sample o 11 Latin American countries which regularly adjust their minimum wages (usually oncea year), the majority has opted or adjustments that closely match past infation gures– thereby maintaining the purchasing power o minimum wage workers without increas-ing the burden on enterprises during this dicult period.
The desirability o maintaining or increasing wages at the bottom o the pay scale,in order to protect the purchasing power o low-paid workers and to counteract weak-ening aggregate demand, depends on the level at which minimum wages are set in the
87 See Low Pay Commission (2010).
Table 5 Minimum wages during the crisis
Number o countries with unchanged
minimum wages in 2009
Total number o countries
in the sample
Advanced countries 3 17
Central and Eastern Europe 3 15
Eastern Europe and Central Asia 3 8
Asia 10 11
Latin America and Caribbean 4 22
Arica 26 32
Middle East 2 3
Total 51 108
Source: ILO Global Wage Database.

7/31/2019 Global Wage Report
http://slidepdf.com/reader/full/global-wage-report 83/139
66 Global Wage Report 2010 / 11
rst place. ILO Convention No. 131, which considers that minimum wage systems arenecessary to protect wage earners against unduly low wages, calls or setting levelsthat take into consideration not only the needs o workers and their amilies – takinginto account the general level o wages in the country, the cost o living, social security
benets and the relative living standards o other social groups – but also economicactors, including the requirements o economic development, levels o productiv-ity and the desirability o attaining and maintaining a high level o employment. Theextent to which these actors are balanced can be approximated by some rough indi-cators, such as the level o the minimum wage relative to the median or mean wage,or the proportion o workers whose wages are aected by the statutory minimum. Inthe United Kingdom, or example, the minimum wage corresponds to about hal themedian wage, lower than the 60 per cent o median wages in France, but considerablyhigher than the 32.4 per cent o median wages in the United States. 88
While national perceptions about the ideal level or minimum wages can varyrom one country to the next, the rst rule o good practice is to involve social partners
in the determination o the adequate level. Specically, ILO Convention No. 131 callsor systems that involve representatives o organizations o employers and workers on abasis o equality, as well as independent experts with recognized competence or repre-senting the general interests o the country. A second rule o good practice involves theuse o reliable statistical and other empirical inormation to be used as a basis or nego-tiation among social partners. In the absence o tripartite institutions and empiricallybased determinations, countries run the risk o mismanaging minimum wages, settingthem either too high or too low. While there is no universal ormula or determiningthe ideal level, the ILO has recently been providing technical assistance at the requesto a growing number o governments and social partners around the world (see table 7)who recognize that setting the level o the minimum wage is an act o balance which
88 See Low Pay Commission (2010).
Table 6 Minimum wages and ination in selected countries in Latin America (in percentages)
Ination during past period o minimum
wage application (%)
Latest nominal adjustment in minimum
wage (%)
Bolivia 11.8 12.0
Brazil 5.4 12.0
Chile 1.8 3.2
Costa Rica 6.9 9.1
Colombia 7.7 7.7
Ecuador 8.8 9.0
Guatemala 9.4 7.2
Honduras 10.8 100
Mexico 6.5 4.6
Uruguay 3.6 7.0
Venezuela 27.7 10.0
Source: Pnom Lbol 2009 , ILO (2009e).

7/31/2019 Global Wage Report
http://slidepdf.com/reader/full/global-wage-report 84/139
67PART II Wage policies
requires the use o reliable economic and statistical indicators and careul monitoringo the labour market and o the impact o minimum wages on employment (see box 9on the trade-os between minimum wages and employment).
Cn mnmum wges educe low py?
One way o looking at the eectiveness o minimum wages is to look at how the incidenceo low-wage employment responds to changes in minimum wages. Figure 31 shows, orexample, how low-pay incidence has evolved in relation to changes in minimum wagesin Brazil, Chile, Indonesia and the Republic o Korea. The ratio o minimum wages to
median wages (known as the Kaitz index) is used to measure the “bite” o minimumwages. The cases o Brazil and Chile show both steady increases in minimum wages andconsistent reductions in low-wage employment. This association suggests that adjust-ments to increase the relative level o minimum wages have helped to reduce low-wageemployment in both countries. In Brazil, a logistic regression analysis presented in abackground study to this report shows that active adjustments in minimum wages wereone o the critical determining actors which allowed low-wage earners to move up tohigher wages.89 By contrast, the cases o Indonesia and the Republic o Korea show bothlow minimum wages and a stagnating or increasing low-pay incidence. In Korea, therelative level o minimum wages has gradually increased but still remains low at 25 percent o median wages, while low-wage employment has grown to exceed 25 per cent.
89 See Fontes and Pero (2010).
Table 7 Recent developments in minimum wage policies in selected countries
Country Issue
Armenia Improving institutional systems or minimum wage xing and pay determination
system in the public sector
Burundi Harmonization o public sector pay scales ollowing strikes o medical doctors,
and exploration o development o national wage policy
Cape Verde Possible rst-time introduction o a national minimum wage towards the end
o 2010
China Improving wage-xing institutional set-up in broader context o readjusting wage
distribution and reorming collective bargaining practices
Costa Rica Involving academia to provide data and statistics as inputs to minimum wage
settingMongolia New law on minimum wages to come into eect in 2010, and capacity building
or evidence-based minimum wage determination
Paraguay Broadening the number o indicators, in addition to infation, that are used in
minimum wage setting
Philippines Improving current minimum wage system with the aim o protecting non-standard
workers
Tanzania, United Republic o Change rom national minimum wage to sectoral minimum wages. Zanzibar:
reorm with a view to making minimum wage policy more coherent
Viet Nam Reorming minimum wage and public sector pay
Source: ILO technical assistance work.

7/31/2019 Global Wage Report
http://slidepdf.com/reader/full/global-wage-report 85/139
68 Global Wage Report 2010 / 11
Box 9 Do minimum wages hurt employment?
One concern with minimum wages over the past decades has ocused on its unintended employ-
ment consequences. Standard textbooks usually explain that minimum wages introduce a “distor-
tion” into labour markets that inevitably translates into lower labour demand and, thus, into higher
unemployment or more inormal employment. This argument relies on the notion that labour and
product markets are perectly competitive, and that thereore rms take wages and prices as a given
(Neumark and Wascher, 2008, p. 39). These assumptions also underpin the views o economists
who argue that there should be no minimum wages, since they inadvertently hurt those very workers
they are intended to protect. While this negative impact may be unavoidable in cases where the
minimum wage is set too high, it does not necessarily apply when it is set at reasonable levels. The
standard argument has been increasingly challenged by economists who consider that markets are
never perectly competitive and that rms always have some market power. In such circumstances,
higher minimum wages do not necessarily lead to reduced employment (Manning, 2010, p. 54).
Under imperect competition, the costs o higher minimum wages can also be met through some
combination o reduced prots, redistribution o labour costs among workers within rms and higher
prices passed on to consumers. Also, rom a broader macroeconomic perspective, while minimum
wages may reduce employment or any unchanged level o aggregate demand, this may not be the
case i minimum wages shit aggregate demand upwards (Keynes, 2007, p. 259).
With the theoretical predictions o minimum wages hotly debated among economists, it is empirical
studies which ultimately matter. But, here again, the literature is polarized and the ndings are
sensitive to the methodologies that are used. So, or example, the comprehensive literature review
in Neumark and Wascher (2008) shows that the range o estimates o the employment eects o
minimum wages is very wide, ranging rom very negative eects to positive eects. The authors
themselves consider that “the preponderance o evidence supports the view that minimum wages
reduce the employment o low wage workers” (p. 104). Others, however, disagree with this interpre-
tation. Doucouliagos and Stanley (2009), who have perormed a quantitative analysis on minimum
wage research, conclude with an “overall nding o an insignicant employment eect (both practi-
cally and statistically) rom minimum wage raises” (p. 422).
In recent years, the latter view appears to have become dominant. In 2006, over 650 economists,
including ve Nobel prize winners and six past presidents o the American Economic Association,
issued a statement in which they made the proposition that increasing the minimum wage in the
United States “can signicantly improve the lives o low-income workers and their amilies, without
the adverse eects that critics have claimed” (EPI, 2006). Similarly, in the United Kingdom, the
Low Pay Commission stated that:
ten years ago, as the minimum wage was about to be introduced, it was just this ear o job losses that domi-
nated discussion. … In act, since the introduction o the National Minimum Wage, the Low Pay Commission
has been at the oreront o the search or evidence o any damage caused by the minimum wage to the
economy or to jobs. So ar we have not ound any signifcant negative eects, either in the work we have done
ourselves or in the work we have commissioned rom others. (Low Pay Commission, 2008, pp. vi–vii)
More recently, the OECD (2010) also concluded rom a sample o OECD countries that “the ratio o
the statutory minimum wage to the median wage is associated with no signicant alteration o gross
worker fows” and that “taking also into account the micro-economic literature, this suggests thatstatutory minimum wages have at best second-order impacts on labour reallocation” (p. 197).

7/31/2019 Global Wage Report
http://slidepdf.com/reader/full/global-wage-report 86/139
69PART II Wage policies
80
70
60
50
40
30
20
10
0
2 0 0 6
2 0 0 5
2 0 0 4
2 0 0 3
2 0 0 2
2 0 0 7
2 0 0 8
Minimum wages (Kaitz index)
Low-pay incidence (%)
80
70
60
50
40
30
20
10
0
2 0 0 6
2 0 0 5
2 0 0 4
2 0 0 3
2 0 0 0
2 0 0 1
2 0 0 2
2 0 0 7
2 0 0 8
Minimum wages (Kaitz index)
Low-pay incidence (%)
80
70
60
50
40
30
20
10
0
2 0 0 6
2 0 0 5
2 0 0 4
2 0 0 3
1 9 9 6
1 9 9 5
2 0 0 0
1 9 9 9
1 9 9 8
1 9 9 7
2 0 0 1
2 0 0 2
2 0 0 7
2 0 0 8
2 0 0 6
2 0 0 5
2 0 0 4
2 0 0 3
2 0 0 0
1 9 9 9
1 9 9 8
1 9 9 7
2 0 0 1
2 0 0 2
2 0 0 7
2 0 0 8
2 0 0 9
Minimum wages (Kaitz index)
Low-pay incidence (%)
80
70
60
50
40
30
20
10
0
Minimum wages (Kaitz index)
Low-pay incidence (%)
Panel A. Brazil (2002–08)
Panel C. Republic of Korea (1995–2009) Panel D. Indonesia (1997–2008)
Panel B. Chile (2002–08)
Figure 31 Minimum wages and the incidence o low pay in selected countries
Note: Kaitz index reers to the level o minimum wages relative to median wage earnings.
Source: ILO Global Wage Database; see Statistical appendix.

7/31/2019 Global Wage Report
http://slidepdf.com/reader/full/global-wage-report 87/139
70 Global Wage Report 2010 / 11
While these examples provide some sense o the eectiveness o minimum wages,the relationship between higher minimum wages and a reduced incidence o low payshould not be taken or granted. Due to the complexity o the channelling mechanism inwhich changes in minimum wages infuence low pay, it is oten dicult to determine theexact impact o minimum wages. For instance, in Indonesia (panel D in gure 31), changesin minimum wages are overall negatively correlated with those in low-pay incidence, butthe size o the eect is relatively small, especially given the substantial increases in theKaitz index since 2004. This can be explained by the act that the increase in the Kaitzindex was driven more by stagnating or even alling real average wages (in spite o strongeconomic growth) than by increasing minimum wages.90
The relationship between changes in minimum wages and low pay within acountry are not clearly revealed in cross-country comparisons. Figure 32 shows thatin a sample o 27 countries there exists no straightorward statistical relationshipbetween the level o minimum wages and the incidence o low pay. Thus, while coun-try experiences in Brazil and Chile show that minimum wages have great potentialor improving the situation o low-paid workers, the larger picture shows that thispotential is oten wasted. In practice, there are several reasons why the eectivenesso minimum wages may be limited.91 One obvious actor which can limit the impacto minimum wages is weak enorcement. Indeed, “simply legislating a minimumwage will not make it happen”.92 Weak implementation machinery – characterizedby ew labour inspectors, low probability o detection and/or light sanctions – will
oten result in large-scale non-compliance. A second actor is the sometimes weak orimperect coverage, whereby many vulnerable workers are excluded rom the socialprotection o minimum wage laws. Finally, even with broad coverage and genuineenorcement eorts, minimum wages in developing countries will always be moreeective in the ormal than in the inormal economy, where monitoring is dicultand where unregulated casual work is widespread. An additional actor is simply therisk o mismanagement; when minimum wages are set at an unrealistically high level,leading to either non-enorcement or displacement o low-paid workers into unem-ployment or inormal employment.
Taken together, all these actors explain why, particularly in developing countries,a large proportion o the workorce earns less than the statutory minimum wage. Someestimates suggest that, in Latin America, this proportion varies between less than 1 percent o workers to more than 45 per cent o all workers. This ratio is particularly highin countries which set unrealistically high minimum wages. The same problem is alsoobserved in other regions. In Thailand, or instance, about 25 per cent o workers inthe manuacturing sector were estimated to earn less than the minimum wage in 2009.Similar enorcement gaps are also reported or the Philippines. In China, the incidenceo remuneration below the minimum wage stands at 29.8 per cent or local workers in
90 In other words, the changes expressed in the Kaitz index overestimated the actual changes in minimum wages.The average growth in real minimum wages is estimated at 1.2 per cent or the period 2006–08.
91 See, or example, Appelbaum et al. (2003); Osterman (2008).
92 Murgai and Ravallion (2005, p. 2).

7/31/2019 Global Wage Report
http://slidepdf.com/reader/full/global-wage-report 88/139
71PART II Wage policies
2007, and was about twice as high in the case o migrant workers.93 Finally, in India, alarge number o workers earn less than the minimum wage (see box 10).
Another reason why the association between minimum wages and the share o low pay is imperect has to do with the denition o low pay as the share o wage earn-ers earning below two-thirds o median wages. In practice, ew minimum wages are setso high. Hence, the direct eect o minimum wages usually occurs within the groupo low-paid workers, reducing the distance between the beneciaries and median-wage earners. In such circumstances, minimum wages will only reduce the incidenceo low pay i they have a so-called “ripple eect” (or wage spillover eects), whichreers to wage increases at levels o pay above the statutory minimum wage, providedby employers to restore, at least partially, pay dierentials between workers earningthe minimum wage and those earning somewhat above the minimum. Such dieren-tials may underpin dierences in job status, seniority or skill and may be vital or thecollective sense o airness which eeds into workers’ morale and their commitment togood perormance.
93 For data on Latin America, see Cunningham (2007); or Thailand, see Chandoevwit (2010); or the Philippines,see Peralta and Guirao (2010); or China, see Deng and Li (2010).
0 20 40 60 80 100 120
0
10
40
50
60
Minimum wages as % of average wages
I n c i d e n c e o f l o w - w a g e e m p l o y m e n t ( % )
30
20
Figure 32 Cross-country comparison: Minimum wages and the incidence o low-wage employmentin 27 countries
Note: The gure uses the ratio o minimum to mean average wages rather than minimum to median wages (as in the Kaitz index) because median wages are
available only or a limited number o countries.
Source: ILO Global Wage Database; see Statistical appendix.

7/31/2019 Global Wage Report
http://slidepdf.com/reader/full/global-wage-report 89/139
72 Global Wage Report 2010 / 11
Box 10 The minimum wage debate in India
In India, the Minimum Wage Act o 1948 is considered to be one o the most important pieces o
labour legislation; but India’s system o minimum wages is also one o the most complex in the
world. The 1948 legislation determines that the “appropriate government” should x minimum
wage rates payable to employees in a number o listed (or “scheduled”) employments. This has at
least three important implications. First, minimum wages are set by either Central or State-level
authorities, depending on the type o company. Second, the minimum wage is set only “in certain
employments or occupations” and thereore not all wage earners are covered. And, third, there
now exists a large number o rates which sometimes dier widely across States, even or the same
occupation. This system has resulted in innumerable minimum wage rates, which are dicult tomonitor and enorce and are not applicable to all workers.
India’s complex system o minimum wages has generated substantial debate over the years. As
early as 1978, a study group known as the Bhoothlingam Committee had already proposed the
idea o an absolute national minimum wage, irrespective o sectors, regions or states, below which
no employment would be permitted. State Governments would remain ree, however, to set their
minimum wages above the absolute minimum. More recently, researchers such as Ghose (1997,
p. 698) also supported the idea o “a daily minimum wage or unskilled labour, irrespective o the
job or the sector in which it is employed and irrespective o the age or the gender o the supplier
o unskilled labour”. One step in this direction was made when the Central Government requested
that States determine minimum wage rates through consultations within ve regional committees
(or the Eastern, North Eastern, Southern, Northern and Western regions). Another step was madewhen the Central Government introduced the concept o an indicative national minimum wage foor
in 1996, set at 100 rupees or about US$2 per day since 2009. Yet, to this day, the national foor
is not binding on the States. In 2007, the Indian Trade Union Congress suggested thereore that a
national minimum wage be xed or all industries. This suggestion was made ollowing the observa-
tion that the country still suers rom high poverty and inequality despite achieving ast economic
growth in recent years.
Data simulations show that the eects o either making the national minimum wage foor compul-
sory or extending the coverage o State-level minimum wages would be considerable. The latest
employment–unemployment survey undertaken by the National Sample Survey Organisation in
2004–05 indicates that there are approximately 173 million wage earners throughout India, o
which 116 million are classied as casual workers. Estimates show that universal and perectlywell-enorced minimum wage coverage could benet up to 73 million workers, who are currently
paid less than the indicative national minimum wage foor. This suggests that extension o minimum
wage coverage in India could have a considerable impact. Since 30 to 40 per cent o low-paid wage
earners belong to poor amilies – and because women are paid less than men – the extension o
minimum wages could be a useul instrument or reducing both the gender pay gap and the high
poverty incidence in India.
Source: Belser and Rani (2010).

7/31/2019 Global Wage Report
http://slidepdf.com/reader/full/global-wage-report 90/139
73PART II Wage policies
Unlike minimum wage rises, ripple eects are not mandated.94 One o the majoruncertainties, thereore, both in designing models that seek to orecast the eects o a minimum wage rise on the wage bill and infation and in understanding the conse-quences o minimum wages or low-wage employment, relates to the variation in sizeo ripple eects. We can expect clear country dierences. For example, in countrieswhere workers tend to be covered by collective bargaining, it is likely that ripple eectsare signicant, since trade unions are in the position to negotiate changes to a ormalpay structure and may be particularly interested in building on the advantage presentedby a minimum wage rise and arguing or the restoration o wage dierentials relating todierences in experience, job responsibility, skill or qualication. In countries without
the protection o joint regulation o wages, it is likely that ripple eects will be consid-erably smaller. Prior to the introduction o a statutory national minimum wage in theUnited Kingdom, or example, Freeman (1996) pointed to the relatively weak infation-ary potential o minimum wage rises in the UK labour market precisely because rippleeects would be small – low union density and weak collective bargaining coveragewere “hardly the circumstances in which wage increases or largely part-time womenin small shops are likely to set o general infation” (p. 645).
Ripple eects have been investigated in detail in the recent collection o research stud-ies on minimum wages and living wages in the United States. 95 One analysis o the retailindustry, where the minimum wage has a strong bite, nds that the ripple eect extendsup to the 40th wage percentile, where the wage is 25 per cent higher than the minimum
wage.
96
At this level o wages, a 10 per cent rise in the minimum wage increases wages by1.4 per cent, pointing to a relatively strong compression eect o a rising minimum wageamong the lowest deciles o the wage distribution. One issue or policy consideration is thebalance between raising the wage foor relative to the median and the risk o increasing theconcentration o workers paid at or only slightly above the minimum wage. In the absenceo ripple eects, raising the minimum wage will not contribute much to reducing the shareo low-wage workers, unless, o course, the minimum wage exceeds the low-wage thresh-old. At the same time, however, i all pay dierentials are perectly restored all the way upthe wage scale, then the minimum wage rise ails in its redistributive objective.
Finally, while recognizing some empirical uncertainty about the impacts o mini-mum wages in light o the challenges in enorcement, imperect coverage and less thanully predictable ripple eects, a growing body o literature nevertheless points to theimportant role o minimum wage policies in combating gender-based pay discrimina-tion and addressing the vulnerability o women to becoming trapped in low-paid jobs.The contribution o minimum wages to improving women’s wages should be recog-nized as an objective in its own right, since women typically benet more than maleworkers rom minimum wages increases.97
94 Discussion on the ripple eect is based on Grimshaw (2010).
95 See Pollin et al. (2008).
96 See Wicks-Lim (2008, table 11.1); calculations incorporate both an immediate and a lagged eect.
97 See Rubery and Grimshaw (orthcoming). This argument is in stark contrast to the claim which describes womenas the main “victims” o minimum wages because o their negative impacts on emale employment. See Lee andMcCann (orthcoming) or urther discussion on this debate.

7/31/2019 Global Wage Report
http://slidepdf.com/reader/full/global-wage-report 91/139
74 Global Wage Report 2010 / 11
5.3 From minimum wages to minimum income or low-income households
Polces o weken he lnkge beween low py nd povey
One o the key concerns about low pay, especially in terms o its welare implications,is the risk that low-wage work will lead to poverty, in spite o a person being employedand working. The relationship between poverty and low pay is not straightorward,primarily due to the dierent denitions and the resulting dierences in measurements.As already pointed out, low pay is concerned with an individual’s gross wage earn-ings, while poverty is typically related to the net disposable income o a household ,adjusted or the size and composition o the household. 98 For this reason, low-paid
workers (such as young labour market entrants who are living with their parents) maynot be poor, particularly when they belong to higher-income households with multiple jobholders. Conversely, high-paid workers (such as heads o household) can be poor i they are the only breadwinner in a big amily with many dependants.
Despite these conceptual dierences, however, it is clear that low pay increasesthe probability o poverty. The risk o “in-work poverty” is illustrated in table 8, whichprovides estimates o poverty rates by pay level and employment status in China, wherethere has been much debate about the impact o high economic growth on poverty reduc-tion. The table clearly shows that poverty rates are lowest when a person is employedand receives a wage above two-thirds o the median. Low-paid work signicantly raisesthe probability o being in poverty. The dierence between local and migrant workersis striking. About 45 per cent o low-paid migrant workers are subject to poverty, whilethe risk is much smaller or local workers (5 per cent). For these migrant workers, theeect o transition to higher paid jobs is particularly noticeable, as only 13.9 per cento migrant workers with higher paid jobs live in poverty.
Given the relationship between low pay and poverty, one key policy concern ishow to weaken this linkage. Even when low pay is inevitable, policies can be imple-mented to alleviate the nancial diculties or the amilies o low-paid workers. Indeed,while measures which directly infuence wage outcomes, such as collective bargain-ing and minimum wages policies, play a useul role, the welare o low-paid workerscan also be improved through policies that increase net disposable income or poorhouseholds. In act, recent studies indicate that, in advanced countries, the relationshipbetween low pay and poverty has been weakened through a wide range o policy initia-tives targeting low-paid workers.99 In developing countries, given the massive extent o inormal employment, minimum wage policy needs to be combined with other incomepolicy measures aimed at the very bottom o the labour market, especially its inor-mal segment.100 In this respect, the real policy challenge is how to develop a coherentsystem in which both welare institutions and the labour market measures are devel-oped to secure a minimum level o income or poor households.
98 See Grimshaw (2010) or a review.
99 See, or example, Caroli and Gautié (2008) or France; see also OECD (2009b) and (2010).
100 See ILO (2008a); Lemos (2009).

7/31/2019 Global Wage Report
http://slidepdf.com/reader/full/global-wage-report 92/139
75PART II Wage policies
Wh polces? Scope nd poenl
In-work benets are good examples o measures to address low-paid employment.In-work benets are intended to provide nancial incentives or workers to take low-paid jobs by oering additional earnings, thereby reducing poverty. They may takethe orm o tax credits, wage-related transers or other lump-sum payments. 101 Amongthese, income tax credit schemes are airly common. As these schemes tend to includeelements o work incentive, the amount o the benets is typically a unction o grossincome with phase-in and phase-out elements. In other words, total benets rst tendto increase as income increases, then beyond a certain threshold remain fat, and nallybegin to all. Examples o such polices are provided in table 9.
The potential or these policies to improve the welare o low-wage workers, with-out compromising the volume o employment, is indeed well-documented and needsto be ully exploited in policy developments concerning low pay. Yet, some caveats arein order. First, it is important to note that not all these policies are working well andevidence is oten mixed.102 This means that eective design and implementation withclear goals and target groups are critical in ensuring that the intended benets reachlow-paid workers and their amilies.
Second, the welare-enhancing potentials o in-work benets should not be inter-preted as implying that they could replace minimum wages. As discussed earlier, thetwo sets o policies have dierent goals and channelling mechanisms: while minimumwages are intended to improve wage outcomes by addressing the ailure o labour
markets to provide decent pay, in-work benets are expected to weaken the nexus o low pay and poverty. More importantly, i in-work benets are seen as a kind o “wagesubsidy” (or example, i companies eel that they can shit some labour costs to taxcredits), there may be incentives or companies to cut wages or not to increase wages,or instance, despite positive productivity increases. In this case, the budgetary burdenrelating to in-work benets would be increasing. This possible vicious circle could beprevented by other complementary measures, such as the introduction o a wage foorthrough minimum wages, as has been illustrated by recent experiences in the United
101 For a review o policies in industrialized countries, see Immervoll and Pearson (2009).
102 OECD (2009b).
Table 8 Poverty rates by pay and employment in China, 2002–07 (in per cent)
Local workers
2002
Migrant workers
2002
Local workers
2007
Migrant workers
2007
Employed, low pay 2.7 64.1 4.8 45.4
Employed, higher pay 0.6 43.1 1.2 13.9
Unemployed 5.2 71.4 9.4 66.3
Notes: The threshold o US$1.25 per day is used, ollowing the new World Bank poverty line (Ravallion et al., 2008).
Source: ILO estimates; Deng and Li (2010).

7/31/2019 Global Wage Report
http://slidepdf.com/reader/full/global-wage-report 93/139
76 Global Wage Report 2010 / 11
Kingdom.103 Thereore, the key element o policies or low-paid workers is a well-coordinated policy package where minimum wages and in-work benets work in acomplementary way rather than deeating each other.
Finally, the introduction o in-work benet schemes may be challenging or devel-oping countries, especially during the crisis, given the massive size o the inormaleconomy and the existing budgetary constraints. Yet, despite the obvious constraints,recent experiences in developing countries show that their implementation is notentirely impossible.104 In the Philippines, or instance, “non-wage benets packages”were introduced during the economic crisis to improve income or low-wage earners.One o these packages is an exemption rom income tax payment, which was estimated
103 “In the decade prior to the establishment o the LPC [Low Pay Commission], wage inequality rose, and, simulta-neously, expenditure on tax credits (amily credits and amily income supplements) rose tenold. It was held that theExchequer was subsidizing employers through the provision o these in-work benets, and that such subsidies and
the associated Exchequer burden would be constrained by the introduction o a NMW [National Minimum Wage]”(Metcal, 2009, p. 300).
104 See ILO (2010d) or a review.
Table 9 In-work benefts programmes in selected industrialized countries
Country Programme Features
Belgium Bonus de l’emploi Reduction o social security payments or low-skilled or low-paid workers. In
determining the size o rebates, only earned individual income is considered.
Family situation is not considered.
Canada Working income tax benets Reundable tax credit or eligible low-income individuals and amilies. It is
typically calculated based on earned income, total income and amily situation.
France Prime pour l’emploi (PPE) Tax credit scheme or low-income households where at least one person has a
paid job and where the taxable income is below the ceiling (which is determined
in relation to minimum wages). It was introduced in 2001 with clear goals o
redistributing income to low-income amilies, thereby increasing their work
incentives. The exact amount o PPE is calculated on the basis o working time,
amily status and number o children, as well as taxable income.
Netherlands Employed persons’ tax credit Tax credit scheme which applies to all types o employment, including
sel-employment. Only earned income is considered and tax credits are applied
individually. The latter aspect is known to provide some nancial incentive or
part-time employment (and also to contribute to maintaining the net purchasing
power o minimum wage earners; see Salverda et al. 2008).
United Kingdom Working tax credit Means-tested benets which top up the earnings o persons on low or moderate
incomes. To be eligible, a number o criteria (including amily status) should
be met. A minimum o 16 working hours per week is also required. Other
programmes, such as child tax credit and other lump-sum cash benets, arealso available.
United States Earned income tax credit Reundable tax credit scheme or low-income workers, rst introduced in 1975.
The amount o credit increases with the number o children.
Sources: Compiled rom various national sources.

7/31/2019 Global Wage Report
http://slidepdf.com/reader/full/global-wage-report 94/139
77PART II Wage policies
to add about 37–61 pesos per day (slightly more than 10 per cent o the minimumwage) to the disposable income o minimum wage earners. 105
At the same time, when in-work benets remain a dicult policy option, broaderincome-transer measures, which are not related to employment and earning status, canbe used. For instance, amily health and the education o children both raise particu-lar concerns or low-paid workers due to their low earnings. Without proper education(and health), the children o low-paid workers may be vulnerable to the risk o beingtrapped in low-paid employment. Thereore, public schemes which alleviate these nan-cial constraints or low-paid workers will not only increase the welare o their amiliesbut also reduce the risk o a uture in low-paid employment or their children. Indeed,
an increasing number o countries are implementing such policies, in particular condi-tional/unconditional cash transer programmes, which are intended to help low-incomeamilies with heath and education matters.106 Examples o cash transer programmes areprovided in table 10. The Brazilian experience is particularly interesting in its successulcombination o wages and income-support policies; while active and systematic adjust-ments in minimum wages have led to the reduction o low pay (see table 10), Bolsa
Família has also contributed to preventing “wage poverty” rom being translated into“income poverty” by providing additional income support to low-income amilies.
105 See Peralta and Guirao (2010).
106 See ILO (2010d).
Table 10 Examples o cash transer policies in selected countries
Programme Features
Brazil Bols Fmíl “Family stipend” programme launched in 2003. It is the largest conditional
cash transer programme or helping poor amilies, especially in the areas
o education and health.
To be eligible, applicants must meet a set o requirements, including at least
85 per cent school attendance or children aged 6–15 years. It is estimated that
about 80 per cent o benets have been paid to amilies below the poverty line
(which is set at hal o the minimum wage per person in an entitled amily).
Mexico Opounddes Anti-poverty programmes or poor amilies in rural and urban economies, with
the objectives o improving education and health. Benets are conditional on
school attendance o children, regular clinic visits, etc. Eligibility is determined
through proxy means-testing and community reviews. Pays higher cash transers
to mothers or daughters’ school enrolment.
Bangladesh Female secondary school
stipend programme
The stipend is paid directly to girls on condition that they enrol in secondary
school and remain unmarried until the age o 18.
South Arica Child support grant A public cash transer programme or reducing poverty among children. It
started in 1998 as a conditional programme, which was transormed into
an unconditional one in order to improve the take-up rate o the grant.
Sources: ILO (2010d).

7/31/2019 Global Wage Report
http://slidepdf.com/reader/full/global-wage-report 95/139
7/31/2019 Global Wage Report
http://slidepdf.com/reader/full/global-wage-report 96/139
6 Main ndings and policy implications
The second in a series o ILO reports ocusing on wage developments, this volume hasreviewed the global wage trends during the years o the global economic and nancialcrisis o 2008 and 2009. The report has estimated that the growth in average monthlywages in the world slowed rom about 2.7–2.8 per cent in the two years beore thecrisis to 1.5 per cent in 2008 and 1.6 per cent in 2009. While wage growth slowed butremained consistently positive in Asia and Latin America, other regions experienceddrops in real wages at certain stages during the crisis. In advanced countries, real wagesdeclined by –0.5 per cent in 2008, but rose 0.6 per cent in 2009, thus reversing the losso 2008, while in Central and Eastern Europe they declined by an estimated –0.1 percent in 2009. Perhaps most dramatically, the purchasing power o wages ell by an
estimated –2.2 per cent in 2009 in Eastern Europe and Central Asia. It is stressed thatcaution must be exercised when interpreting these changes in wage growth, since theyrefect a number o crisis-related actors (such as unemployment and infation). Posi-tive growth in real wages during a nancial crisis can sometimes be attributed simplyto lower infation and/or the concentration o job losses in low-paid jobs.
In spite o the slowing o wage growth, this change was generally smaller thanthe respective decline in labour productivity growth or GDP growth during the years o the crisis. This can be observed in the report rom the act that a signicant number o countries where labour productivity declined nevertheless displayed positive averagewage growth, a nding which is in line with the conclusion that downward wage adjust-ments tend to be less than GDP adjustments. Also, most countries or which data are
available experienced a short-term increase in the share o wages in GDP between 2007and 2009. This trend shows that, despite declines in both the total wage bill and protsduring the crisis, prots have been more volatile than the total wage bill, and is consist-ent with earlier ndings that fuctuations in the wage share are usually countercyclical– increasing during downturns and decreasing during recoveries. The short-term trendo a higher wage share is not only observed at the national level, but also at the levelo some sectors, particularly in the manuacturing sector. However, it is plausible that,along with persistently high unemployment, there will be continued (or even stronger)pressures on wages in the coming years o economic recovery and, in this case, the ullimpact o the crisis on wages may yet remain to be seen.
These short-term impacts o the crisis should be looked at within the context o a long-term decline in the share o wages in GDP, a growing disconnection betweenlong-term wage growth and productivity growth, as well as widespread and growinginequality. In particular, our report shows that, since the mid-1990s, the proportion o
Summary and conclusions Part iii

7/31/2019 Global Wage Report
http://slidepdf.com/reader/full/global-wage-report 97/139
80 Global Wage Report 2010 / 11
people on low pay – dened as less than two-thirds o median wages – has increased inmore than two-thirds o the countries or which data are available. This includes coun-tries such as Argentina, China, Germany, Indonesia, Ireland, the Republic o Korea,Poland and Spain. In these and other countries with high or growing rates o low pay,there is a risk that a large number o people will eel let behind. This, in turn, may leadto increased social tensions, particularly i certain groups o people consider that theyhave paid a high price during the crisis while the benets o the earlier expansionaryperiod – and perhaps uture recovery – have been unevenly shared.
Another emerging concern is the act that wage stagnation beore the crisis mayactually have contributed to the crisis and also weakened the ability o economies to
recovery quickly. Although there are many other actors involved in triggering theglobal nancial and economic crisis, one view is that the crisis had its structural roots inthe decline in aggregate demand that preceded the crisis. Redistribution rom wages toprots and rom median-wage earners to high wage earners reduced aggregate demandby transerring income rom individuals with a high propensity to spend to people whosave more. Beore the crisis, some countries were able to maintain household consump-tion through increased indebtedness, while other countries based their economic growthmainly on exports. This model, however, has proved to be unsustainable. In the uture,countries may nd it in their interests to base their economic growth on stronger house-hold consumption, and on household consumption that is anchored in earned incomerather than based on increasing debt.
Our report argues that wage policies can make a positive contribution towardsa more sustainable economic and social model. Both collective bargaining and mini-mum wages can help to achieve a more balanced and equitable recovery by ensuringthat working amilies and households on low wages obtain a air share o the ruits o every single percentage point o economic growth. Our previous Global Wage Report 2008/09 showed that the connection between wages and productivity is stronger incountries where collective bargaining covers more than 30 per cent o employees, andthat minimum wages can reduce inequality in the bottom hal o the wage distribu-tion. Our current report shows that collective bargaining and minimum wages can alsocontribute to reducing the share o workers on low pay. At the same time, there areconsiderable challenges still acing unions trying to reach out to vulnerable workersand in the establishment o an eective system o minimum wages.
7 Emerging issues and the way orward
In Chinese, the word or “crisis” has a secondary meaning: “opportunity”. Our reportsuggests that the economic crisis has indeed provided a unique opportunity to broadenthe rationales or wage policies and, based on a systematic evaluation o the constraintswhich prevent the potential o these policies rom being ully realized, develop a moreeective policy package which would contribute to an equitable and sustainable econ-omy. In this respect, it is worth mentioning some o the major issues which are criti-
cal in improving wage policies, especially in the developing world. Our report arguesthat there are strong discriminatory elements involved in the persistence o both lowpay and wage gaps. Wage and income polices should thereore be developed within a

7/31/2019 Global Wage Report
http://slidepdf.com/reader/full/global-wage-report 98/139
81PART III Emerging issues and the way forward
broader regulatory ramework, which would also tackle various orms o discrimina-tion through labour law and other relevant regulations and measures.
First, low and decreasing union membership and the weakening o collectivebargaining in many countries remain causes o concern. This is not just because o thediculties which workers ace in trying to organize themselves (oten due to increasesin numbers o non-standard workers, including many domestic workers, as highlightedearlier in the report) but also because unorganized workers oten have access to ewalternative mechanisms to secure air and decent wages. In this context, it is interest-ing to see that, during the crisis, there has been renewed interest in the role o the statein promoting collective bargaining through various incentive schemes (or example,
work-sharing and employment subsidies). There has also been growing recognition o the relevance o collective bargaining in raising wages along with economic growth,including in Asian countries. I easible and necessary, tripartite wage bargaining –while not collective bargaining per se – could also potentially benet vulnerable work-ers, thanks to its comprehensive coverage.
Second, diminishing reliance on collective bargaining or wage determination tendsto create incentives or assigning an increasingly important role to minimum wages sothat, in some countries, they become almost the only wage policy tool. In this case, mini-mum wages policy may go through a qualitative transormation, which, in turn, couldresult in the minimum wage system becoming caught between a number o competingpolicy demands and goals. Indeed, as a result o such a transormation, minimum wages
are set or median-wage workers rather than or low-wage workers. It is not dicult tosee that, in this event, the undamental goal o minimum wages – to protect the mostvulnerable workers – might be compromised. Thereore, it is important to ensure thatthe minimum wage policy is more benecial to low-paid workers. However, restoringthe original goals o minimum wages must be accompanied by the creation o alterna-tive mechanisms which acilitate meaningul wage negotiations or median-wage work-ers. In other words, there must be a system o wage policies which benets all workers,irrespective o wage levels, union membership or employment status.
Third, as this report argues, policies which augment disposable income or low-income households need to be considered, along with the more traditional policymeasures o collective bargaining and minimum wages. These policies should be
designed and evaluated in terms o preventing low wages rom being translated intopoverty or the amily. In-work benets, such as tax credits, are certainly helpul in thisregard. However, they should be accompanied by (and not replace) wage-foor regu-lations, either through minimum wages or coordinated collective bargaining; other-wise, in-work benets may provide incentives or wage depression. In countries wherein-work benets are not a easible option, due, or instance, to the presence o massiveinormal employment, more direct income support policies or poor amilies (such ascash transer) need to be considered. Again, in order to maximize their impacts, all o these policies should be designed to complement other wage policies.
Finally, it is important to recognize that the system o these broadened wage poli-cies can contribute to both growth and stability o the economy. This system, as a whole,
has the potential to create a solid fow o consumption demand or sustained growthand, at the same time, play the role o built-in stabilizer during economic downturns.The current crisis will oer an invaluable opportunity or determining the extent to

7/31/2019 Global Wage Report
http://slidepdf.com/reader/full/global-wage-report 99/139
82 Global Wage Report 2010 / 11
which the virtuous circle o wages and aggregate demand is applicable and the condi-tions that must be met to realize this potential. This is one o the issues which the nextGlobal Wage Report plans to address.

7/31/2019 Global Wage Report
http://slidepdf.com/reader/full/global-wage-report 100/139
Technical appendix I
Global wage trends: Methodological issues
The methodology to estimate global and regional wage trends was developed by theILO’s Conditions o Work and Employment Programme (TRAVAIL) in collaborationwith the Department o Statistics, ollowing proposals ormulated by an ILO consultantand three peer reviews made by our independent experts.107 This appendix describesthe methodology adopted as a result o this process.
Conceps nd denons
• Accordingtotheinternationalclassicationofstatusinemployment(ICSE-93),“employees” are workers who hold “paid employment jobs”, i.e. jobs in whichthe basic remuneration is not directly dependent on the revenue o the employer.Employees include regular employees, workers in short-term employment, casualworkers, outworkers, seasonal workers and other categories o workers holdingpaid employment jobs.108
• Theword“wage”referstototalgrossremuneration,includingregularbonuses,received by employees during a specied period o time or time worked as wellas time not worked, such as paid annual leave and paid sick leave. Essentially,
it corresponds to the concept o “total cash remuneration”, which is the majorcomponent o income related to paid employment.109 It excludes employers’ socialsecurity contributions.
• Wages,inthepresentcontext,referstorealaveragemonthlywagesofemployees.Wherever possible, we collected data that reer to all employees (rather than to asubset, such as employees in manuacturing or ull-time employees).110 To adjustor the infuence o price changes over dierent time periods, wages are measuredin real terms, i.e. the nominal wage data are adjusted or consumer price infation
107 ILO-commissioned report by Farhad Mehran, Estimation o global wage trends: Methodological issues,International Labour Oce, mimeo; peer reviews by Pro. Yves Tillé, Expertise report on the “Estimation o global
wage trends: Methodological issues”, Institute o Statistics, University o Neuchatel, mimeo; Pro. Yujin Jeong andPro. Joseph L. Gastwirth, Comments on the drat ILO report “Estimation o global wage trends: Methodological
issues”, HEC Montreal and George Washington University, Washington, DC, mimeo; Dr Joyup Ahn, Responses to
Drat ILO Report “Estimation o Global Wage Trends: Methodological issues”, Korea Labor Institute, mimeo.
108 ILO, Resolution concerning the International Classication o Status in Employment (ISCE), adopted by theFiteenth International Conerence o Labour Statisticians (Geneva, January 1993). http://www.ilo.org/global/ What_we_do/Statistics/standards/resolutions/lang--en/docName--WCMS_087490/index.htm.
109 ILO, Resolution concerning the measurement o employment-related income, adopted by the SixteenthInternational Conerence o Labour Statisticians (Geneva, October 1998). http://www.ilo.org/global/What_we_do/ Statistics/standards/resolutions/lang--en/docName--WCMS_087490/index.htm.
110 Aiming or the broadest possible coverage is in line with the idea that decent work and hence adequate earningsare a concern or all workers, and that statistical indicators should cover all those to whom an indicator is relevant.See ILO (2008b).

7/31/2019 Global Wage Report
http://slidepdf.com/reader/full/global-wage-report 101/139
84 Global Wage Report 2010 / 11
in the respective country.111 Real wage growth reers to the year-on-year change inreal average monthly wages o all employees.
Census ppoch
The methodology used or the global and regional estimates is a census method withnon-response. In the census approach, the objective is to nd wage data or all countriesand to develop an explicit treatment in the case o total non-response (see “Treatmento total non-response”, below). We have tried to collect wage data or a total o 177countries and territories grouped into separate regions as descibed in table A1.112
Table A1 Regional groups
Regions Countries and territories
Advanced countries (selected) Australia, Austria, Belgium, Canada, Cyprus, Denmark, Finland, France, Germany, Greece,
Iceland, Ireland, Israel, Italy, Japan, Republic o Korea, Luxembourg, Malta, Netherlands,
New Zealand, Norway, Portugal, Singapore, Spain, Sweden, Switzerland, United Kingdom,
United States
Central and Eastern Europe Albania, Bosnia and Herzegovina, Bulgaria, Croatia, Czech Republic, Estonia, Hungary,
Latvia, Lithuania, The ormer Yugoslav Republic o Macedonia, Republic o Moldova,
Poland, Romania, Serbia, Slovakia, Slovenia, Turkey, Ukraine
Eastern Europe and Central Asia Armenia, Azerbaijan, Belarus, Georgia, Kazakhstan, Kyrgyz Republic, Russian Federation,
Tajikistan, Turkmenistan, Uzbekistan
Asia Aghanistan, Bangladesh, Bhutan, Brunei Darussalam, Cambodia, China, Hong Kong
(China), Macau (China), Fiji, India, Indonesia, Islamic Republic o Iran, Democratic People’s
Republic o Korea, Lao PDR, Malaysia, Maldives, Mongolia, Myanmar, Nepal,
Pakistan, Papua New Guinea, Philippines, Solomon Islands, Sri Lanka, Thailand,
Timor-Leste, Viet Nam
Latin America and the Caribbean Argentina, The Bahamas, Barbados, Belize, Bolivia, Brazil, Chile, Colombia, Costa Rica,
Cuba, Dominican Republic, Ecuador, El Salvador, Guadeloupe, Guatemala, Guyana, Haiti,
Honduras, Jamaica, Martinique, Mexico, Netherlands Antilles, Nicaragua, Panama,
Paraguay, Peru, Puerto Rico, Suriname, Trinidad and Tobago, Uruguay, Bolivarian Republic
o Venezuela
111 We do so based on the IMF’s consumer price index (CPI) or the respective country. In the cases o Brazil andthe United States, where our national counterparts recommended the use o an alternative CPI, we relied on nationalsources rom the Instituto Brasiliero de Geograa e Estatistica (IBGE) and the Bureau o Labor Statistics (BLS),respectively.
112 These regional groupings draw on the regional representation o ILO oces throughout the world. Our universe
includes all countries and territories or which data on employment are available rom the ILO’s Key Indicators o the Labour Market (KILM), and thus excludes some small countries and territories (e.g. the Channel Islands or theHoly See) that have no discernible impact on global or regional trends.

7/31/2019 Global Wage Report
http://slidepdf.com/reader/full/global-wage-report 102/139
85Technical appendix I Global wage trends
Regions Countries and territories
Arica Algeria, Angola, Benin, Botswana, Burkina Faso, Burundi, Cameroon, Cape Verde, Central
Arican Republic, Chad, Comoros, Congo, Democratic Republic o the Congo, Côte d’Ivoire,
Egypt, Equatorial Guinea, Eritrea, Ethiopia, Gabon, Gambia, Ghana, Guinea, Guinea-Bissau,
Kenya, Lesotho, Liberia, Libyan Arab Jamahiriya, Madagascar, Malawi, Mali, Mauritania,
Mauritius, Morocco, Mozambique, Namibia, Niger, Nigeria, Reunion, Rwanda, Senegal,
Sierra Leone, Somalia, South Arica, Sudan, Swaziland, United Republic o Tanzania, Togo,
Tunisia, Uganda, Zambia, Zimbabwe
Middle East Bahrain, Iraq, Jordan, Kuwait, Lebanon, Oman, Qatar, Saudi Arabia, Syrian Arab Republic,
United Arab Emirates, West Bank and Gaza, Yemen
Overall, we succeeded in nding wage data rom 115 countries and territories,with regional coverage indicated in table A2. Although repeated attempts were made toobtain wage gures rom national statistical oces and/or international repositories, insome instances wage data were not available. In addition, in some countries or whichwe ound data, the statistical series were incomplete, in the sense that some years weremissing (see “Treatment o item non-response” below).
Table A2 Coverage o the Global Wage Database (in per cent)
Regional group Country coverage Employee coverage Approximate coverage
o total wages
Advanced countries (selected) 100.0 100.0 100.0
Central and Eastern Europe 100.0 100.0 100.0
Eastern Europe and Central Asia 100.0 100.0 100.0
Asia 59.3 96.2 98.5
Latin America and the Caribbean 61.3 92.3 94.7
Arica 29.4 56.7 76.2
Middle East 75.0 73.4 90.9
World 65.0 94.0 98.5
Note: Country coverage reers to the number o countries or which we ound wage data as a percentage o all the countries in the region, while employee cover-
age reers to the number o employees in countries with available data as a percentage o all employees in the region (as o 2008). The approximate coverage
o total wages is estimated based on the assumption that wage levels vary across countries in line with labour productivity (i.e. GDP per person employed, as
o 2008), expressed in 2005 PPP$.
temen o em non-esponse
To address item non-response (when time-series wage data are available or a country,but data or some years are missing) we used a model-based ramework to predict miss-ing values.113 This is necessary in order to hold the set o responding countries constantover time and so avoid the undesired eects associated with an unstable sample.
113 This is in line with standard survey methodology, where a model-based ramework is generally used or itemnon-response, while a design-based ramework is used or questionnaire non-response.
Table A1 (continued)

7/31/2019 Global Wage Report
http://slidepdf.com/reader/full/global-wage-report 103/139
86 Global Wage Report 2010 / 11
Depending on the nature o the missing data points, we used several complementaryapproaches, which are described below in order o preerence. At the end o this appen-dix, we present a detailed breakdown or each year rom 2006 to 2009 to allow readersinsight into the extent to which we could draw on real observations, and how much wehad to rely on imputed values (table A3).
(a) Where yearly observations are based on monthly or quarterly gures, we some-times had partial inormation rom the same time series or a given year. Since theuse o these data points unadjusted might have entailed a bias (e.g. in high-infa-tion countries, nominal wages are generally higher in the nal quarter than in therst quarter), we rst estimated the missing quarterly or monthly data points on
the basis o the nominal values or the existing observations or monthly averagewages, jt , rom country j at time t , by tting a linear OLS regression. We thentook the average o existing and estimated data points. This method was usedwhere the nal quarter o 2009 was missing, as in this example:
We used this method or one country. A similar approach was used to adjust wagedata rom a second country where observations rom dierent years reerred todierent calendar months.
(b) In another case, a time-series has a short gap between existing data points. Thisallows estimating a missing data point, the average wage jt in country j at time t ,by interpolating on the basis o the logarithmic growth unction:
where t–x is the nearest preceding data point, t+z is the nearest subsequent datapoint, the asterisk denotes real values (i.e. adjusted or infation) and e is Euler’snumber. We used this approach to ll gaps o a maximum o three successive
years in the time series o 17 countries.(c) In some cases, we had multiple sources o wage data or a given country (e.g. one
based on establishment surveys and another on a household survey). We used thisadditional inormation to ll missing data points in our preerred time series, as inthis example, where the average wage jt +1 is estimated:
where are known data points rom our preerred series and ' known data pointsrom the secondary series. We were able to utilize secondary series in 37 countries.
(d) Where no secondary data source existed and the gap in the series was too long touse the simple interpolation described in equation (2), we drew on standard
(1) j2009 =
( j1Q2009 + j2Q2009 + j3Q2009 + j4Q2009 )
4
jt +1 = ' jt +1 × jt
' jt
(2)
(3)
* = e( z
x + z ln( jt–x ) + x
x + z ln( jt+z)) jt
* *

7/31/2019 Global Wage Report
http://slidepdf.com/reader/full/global-wage-report 104/139
87Technical appendix I Global wage trends
economic theory, which suggests that – in the long run – wages respond tochanges in labour productivity. However, we also know that this relationship isnot perect and can vary over time. In a given country j, we thus had to take intoaccount the ratio o wages, *
j, over labour productivity, LP* j, at two points in
time, namely in the year that immediately precedes the data gap and the year thatimmediately ollows it. To estimate the wage level *
jt at point in time t , we thusused the ollowing ormula to t the wage trend between two known data pointsto changes in labour productivity:
where t–x is the nearest preceding data point, t+z the closest subsequent datapoint, and the asterisk denotes real values. Note that we eectively multiply thelevel o labour productivity in the year or which we want to estimate wage levelswith a weighted average o the two ratios o wages over labour productivity, wherethe weight depends on the proximity o each data point to the year that is to beestimated. This method was used or two countries.
(e) Finally, where none o the simple methods described above was easible, we usedan econometric model to estimate the remaining missing data points. Again, we
drew on standard economic theory that suggests that wages respond to changes inlabour productivity. In line with this reasoning, we calculated regional elasticitiesbetween productivity growth and real wage growth and used them or extrapola-tion purposes.
The regional elasticities were calculated using the ollowing process. First, thegrowth rates o wages and labour productivity were calculated or all respondingcountries, separating between the pre-crisis period (2000–07) and crisis period(2008–09). The growth rate o real wages and productivity was calculated byregressing the natural logarithm o average wages, , and labour productivity, LP,against time:
Real wages: ln( * j) = a + β 1 jt + ε
Productivity: ln( LP* j) = a + β 2 jt + ε
where the subscript j reers to countries, t is time, the asterisk denotes real valuesand ε is the error term. We make a separation between the pre-crisis and the crisisperiod since there are good theoretical reasons to believe that the relationshipbetween wages and productivity diers in the two periods (an assumption thatwas conrmed by our regressions).
Once these are obtained, we use them to calculate the elasticity, a , o wages to labourproductivity or each region h by regressing wage growth on productivity growth:
β 1 j = a hβ 2 j + ε, j ∈h
(4)
(5)
(6)
(7)
* jt
= LP* jt
×
( ) x
x+z
* jt–x
LP* jt–x
* jt+z
LP* jt+z
z
x+z+ ××

7/31/2019 Global Wage Report
http://slidepdf.com/reader/full/global-wage-report 105/139
88 Global Wage Report 2010 / 11
where h represents the region in which country j belongs, and β 1 and β 2 reer to theestimates obtained rom equations (5) and (6). In order to account or the varyingsizes o dierent countries within a region, each observation is weighted by theshare o country j in total paid employment in region h in which country j islocated. The robustness o each o the regional estimations was analysed, outlierswere excluded and the specications re-estimated. The nal estimation providesthe elasticity, a, o real wages to productivity or each region h, and or the twoperiods. This elasticity can then be used to estimate average real wages * incountry j and the year t+1:
In cases where no robust model could be identied (i.e. the elasticity between realwages and productivity was not signicant), we applied the estimates or wage growth β 1 obtained in equation (5) rom the median country in region h, during the relevanttime period or extrapolation purposes in countries with missing observations. Weollowed this modelling approach to ll data gaps in a total o 52 countries.
temen o ol non-esponse
Response weights
To adjust or total non-response (when no time series wage data are available or a givencountry), a design-based ramework was used in which non-response was consideredas a sampling issue. Because non-responding countries may have wage characteristicsthat dier rom those o responding countries, non-response may introduce a bias intothe nal estimates. A standard approach to reduce the adverse eect o non-response isto calculate the propensity o response o dierent countries and then weight the datarom responding countries by the inverse o their response propensity.114 This impliesthat no imputations are made or non-responding countries.
In this ramework, each country responds with a probability φ j and it is assumed thatcountries respond independently o each other (Poisson sampling design). With the prob-abilities o response, φ j, it is then possible to estimate the total, Y , o any variable y j:
by the estimator:
where U is the population and R is the set o respondents. This estimator is unbiased i the assumptions are true (see Tillé, 2001). In our case, U is the universe o all countries
114 For a discussion o the missing data problem, see also: ILO 2010e, p. 8.
(8)
(9)
(10)
* jt +1 = * jt × 1 + a h × , j ∈h LP
* jt+1
– LP
* jt
LP* jt
j ∈U
Y = ∑ y j
j ∈ R
y j
φ jY = ∑
( )

7/31/2019 Global Wage Report
http://slidepdf.com/reader/full/global-wage-report 106/139
89Technical appendix I Global wage trends
and territories listed in table A1 and R are those “responding” countries or which wecould nd time-series wage data.
The diculty is, however, that the response propensity o country j, φ j, is generallynot known and must itsel be estimated. Many methods o estimation o the responsepropensity are available rom the literature.115 In our case, the response propensity wasestimated by relating the response or non-response o a given country to its number o employees and its labour productivity (or GDP per person employed in 2005 PPP$).This is based on the observation that wage statistics are more readily available or richerand larger countries than or poorer and smaller countries. We choose the number o employees over population and labour productivity over GDP per capita since these
variables are also used or calibration and size weighting (see below).For this purpose, we estimated a logistic regression with xed eects as ollows:
where x j2008 is ln(GDP per person employed in 2005 PPP$) o country j in the year 2008,
n j2008 is ln(number o employees in 2008), and Λ denotes the logistic cumulative distribu-
tion unction.116 The xed eects, a h, are dummies or each o the regions with incom-plete data (Asia, Latin America and the Caribbean, Arica and the Middle East) and onecommon dummy or the remaining regions with complete data. The logistic regression
had n = 177 cases and produced a pseudo R
²
= 0.462. The estimated parameters were thenused to calculate the propensity o response o country j, φ j.The response weight or country j, ϕ j , is then given by the inverse o a country’s
response propensity:
Calibration factors
The nal adjustment process, generally called calibration,117 is to ensure consistency o the estimate with known aggregates. This procedure ensures appropriate representationo the dierent regions in the nal global estimate. In the present context, a single vari-able, number o employees in 2008, was considered or calibration. In this simple case,the calibration actors, γ j , are given by
where h represents the region to which country j belongs, nh is the known number o employees in that region, and nh is the estimated total number o employees in the
115 See, or example, Tillé (2001).
116
Data or the number o persons employed and the number o employees are rom KILM, and data on GDP in2005 PPP$ rom the World Bank’s World Development Indicators.
117 Särndal and Deville (1992).
(11)
(12)
(13)
Prob( Response = 1) = Λ(a h + β 1 x j2008 + β 2n j2008)
ϕ j =1
φ j
γ j = , j ∈hnh
nh

7/31/2019 Global Wage Report
http://slidepdf.com/reader/full/global-wage-report 107/139
90 Global Wage Report 2010 / 11
region based on the uncalibrated weights.118 The resulting calibration actors were 1.00(Advanced countries, Central and Eastern Europe, Eastern Europe and Central Asia),0.967 (Asia), 0.967 (Latin America and the Caribbean), 0.958 (Arica) and 1.133(Middle East). Since all calibration actors are either equal to or very close to one,these results show that estimates nh were already very close to the known number o employees, nh, in each region.
Calibrated response weights
The calibrated response weights,ϕ ' j, are then obtained by multiplying the initial response
weight by the calibration actor:
ϕ ' j = ϕ j × γ j
The regional estimate o the number o employees based on the calibrated responseweights is equal to the known total number o employees in that region. Thus, the cali-brated response weights adjust or dierences in non-response between regions. Notethat the calibrated response weights are equal to 1 in the regions where wage data wereavailable or all countries (Advanced countries, Central and Eastern Europe, EasternEurope and Central Asia). They are larger than 1 or small countries and countries withlower labour productivity since these are underrepresented among responding countries.
Esmng globl nd egonl ends
One intuitive way to think o a global (or regional) wage trend is in terms o the evolu-tion o the world’s (or a region’s) average wage. This would be in line with the conceptused or other well-known estimates, such as regional GDP per capita growth (publishedby the World Bank) or the change in labour productivity (or GDP per person employed;see Part I o this report).
The global average wage, , at the point in time t can be obtained by dividing thesum o the national wage bills by the global number o employees:
where n jt is the number o employees in country j and jt is the corresponding averagewage o employees in country j, both at time t .
The same can be repeated or the subsequent time period t+1 to obtain *t +1, usingthe defated wages * jt +1 and the number o employees nt +1. It is then straightorward tocalculate the growth rate o the global average wage, r .
118 The estimate, h, o the number o employees in region h is obtained by multiplying the number o employeesin countries rom the region or which we have wage data by the uncalibrated weights, and then summing up acrossthe region.
(14)
(15)t = ∑ j n jt × jt
∑ j n jt

7/31/2019 Global Wage Report
http://slidepdf.com/reader/full/global-wage-report 108/139
91Technical appendix I Global wage trends
However, while this is a conceptually appealing way to estimate global wagetrends, it involves some diculties that we cannot presently overcome. In particular,aggregating national wages, as is done in equation (15), requires them to be convertedinto a common currency, such as PPP$, making the estimates sensitive to revisions inPPP conversion actors. It would also require that national wage statistics be harmo-nized to a single concept o wages in order to make the level strictly comparable. 119
More importantly, the change in the global average wage would also be infuencedby composition eects that occur when the share o employees shits between coun-tries. For instance, i the number o paid employees alls in a large high-wage countrybut expands (or stays constant) in a large low-wage country, this would result in a all
o the global average wage (when wage levels stay constant in all countries). This eectmakes changes in the global average wage dicult to interpret, as one would have todierentiate which part is due to changes in national average wages and which part isdue to composition eects.
We thereore gave preerence to an alternative specication to calculate globalwage trends that maintains the intuitive appeal o the concept presented above butavoids its practical challenges. To ease interpretation, we also want to exclude eectsthat are due to changes in the composition o the world’s employee population.
When the number o employees in each country is held constant, the global wagegrowth rate can be expressed as a weighted average o the wage growth rates in theindividual countries:
r t = ∑ j w jt × r jt
where r jt is wage growth in country j at point in time t and the country weight, w jt , is theshare o country j in the global wage bill, as given by:
w jt = n jt × jt / ∑ j n jt × jt
While we have data or the number o employees, n jt , in all countries and relevantpoints in time rom the ILO’s Key Indicators o the Labour Market,120 we cannot estimateequation (17) directly since our wage data are not in a common currency. However, wecan again draw on standard economic theory, which suggests that average wages varyroughly in line with labour productivity across countries.121 We can thus estimate j as axed proportion o labour productivity, LP:
jt = a × LP jt
119 See, or example, the work done mainly or industrialized countries by the International Labor Comparisonsprogramme o the US Bureau o Labor Statistics (2009) (http://www.bls.gov/fs/). Since we do not compare levels,but ocus on change over time in individual countries, data requirements are less demanding in our context.
120 We estimate the number o employees in 2009 (which is not yet available rom KILM) by calculating the ratioo employees over employment in 2008, and then multiplying total employment in 2009 by this ratio. The main data
source or KILM is Laborsta.121 See also ILO (2008a, p. 15) or the association between wage levels and GDP per capita. Notwithstanding this,wage developments can diverge rom trends in labour productivity in the short and medium terms.
(16)
(17)
(18)

7/31/2019 Global Wage Report
http://slidepdf.com/reader/full/global-wage-report 109/139
92 Global Wage Report 2010 / 11
where a is the average ratio o wages over labour productivity. We can thereore esti-mate the weight as:
which is equal to:
Substituting jt or w jt and introducing the calibrated response weight, ϕ ' j, into
equation (16) gives us the nal equation used to estimate global wage growth:
and or regional wage growth:
where h is the region o which country j is part. As can be seen rom equations (21) and
(21'
), global and regional wage growth rates are the weighted averages o the nationalwage trends, where ϕ ' j corrects or dierences in response propensities between coun-tries (as described in (d) above).
While we believe that we have a robust methodology or the treatment o itemnon-response and total non-response (see above), our estimates o regional and globalwage growth will naturally be less reliable the ewer actual observations we have. Aswe have described, we have not succeeded in obtaining wage data or all countries, andwe have had to estimate missing years or some o the responding countries. This raisesthe question o how broad the coverage o the Global Wage Database is or a given year.Since data gaps or countries that have a higher weight are more severe, we estimatecoverage, η t , as ollows:
where jt is the weight obtained rom equation (20), U is the ull set o countries j listedin table A1, and a country is considered to be among the set o responding countries,
R, at time t when a real observation is available or that year, either rom the preerredseries or rom a secondary series.
Table A3 provides coverage inormation or each year rom 2006 to 2009. Asexpected, the coverage o the database becomes lower or the most recent years (sincesome statistical oces are still processing these data). Nonetheless, even or 2009 westill have real observations or about 90 per cent o total wages. Coverage exceeds98 per cent in 2009 in the Advanced countries, Central and Eastern Europe and Eastern
(19)
(21)
(21' )
(22)
(20)
w jt = n jt × a × LP jt / ∑ j n jt × a × LP jt
w jt = n jt × LP jt / ∑ j n jt × LP jt
r t =∑ j ϕ ' j × jt × r jt
∑ j ϕ ' j
r ht = , j ∈h∑ j ϕ ' j × jt × r jt
∑ j ϕ ' j
∑ jt
t =∑ jt j ∈ Rt
j ∈U

7/31/2019 Global Wage Report
http://slidepdf.com/reader/full/global-wage-report 110/139
93Technical appendix I Global wage trends
Europe and Central Asia. However, we have too ew real observations or the MiddleEast in 2008 and 2009 (where coverage is roughly 13 per cent) to make a reliable esti-mate and thereore do not publish the most recent wages trends or the Middle East.
We also fag regional growth rates as “provisional estimates” when they are based oncoverage o ca. 75 per cent and as “tentative estimates” when the underlying coverageo our database is between 40 and 60 per cent to draw attention to the act that theymight be revised once more data become available.
Table A3 Coverage o the Global Wage Database, 2006–09 (in per cent)
Regional groups Approximate coverage o total wages (%)
2006 2007 2008 2009
Advanced countries (selected) 100.0 99.2 100.0 98.7
Central and Eastern Europe 100.0 100.0 100.0 99.4
Eastern Europe and Central Asia 97.7 98.5 98.4 98.2
Asia 98.3 97.2 93.6 73.8*
Latin America and the Caribbean 94.5 94.6 94.2 83.5
Arica 76.6* 75.6* 41.1** 39.2**
Middle East 80.1 60.7** (12.8) (13.9)
World 98.1 97.0 94.6 90.1
* Regional growth rates published as “Provisional estimates (based on coverage o ca. 75 per cent)”.
** Regional growth rates published as “Tentative estimates (based on coverage o ca. 40 per cent to ca. 60 per cent)”.
(..) Regional growth rates not published.
Note: See text regarding estimation o coverage. A country is counted as covered only when a real observation is available, either rom the preerred series or
a secondary series.

7/31/2019 Global Wage Report
http://slidepdf.com/reader/full/global-wage-report 111/139
Technical appendix II
Defnition and measurement o the wage share and shit-share analysis
How the wage share should be calculated is important to dene, since dierent ways o calculating the wage share will aect the level observed and sometimes the time trends.Some questions to consider122 include the ollowing: What should be included in the meas-urement o compensation o employees? Should CEOs and business owners be classied asworkers? What is the most appropriate way o measuring output? The sections below showhow the level o the wage share is aected when it is measured using multiple denitions.
How s he wge she dened?
In general terms, the simple unadjusted wage share o output ( LS ) is dened as the ratioo compensation o employees (COE ) to gross value added (GVA), both measured innominal terms.
Yet, there is much debate surrounding the implications o this simplistic measure. In
particular, standard measures o COE in national accounts (wages plus salaries and socialcontributions paid by the employer) omit the labour income o the sel-employed. Assuch, the wage share, as dened above, ignores the labour income o business owners.In certain sectors, where there is a high proportion o sel-employed in total employ-ment123 – implying an underestimation o the numerator o the unadjusted wage shareexpression – the positive contribution o labour income can cause signicant changesto the calculated level o the wage share. It is thereore important to calculate a measureo the wage share that is adjusted or the sel-employed, the so-called adjusted wageshare. In the ollowing paragraphs we describe two dierent ways o adjusting thewage share to account or the labour income o the sel-employed, discussing the posi-tive elements and drawbacks o each.
Sndd ssumpons bou popeos’ ncomes my ovenfe
he vlue o he wge she …
Because mixed income (a measure o unincorporated business income) is dicultto quantiy and thus oten not separated rom operating surplus in national accounts,a standard assumption among economists is that labour compensation per person is
122
See, or example, those highlighted by Krueger (1999).123 For example, this is oten the case in the agriculture, hunting, orestry and shing sectors o the economy (sec-tors A and B o the International Standard Industrial Classication o All Economic Activities (ISIC) Revision 3).
(1) LS = GVA LS = COE

7/31/2019 Global Wage Report
http://slidepdf.com/reader/full/global-wage-report 112/139
95Technical appendix II The wage share and shift-share analysis
equivalent between the sel-employed and paid employees. 124 Given this assumption,the adjusted wage share can be expressed as:
where ALS t Tstands or the adjusted wage share at the total economy level, COE t repre-
sents nominal compensation o employees at time t , GVAt denotes nominal GVA attime t and EMPN t and EMPE t represent total employment and employees at time t (bothmeasured in persons), respectively.
It should be noted that the measure or EMPN and EMPE can also be expressedin hours worked. Indeed, this labour measure is preerable to that o persons becausea simple headcount o employed persons can hide changes in average hours worked,caused by the evolution o part-time work or the eect o variations in overtime, absencerom work or shits in normal hours. However, the quality o hours-worked estimates isnot always clear. In particular, statistical establishment surveys and household surveysare dicult to use because o the varying quality o hours-worked estimates and degreeo international comparability. In contrast, total employment is easier to measure thanhours worked and thus, typically, is more widely available. Yet, it does not refectchanges in the average work time per employee, changes in multiple job holdings, northe role o sel-employed persons (or changes in the quality o labour). Despite these
apparent drawbacks, this analysis relies on employed persons as the labour measure orreasons o data availability.125
At the total economy level, equation (2) is advantageous in that it utilizes alreadyavailable wage and employment data in the calculation o the adjusted wage share.However, it is problematic or various reasons. First, as Morel (2006) points out, it ispossible to end up with a wage share above unity when adjusting the wage share perequation (2) “due to either measurement errors in the variables or to dierent denitionso sel-employed in the national accounts compared to the employment survey” (p. 5).Although this eect is oten less noticeable at the aggregate level, it is quite apparentwhen applied to individual sectors that have a high share o sel-employed in totalemployment. More problematic, however, is the underlying assumption that the sel-employed and employees receive the same compensation. Indeed, it is likely that thecompensation o the sel-employed compared to employees varies by sector. For exam-ple, it is generally accepted that non-employee workers in the agricultural sector earnless than paid employees. Thus, the calculation o the wage share in this sector whenapplying equation (2) could be overestimated, as the agricultural sector commonly hasa large share o sel-employed in total employment. Conversely, non-employee work-ers, such as sel-employed doctors in the health service sector, tend to earn more thanthe average employee, which could lead to an underestimated wage share.
124 See, or example, Gollin (2002) and Bagnoli (2009).
125 See Freeman (2008).
(2) ALS t T
= ×COE t EMPN t
GVAt EMPE t

7/31/2019 Global Wage Report
http://slidepdf.com/reader/full/global-wage-report 113/139
96 Global Wage Report 2010 / 11
…mkng us queson ppope djusmen mesues
To address the potential problems that can arise when applying the “simple” adjust-ment given by equation (2), Arpaia et al. (2009) suggest a variation o this measure o the aggregate wage share. They advocate attributing the compensation o an averageemployee in a particular economic activity branch to the sel-employed working inthe same sector. In such a case, this method calculates the adjusted wage share as aweighted average o the adjusted wage share or each sector i in the economy and usessector shares in total value added as weights. The ollowing equation or the adjustedwage share results:
Where ALS t Srepresents the wage share at the total economy level, calculated by applying
sectoral data; i represents any particular sector o the economy; COE i,t , gvai,t , EMPN i,t , EMPE i,t , wi,t and alsi,t denote, or any economic sector i at time t , nominal compensa-tion o employees, nominal gross value added, total employment (persons), employees(persons), the weight o the sector’s value added in the total economy and the adjustedwage share, respectively. Ideally, the most disaggregated data should be used (three orour-digit level o ISIC or national nomenclatures), depending on data availability.
Finally, note that the industrial classication used in our analysis is the United
Nations International Standard Industrial Classication (ISIC) o All Economic Activi-ties, Revision 3.
an lluson
This section explores in urther detail the implications o dierent measures o the wageshare. As explained above, the measure o the wage share used has direct implicationson the level o the wage share observed. 126 Figure A4 presents ve dierent measureso the wage share or Germany. This country was selected or purely representationalpurposes as the same general phenomenon can be observed across all countries in thisanalysis. The bottom line ( Raw2) shows the raw wage share that corresponds to equa-tion (1) but excludes community, social and personal services. The argument or thisexclusion is that the value added generated by these sectors is wage and salary income,implying that there is no concept o wage share involved.127 Directly above this line isthe raw wage share, Raw1, as described by equation (1).
The upper bound o the graph, Adj1, is the wage share that corresponds to equa-tion (2). We observe, or Germany, a dierence o nearly 0.1 percentage point betweenthis measure o the wage share and the unadjusted measure, Raw1. Although not shownhere, the dierence is much more marked at the sectoral level, particularly or the
126 As the principal intention o this analysis is to study the evolutions in trends in the labour share o output sincethe economic crisis, other orms o adjustment prominent in the literature were not explored. For a urther and more
in-depth discussion on ways o adjusting the labour share or the income o the sel-employed, see Gollin (2002),Morel (2006) and Krueger (1999).
127 See Arpaia et al. (2009).
ALS t S= = = wi,t × alsi,t × ×COE i,t × EMPN i,t
gvai,t × EMPE i,t EMPN i,t
EMPE i,t gvai,t
GVAt
COE i,t
gvai,t ∑k
i=1 ∑k
i=1 ∑k
i=1(3)
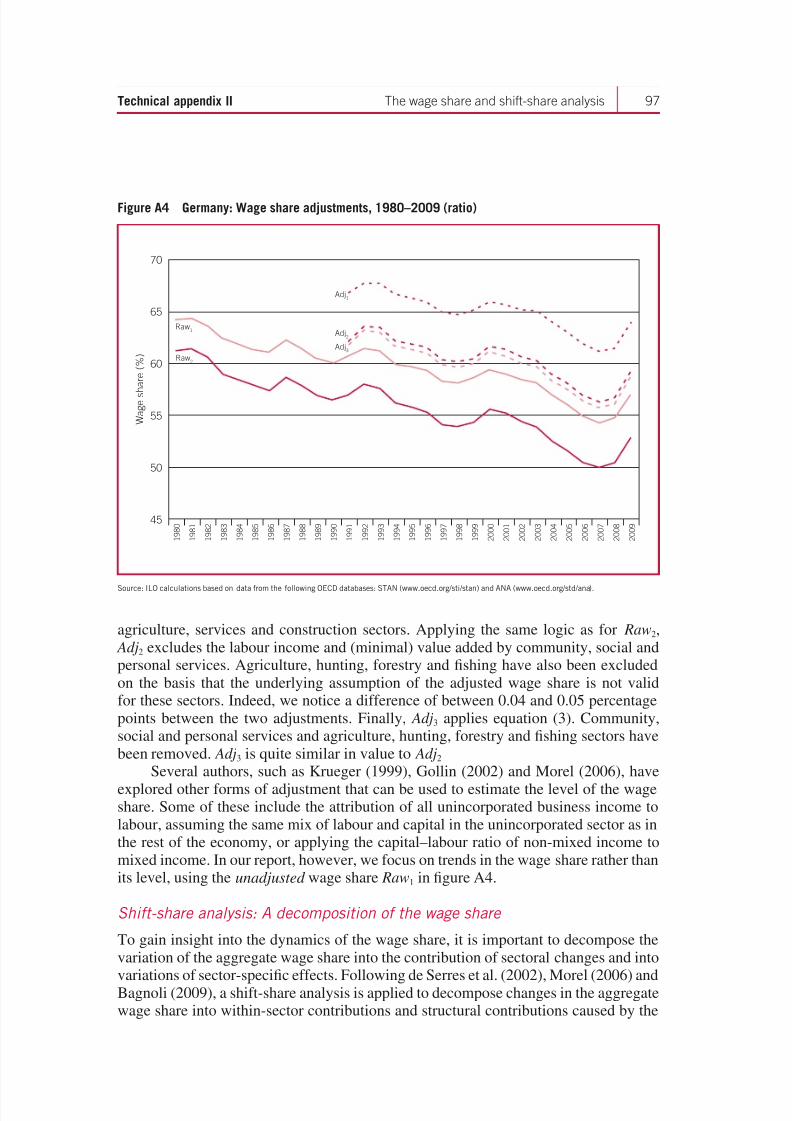
7/31/2019 Global Wage Report
http://slidepdf.com/reader/full/global-wage-report 114/139
97Technical appendix II The wage share and shift-share analysis
agriculture, services and construction sectors. Applying the same logic as or Raw2, Adj2 excludes the labour income and (minimal) value added by community, social andpersonal services. Agriculture, hunting, orestry and shing have also been excludedon the basis that the underlying assumption o the adjusted wage share is not validor these sectors. Indeed, we notice a dierence o between 0.04 and 0.05 percentagepoints between the two adjustments. Finally, Adj3 applies equation (3). Community,social and personal services and agriculture, hunting, orestry and shing sectors havebeen removed. Adj3 is quite similar in value to Adj2
Several authors, such as Krueger (1999), Gollin (2002) and Morel (2006), have
explored other orms o adjustment that can be used to estimate the level o the wageshare. Some o these include the attribution o all unincorporated business income tolabour, assuming the same mix o labour and capital in the unincorporated sector as inthe rest o the economy, or applying the capital–labour ratio o non-mixed income tomixed income. In our report, however, we ocus on trends in the wage share rather thanits level, using the unadjusted wage share Raw1 in gure A4.
Sh-she nlyss: a decomposon o he wge she
To gain insight into the dynamics o the wage share, it is important to decompose thevariation o the aggregate wage share into the contribution o sectoral changes and into
variations o sector-specic eects. Following de Serres et al. (2002), Morel (2006) andBagnoli (2009), a shit-share analysis is applied to decompose changes in the aggregatewage share into within-sector contributions and structural contributions caused by the
70
65
Adj1
Adj2
Raw2
Raw1
Adj3
60
55
50
45
1 9 9 5
1 9 8 0
1 9 8 1
1 9 8 2
1 9 8 3
1 9 8 4
1 9 8 5
1 9 8 6
1 9 8 7
1 9 8 8
1 9 8 9
1 9 9 0
1 9 9 1
1 9 9 2
1 9 9 3
1 9 9 4
1 9 9 6
1 9 9 7
1 9 9 8
1 9 9 9
2 0 0 0
2 0 0 1
2 0 0 2
2 0 0 3
2 0 0 4
2 0 0 5
2 0 0 6
2 0 0 7
2 0 0 9
2 0 0 8
W a g e s h a r e ( % )
Figure A4 Germany: Wage share adjustments, 1980–2009 (ratio)
Source: ILO calculations based on data rom the ollowing OECD databases: STAN (www.oecd.org/sti/stan) and ANA (www.oecd.org/std/ana).

7/31/2019 Global Wage Report
http://slidepdf.com/reader/full/global-wage-report 115/139
98 Global Wage Report 2010 / 11
movement o resources between sectors.128 Sector weights are used to account or therelative size o each sector in gross value added. For the analysis, the method used byMorel (2006) is applied. The changes in the aggregate wage share o output betweenperiod (t–s) and period t are decomposed into three parts as ollows:
where LS i,t represents the aggregate wage share or industry i (o which there are I indus-tries) at time t , and wi stands or the weight o each industry in nominal GVA.
In equation (4), the rst term on the right-hand side represents the change in theaggregate wage share caused by variations in the wage share within industries (shareeect). The second term indicates the variation in the wage share caused by changesin the relative weight o each sector, calculated on the basis o changes in the relativeshare o nominal GVA. This is indicative o the sectoral composition bias in the aggre-gate wage share (shit eect). Finally, the last term is considered to be an unexplainedresidual.
128 Agriculture, hunting, orestry and shing sectors have been excluded rom this analysis on the basis that it wouldbe more appropriate to include these sectors in an analysis o the adjusted wage share.
∆ LS i,t = (wi,t–s × ∆lsi,t ) + (lsi,t–s × ∆wi,t ) + (∆wi,t × ∆lsi,t )∑ I
i=1 ∑ I
i=1 ∑ I
i=1(4)

7/31/2019 Global Wage Report
http://slidepdf.com/reader/full/global-wage-report 116/139
Bibliography
Background papers
Damayanti, A. 2010. Low-paid workers in Indonesia, national technical report preparedor the Global Wage Report .
Deng, Q.; Li, S. 2010. Low-paid workers in urban China, national technical reportprepared or the Global Wage Report .
Fontes, A.; Pero, V. 2010. Low-paid employment in Brazil, national technical reportprepared or the Global Wage Report .
Grimshaw, D. 2010. What do we know about low wage work and low wage workers?
Analysing the defnitions, patterns, causes and consequences in international perspective, technical background report prepared or the Global Wage Report .
Hall, D.; Corral, V.; van Niekerk, S. 2010. The impact o the economic crisis on public
sector pay, Public Services International Research Unit paper (London, Univer-sity o Greenwich).
Lee, B.H.; Hwang, D. 2010. Low-paid work in Korea, national technical report preparedor the Global Wage Report .
Oosthuizen, M.; Goga, S. 2010. Low-paid work in South Arica, national technicalreport prepared or the Global Wage Report .
Peralta, T.; Guirao, E. 2010. Low-paid workers in the Philippines, national technicalreport prepared or the Global Wage Report .
Velásquez Pinto, M.D. 2010. Trabajadores con bajos salarios en Chile: Principales
características y políticas, national technical report prepared or the Global Wage Report .
Reerences
Al Faruque, A. 2009. Current status and evolution o industrial relations system in
Bangladesh, ILO Asia-Pacic Working Paper Series (New Delhi, ILO).
Altman, M. 2006. Low wage work in South Arica, Human Sciences Research Council,paper presented to World Bank Conerence on Employment and Development,May (Berlin).
Amerasinghe, F. 2009. The current status and evolution o industrial relations in Sri
Lanka, ILO Asia-Pacic Working Paper Series (New Delhi, ILO).

7/31/2019 Global Wage Report
http://slidepdf.com/reader/full/global-wage-report 117/139
100 Global Wage Report 2010 / 11
Anker, R. 2006. “Living wages around the world: A new methodology and estimates o internally comparable living wages”, in International Labour Review, Vol. 145,No. 4, pp. 309–338.
—.; Chernyshev, I.; Egger, P.; Mehran, F.; Ritter, J. 2003. “Measuring decent work with statis-tical indicators”, in International Labour Review, Vol. 142, No. 2, pp. 147–177.
Appelbaum, E. et al. (eds). 2003. Low-wage America: How employers are reshapingopportunity in the Workplace (New York, Russell Sage Foundation).
Arpaia, A.; Pérez, E.; Pichelmann, K. 2009. Understanding labour income share
dynamics in Europe, European Commission Economic Papers, 379.
Ashenelter, O.C.; Farber, H.; Ransom, M.R. 2010. “Labor market monopsony”, in Journal o Labor Economics, Vol. 28, No. 2, pp. 203–210.
Australian Bureau o Statistics. 2009. Average weekly earnings, August 2009, explana-tory notes. Available at: http://www.abs.gov.au/AUSSTATS/[email protected]/Lookup /6302.0Explanatory%20Notes1Aug%202009?OpenDocument [8 Sep. 2010].
Bagnoli, P. 2009. “Real wages, productivity and the determinants o the labour share:A structural approach”, Working Party No. 1 on Macroeconomic and StructuralPolicy Analysis, ECO/CPE/WP1(2009)6 (OECD).
Beck, S.; Scherrer, C. 2010. “The German economic model emerges reinorced romthe crisis”, in Global Labour Column, No. 29 (University o the Witwatersrand,South Arica).
Belser, P.; Rani, U. 2010. “Extending the coverage o minimum wages in India: Simu-lations rom household data”, ILO Conditions o Work and Employment SeriesNo. 26, 2010 (Geneva, ILO).
Bils, M. 1985. “Real wages over the business cycle: Evidence rom panel data”, in Journal o Political Economy, Vol. 93, No. 4, pp. 666–689.
Boeri, T.; van Ours, J. 2008. The economics o imperect labor markets (Princeton, NJ,Princeton University Press).
Bosch, G. Forthcoming. “Inequalities in the world o work: The eect o the crisis – thecase o Germany”, in D. Vaughan-Whitehead (ed.), orthcoming.
Bosch, G.; Mayhew, K.; Gautié, J. 2010. “Industrial relations, legal relations and wagesetting”, in J. Gautié and J. Schmitt (eds), 2010.
Boushey, H.; Fremstad, S.; Gragg, R.; Waller, M. 2007. “Understanding low wage workin the United States”, Centre or Economic Policy Research, (Washington, DC).
Brown, W. 2010. “Negotiation and collective bargaining”, in T. Colling and M. Terry(eds.): Industrial relations: Theory and practice, 3rd edn (Chichester, Wiley).
Cardoso, A.; Gindin, J. 2009. “Industrial relations and collective bargaining: Argentina,Brazil and Mexico compared”, ILO Industrial and Employment Relations Depart-ment Working Paper No. 5 (Geneva, ILO).
Caroli, E.; Gautié, J. (eds). 2008. Low-wage work in France (New York, Russell SageFoundation).
Chandoevwit, W. 2010. “The impact o the global nancial crisis and policy responsesin Thailand”, in TDRI Quarterly Review, Vol. 25, No. 1, pp. 12–24.

7/31/2019 Global Wage Report
http://slidepdf.com/reader/full/global-wage-report 118/139
101References
Chen, L.; Hou, B. 2008. “China: Economic transition, employment fexibility and secu-rity”, in S. Lee and F. Eyraud (eds): Globalization, fexibilization and working
conditions in Asia and the Pacic (Oxord, Chandos and Geneva, ILO).
Cuesta, M. 2008, “Low wage employment and mobility in Spain”, in Labour , Vol. 22(Special Issue), pp. 115–146.
Cunningham, W. 2007. Minimum wages and social policy: Lessons rom developing
countries (Washington, DC, World Bank).
De Long, J.; Summers, L.H. 1986. “Is increased price fexibility stabilizing?”, in The
American Economic Review, Vol. 76, No. 5, pp. 1031–1044.
de Serres, A.; Scarpetta, S.; de la Maisonneuve, C. 2002. “Sectoral shits in Europe andthe United States: How they aect aggregate labour shares and the properties o wage equations”, OECD Economics Department Working Paper No. 326.
Devereux, P.J.; Hart, R.A. 2006. “Real wage cyclicality o jobs stayers, within-company job movers, and between-company job movers”, in Industrial and Labor Rela-
tions Review, Vol. 60, No. 1, pp. 105–119.
Doucouliagos, H.; Stanley, T.D. 2009. “Publication selection bias in minimum-wageresearch?: A meta-regression analysis”, in British Journal o Industrial Relations,Vol. 47, No. 2, pp. 406–428.
Duryea, S.; Pagés, C. 2002. “Human capital policies: What they can and cannot do orproductivity and poverty reduction in Latin America”, Inter-American Develop-ment Bank, Research Department Working Paper Series, No. 468.
Economic Policy Institute (EPI). 2006. “Hundreds o economists say: Raise the mini-mum wage”, Economists’ Statement, Oct. (Washington, DC). Available at: http:// www.epi.org/publications/entry/minwagestmt2006/ [8 Sep. 2010].
England, P. 2005. “Emerging theories o care work”, in Annual Review o Sociology,Vol. 31, pp. 381–399.
European Commission. 2003. Employment in Europe 2003 (Brussels).
—. 2004. Employment in Europe 2004 (Brussels).
—. 2005. Employment in Europe 2005 (Brussels).—. 2007. Employment in Europe 2007 (Brussels).
Federal Statistical Oce o Germany. 2010. “2009: Gross earnings alling or the rsttime since the Federal Republic o Germany was ounded”, in Press Release No.074/2010-03-03. Available at: http://www.destatis.de/jetspeed/portal/cms/Sites/ destatis/Internet/EN/press/pr/2010/03/PE10__074__812,templateId=renderPrint.psml [8 Sep. 2010].
Fernández, M.; Meixide, A.; Nolan, B.; Simon, H. 2004. “Low wage employment inEurope”, PIEP Working Paper, April.
Fitoussi, J.-P.; Stiglitz, J. 2009. “The ways out o the crisis and the building o a morecohesive world”, Observatoire Français des Conjonctures Economiques documentde Travail No. 2009-17 (Paris, OFCE).

7/31/2019 Global Wage Report
http://slidepdf.com/reader/full/global-wage-report 119/139
102 Global Wage Report 2010 / 11
Flassbeck, H. 2010. “Putting employment security rst will diminish demand: A warn-ing rom Germany”, in N. Pons-Vignon (ed.): Don’t waste the crisis: Critical
perspectives or a new economic model (Geneva, ILO), pp. 25–27.
Folbre, N. 2001. The invisible heart: Economics and amily values (New York, TheNew Press).
Freeman, R. 1996. “The minimum wage as a redistributive tool”, in The Economic Journal, Vol. 106, May, pp. 639–649.
—. 2008. “Labour productivity indicators: Comparison o two OECD databases produc-tivity dierentials and the Balassa-Samuelson eect”. Retrieved rom OECDStatistics Directorate website: http://www.oecd.org/dataoecd/57/15/41354425.pd [8 Sep. 2010].
Gautié, J.; Schmitt, J. (eds). 2010. Low wage work in the wealthy world (New York,Russell Sage Foundation).
Ghayur, S. 2009. “Evolution o the industrial relations system in Pakistan”, ILO Asia-Pacic Working Paper Series (New Delhi, ILO).
Ghose, A.K. 1997. “Should there be a national minimum wage in India?”, in The Indian Journal o Labour Economics, Vol. 40, No. 4, pp. 697–713.
Gollin, D. 2002. “Getting income shares right”, in Journal o Political Economy, Vol.110, No. 2, pp. 458–474.
Gottschalk, P.; Mott, R. 2009. “The rising inequality o U.S. earnings” in Journal o Economic Perspectives, Vol. 23, No. 4, pp. 3–24.
Guscina, A. 2006. “Eects o globalization on labor’s share in national income”, IMFWorking Paper WP/06/294.
Harrison, A.E. 2002. Has globalization eroded labor’s share? Some cross-countryevidence (Berkeley, CA, University o Caliornia and Cambridge, MA, NationalBureau o Economic Research).
Hayter, S.; Weinberg, B. Forthcoming. “Mind the gap: Collective bargaining and wageinequality”, in S. Hayter (ed.): The role o collective bargaining in the global
economy (Cheltenham, Edward Elgar and Geneva, ILO).
Hayter, S.; Stoevska, V. 2010. “Social dialogue indicators, trade union density andcollective bargaining coverage”, International Statistical Inquiry 2008–09, Tech-nical Brie, Industrial and Employment Relations Department (Geneva, ILO).
Hochschild, A.R. 1983. The managed heart: Commercialisation o human eeling (Berkeley, CA, University o Caliornia Press).
Horn, G.; Dröge, K.; Sturn, S.; van Treeck, T.; Zwiener, R. 2009. “From the nancialcrisis to the world economic crisis: The role o inequality”, IMK Report No. 41(Dusseldor, Hans Böckler Foundation, Macroeconomic Policy Institute andFoundation or European Progressive Studies).
Howell, D.R.; Okatenko, A.; Diallo, M. 2008. “By what measure? A comparison o
French and US labor market perormance with new indicators o employmentadequacy”, PERI Working Paper Series (Amherst, MA, University o Massachu-setts Amherst).
7/31/2019 Global Wage Report
http://slidepdf.com/reader/full/global-wage-report 120/139
103References
Immervoll, H.; Pearson, M. 2009. “A good time or making work pay? Taking stock o in-work benets and related measures across the OECD”, IZA Policy Paper No. 3(Bonn, Institute or the Study o Labour).
Inter-American Development Bank. 2008. “Bad jobs, low wages, and exclusion” in Economic and Social Progress Report 2008 (Washington, DC).
International Institute or Labour Studies (IILS). 2008. World o Work Report 2008:
Income inequalities in the age o nancial globalization (Geneva, ILO/IILS).
—. 2010. World o Work Report 2010: From one crisis to the next? (Geneva, ILO/IILS).
International Labour Oce (ILO). 2008a. Global Wage Report 2008/09 Available at:
http://www.ilo.org/public/english/protection/condtrav/ [8 Sep. 2010].—. 2008b. “Measurement o decent work”, discussion paper or the Tripartite Meeting
o Experts on the Measurement o Decent Work, Geneva, 8–10 Sep. 2008.
—. 2009a. Key Indicators o the Labour Market , 6th edn (Geneva).
—. 2009b. “Gender equality at the heart o decent work”, International Labour Coner-ence, 98th Session, Report VI, Geneva, 2009 (Geneva).
—. 2009c. “The impact o the nancial and economic crisis: Wage xing and policyresponses”, conclusions o the Subregional High Level Conerence, Sarajevo,5–6 Nov. 2009. Available at: http://www.ilo.org/public/english/region/eurpro/ geneva/download/events/sarajevo09_conclusions.pd [8 Sep. 2010].
—. 2009d. “Assessment and policy answers to the economic crisis”, conclusions o theHigh Level Tripartite Seminar on Wage Policy in Caucasus and Central Asia, Nico-sia, 2–3 Nov. 2009. Available at: http://www.ilo.org/public/english/region/eurpro/ geneva/download/events/cyprus2009/cyprus09_conclusions.pd [8 Sep. 2010].
—. 2009e. Panorama Laboral 2009 América Latina y el Caribe (Lima, ILO RegionalOce).
—. 2010a. Global Employment Trends or Youth (Geneva).
—. 2010b. “Accelerating a job-rich recovery in G20 countries: Building on experi-ence”, ILO report, with substantive contributions rom OECD, to the Meetingo G20 Labour and Employment Ministers, 20–21 Apr. 2010, Washington, DC
(Geneva).—. 2010c. Decent work or domestic workers, Report IV(1), International Labour
Conerence, 99th Session, Geneva, 2010 (Geneva).
—. 2010d. World Social Security Report 2010/11: Providing coverage in times o crisisand beyond (Geneva).
—. 2010e. Trends econometric models: A review o the methodology (Geneva).
International Labour Review 2009. Low-wage work in Europe and the United States,Special Issue, Vol. 148, No. 4 (Geneva, ILO).
International Monetary Fund (IMF). 2010a. World Economic Outlook: Rebalancinggrowth (April 2010) (Washington, DC).
–––. 2010b. “The human cost o recessions: Assessing it, reducing it”, in The chal-
lenges o growth, employment and social cohesion, discussion document prepared

7/31/2019 Global Wage Report
http://slidepdf.com/reader/full/global-wage-report 121/139
104 Global Wage Report 2010 / 11
by the IMF and ILO, presented at the Joint ILO-IMF conerence in cooperationwith the oce o the Prime Minister o Norway, Oslo, 13 Sept. 2010.
–––. 2010c. World Economic Outlook: Recovery, risk and rebalancing (October 2010)(Washington, DC).
Jiang, S.; Lu, M.; Sato, H. 2009. “Happiness in the dual society o urban China: Hukouidentity, horizontal inequality and heterogeneous reerence”, Global COE Hi-StatDiscussion Paper Series No. 020 (Tokyo, Hitotsubashi University).
Kauman, B.E. 2007. “The impossibility o a perectly competitive labour market”, inCambridge Journal o Economics, Vol. 31, No. 5, pp. 775–787.
Keynes, J.M. 2007 [1936]. The general theory o employment, interest and money (Basingstoke, Palgrave Macmillan).
Khanna, G.; Newhouse, D.; Paci, P. 2010. “Fewer jobs or smaller paychecks? Labormarket impacts o the recent crisis in middle-income countries”, in Economic
Premise, April (Washington DC, World Bank).
Köllo, J. Forthcoming. “Labor market implications o the global crisis in Hungary2008–2009”, in D. Vaughan-Whitehead (ed.), orthcoming.
Krueger, A.B. 1999. “Measuring labor’s share”, in The American Economic Review,Vol. 89, No. 2, pp. 45–51.
Lee, S.; McCann, D. (eds). Forthcoming. Regulating or decent work: New directions
in labour regulation research (Geneva, ILO and Basingstoke, Palgrave).Lee-Trewheek, G. 1997. “Women, resistance and care: An ethnographic study o nursing
auxiliary work”, in Work, Employment and Society, Vol. 11, No. 1, pp. 47–63.
Lemos, S. 2009. “Minimum wage eects in a developing country”, in Labour Economics,Vol. 16, No. 2, pp. 224–237.
Low Pay Commission. 2008. National Minimum Wage (Norwich, The StationeryOce). Available at: http://www.lowpay.gov.uk/lowpay/report/pd/2008_min_wage.pd [8 Sep. 2010].
—. 2010. National Minimum Wage (Norwich, The Stationery Oce). Available at: http:// www.lowpay.gov.uk/lowpay/report/pd/LPC_Report_2010.pd [8 Sep. 2010].
Luciora, C.; McKnight, A.; Salverda, W. 2005. “Low-wage employment in Europe: Areview o the evidence”, in Socio-Economic Review, Vol. 3, No. 2, pp. 259–292.
Majid, N. 2009. “The global recession and developing countries”, ILO EmploymentWorking Paper No. 40 (Geneva, ILO).
Manning, A. 2003. Monopsony in motion: Imperect competition in labour markets(Princeton, NJ, Princeton University Press).
—. 2010. “Imperect competition in the labour market”, CEP Discussion Paper No. 981(London School o Economics and Political Science).
Marlier, E.; Ponthieux, S. 2000. “Low wage employees in EU countries”, in Statisticsin Focus, Population and Social Conditions, 11/2000.
Mason, G.; Salverda, W. 2010. “Low pay, working conditions, and living standards”, inJ. Gautié and J. Schmitt (eds), 2010.

7/31/2019 Global Wage Report
http://slidepdf.com/reader/full/global-wage-report 122/139
105References
Mazzuchi, G. 2009. Labour relations in Uruguay, 2005–2008, DIALOGUE WorkingPaper No. 6 (Geneva, ILO).
Messenger, J.C. 2009. “Work sharing. A strategy to preserve jobs during the global jobscrisis”, TRAVAIL Policy Brie No. 1 (Geneva, International Labour Oce).
Metcal, D. 2009. “Nothing new under the sun: The prescience o W. S. Sanders’ 1906 FabianTract”, in British Journal o Industrial Relations, Vol. 47, No. 2, pp. 289–305.
Morel, L. 2006. “A sectoral analysis o labour’s share o income in Canada”, unpub-lished paper (Ottawa).
Muñoz de Bustillo Llorente, R.; Antón Pérez, J.I. 2007. “Low wage work in a high
employment growth economy: Spain, 1994–2004”, in Investigación Económica,Vol. LXVI, No. 261, pp. 119–145.
Murgai, R.; Ravallion, M. 2005. “Employment guarantee in rural India: What would itcost and how much would it reduce poverty?”, in Economic and Political Weekly,Vol. 40, No. 31, pp. 3450–3455.
National Bureau o Economic Research (NBER). 2008. “Determination o the Decem-ber 2007 peak in economic activity”, announcement rom the Business CycleDating Committee, 1 December 2008 (Cambridge, MA, NBER). Available at:http://www.nber.org/cycles/dec2008.html [8 Sep. 2010].
Neumark, D.; Wascher, W.L. 2008. Minimum wages (Cambridge, MA, MIT Press).
Onaran, Ö. 2009. “From the crisis o distribution to the distribution o the costs o the crisis: What can we learn rom previous crises about the eects o the nan-cial crisis on labor share?” Political Economy Research Institute Working PaperNo. 195 (Amherst, MA, University o Massachusetts).
Organisation or Economic Co-operation and Development (OECD) 1996. “Earningsinequality, low-paid employment and earnings mobility”, in OECD Employment
Outlook (Paris).
—. 2001. Measuring Productivity Measurement o aggregate and industry-level productivity growth, OECD Manual (Paris).
—. 2006. OECD Employment Outlook: Boosting jobs and incomes (Paris).
—. 2009a. “Real wages, productivity and the determinants o the labour share: A struc-tural approach”, document prepared or the Working Party No. 1 on Macroeco-nomic and Structural Policy Analysis (Paris).
—. 2009b. “Is work the best antidote to poverty?” in OECD Employment Outlook:Tackling the jobs crisis (Paris).
—. 2010. OECD Employment Outlook: Moving beyond the jobs crisis (Paris).
OECD Database or STructural ANalysis (STAN). Available at: http://www.oecd.org/ sti/stan/ [8 Sep. 2010].
OECD System o National Accounts (SNA). Available at: http://www.oecd.org/std/ana.
Osterman, P. 2008. “Improving the quality o low-wage work: The current Americanexperience”, in International Labour Review, Vol. 147, No. 2–3, pp. 115–134.

7/31/2019 Global Wage Report
http://slidepdf.com/reader/full/global-wage-report 123/139
106 Global Wage Report 2010 / 11
Palley, T.I. 2009. “America’s exhausted paradigm: Macroeconomic causes o the nan-cial crisis and great recession”, New American Contract Policy Paper (Washing-ton, DC, The New America Foundation).
Peng, F.; Siebert, W.S. 2008. “Real wage cyclicality in Italy”, in Labour , Vol. 22, No.4, pp. 569–591.
Pitts, S. 2008. “Job quality and black workers” (Berkeley, CA, Center or LaborResearch and Education, University o Caliornia).
Pollin, R.; Brenner, M.; Wicks-Lim, J.; Luce, S. 2008. A measure o airness: Theeconomics o living wages and minimum wages in the United States (Ithaca, NY,
Cornell University Press).Pons-Vignon, N. (ed.). 2010. Don’t waste the crisis: Critical perspectives or a new
economic model (Geneva, ILO).
Ransom, M.R.; Oaxaca, R.L. 2010. “New market power models and sex dierences inpay”, in Journal o Labor Economics, Vol. 28, No. 2, pp. 267–289.
Ravallion, M.; Chen, S.; Sangraula, P. 2008. “Dollar a day revisited”, World BankPolicy Research Working Paper No. 4620 (Washington, DC, World Bank).
Robson, P., Dex, S.; Wilkinson, F.; Cortes, O.S. 1997. “Low pay in Europe and theUSA: Evidence rom harmonised data”, Working paper No. 87 (Cambridge,ESRC Centre or Business Research, Cambridge University).
—. 1999. “Low pay, labour market institutions, gender and part-time work: Cross-national comparisons”, in European Journal o Industrial Relations, Vol. 5, No. 2,pp. 187–207.
Romans, F.; Preclin, V. 2008. “European Union Labour Force Survey – Annual results2007”, Eurostat Data in Focus No. 27/2008 (European Commission). Availableat: http://epp.eurostat.ec.europa.eu/cache/ITY_OFFPUB/KS-QA-08-027/EN/ KS-QA-08-027-EN.PDF.
Rubery, J.; Grimshaw, D. Forthcoming. “Gender and the minimum wage”, in S. Leeand D. McCann (eds), orthcoming.
Russell, E.; Duour, M. 2007. Rising prot shares, alling wages shares (Toronto, Cana-dian Centre or Policy Alternatives).
Särndal, C.-E.; Deville, J.-C. 1992. “Calibration estimators in survey sampling”, in Journal o the American Statistical Association, Vol. 87, No. 418, pp. 376–382.
Salverda, W.; van Klaveren, M.; van der Meer, M. (eds). 2008. Low-wage work in the
Netherlands (New York, Russell Sage Foundation).
Salverda, W.; Nolan, B.; Maitre, B.; Mühlau, P. 2001. Benchmarking low-wage and high-wage employment in Europe and the United States: A study o new Euro-
pean datasets and national data or France, Germany, the Netherlands, the UK and the US , European Low-Wage Employment Research Network (LoWER)(Amsterdam, LoWER).
Sen, R. 2009. Evolution o the industrial relations in West Bengal, ILO Asia-PacicWorking Paper Series (New Delhi, ILO).

7/31/2019 Global Wage Report
http://slidepdf.com/reader/full/global-wage-report 124/139
107References
Solon, G.; Barsky, R.; Parker, J.A. 1994. “Measuring the cyclicality o real wages:How important is composition bias?”, in The Quarterly Journal o Economics,Vol. 109, No. 1, pp. 1–25.
Stockhammer, E. 2009. Determinants o unctional income distribution in OECD coun-
tries, IMK Studies No. 5/2009 (Düsseldor, Macroeconomic Policy Institute).
Tillé, Y. 2001. Théorie des sondages: Echantillonage et estimation en populations nies(Paris, Dunod).
United Nations Conerence on Trade and Development (UNCTAD). 2010. Trade and Development Report 2010 (Geneva and New York, United Nations). Available at:http://www.unctad.org/en/docs/tdr2010_en.pd [8 Sep. 2010].
United States Department o Labor, Bureau o Labor Statistics. 2009. A prole o theworking poor, 2007 , Report No. 1012, March 2009. Available at: http://www.bls.gov/cps/cpswp2007.pd [8 Sep. 2010].
—. 2010a. “Real earnings – January 2010”, news release. Available at: http://www.bls.gov/news.release/archives/realer_02192010.pd [8 Sep. 2010].
—. 2010b. “Real earnings – February 2010”, news release. Available at http://www.bls.gov/news.release/pd/realer.pd [20 Oct. 2010].
—. Current Employment Statistics (CES) survey. Available at: http://www.bls.gov/ces/ data.htm [8 Sep. 2010].
Van Aardt, C.J.; Coetzee, M.C. 2009. Personal income patterns and proles or South
Arica, Bureau o Market Research Report 387 (Pretoria, University o SouthArica).
Vaughan-Whitehead, D. (ed.). Forthcoming. Work inequalities in the crisis: Evidencein Europe (Cheltenham, Edward Elgar and Geneva, ILO).
—. (ed.). 2010. The minimum wage revisited in the enlarged EU (Cheltenham, EdwardElgar and Geneva, ILO).
Westergaard-Nielsen, N. (ed.). 2008. Low-wage work in Denmark (New York, RussellSage Foundation).
Wharton, A.S. 1999. “The psychosocial consequences o emotional labour”, in The Annals o the American Academy o Political and Social Science, Vol. 561,
pp. 158–176.Wicks-Lim, J. 2008. “Mandated wage foors and the wage structure: New estimates o
the ripple eects o minimum wage laws”, in Pollin et al. (eds), 2008.
Wol, P. 2009. “Population and social conditions”, Eurostat Statistics in Focus No.46/2009 (European Commission). Available at: http://epp.eurostat.ec.europa.eu/ cache/ITY_OFFPUB/KS-SF-09-046/EN/KS-SF-09-046-EN.PDF [8 Sep. 2010].
Zelizer, V.A. 2002. “How care counts”, in Contemporary Sociology, Vol. 31, pp. 115–119.

7/31/2019 Global Wage Report
http://slidepdf.com/reader/full/global-wage-report 125/139

7/31/2019 Global Wage Report
http://slidepdf.com/reader/full/global-wage-report 126/139
Statistical appendix
Contents
Table SA1: Average wages . . . . . . . . . . . . . . . . . . . . . . . . . . . . . . . . . . . . . . . . . . . . . . . 111
Table SA2: Minimum wages. . . . . . . . . . . . . . . . . . . . . . . . . . . . . . . . . . . . . . . . . . . . . . 116
Table SA3: I n e q u a l i t y . . . . . . . . . . . . . . . . . . . . . . . . . . . . . . . . . . . . . . . . . . . . . . . . . . . 1 2 1

7/31/2019 Global Wage Report
http://slidepdf.com/reader/full/global-wage-report 127/139

7/31/2019 Global Wage Report
http://slidepdf.com/reader/full/global-wage-report 128/139
111Statistical appendix Table SA1. Average wages
Statistical appendix table SA1: Average wages
Table SA1 comprises the average growth rates o real wages or the period 2000–09.Unless otherwise specied, the level o wages reers, in principle, to gross earnings. Insome cases, indices are used when levels are unavailable. Level data are standardizedto monthly amounts, depending on the unit in which they are originally available (i.e.weekly data are multiplied by 52 weeks and divided by 12 months). Although attemptsare made to gather wage data or all employees, where this is not available, coveragereers to a sub-group o all employees.
Changes in wages rather than levels are reported. This is because cross-country
comparisons in the levels o wages are infuenced by the use o dierent data collectionmethods (i.e. household versus enterprise surveys) and by the coverage o employeesto which each country’s data reer. To estimate growth in real wages, we rst calculatereal wages by dividing nominal wages by the consumer price index (CPI).
Data sources
Table SA1 indicates the source o the data and whether a country’s national statisticaloce (NSO) (or, in some cases, another national counterpart) directly provided data orguidance on their preerred data sources.
Most data on wages were obtained directly rom, and oten in collaboration with,national statistical oces. In some cases, data are obtained rom international sources,such as the United Nations Economic Commission or Europe (UNECE). Addition-ally, or some countries in Latin America and the Caribbean, average wages were esti-mated directly by the ILO/SIALC (Labour Analysis and Inormation System) romprimary household-level data sets. Data on the CPI are generally obtained rom theInternational Monetary Fund’s World Economic Outlook database.129
Table SA1 Average wages
Country/Territory
Growth of real average monthly wages, in % p.a.
SourceNSO provided
data/assistance2000–051 2006 2007 2008 2009
Advanced countries (selected)
Australia 1.1 3.2 5.0 –0.9 2.0 Australian Bureau o Statistics
Austria –0.2 1.4 1.4 –0.3 2.0* Statistics Austria X
Belgium 0.9 –0.1 –1.2 –0.2 3.2* Belgium Ministry
o Economic Aairs
X
Canada 0.0 0.4 2.1 0.5 1.3 Statistics Canada X
Cyprus 2.5 2.4 1.4 0.5 3.8* Statistical Service o Cyprus X
Denmark 1.2 0.7 3.0 –1.2 2.2* Statistics Denmark X
Finland 2.3 1.8 2.2 1.2 3.3* Statistics Finland X
129 In the cases o Brazil and the United States, where our national counterparts recommended the use o an alterna-tive CPI, we relied on national sources rom the Brazilian IBGE and the US BLS, respectively.

7/31/2019 Global Wage Report
http://slidepdf.com/reader/full/global-wage-report 129/139
112 Global Wage Report 2010 / 11
Country/Territory
Growth of real average monthly wages, in % p.a.
SourceNSO provideddata/assistance2000–051 2006 2007 2008 2009
France 0.6 0.5 1.5 2.7 –0.8* France National Institute
o Statistics and Economic
Studies
X
Germany –0.4 –0.9 –0.6 –0.4 –0.4 Federal Statistical Oce
o Germany
X
Greece 3.6 .. 2.3* 1.0* .. National Statistical Service
o Greece
X
Iceland 4.5 2.7 6.1 –4.9 –8.0 Statistics Iceland X
Ireland .. .. –1.3 –1.5* 1.5* Central Statistics Oce
o Ireland
X
Israel 0.3 –0.3 6.2 –1.1 –2.6* Israel Central Bureau
o Statistics
X
Italy 0.3 0.4 0.1 –0.7 2.4* Italy National Bureau
o Statistics
X
Japan 0.7 –0.3 –0.1 –1.9 –1.9 Japan Ministry o Health, Labor
and Welare
X
Korea (Republic o) 4.4 3.4 –1.8 –1.5 –3.3 Ministry o Labour o Korea X
Luxembourg 0.9 0.8 1.5 0.3 1.5 STATEC Luxembourg X
Malta –0.4 1.6 1.8 0.0 0.2 Malta National Statistics Oce X
Netherlands 0.1 1.0* 0.1* 1.2* 2.3* Statistics Netherlands X
New Zealand 1.3 –0.3 4.9 0.1 0.1 Statistics New Zealand X
Norway 2.4 2.3 4.9 1.9 1.0 Statistics Norway X
Portugal 1.2 –0.1 0.7 2.0 .. Oce o Strategy and Planning
(GEP) o the Ministry o Labourand Social Solidarity
X
Singapore 2.6 2.2 4.0 –1.0 –2.8 Statistics Singapore X
Spain –0.1 1.2 1.1 0.9 3.5 Spain National Statistics
Institute
X
Sweden 2.1 1.4 1.5 1.7 0.6* Statistics Sweden X
Switzerland 0.8 0.1* 0.9* –0.4* 2.6* Swiss Federal Statistical Oce X
United Kingdom 2.3 1.8 0.6 0.8 –0.5 UK National Statistics X
United States, series A .. .. .. –1.1 1.5 US Bureau o Labor Statistics X
United States, series B .. 1.1 1.0 –1.0 2.2 US Bureau o Labor Statistics X
Africa
Algeria –0.1 6.6 4.7 .. .. Algeria National Statistical
Oce
X
Botswana 2.1 0.1 3.0 –4.8 5.4 Central Statistical Oce
o Botswana
Egypt 1.7 6.1 –0.8 .. .. Egypt Central Agency or Public
Mobilization and Statistics
X
Kenya .. –1.8 0.9 .. .. Kenya National Bureau
o Statistics
Malawi 12.5 –6.3 .. .. .. National Statistical Oce
o Malawi
X
Mauritius 3.2 –3.9 –2.5 –1.8 .. Central Statistics Oce
o Mauritius
Morocco .. –0.3 0.8 1.7 5.2 Morocco National Social
Security Fund
X
Reunion .. 0.1 1.4 .. .. France National Institute
o Statistics and Economic
Studies
Table SA1 (continued)

7/31/2019 Global Wage Report
http://slidepdf.com/reader/full/global-wage-report 130/139
113Statistical appendix Table SA1. Average wages
Country/Territory
Growth of real average monthly wages, in % p.a.
SourceNSO provideddata/assistance2000–051 2006 2007 2008 2009
Senegal 2.5 2.2 .. .. .. Senegal Les salaires: état des
lieux, tendances et evolution
recentes, Momar Ballé Sylla,
August 2009, mimeo
South Arica .. .. 1.0 0.0 3.5 Statistics South Arica X
Swaziland –0.4 .. .. .. .. Swaziland Central Statistics
Oce
Tanzania 7.1 .. .. .. .. Tanzania National Bureau
o Statistics
Tunisia 2.7 1.2 2.2 0.0 2.3 Tunisian National Instituteo Statistics
Uganda .. 4.7 7.9 .. .. Uganda Bureau o Statistics X
Zimbabwe –7.4 .. .. .. .. Central Statistical Oce
o Zimbabwe
Asia
China 12.6 12.9 13.1 11.7 12.8 National Bureau o Statistics
China
Hong Kong (China) .. 2.0 1.7 –4.1 –2.9 Census and Statistics
Department o Hong Kong
Macau (China) 1.9 0.2 1.2 –0.8 1.8 Statistics and Census Service
Macao SAR Government
Fiji 0.7 .. .. .. .. Fiji Islands Bureau o Statistics
India 2.6 0.4 –0.6 8.3 .. Government o India Ministryo Statistics and Programme
Implementation
X
Indonesia 10.4 –6.1 –1.1 –2.4 –0.3 Statistics Indonesia
o the Republic o Indonesia
X
Iran .. 8.0 0.0 .. .. Statistical Centre o Iran X
Malaysia 3.5 0.0 3.2 –4.7 1.4 Department o Statistics
o Malaysia
X
Mongolia 2.4 20.9 25.1 25.0 3.1 Mongolia National Statistical
Oce
X
Myanmar –6.7 142.5 1.5 11.2 .. Myanmar Department o Labour
(retrieved rom ILO Laborsta)
Nepal 6.5 –0.5* 3.4* 3.7 3.9* Government o Nepal Central
Bureau o Statistics
Pakistan 2.5 .. 7.2 2.4 .. Government o Pakistan
Statistics Division
X
Philippines –1.1 0.5 –1.0 –4.3 1.0 National Statistical Oce
o the Philippines
X
Sri Lanka –0.7 1.1 –4.8 –4.6 1.6* Sri Lanka Department
o Labour (retrieved rom ILO
Laborsta)
Thailand –1.0 1.5 0.7 4.5 –1.6 National Statistical Oce
o Thailand
Eastern Europe and Central Asia
Armenia 14.2 16.3 14.1 8.1 12.6 National Statistics Service
o Armenia
X
Azerbaijan 17.5 10.9 24.3 5.0 7.2 State Statistical Committee
o the Republic o Azerbaijan
X
Table SA1 (continued)

7/31/2019 Global Wage Report
http://slidepdf.com/reader/full/global-wage-report 131/139
114 Global Wage Report 2010 / 11
Country/Territory
Growth of real average monthly wages, in % p.a.
SourceNSO provideddata/assistance2000–051 2006 2007 2008 2009
Belarus 14.8 17.3 9.9 8.9 1.8 Republic o Belarus Ocial
Statistics
X
Georgia 13.8 24.8 21.2 32.2 2.0* National Statistics Oce
o Georgia
Kazakhstan 10.2 10.2 16.1 –1.1 3.2 Agency o Statistics
o Kazakhstan
Kyrgyzstan 9.4 18.6 10.2 8.8 7.2 National Statistical Committee
o the Kyrgyz Republic
Russian Federation 15.1 13.3 17.3 11.5 –3.5 Federal State Statistics
Service, Russian Federation
X
Tajikistan 16.7 25.6 24.2 18.2 18.3* State Committee
on Statistics o Tajikistan
Turkmenistan 29.4 .. .. 4.0 7.4 State Committee
o Turkmenistan Statistics
Uzbekistan 22.1 .. .. .. .. UNECE
Central and Eastern Europe
Albania 5.9 6.7 21.6 19.7 .. Albania National Institute
o Statistics
X
Bosnia and Herzegovina 4.4 1.8* 8.2 8.6 8.6 Agency o Statistics or Bosnia
and Herzegovina
X
Bulgaria 1.9 3.4 11.3 13.0 10.4* Bulgarian National Statistical
Institute
Croatia 2.3 2.9 3.4 1.2 –0.2* Republic o Croatia Central
Bureau o Statistics
X
Czech Republic 4.1 3.1 4.4 0.7 0.2 Czech Statistical Oce X
Estonia 6.6 11.6 13.0 3.2 –4.9 Statistics Estonia
Hungary 5.8 4.2 0.0 1.3 –3.5 Hungarian Central Statistic
Oce
Latvia 5.7 15.2 19.7 4.4 –6.8 Statistics Latvia X
Lithuania 3.4 13.0 13.9 7.5 –8.5 Statistics Lithuania
Macedonia (Former
Yugoslav Republic)
1.3 4.6 2.4 0.4 15.0 Republic o Macedonia State
Statistical Oce
Moldova
(Republic o)
12.6 14.2 8.3 8.7 8.6 National Bureau o Statistics
Moldova
X
Poland 1.7 3.8 5.3 5.6 2.0 Central Statistical Oce
o Poland
X
Romania 6.9 11.1 16.2 17.0 1.6 Romanian National Institute
o Statistics
X
Serbia 14.7 10.4 14.6 4.9 –10.6 Statistical Oce
o the Republic o Serbia
X
Slovakia 2.6 2.5 7.5 3.5 2.9 Statistical Oce
o the Slovak Republic
X
Slovenia 2.8 3.1 2.6 2.5 2.6* Statistical Oce
o the Republic o Slovenia
X
Turkey .. 2.6 1.1 0.2 1.7 TurkStat X
Ukraine 15.7 18.4 15.0 6.8 –8.9 State Committee o Statistics
o Ukraine
X
Table SA1 (continued)

7/31/2019 Global Wage Report
http://slidepdf.com/reader/full/global-wage-report 132/139
115Statistical appendix Table SA1. Average wages
Country/Territory
Growth of real average monthly wages, in % p.a.
SourceNSO provideddata/assistance2000–051 2006 2007 2008 2009
Latin American and the Caribbean
Argentina –4.0 6.3 10.8 12.7 12.4 Argentinean National Institute
o Statistics and Censuses
Brazil –1.7 4.0 3.2 3.4 3.2 Brazilian Institute o Geography
and Statistics (IBGE)
X
Chile 0.7 0.6 2.8 0.6 4.4 National Statistics Institute
o Chile
Colombia 1.5 3.9 –0.3 –2.0 1.1 Central Bank o Colombia
Costa Rica –0.4 2.5 5.3 0.0 .. ILO/SIALCDominican Republic –5.9 –0.4 4.1 –0.6 2.2 Central Bank o the Dominican
Republic
Ecuador 6.0 8.4 11.3 10.5 7.0 National Institute o Statistics
and Census o Ecuador
Guadeloupe .. 0.4 1.2 .. .. France National Institute
o Statistics and Economic
Studies
Guyana .. –5.2 –9.1 .. .. France National Institute
o Statistics and Economic
Studies
Honduras 1.3 1.3 6.1 .. .. ILO/SIALC
Jamaica –3.1 3.5 1.4 –6.2 1.0 Statistical Institute o Jamaica X
Martinique .. –1.1 0.6 .. .. France National Institute
o Statistics and Economic
Studies
Mexico 3.3 3.1 1.3 –2.6 –5.0 Mexico National Employment
Service Job Portal
Panama –1.3 0.8 –3.4 –2.6 6.2 ILO/SIALC
Paraguay –3.8 –2.1 –3.8 2.2 .. ILO/SIALC
Peru –0.1 –2.4 –1.5 –3.2 .. ILO/SIALC
Puerto Rico 0.8 0.4 1.5 –0.6 3.6 US Bureau o Labor Statistics
Uruguay –5.0 4.5 4.9 5.2 7.2 National Institute o Statistics
o Uruguay
Venezuela 0.5 18.6 6.3 1.9 .. ILO/SIALC
Middle East
Bahrain –0.6 –2.4 5.1 5.2 –3.7 Kingdom o Bahrain Labour
Market Regulatory AuthorityJordan 0.6 0.6 3.4 –0.1 .. Jordan Department o Statistics X
Kuwait 1.5 .. .. .. .. Kuwait Central Statistical
Oce
Oman .. .. 5.1 –2.2 .. Oman Ministry o the National
Economy
Qatar .. .. 6.7 .. .. Qatar Statistics Authority
Saudi Arabia 0.2 –0.8 –1.7 .. .. Saudi Arabia Central
Department o Statistics
X
Syrian Arab Republic .. .. –0.9 2.3 2.2 Syria Central Bureau
o Statistics
X
United Arab
Emirates
–0.2 0.1 .. .. .. UAE Ministry o the Economy X
West Bank and Gaza 0.6 5.5 –0.6 1.9 –2.7 Palestinian Central Bureau
o Statistics
X
.. = Data are unavailable or the period. * Based on secondary data series. 1 ILO estimate
Note: Annual growth rates are generally calculated based on nominal values rom the source listed and the CPI published by the International Monetary Fund.
See also ootnote 129.
Table SA1 (continued)

7/31/2019 Global Wage Report
http://slidepdf.com/reader/full/global-wage-report 133/139
116 Global Wage Report 2010 / 11
Statistical appendix table SA2: Minimum wages
Table SA2 provides inormation on minimum wages. The rst two columns show theratication as o 1 January 2010 o the Minimum Wage-Fixing Machinery Conven-tion, 1928 (No. 26), and o the Minimum Wage Fixing Convention, 1970 (No. 131). Avalue o 1 indicates ratication. Next, the table provides the real annual growth rateo minimum wages rom 2006 to 2009. Finally, table SA2 also provides the minimumwage, expressed in international dollars, using purchasing power parity (PPP) conver-sion rates and the latest year or which minimum wage data are available (an interna-tional dollar has the same purchasing power as a US dollar has in the United States).
Whenever countries have more than one national-level minimum wage, we provide anestimate o the average o the dierent minimum wage rates.
Data sources
The data on minimum wages are drawn mainly rom national sources, with some addi-tional secondary sources. They have been collected over the years by the ILO andmade available to the public through the ILO legal database (http://www.ilo.org/public/ english/protection/condtravail/). For the purpose o the present report, this database hasbeen complemented and updated.
Table SA2 Minimum wages
Country/Territory
Ratifcationo Convention
Growth o real minimum monthly wage,in % p.a.
Minimum wagein PPP$(most recent year)No. 26 No. 131 2006 2007 2008 2009
Advanced countries (selected)
Australia 1 1 0.1 3.2 1.8 –1.8 1597
Austria 1 .. .. .. .. ..
Belgium 1 –0.3 2.1 –0.4 4.1 1492
Canada 1 1.0 1.1 5.3 6.9 1325
Cyprus .. .. .. 6.3 1044
France 1 1 1.1 0.4 0.0 1.2 1443
Germany 1 .. .. .. .. ..
Greece 2.9 5.0 –0.8 7.2 1096
Ireland 1 –2.6 9.9 –3.0 1.7 1368
Israel 5.3 2.9 –0.8 –3.2 960
Italy 1 .. .. .. .. ..
Japan 1 1 0.4 2.1 0.9 2.8 944
Korea (Republic o) 1 1 6.8 9.5 3.5 3.3 797
Luxembourg 1 –0.2 –0.4 –0.9 3.7 1687
Malta 1 1 0.7 0.1 0.1 1.8 ..
Netherlands 1 1 –0.1 0.9 0.8 2.1 1606
New Zealand 1 4.4 7.2 2.6 2.0 1367
Norway 1 .. .. .. .. ..
Portugal 1 1 –0.1 2.0 3.0 6.6 618
Singapore .. .. .. .. ..
Spain 1 1 1.8 2.6 1.0 4.3 911

7/31/2019 Global Wage Report
http://slidepdf.com/reader/full/global-wage-report 134/139
117Statistical appendix Table SA2. Minimum wages
Country/Territory
Ratifcationo Convention
Growth o real minimum monthly wage,in % p.a.
Minimum wagein PPP$(most recent year)No. 26 No. 131 2006 2007 2008 2009
Switzerland 1 .. .. .. .. ..
United Kingdom 3.6 0.8 0.2 –0.9 1507
United States –3.1 10.4 7.9 11.0 1257
Africa
Algeria 17.3 –3.4 –4.6 –5.4 308
Angola 1 –15.0 11.4 17.6 –12.3 94
Benin 1 15.6 –1.2 –7.4 –2.1 106
Botswana –3.1 –1.0 –5.0 –7.5 159
Burkina Faso 1 1 4.1 0.3 –9.6 –2.5 124
Burundi 1 –2.8 –7.7 –19.6 –10.2 6
Cameroon 1 1 –4.7 –1.1 14.0 –3.0 95
Central Arican Republic 1 1 .. .. .. .. ..
Chad 1 –7.2 17.6 –7.7 –9.2 87
Comoros 1 .. .. .. –4.6 ..
Congo 1 .. .. .. –4.2 135
Congo (Democratic Republic o) 1 31.8 –14.3 .. .. 219
Côte d'Ivoire 1 –2.4 –1.9 –5.9 –1.0 112
Egypt 1 1 –4.0 –9.9 –10.5 –14.0 14
Ethiopia –10.9 38.1 –20.2 –26.7 67
Gabon 1 84.4 –4.8 –5.0 –2.1 182
Gambia .. .. .. –4.4 48
Ghana 1 –9.2 –9.7 359.8 –1.0 123
Guinea 1 .. .. .. .. ..
Guinea-Bissau 1 .. .. .. .. ..
Kenya 1 1 –2.1 –8.9 –11.6 5.6 205
Lesotho 1 –2.4 0.3 –2.9 –7.1 206
Liberia .. .. .. –6.9 ..
Libyan Arab Jamahiriya 1 1 .. .. .. .. 273
Madagascar 1 1.2 –0.1 2.6 –8.2 76
Malawi 1 –12.2 –7.4 34.7 –7.8 53
Mali 1 –1.5 –1.4 .. .. 97
Mauritania 1 .. .. .. –2.2 152
Mauritius 1 .. .. .. –5.2 173
Morocco 1 –3.2 –2.0 1.0 3.9 371
Mozambique –2.0 5.4 .. .. ..Niger 1 1 –0.1 39.9 –10.1 –4.1 104
Nigeria 1 –7.6 –5.1 .. .. 83
Rwanda 1 .. .. .. .. ..
Senegal 1 –2.1 –5.5 –5.4 1.1 117
Sierra Leone 1 .. .. .. .. ..
South Arica 1 0.9 –1.1 –2.3 4.7 390
Sudan 1 –6.7 –8.1 –12.5 –10.1 84
Swaziland 1 1 .. .. .. .. ..
Tanzania 1 1 –6.8 –6.6 22.8 –10.8 117
Togo 1 –2.2 –0.9 87.3 –1.9 98
Tunisia 1 –1.5 0.3 –0.3 –2.6 315
Uganda 1 –6.2 –6.4 –6.8 –12.4 7
Zambia 1 1 195.5 –9.6 –11.1 –11.8 77
Zimbabwe 1 .. .. .. .. ..
Table SA2 (continued)

7/31/2019 Global Wage Report
http://slidepdf.com/reader/full/global-wage-report 135/139
118 Global Wage Report 2010 / 11
Country/Territory
Ratifcationo Convention
Growth o real minimum monthly wage,in % p.a.
Minimum wagein PPP$(most recent year)No. 26 No. 131 2006 2007 2008 2009
Asia
Aghanistan .. .. .. 13.7 89
Bangladesh .. –8.4 –7.2 –5.7 58
Bhutan –4.8 –4.9 –7.7 –8.0 108
China 1 12.9 4.7 .. .. 173
Fiji 1 .. .. .. .. 300
India 1 –5.8 –6.0 11.9 .. 121
Indonesia 4.7 5.2 1.3 .. 148
Iran 5.9 3.0 –4.3 .. 541
Lao 100.1 –4.3 34.7 20.0 85
Mongolia .. .. .. –5.9 159
Myanmar 1 .. .. .. .. ..
Nepal 1 27.7 –6.0 29.4 –11.7 151
Pakistan –7.3 42.3 16.5 –17.2 229
Papua New Guinea 1 .. .. .. 151.4 249
Philippines 1.4 0.6 –3.5 –3.1 379
Solomon Islands 1 –10.0 –7.1 127.2 –6.6 156
Sri Lanka 1 1 –7.5 16.3 4.4 .. 93
Thailand –1.2 1.5 0.8 0.9 295
Viet Nam 19.6 27.2 –18.8 –1.8 85
Eastern Europe and Central Asia
Armenia 1 1 12.1 27.7 14.7 16.0 144
Azerbaijan 1 –7.7 42.9 24.2 –1.5 121
Belarus 1 14.4 5.1 1.8 –7.6 250
Georgia –8.4 –8.5 –9.1 –1.7 21
Kazakhstan –8.0 –4.3 5.3 6.3 165
Kyrgyzstan 1 –5.3 208.5 –19.7 –6.4 20
Russian Federation 25.4 91.8 14.3 10.5 223
Tajikistan 51.6 –11.6 149.1 –6.1 48
Uzbekistan 15.7 11.3 43.1 31.9 ..
Central and Eastern Europe
Albania 1 1 15.9 11.7 2.2 3.6 329
Bosnia and Herzegovina 1 .. .. .. .. ..
Bulgaria 1 –0.7 4.6 9.2 6.5 292
Croatia 1.0 3.0 12.7 0.1 613
Czech Republic 1 8.0 –2.2 –6.0 –1.0 526
Estonia 6.8 12.6 9.5 0.1 426
Hungary 1 5.6 –2.9 –0.7 –0.6 498
Latvia 1 5.6 21.1 15.7 8.9 421
Lithuania 1 5.1 10.3 2.8 –4.0 428
Macedonia (Former Yugoslav
Republic o)
1 .. .. .. .. ..
Moldova (Republic o) 1 .. .. .. .. ..
Poland 4.8 1.6 15.4 9.5 628
Romania 1 –0.1 12.7 28.4 5.2 320
Serbia 1 –11.2 54.9 –11.1 26.7 376
Table SA2 (continued)

7/31/2019 Global Wage Report
http://slidepdf.com/reader/full/global-wage-report 136/139
119Statistical appendix Table SA2. Minimum wages
Country/Territory
Ratifcationo Convention
Growth o real minimum monthly wage,in % p.a.
Minimum wagein PPP$(most recent year)No. 26 No. 131 2006 2007 2008 2009
Slovakia 1 5.6 4.6 –3.8 8.9 485
Slovenia 1 1.8 –1.6 2.8 3.1 855
Turkey 1 –0.9 1.3 –1.1 2.2 609
Ukraine 1 10.5 1.9 5.0 6.1 311
Latin American and the Caribbean
Argentina 1 14.5 12.6 16.5 9.3 896
Bahamas 1 –1.8 –2.4 –4.3 –2.0 787
Barbados 1 .. .. .. .. ..
Belize 1 .. .. –6.0 –2.0 388
Bolivia 1 1 9.0 –3.4 –3.5 8.3 215
Brazil 1 1 12.0 4.8 3.3 6.8 286
Chile 1 1 2.4 2.2 1.6 2.1 400
Colombia 1 2.5 0.7 –0.5 3.3 390
Costa Rica 1 1 1.1 0.9 2.0 1.2 489
Cuba 1 1 .. .. .. .. ..
Dominican Republic 1 –7.0 8.3 –9.6 13.3 221
Ecuador 1 1 3.3 3.9 8.5 3.8 490
El Salvador 1 5.8 0.5 –2.1 7.4 304
Guatemala 1 1 1.6 –2.5 –5.8 4.2 344
Guyana 1 1 .. .. .. 0.1 145
Haiti –12.5 –8.3 –12.6 176.3 209Honduras 5.1 3.8 –0.4 88.8 432
Jamaica 1 7.5 4.6 –5.2 0.4 310
Mexico 1 1 0.4 –0.1 –1.1 –0.6 170
Nicaragua 1 1 7.6 6.2 –4.0 11.4 198
Panama 1 5.0 0.5 –3.9 –2.4 451
Paraguay 1 2.2 1.7 –9.2 2.3 559
Peru 1 6.6 4.1 –1.9 –2.9 334
Trinidad and Tobago –7.7 –7.3 –10.8 –6.5 285
Uruguay 1 1 12.8 0.0 18.6 0.0 258
Venezuela 1 11.3 1.1 –0.3 –4.7 481
Middle East
Iraq 1 1 .. .. .. .. ..
Jordan 9.0 –5.1 –13.0 37.3 261
Lebanon 1 1 –5.3 –3.9 50.5 –1.2 ..
Oman .. .. .. –3.4 441
Syrian Arab Republic 1 1 67.0 –4.5 –10.1 .. 207
Yemen 1 .. .. .. .. ..
.. = Data are unavailable or the period.
Notes: Annual growth rates are generally calculated based on nominal values and the CPI published by the International Monetary Fund.
Purchasing power parity levels represent the amount o goods able to be purchased in the United States in US dollars, with a given country’s monthly minimum
wage.
Table SA2 (continued)

7/31/2019 Global Wage Report
http://slidepdf.com/reader/full/global-wage-report 137/139
120 Global Wage Report 2010 / 11
Statistical appendix table SA3: Inequality
Table SA3 presents several indicators that are widely used to measure inequality at thenational level. The rst three columns present a simple average o the low-pay rate acrossthree time periods: 1995–2000, 2001–06 and 2007–09. The next columns compare top,median and bottom wage deciles: D9 is the wage level above which the top 10 per cento workers are paid, D5 is the median wage (which separates the wage distributioninto two equal halves) and D1 is the wage level below which the bottom 10 per cento workers are paid. Hence, D9/D1 is a measure o overall inequality between top andbottom wage earners, which can be decomposed into inequality in the upper hal o the
distribution (D9/D5 ratios) and inequality in the lower hal o the distribution (D5/D1).Simple averages or the same three periods as used or low pay are given or both theD9/D1 and D5/D1 ratios.
Data sources
The data on inequality were obtained rom national statistical oces, internationalsources (such as the OECD) and individual country studies commissioned by the ILO.For countries in Latin America and the Caribbean, inequality was estimated directly bythe ILO/SIALC (Inormation System and Labour Analysis) rom primary household-level data sets.
Table SA3 Inequality
Country/territory
Low pay rates
Decile ratios
D9/D1 D5/D1
1995–2000
2001–06 2007–09 1995–2000
2001–06 2007–09 1995–2000
2001–06 2007–09
Advanced countries (selected)
Australia 13.5 14.5 16.8 3.0 3.1 3.3 1.6 1.7 1.7
Austria .. 15.4 16.2 .. 3.3 3.4 .. 1.7 1.8
Belgium 12.4 12.1 12.7 2.7 2.8 2.8 1.6 1.6 1.6
Canada 22.4 22.1 22.0 3.6 3.7 3.8 2.0 2.0 2.0
Denmark 8.5 11.1 12.0 2.5 2.6 2.7 1.5 1.5 1.6
Finland 5.4 4.6 5.3 2.2 2.3 2.3 1.4 1.4 1.4
France .. .. .. 3.1 3.0 .. 1.6 1.5 ..
Germany 16.6 19.2 21.2 3.1 3.2 3.3 1.7 1.9 1.9
Ireland 19.1 19.5 21.7 3.6 3.8 3.8 1.8 1.9 1.9
Israel 23.8* 22.6* 22.1* 11.5* 11.4* 11.2* 4.7* 4.6* 4.5*
Japan 15.0 15.0 15.3 .. .. .. .. .. ..
Korea (Republic o) 23.2 24.5 25.6 3.8 4.3 4.7 1.9 2.0 2.1
Luxembourg 14.5 20.1 .. 3.0 3.4 .. 1.6 1.7 ..
Netherlands 14.3 .. .. 2.8 2.9 .. 1.7 1.7 ..
New Zealand 14.0* 14.8* 14.2* 8.8* 7.9* 7.3* 4.6* 4.1* 3.8*
Norway .. .. .. 2.0 2.1 3.0 1.4 1.5 1.5
Portugal 12.4 11.9 12.1 3.9 3.9 3.9 1.6 1.5 1.5

7/31/2019 Global Wage Report
http://slidepdf.com/reader/full/global-wage-report 138/139
121Statistical appendix Table SA3. Inequality
Country/territory
Low pay rates
Decile ratios
D9/D1 D5/D1
1995–2000
2001–06 2007–09 1995–2000
2001–06 2007–09 1995–2000
2001–06 2007–09
Spain .. 13.3 14.1 .. 4.2 4.1 .. 2.0 1.9
Sweden 5.7 6.2 .. 2.2 2.3 .. 1.4 1.4 ..
Switzerland 11.7 11.7 11.8 2.6 2.6 2.7 1.5 1.5 1.5
United Kingdom 20.5 20.6 20.8 6.8 7.0 7.2 3.3 3.2 3.3
United States 24.8 23.8 24.5 4.6 4.7 4.9 2.1 2.1 2.1
Africa
Senegal .. .. .. 54.1 .. .. 8.3 .. ..
South Arica 33.8 32.6 32.4 .. .. .. .. .. ..
Asia
China .. .. .. .. .. .. .. .. ..
China (local) 21.6 19.5 21.7 .. .. .. .. .. ..
China (migrant) .. 66.5 42.6 .. .. .. .. .. ..
Indonesia 27.4 27.2 28.9 16.2 12.1 15.5 .. .. ..
Philippines .. 13.9 14.4 9.1* 8.5* .. 3.1* 3.0* ..
Eastern Europe and Central Asia
Armenia .. .. 28.6* .. .. 5.0* .. .. 2.6*
Azerbaijan 4.6 24.3 43.3 15.1 8.0 15.4 5.3 3.7 5.5
Kazakhstan .. .. .. 9.8* 7.6* 6.7* .. .. ..
Central and Eastern Europe
Albania .. .. .. 4.1* .. .. .. .. ..
Czech Republic 14.6 16.3 16.8 2.8 3.0 3.1 1.7 1.7 1.7
Estonia .. .. .. .. 4.7 4.6 .. 2.2 2.2
Hungary 21.8 22.6 .. 4.2 4.4 .. 1.9 1.9 ..
Latvia .. .. 33.7* .. .. 7.8* .. .. 2.8*
Moldova (Republic o) .. 21.6 23.8 .. 5.1 4.7 .. 2.3 2.3
Poland 18.3 22.0 22.7 3.5 4.0 4.1 1.8 2.0 2.0
Slovakia .. .. .. .. 3.5 3.7 .. 1.8 1.9
Latin American and the Caribbean
Argentina 25.2 32.3 29.3 8.2 10.6 11.5 3.7 4.7 5.6
Brazil .. 22.9 22.1 10.4 9.7 8.5 3.4 3.5 3.3Chile 19.5 17.3 14.7 .. .. .. .. .. ..
Table SA3 (continued)

7/31/2019 Global Wage Report
http://slidepdf.com/reader/full/global-wage-report 139/139
Global Wage Report 2010 / 11122
Country/territory
Low pay rates
Decile ratios
D9/D1 D5/D1
1995–2000
2001–06 2007–09 1995–2000
2001–06 2007–09 1995–2000
2001–06 2007–09
Colombia .. 31.5 30.8 .. 9.5 9.8 .. 4.2 4.2
Costa Rica 19.4 24.8 24.3 8.1 8.4 7.7 3.5 3.5 3.2
Ecuador 29.8 30.1 27.6 9.3 8.8 7.2 4.0 3.9 3.1
Honduras 28.7 36.2 36.1 8.7 9.5 9.4 3.8 3.9 3.8
Mexico 24.6 24.5 23.6 6.8 6.0 5.8 2.9 2.8 2.8
Panama 24.4 12.7 36.8 8.5 8.8 7.6 3.5 3.7 3.5
Paraguay 30.4 31.7 30.7 8.5 8.3 7.5 4.1 4.3 4.1
Peru 29.1 26.6 25.5 7.9 7.4 7.6 3.3 3.1 3.2
Uruguay 31.0 30.8 31.8 8.0 8.8 12.3 4.2 4.9 4.9
Venezuela (Bolivarian Republic o) 26.0 26.6 23.2 7.8 6.8 4.6 3.6 3.3 2.7
Middle East .. .. .. .. .. .. .. .. ..
.. = Data are unavailable or the period. * Figures are based on income.
Table SA3 (continued)