Embed Size (px)
Citation preview

Global Utility Trends – Q1 FY15
Presented by Bob Knox, OSIsoft T&D User’s Conference 2015

Copyright © 2014 Accenture. All rights reserved
Table of Contents
About Accenture Research
Global Trends Summary
North America
EALA
APAC
Conclusion
2

Copyright © 2014 Accenture. All rights reserved
About Accenture Research
Accenture Research is a worldwide network of 200+ research professionals who have strong
knowledge of various industries, geographies, technologies, and service lines, as well as research
methods and techniques. Our core capabilities span a variety of needs, from basic data gathering to
in-depth analysis and survey development.
To access enterprise-wide research sources, please visit myResearch
For more information about this document or Accenture Research, please contact:
Jason A. Allen
Global Utilities/NA Research Lead
Lasse Kari
EALA Utilities Research Lead
Freda Tong
APAC Utilities Research Lead
Ana Clara Gimenez
NA/LATAM
Sankara Narayanan
APAC
3

Copyright © 2014 Accenture. All rights reserved
Table of Contents
About Accenture Research
Global Trends Summary
North America
EALA
APAC
Conclusion
4
Copyright © 2014 Accenture. All rights reserved
• Smart grid programs
• Electric vehicles
• Distributed generation/storage
• Operational Technologies/IT
convergence
• Social/Mobility/Analytics/Cloud
• Government/legislative
mandates
• Regulatory impacts on
rates, capex, earnings
• Liberalization
• Subsidies
• Merger & acquisitions
• Future business models
• Cost management
• Renewable/clean energy
• Meeting rising demand
• Energy efficiency
• Emission reduction
• Aging workforce
• Adequate generation
capacity/fuel supply
• Reliability issues
• Aging infrastructure
• Renewables integration
• Physical/cyber security risks
• Evolving energy consumers
• Customer satisfaction
• Retail competition
Utilities Under
Pressure
Technology
Sustainability
Market
Structure
End
Consumers
Regulation
Security of
Supply
Utilities are impacted by a variety of long-term trends
Source: Accenture Research
Copyright © 2014 Accenture. All rights reserved 6
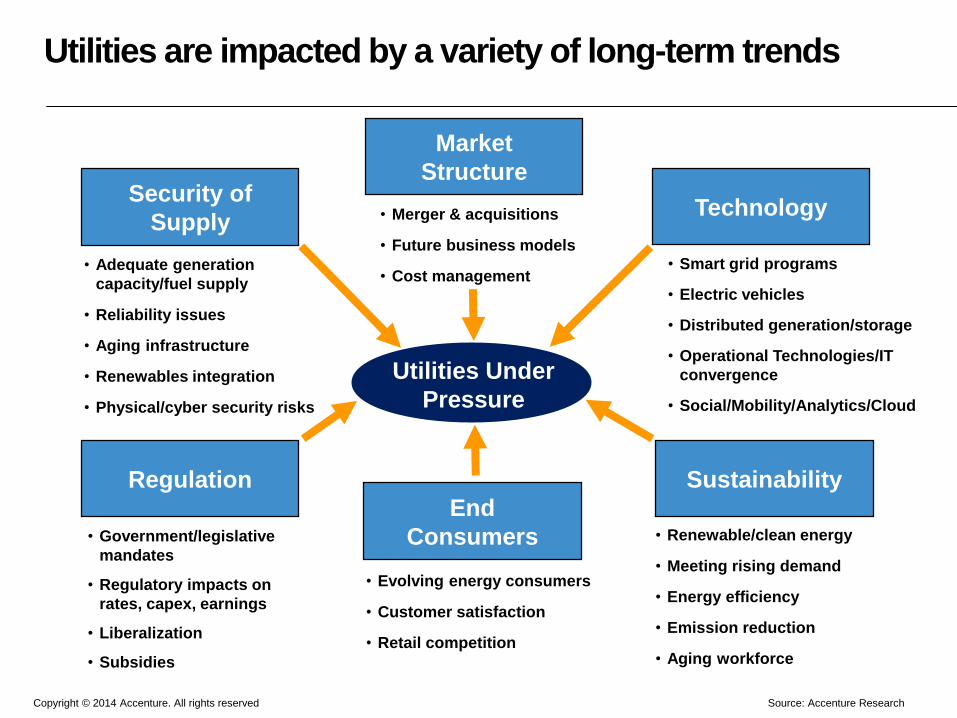
Global Electricity Outlook 2012- 2040
• The IEA estimates that installed capacity worldwide rises by 80%,
from 5,952 GW in 2013 to just above 10,700 GW in 2040
• Cumulative capacity additions total 7 200 GW over 2014-2040, of
which 34% is needed to replace retired plants
• The need to replace existing capacity is particularly large in the
European Union, as close to 60% of it is retired by 2040. The
comparable need is lowest in China, at 16%
• By 2040 the share of fossil fuels in electricity generation declines
from its peak in 2013, pulled down by falling shares of coal and oil. Gas
and nuclear see their share in the power mix increase.
• Renewables-based electricity generation, including hydropower,
nearly triples over 2013-2040, increasing more than coal and gas
combined, becoming the largest source of electricity.
Other
Renewables
5%Hydro
16%
Nuclear 11%
Coal/Gas/
Oil
68%
Other
Renewables
17%
Hydro 16%
Nuclear
12%
Coal/Gas/Oil
55%
Source: © IEA/OECD World Energy Outlook 2014; Accenture Research
Electricity Generation by Source 2012 – 2040 (TWh)*
*based on IEA’s New Policies Scenario
2012 2040
3,201
6,158
1,895
4,370
9,560
858
1,248
937
1,051
3,188
3,881
3,818
4,721
948
1,868
1,590
2,915
869
0
4,000
8,000
12,000
16,000
20,000
24,000
28,000
32,000
36,000
India
4.4%
China
2.8%
Russia
1.3%
Japan 0.4%
Europe
0.7%
USA
0.8%
2040
34,887
+78%
Other
LatAm
2.5%
Africa 4.0%
Middle East 2.7%
2012
19,562
620753
Electricity Demand by Region 2012 – 2040 (TWh)*
2012-2040
CAGR
(2.1% world)

Copyright © 2014 Accenture. All rights reserved
Table of Contents
About Accenture Research
Global Trends Summary
North America
EALA
APAC
Conclusion
7

Copyright © 2014 Accenture. All rights reserved
North America Utilities Trends Framework
8
External drivers Utilities market trends/phenomena Utilities impact
Economic impact
- Slow recovery
- Aging workforce
Regulatory uncertainty
- Environmental
mandates
- Rate case outcomes
- National energy policies
- Subsidies/tax credits
Shale gas revolution
New technology
- Falling cost of DG
- Energy efficiency
- Electric vehicles
- Energy storage
- Microgrids/Nanogrids
New entrants
Changing customer
preferences
Stagnating power
demand
Increase in energy
efficiency
Shift in power
generation from
coal to gas and
away from nuclear
Increased focus on
reliability, safety
Increasingly
savvy/energy
concious
consumers
Regulatory pressure on
earnings/ROE
Renewables expansion
driven by government
mandates and subsidies
Threats to business model such as distributed
generation, energy storage, microgrids
Margin pressure in
generation, revenue
loss
Threat of obselecence
Non-core asset
sales, M&A,
strategic focus
Cost reduction,
operational
efficiency
Customer
engagement
Focused capex on
T&D, smart meters,
renewables integration
Increased investment in
interstate transmission
Disruptive non-utility
entrants
Merchant generation
divestment, T&D focus
Cost containment,
regulatory support
Utilities needs
Opportunity for new
offerings
Grid modernization
strategies

Copyright © 2014 Accenture. All rights reserved 9
Summary of utility trends by region
EALA APACNA
Security of Supply
Market Structure
Steady T&D Capex
with emphasis on
congestion relief
M&A for utility mid-
caps remains steady
but mixed results
TechnologySmart meter slows but
EVs and storage
increases
RegulationEvolving EPA
standards and state
laws
SustainabilityRenewables grow
due to lowering
costs and subsidies
End ConsumersEnergy efficiency
programs produce
mixed results
Copyright © 2014 Accenture. All rights reserved
North AmericaSecurity of Supply
10Source: SNL Energy/RRA; Accenture Research
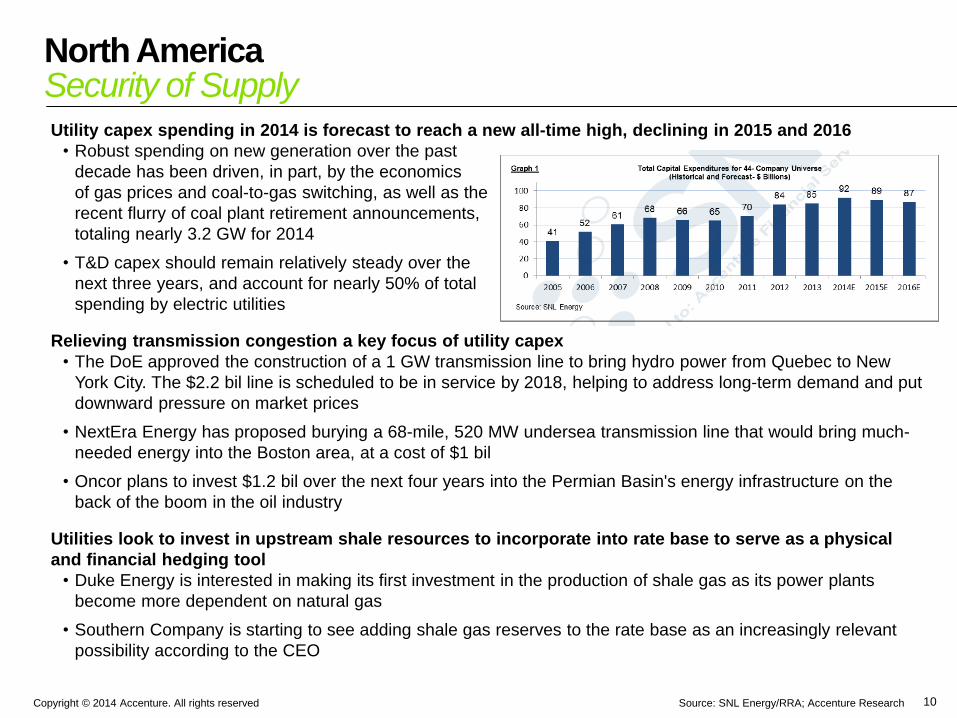
Utility capex spending in 2014 is forecast to reach a new all-time high, declining in 2015 and 2016
• Robust spending on new generation over the past
decade has been driven, in part, by the economics
of gas prices and coal-to-gas switching, as well as the
recent flurry of coal plant retirement announcements,
totaling nearly 3.2 GW for 2014
• T&D capex should remain relatively steady over the
next three years, and account for nearly 50% of total
spending by electric utilities
Relieving transmission congestion a key focus of utility capex
• The DoE approved the construction of a 1 GW transmission line to bring hydro power from Quebec to New
York City. The $2.2 bil line is scheduled to be in service by 2018, helping to address long-term demand and put
downward pressure on market prices
• NextEra Energy has proposed burying a 68-mile, 520 MW undersea transmission line that would bring much-
needed energy into the Boston area, at a cost of $1 bil
• Oncor plans to invest $1.2 bil over the next four years into the Permian Basin's energy infrastructure on the
back of the boom in the oil industry
Utilities look to invest in upstream shale resources to incorporate into rate base to serve as a physical
and financial hedging tool
• Duke Energy is interested in making its first investment in the production of shale gas as its power plants
become more dependent on natural gas
• Southern Company is starting to see adding shale gas reserves to the rate base as an increasingly relevant
possibility according to the CEO
Copyright © 2014 Accenture. All rights reserved Source: Accenture Research
North AmericaMarket Structure
11
Utility M&A activity focuses on midcaps but not all deals have been successful
• NextEra has agreed to acquire Hawaiian Electric Industries, parent company of the Hawaiian Electric utilities,
in a transaction valued at about $4.3 bil with the assumption of $1.7 bil debt from HEI, which is also spinning
off its banking subsidiary, American Savings Bank
• CenterPoint Energy, NextEra, Hunt Consolidated and Berkshire Hathaway Inc. are among ten companies
exploring bids for Texas utility Oncor. Oncor, which did not file for bankruptcy, was initially valued between
$15-16 bil, but could approach $20 bil in a bidding war
• Macquarie Group has backed out of the proposed purchase of Cleco’s electric utility when co-investors
reportedly hesitated over the utility’s high share price, low growth prospects and expected low returns
• The Philadelphia City Council rejected UIL Holding’s proposed acquisition of Philadelphia Gas Works
• PSEG has been looking for M&A partners and had been linked to merger talks with Pepco, which it lost to
Exelon, and PPL, which fell through. Analysts say that if PSEG can’t find a merger, it could unload its 13.5
GW merchant business to reduce exposure similar to what PPL and Riverstone did to form Talen Energy
Unregulated acquisition deals aim to boost market share
• NRG Energy acquired VC-funded Pure Energies Group, a 150-employee online solar customer acquisition
platform, as part of an effort to grow NRG’s residential solar business to gain share from SolarCity and Vivint
• Constellation doubles size by buying retailer Integrys, nearly doubling Constellation's customer count, which
now serves 2.5 million power and natural gas customers across the US
• Comverge and Constellation have reached an agreement to combine their demand response businesses,
targeting commercial and industrial customers
• NiSource intends to split itself into two distinct businesses - regulated utilities, and a pure-play gas pipeline,
midstream and storage firm called Columbia Pipeline Partners LP. The gas assets will go into a master limited
partnership that will use a favorable tax status to boost investment in shale gas

Copyright © 2014 Accenture. All rights reserved Source: Edison Foundation; Accenture Research
North AmericaTechnology
12
Smart meter installations continue but at a slower pace
• As of July 2014, over 50 mil smart meters have been deployed in the
U.S., covering over 43% of homes, up from 46 mil a year ago
Energy storage activity takes center stage
• SoCal Edison signed contracts for 250 MW of energy storage,
despite only being required to seek at least 50 MW of storage per
CPUC mandates. The CPUC has recognized that the cost of storage
may be too high in the early years of the mandate and have given
utilities an escape hatch in case the systems were too expensive
• Oncor is proposing a $5.2 bil, 3-5 GW energy storage plan to better integrate wind and solar power into the
state's electric grid, stating it would be the most cost-effective way to solve issues renewable integration of
renewable power, estimated at an installed cost of $350/kWh
Electric vehicles get a boost from utilities
• Georgia leads the nation in electric vehicle adoption and Georgia Power will invest $12 mil to accelerate the
momentum by adding EV charging infrastructure through 2016 via cash incentives and 50 new public
charging locations
• California utilities have been under a rule prohibiting them from owning EV charging stations since 2011.
SDG&E and SCE have recently proposed investing $500 mil in infrastructure and PG&E is waiting to hear
decision and may act as well. SDG&E filed that they would contract with third parties to build, install, operate
and maintain EV charging facilities (5,500 stations) under a service level agreement
• Pepco will utilize car charging stations in a demand response pilot to assess an EV station's ability to support
consumer engagement, demand response, time-of-use rates and embedded revenue-grade metering
• PSNM is converting its vehicle fleet to electric hybrids, nearly 450 cars, pickups and trucks to plug-in hybrid
electric vehicles

Copyright © 2014 Accenture. All rights reserved Source: SNL Energy; Accenture Research
North AmericaRegulation
13
EPA proposes new standards while legal challenges make their way through the courts
• The EPA proposed new smog and ozone standards, designed to lower the current threshold for ozone
pollution from 75 parts per billion to a range of 65 to 70 parts per billion and will take comments on a
standard as low as 60 parts per billion
• Appeals court cleared the way for the start of the EPA's Cross-State Air Pollution Rule (CSAPR), reversing a
decision by the D.C. Circuit in 2011
• The U.S. Supreme Court will review the first-ever national environmental standards requiring power plants to
reduce emissions of mercury and other toxic air pollutants, saying it would decide whether the government
should have considered how much the rules would cost utilities.
California enacts new laws to protect environment and advance clean transportation
• California Governor signed 11 bills into law that will further California’s effort to cut greenhouse gas
emissions and boost the state’s leadership in the U.S. fight against climate change
• Brown announced a new goal of getting 1.5 million zero-emission cars on California’s roads in the next ten
years and increase permits for clean-air vehicles’ use of car-pool lanes by 15,000, create rebates for low-
income residents’ purchase of lower emissions cars, require streamlined permitting by local jurisdictions for
residential solar, and require a state standard to control methane and other pollutants
• In Illinois, the Citizens Utility Board and the Environmental Defense Fund have filed an Open Data Access
Framework with the ICC to ensure that customers can easily move data to third parties. They want Illinois
utilities ComEd and Ameren to incorporate data sharing into their smart grid deployment plans when they go
through their annual review in April 2015
• The City of Minneapolis has signed tentative agreements with Xcel Energy and CenterPoint Energy ending a
prolonged battle over municipalization. The pact extends the utilities' franchise agreements while setting up a
board to consider expanding clean energy programs

Copyright © 2014 Accenture. All rights reserved Source: EIA; Accenture Research
North AmericaSustainability
14
Renewables share of total supply continues to grow…
• Power produced from wind, solar, hydro and other renewables
will jump 6.3% in 2015, according to the EIA, with wind and solar
producing 5.2% of power in the lower 48 in 2015 vs. 4.9% in 2014
• The Dept. of Energy puts wind’s share for the U.S. in 2020 at 10%,
up from 2013’s 4.5% and projects 20% of power to come from wind
in 2030 and 1/3rd by midcentury
…boosted by cost competitiveness and continued subsidies
• According to the Lawrence Berkeley National Laboratory, the price of electricity sold to utilities from large-
scale solar power projects has fallen by more than 70% since 2008, to $50 per MWh. And the average
installed price of those projects dropped by more than 33% since the 2007-2009 period.
• The cost of electricity from wind and solar resources in some markets now beats coal and natural gas and
the trend is accelerating, especially in the Midwest and Southwest. Investment banking firm Lazard’s most
recent levelized cost of energy analysis shows utility-scale solar energy is as low as $0.056/kWh with
subsidies and about $0.072/kWh unsubsidized, wind is as low as $0.014/kWh with subsidies and
$0.037/kWh without, while natural gas is $0.061/kWh, and coal is $0.06/kWh
• Deutsche Bank finds the price of solar power will be at or below average power prices in most states by
2016, though the numbers change based on what happens to the solar production tax credit. If the credit is
maintained at 30%, solar with reach grid parity in 47 states; should the credit be dropped to 10%, grid parity
can still be achieved in 36 states. Solar power is already as cheap or cheaper than conventional supplies in
10 states, and those states are set to experience a boom in solar generation
• Congress passed a one-year extension of wide-ranging package of tax credits, including the wind industry's
vital $0.023/kWh production tax credit. The extensions are retroactive to the beginning of 2014 and allow
wind projects that break ground by Dec 31 to qualify for the tax break

Copyright © 2014 Accenture. All rights reserved Source: Utility Dive; Accenture Research
North AmericaEnd Consumers
15
Energy efficiency programs face mixed results
• Ohio regulators approved FirstEnergy's proposal to end most of its efficiency programs, which include rebates
and discounts on efficient appliances and lighting, after state lawmakers passed a law freezing the state's
renewable energy standards
• Florida regulators have slashed the energy efficiency targets of the state's largest IOUs, as well as allowing a
solar rebate program to expire at the end of 2015
• Michigan's energy efficiency measures exceeded their targets and returned almost $4 in savings for every
dollar spent, according to a new report from the state's energy regulators
• California utility regulators authorized utilities and other retail energy service providers to spend $938 mil on
energy efficiency programs in 2015 while they continue to wrestle with fundamental program changes
• Some 30% of utility customers would reportedly choose another electricity provider and 64% of those customers
would choose an alternative provider like Google, Comcast, or SolarCity, according to a survey from the Shelton
Group. Dissatisfaction with utilities among those surveyed rose from 43% in Jan 2013 to 55% in Aug 2014
• ComEd is signing up customers for a new Peak Time Savings plan that will award bill credits for voluntary power
reductions with consumers earning a $1/kWh credit for cutting usage during peak demand times
• Avista Utilities has created a rebate program for residential customers that have bought a new smart thermostat
as part of a drive to improve energy efficiency, offering customers a $50 rebate for self-installed thermostats and
$100 back for contractor-fitted devices
• Opower survey showed that even without extra economic incentive, many people will turn down the thermostat
when asked, as people want to conserve when utilities reach out to them
• ComEd announced that it will refund customers $46.2 mil or $8 per residential customer as part of a settlement
following the illegal levying of a surcharge to fund a smart meter pilot

Copyright © 2014 Accenture. All rights reserved
Table of Contents
About Accenture Research
Global Trends Summary
North America
EALA
APAC
Conclusion
16

Copyright © 2014 Accenture. All rights reserved
EALA Utilities Trends Framework
17
External drivers Utilities market trends/phenomena Utilities impact
EU/national regulation
- Climate change
- Supply security
- Affordability and
competition
Eurozone crisis
- Pressure on national
budgets
- Pressure on private
household budgets
Regulatory uncertainty
New technology
- Decreasing cost of
small-scale generation
and energy efficiency
- New mobile solutions
Changing customer
preferences
- Pressure on
household budget
- Higher awareness
Stagnating power
demand driven by
stagnating economic
growth and energy
efficiency
Renewables
expansion driven by
government support
programs and grid
priorisation
Overcapacity in
conventional generation
Depressed wholesale
power prices
Increasingly transparent and competitive retail
competition; emerging non-utility competitors
Margin pressure in
conventional
generation
Customer churn
Non-core asset
sales, M&A
Cost reduction,
oper. Efficiency,
Technology
Customer
engagement
Grid investment
requirements:
T&D, smart meters,
renewables integration
Insufficient T&D
grid capacity
Energy efficiency driven
by government support
programs and rising
energy bills
“Rechanneled“ energy
customer budget
New products &
services
Utilities needs

Copyright © 2014 Accenture. All rights reserved 18
Summary of utility trends by region
EALA APACNA
Security of Supply
Market Structure
T&D Capex spending
With emphasis on
Utility congestion relief
Massive T&D spend
To meet utilities
growth in E & LA
M&A for utility mid-
caps remains steady
but mixed results
Increased
competition from 3rd
party utility services
TechnologySmart meter slows but
EVs and storage
increases
Renewable
technologies and
demand response
RegulationEvolving EPA
standards and state
laws
Reduction in
renewable subsidies to
take decades
SustainabilityRenewables grow
due to lowering
costs and subsidies
Wind and solar
investments soar due
to costs and regulation
End ConsumersEnergy efficiency
programs produce
mixed results
Electricity demand is
slowing (vs GDP)

Copyright © 2014 Accenture. All rights reserved
EALASecurity of Supply
19
Optimistic outlook for the gas supply from Russia
despite challenges
• The European Union expects stable gas supplies this
winter under a deal by Russia and Ukraine, despite the
currently frozen shipments
• Russia to abandon South Stream due to missing
support from the EU – CEE nations shocked
• Gazprom revenues hit by the US shale gas exports
• IEA: Europe gas demand to stay weak until mid-2030,
driven by a weaker economy, a push towards
renewable energies and low coal prices
Future thermal generation capacity expected to
practically support renewables growth only
• Less than 1/3 of the retiring coal power plants in
Europe expected to be replaced by 2035
• Of the coal-fired replacements, 20% already under
construction, 20% will be CHP and 20% CCS based
• Majority of additions linked to efficient CCGT for
baseload flexibility during renewables growth
T&D investment focus in EALA varies by region
• Massive investment in T&D in Europe especially to
meet renewables growth and upgrading for the grid for
smart technology
• Grid upgrade focus in LatAm and Africa to meet
growing electricity demand* IEA “New Policies” Scenario
Source: IEA World Energy Investment Outlook Nov 2014, Press
Average retirements and capacity additions of thermal
plants in the EU
Investment in EU T&D infrastructure 2014-2035 (bn USD)*
1%
5%
0%57%
21% 3%
0%
55%
49%21%
11%
Europe
LatAm
Africa
43520%
2%
7%
42126%
7463%
5%13%
Distribution - Renewables
Distribution - RefurbishmentTransmission - Refurbishment
Distribution - New Demand
Transmission-Renewables
Transmission - New demand

Copyright © 2014 Accenture. All rights reserved
EALAMarket Structure
20Source: IEA World Energy Investment Outlook, Nov 2014,
E.ON, Press
Gap between the EU wholesale prices & cost recovery
E.ON business split-off planned in 2016E.ON to spin off its baseload & trading business
• The “NewCo“ will consolidate the Conventional and
Hydro Power generation, as well as the Upstream and
Trading business in 2016
• Despite the “Bad Bank” comparisons, several analysts
praise the move as the new listed company combines
segments for investors with risk appetite
• Yet no other major utility in Europe is expected to follow
a similar strategy despite insufficient cost recovery in
traditional generation in the future
Emerging new competition for Utilities in Europe
• According to the new Accenture Digitally Enabled Grid
survey update, a significant majority of European utilities
executives expect continued competition from new
entrants
• Especially intense competition expected globally in
data-related services (92%)
beyond-the-meter solutions such as energy
efficiency and demand response (90 %)
distributed generation (87%)
plug-in electric vehicles (PEVs) and associated
charging infrastructure (81%)
• IEA: >50% of the non-hydro renewables capacity owned
already today by less traditional investors (of which 2/3
households / communities / autoproducers)

Copyright © 2014 Accenture. All rights reserved
EALATechnology
21
Demand response capacity by region
Long-term market competitiveness of renewables
• IEA expects the total power generation costs for non-hydro
renewables in Europe to reach the level of thermal
generation by 2040 as for the impact of missing emissions-
and decreased investment costs
• Hydro and nuclear expected to remain the most cost-
efficient forms of power generation, even when considering
the decommissioning investment
• Technological future learning rates:
Solar PV: 18%
Marine: 14%
Solar CSP: 10%
Offshore wind: 9%
Onshore wind / Geothermal / Biomass: 5%
Hydro: 1%
Demand response to emerge as a major parallel market in
Europe
• Close to 50GW of currently practically non-existing
aggregated reduced consumption capacity expected to
emerge in Europe in the next decade
• “Demand aggregators” expected to enter the wholesale and
ancillary markets, similar to traditional generation capacity
providers today
• Demand response “negawatt” capacity expected to
increase alongside with the smart meter rollouts
Total cost in 2020
Source: IEA World Energy Outlook Nov 2014, IEA World Energy
Investment Outlook Nov 2014, Navigant Research
(Demand Response 2014)
Total power generation costs in Europe by
technology in 2040 vs 2020 (USD/MWh) *

Copyright © 2014 Accenture. All rights reserved
EALARegulation
22
Global renewables subsidies by region*
Country Major regulatory measures / interventions in the EU
UK Ofgem to punish Big6 if they fail to hit Govt targets for home insulation and over advice on comparing tariffs
UK Ofgem investigates British Gas, E.ON and Npower performance over their roll-out of B2B smart meters
Sweden Tougher taxes spell the end for older Swedish E.ON nuclear fleet
Germany Grid fees expected to grow double digit while the renewables levy to remain stable
Spain Spanish regulator CNMC says concerned with Endesa 's assets sale
Spain Spain's 2013 power deficit debt to be issued without state backing despite utility demands
Spain Spanish market, competition regulator to investigate electricity prices
The full phase-out of existing subsidized renewables
capacity expected to take decades
• The EU is currently the leading region worldwide for
renewables subsidies with 57% of the total costs
• Even though the new subsidized capacity is decreasing
rapidly already today, the total costs are expected
continue to grow until reaching a plateau by 2020 and
to fall to about half by 2040
BRA/TUR/MEX improve regulatory conditions
• Mexico's electricity sector opens to private businesses
following the energy reform approval
• Regulator in Turkey announces Renewable Energy
Resources Support Mechanism "YEKDEM"
• Brazil regulator allows attractive prices designated for
thermal power generators in September
* IEA “New Policies” Scenario
Source: IEA World Energy Outlook Nov 2014; press

Copyright © 2014 Accenture. All rights reserved
EALASustainability
23
Wind and solar to dominate new capacity investment
• Despite the drop in subsidies since the peak in 2011, wind
and solar PV are expected to dominate investment in the
new generation capacity in Europe, almost doubling their
overall share 2012-2035
New non-binding renewables and EE targets
• EU leaders have agreed on the targets by 2030 to include
40% carbon cut, 27% renewables, 27% energy efficiency
• While the CO2 cut target is binding; renewable target is
only binding in aggregate rather than for each member
state; whereas the efficiency target is non-binding
Dysfunctional carbon trading continues to struggle
• A massive surplus of over 2bn tn of allowances continue to
keep the carbon prices down
• Germany's new, lower targets for CO2 emissions will
further curb demand for carbon permits
• The proposal to create a stability reserve system, where
the EU Commission could buy or sell up to 100m tones of
allowances looks wholly inadequate to tighten the market.
• Further measures desperately needed – however securing
approval of Poland and other peripheral countries seems
challenging given current high unemployment and weak
Carbon price (EUR/tn), Oct 2014 estimate
EU forecasted power plant investment until 2035*
* IEA “New Policies” Scenario
Source: IEA World Energy Investment Outlook, Nov 2014; Deutsche
Bank “2030 target mix positive for utilities” (Oct 2014), and
“CEZ - Weakening pricing & outperformance” (Oct 2014)

Copyright © 2014 Accenture. All rights reserved
EALAEnd Consumers
24
*Accenture study “Digitally Enabled Grid 2014”, Dec 2014 ; ** The phenomenon known as the utilities ‘death spiral’, in which consumers migrate off the grid or use it only as backup,
is unlikely and uneconomic for a large number of consumers due to natural limitations on viability and cost constraints.
Source: HSBC; ACN “Digitally Enabled Grid 2014” Dec 2014
Stagnant electricity demand growth
• Electricity / heat demand in Europe remained
comparatively dampened during the unusually mild
autumn
• IEA: Very slow growth of 0,7% in Europe expected by
2040, vs 2.5% in LatAm and 4% in Africa
• In the “worst case scenario” as depicted in the DEG2
study*, the prolonged subsidies promote surging energy
prices, leading eventually to higher household needs for
energy efficiency and reduced consumption
Death spiral posing potentially a lower risk than
expected
• Although 58 % of European utilities executives believe
the ‘death spiral’** will materialize, only 13 % consider it
to be a significant risk
• In Europe, by 2035, an average of 11 % of consumers
are expected to become energy self-sufficient and either
migrate off the grid or use it only as back up. (nearly 7
percent by 2030, and just over 2 percent by 2025)
• Potential driver: insufficient rooftop space for solar
installations – typically comprising only a part of certain
types of household buildings
Anticipated average % of customers becoming
self-sufficient and either migrate off the grid or
use the grid only as a backup resource
Disconnect widens between GDP and
energy demand in Europe
12
7
21
203020252020 2035

Copyright © 2014 Accenture. All rights reserved
Table of Contents
About Accenture Research
Global Trends Summary
North America
EALA
APAC
Conclusion
25

Copyright © 2014 Accenture. All rights reserved 27
Summary of utility trends by region
EALA APACNA
Security of Supply
Market Structure
T&D Capex spending
With emphasis on
Utility congestion relief
Massive T&D spend
To meet utilities
growth in E & LA
China making
greater investment
in generation, T&D
M&A for utility mid-
caps remains steady
but mixed results
Increased
competition from 3rd
party utility services
State owned utilities
change and expand
TechnologySmart meter slows but
EVs and storage
increases
Renewable
technologies and
demand response
Renewable
technology
advancements
RegulationEvolving EPA
standards and state
laws
Reduction in
renewable subsidies to
take decades
Chinese energy
portfolio and better
emissions
SustainabilityRenewables grow
due to lowering
costs and subsidies
Wind and solar
investments soar due
to costs and regulation
Japan and China
continue to lead
investments
End ConsumersEnergy efficiency
programs produce
mixed results
Electricity demand is
slowing (vs GDP)
Electricity costs to
skyrocket through
2014 in China and
Japan
Copyright © 2014 Accenture. All rights reserved
APACSecurity of Supply
28
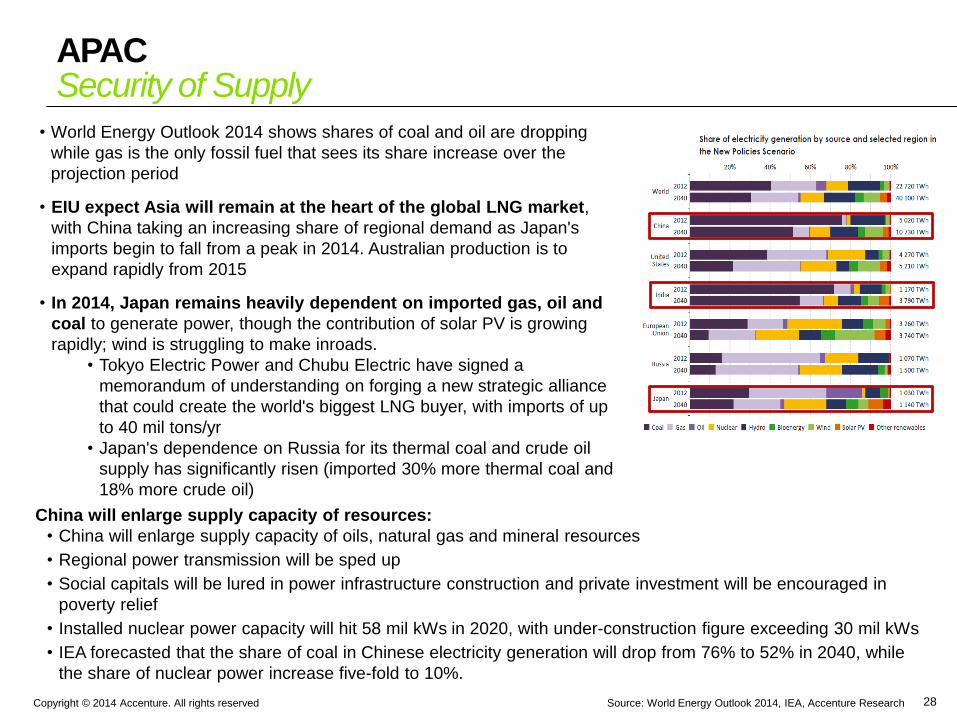
• World Energy Outlook 2014 shows shares of coal and oil are dropping
while gas is the only fossil fuel that sees its share increase over the
projection period
• EIU expect Asia will remain at the heart of the global LNG market,
with China taking an increasing share of regional demand as Japan's
imports begin to fall from a peak in 2014. Australian production is to
expand rapidly from 2015
• In 2014, Japan remains heavily dependent on imported gas, oil and
coal to generate power, though the contribution of solar PV is growing
rapidly; wind is struggling to make inroads.
• Tokyo Electric Power and Chubu Electric have signed a
memorandum of understanding on forging a new strategic alliance
that could create the world's biggest LNG buyer, with imports of up
to 40 mil tons/yr
• Japan's dependence on Russia for its thermal coal and crude oil
supply has significantly risen (imported 30% more thermal coal and
18% more crude oil)
China will enlarge supply capacity of resources:
• China will enlarge supply capacity of oils, natural gas and mineral resources
• Regional power transmission will be sped up
• Social capitals will be lured in power infrastructure construction and private investment will be encouraged in
poverty relief
• Installed nuclear power capacity will hit 58 mil kWs in 2020, with under-construction figure exceeding 30 mil kWs
• IEA forecasted that the share of coal in Chinese electricity generation will drop from 76% to 52% in 2040, while
the share of nuclear power increase five-fold to 10%.
Source: World Energy Outlook 2014, IEA, Accenture Research

Copyright © 2014 Accenture. All rights reserved Source: Accenture Research
APACMarket Structure
29
• Japan released a revised law to liberalize the retail sale of power to households in 2016. Consumers
will be able to choose which power suppliers to buy from, and the government hopes the influx of new
entrants to the liberalized market will pave the way for discount rates and new services.
• China State Grid would become the first utility to build a major regional electricity grid portfolio in
Europe. SGCC with its deep pockets and reputation for hands-off management, has had an easier ride,
buying minority stakes in Portuguese and Italian grid operators and pursuing designs on Greece and Spain,
too. If all goes to plan, it would become the first utility to build a major regional electricity grid portfolio.
• According to IBIS report, industry revenue of Australia’s electricity is forecast to fall by 30.4% to $10.3
billion in the current year, following the repeal of the carbon tax in early 2014-15.
• Australian Competition and Consumer Commission chairman Rod Sims has urged the Queensland
government to split its electricity generators into three companies to boost competition.
• Snowy Hydro sizes up big three retailers:
• NZ-listed Infratil has announced it has agreed to sell its Australian businesses Lumo Energy and Direct
Connect Australia to Snowy Hydro Limited for A$605 million.
• AGL Energy, Origin Energy and EnergyAustralia face a fresh competitive threat in their key electricity
retail markets after Snowy Hydro declared its intention to use newly acquired Lumo Energy to beef up
its position in NSW and as a springboard into new markets.
• The initial public offering of Chinese nuclear plant operator CGN Power (China General Nuclear
Power Group) raises $3.2 billion and will be second-largest IPO in Asia-Pacific for 2014. Its capacity is
expected to grow eightfold by 2030.

Copyright © 2014 Accenture. All rights reserved Source: Accenture Research
APACTechnology
30
• Tokyo-based renewables developer Smart Energy will build the world’s largest floating PV project - a
7.5MW installation - on a reservoir north of the Japanese capital.
• A research from China indicates: Crystalline silicon solar cells play a leading role in the photovoltaic
market. In order to select the key technologies related to silicon solar cells for the next 5-10 years, a Delphi-
AHP (analytic hierarchy process) framework is presented to analyze the potential space for each technology
in the solar cell industrial chain.
• The U.S. Department of Energy's Argonne National Laboratory in Illinois teamed up with the Korea Atomic
Energy Research Institute to develop a prototype sodium-cooled nuclear fast reactor.
• Super-smart grid spies out leaks in Singapore. Singapore’s water grid monitors for leaks every
millisecond. The technology is being installed in cities worldwide to conserve scarce supplies and avert
floods.
• NEC Asia Pacific has collaborated with Singapore's Economic Development Board, with the main objective
of this association is to focus on product research and developing solutions for energy management and
control, smart grid, energy storage and renewable energy integration. It is said to be in accordance with
Singapore's targets to be a global leader in sustainable energy management..
• Western Australia company developed new technology to access lithium as demand for batteries to store
renewable energy grows
• Group of 20 leaders have asked Japan to fast-track the development of clean coal technology that could be
used by developing countries to burn Australian coal more efficiently

Copyright © 2014 Accenture. All rights reserved
Smart Energy floating PV site
31
• Smart Energy (Tokyo-based renewables developer) will build the world’s largest floating PV project:
• A 7.5 MW installation, on a reservoir north of the Japanese capital
• Yingli Green Energy will supply 27,456 solar panels for the project
• Schneider Electric will provide inverters

Copyright © 2014 Accenture. All rights reserved Source: Accenture Research
APACRegulation
32
China released the PRC Energy Development Strategy Action Plan (2014-20):
• Primary energy consumption - By 2020, would be limited to 4.8bn tonnes of standard coal, equal to 3.4% 7-
year CAGR in 2014-20.
• Primary energy mix - By 2020, would have 15% from non-fossil fuel.
• Coal consumption rate cut - New coal-fired power plants would have coal consumption below 300g/kWh.
• More stringent emission standards - The emission of new coal-fired power plants have to be close to those of
gas-fired power plants.
• More centralized coal supply - By 2020, over 95% of PRC coal output would be from 14 large-scale coal mining
bases.
• More diversified NG supply - By 2020, PRC conventional NG reserves would be raised to 5,500bcm, 6.6% 7-
year CAGR.
• Safety being top priority of nuclear power development - Using high global safety standards, construction of
new nuclear power plants will resume in coastal provinces.
Renewable energy trade groups cheered an agreement between the U.S. and China to limit greenhouse gas
emissions:
• Chinese President Xi committed to halting growth of carbon dioxide emissions in his country and increasing
non-fossil fuels to 20% of energy production by 2030.
• President Barack Obama, meanwhile, said the U.S. would reduce its carbon dioxide emissions by at least 26%
below 2005 levels by 2025
Japan’s Gov't eyes system for power firms to tack reactor decommissioning costs to power bills. The
Ministry of Economy, Trade and Industry has started to consider introducing a system in which major power
companies can tack costs of decommissioning their nuclear reactors onto power bills for consumers even after the
full liberalization of electricity retailing fees scheduled for 2018 to 2020.

Copyright © 2014 Accenture. All rights reserved
APACSustainability
33
Japan urged to introduce competition in purchase of
renewable energy
• A member of an advisory panel to the industry ministry
urged the government to introduce market competition in
its feed-in tariff scheme to promote renewable energy by
giving preferential treatment to solar power suppliers
offering the energy at low cost.
• Kyushu Electric Power Co. and four other utilities decided
to stop signing contracts to buy renewable energy from
solar power suppliers in their service regions.
• Tokyo Electrical Construction is building a 10MW solar
project in eastern Japan’s nuclear exclusion zone.
• China’s emission grew from 4.1 Gt in 2012 to 5.4Gt in 2040, when they are almost 70% larger than emissions
from all OECD countries combined.
• Forbes will soon be home to Australia's first solar thermal power plant to be connected to the electricity
grid, and the developers of the renewable energy project hope the milestone sparks interest from potential
investors.
• Smart Energy (Tokyo-based renewables developer) will build the world’s largest floating PV project:
• A 7.5 MW installation, on a reservoir north of the Japanese capital
• Yingli Green Energy will supply 27,456 solar panels for the project
• Schneider Electric will provide inverters
Source: World Energy Outlook 2014, IEA, Accenture Research

Copyright © 2014 Accenture. All rights reserved Source: World Energy Outlook 2014, IEA, Accenture Research
APACEnd Consumers
34
• In 2040, Chinese industrial electricity prices are 75% higher
than those in the United States
• In Japan, power utilities are obliged to purchase
electricity generated from renewable sources at fixed
prices. The costs are passed on to consumers in their
electricity bills, raising concerns that consumers will have to
shoulder more of this burden as the supply of solar power
increases.
• EnergyAustralia and its telemarketing company are
being sued in the Federal Court for signing up
customers and changing their power supply without
their knowledge or consent.
• Electricity customers in south east Queensland will benefit from more choice, greater competition and
stronger consumer protections under landmark legislation designed to put downward pressure on electricity
prices.
• A study found consumers could save up to $475 a year by shopping around.
• The Queensland Competition Authority (QCA) will continue to monitor the market, helping consumers to
better understand and take advantage of the choices on offer, and keeping the government fully informed
about how the market is developing.
• Community-led networks are giving power to the people in Australia. The penetration of rooftop solar in
Australia tells the story of just how keen consumers are to generate their own electricity. But some are going a
step further by managing the flow of their own energy usage through micro-grids and smart grids.

Copyright © 2014 Accenture. All rights reserved
Table of Contents
About Accenture Research
Global Trends Summary
North America
EALA
APAC
Conclusion
35

Copyright © 2014 Accenture. All rights reserved 36
Summary of utility trends by region
EALA APACNA
Security of Supply
Market Structure
Massive T&D spend
To meet utilities
growth in E & LA
China making
greater investment
in generation, T&D
M&A for utility mid-
caps remains steady
but mixed results
Increased
competition from 3rd
party utility services
State owned utilities
change and expand
TechnologySmart meter slows but
EVs and storage
increases
Renewable
technologies and
demand response
Renewable
technology
advancements
RegulationEvolving EPA
standards and state
laws
Reduction in
renewable subsidies to
take decades
Chinese energy
portfolio and better
emissions
SustainabilityRenewables grow
due to lowering
costs and subsidies
Wind and solar
investments soar due
to costs and regulation
Japan and China
continue to lead
investments
End ConsumersEnergy efficiency
programs produce
mixed results
Electricity demand is
slowing (vs GDP)
Electricity costs to
skyrocket through
2014 in China and
Japan
Steady T&D Capex
with emphasis on
congestion relief

Copyright © 2014 Accenture. All rights reserved 37
Recap of trends by region
EALA APAC Capex spending in 2014 is
forecast to reach a new all-time
high, declining in 2015 and 2016
Relieving transmission
congestion a key focus of capex
Utilities look to invest in upstream
shale resources to incorporate into
rate base to serve as a physical and
financial hedging tool
Utility M&A activity focuses on
midcaps but not all deals have
been successful
Energy storage activity takes
center stage while electric vehicles
get a boost from utilities
EPA proposes new standards
while legal challenges make their
way through the courts
Renewables share grows, boosted
by cost competitiveness and
continued subsidies
Energy efficiency programs face
mixed results, with some states
pulling back requirements
NA
Source: Accenture Research
World Energy Outlook 2014 shows
that the shares of coal and oil are
dropping while gas is the only fossil
fuel that sees its share increase
over 2014-2040
China State Grid could become the
first foreign utility to build a major
regional electricity grid portfolio in
Europe
Japan released a revised law to
liberalize the retail sale of power to
households in 2016
China released the PRC Energy
Development Strategy Action Plan
(2014-20), primary energy mix
would have 15% from non-fossil
fuel by 2020
Smart Energy (Tokyo-based
renewables developer) will build the
world’s largest floating PV project
Australians are increasingly taking
steps to manage the flow of their
own energy usage through micro-
grids and smart grids
Optimistic outlook for Russian
gas supply despite recent events
Future EU thermal generation
capacity expected to practically
support renewables growth only
E.ON’s decision to spin off its
baseload & trading business praised
by experts and investors
EU introduces new non-binding
targets for renewables and
energy efficiency; dysfunctional
carbon trading continues to struggle
The full phase-out of existing EU
subsidized renewables capacity
expected to take decades
“Death spiral” expected to pose a
lower risk than anticipated in
Europe, with <15 % of households
expected to go off-grid by 2035
Close to 50GW of “demand
response” capacity expected to
emerge in Europe in the next
decade, from today’s practically
inexistent market

Copyright © 2014 Accenture. All rights reserved
North America Utilities Trends Framework
38
External drivers Utilities market trends/phenomena Utilities impact
Economic impact
- Slow recovery
- Aging workforce
Regulatory uncertainty
- Environmental
mandates
- Rate case outcomes
- National energy policies
- Subsidies/tax credits
Shale gas revolution
New technology
- Falling cost of DG
- Energy efficiency
- Electric vehicles
- Energy storage
- Microgrids/Nanogrids
New entrants
Changing customer
preferences
Stagnating power
demand
Increase in energy
efficiency
Shift in power
generation from
coal to gas and
away from nuclear
Increased focus on
reliability, safety
Increasingly
savvy/energy
concious
consumers
Regulatory pressure on
earnings/ROE
Renewables expansion
driven by government
mandates and subsidies
Threats to business model such as distributed
generation, energy storage, microgrids
Margin pressure in
generation, revenue
loss
Threat of obselecence
Non-core asset
sales, M&A,
strategic focus
Cost reduction,
operational
efficiency
Customer
engagement
Focused capex on
T&D, smart meters,
renewables integration
Increased investment in
interstate transmission
Disruptive non-utility
entrants
Merchant generation
divestment, T&D focus
Cost containment,
regulatory support
Utilities needs
Opportunity for new
offerings
Grid modernization
strategies

Copyright © 2014 Accenture. All rights reserved
Utility innovation through business impacts and change
39
Cost reduction,
operational
efficiency
Customer
engagement
Cost containment,
regulatory support
Utilities need
today...
Grid modernization
strategies
Insights and
analytics
So
luti
on
s
New products and
services
Utilities will innovate...
Smart Homes
Micro-grids
Smart Devices
DER
AMI/Smart Meter
Intelligent S/S
Situational Awareness

Copyright © 2014 Accenture. All rights reserved
Contact Info
Bob Knox
Historian and Grid Analytics Lead
Accenture Smart Grid Solutions
40


![FY16 3rd Quarter Financial Results [IFRS] · FY16 3rd Quarter Financial Results [IFRS] Hitachi High-Technologies Corporation January 27, 2017 ... FY15/Q1 FY15/Q2 FY15/Q3 FY15/Q4 FY16/Q1](https://img.dokumen.tips/doc/110x75/5ec630f9034f80098f725dcb/fy16-3rd-quarter-financial-results-ifrs-fy16-3rd-quarter-financial-results-ifrs.jpg)