Embed Size (px)
Citation preview
Global Technology IPO Review Q1 2013
www.pwc.com
PwC
Source: PwC Research
2
• The global technology IPO market showed little strength in Q1 2013 recording ten IPOs, just two more than Q4 2012 and a 67% decline compared to Q1 2012.
• Total funds raised of US$1.7bn were up 28% compared to Q4 2012, but declined 43% year over year.
• Though Q1 2013 did not deliver the level of activity seen in Q1 2012 when 30 technology companies completed IPOs, six of the ten Q1 technology IPOs were completed in the last two weeks of March signaling improving sentiment.
• In the US, tech IPOs also led all industries in one-day average return topping 25 percent.
• China saw technology IPO activity decline throughout 2012 due to slowing growth and change in posture by the Chinese Security and Regulatory commission relative to new filings. No technology IPOs were recorded for China in Q1 2013.
• In contrast, the US recorded six IPOs, raising US$912mn, 53% of the total amount raised, but a 42% decline in terms of funds raised and 50% decline in number of deals year over year.
• Sharing the top five deals in terms of proceeds (75% of total Q1 proceeds) were the US, with two companies, and one each from Brazil, the UK and Japan.
• The Software subsector had the highest number of IPOs (4), raising US$652mn and representing 38% of the total money raised. IT Consulting & Services recorded one IPO that raised US$426mn (25% of the total).
IPO summary – Q1 2013
Global Tech IPOs remain sluggish
* Note: Issue size greater than US$40mn
PwC
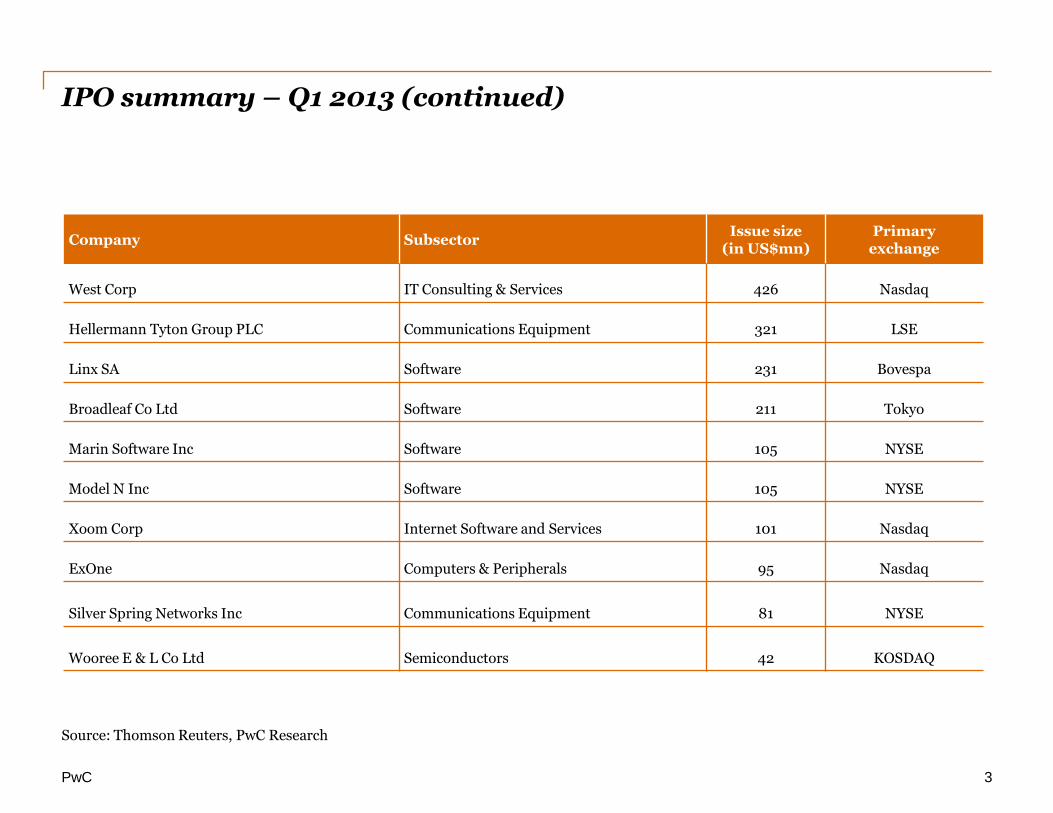
IPO summary – Q1 2013 (continued)
Source: Thomson Reuters, PwC Research
3
Company Subsector Issue size
(in US$mn) Primary
exchange
West Corp IT Consulting & Services 426 Nasdaq
Hellermann Tyton Group PLC Communications Equipment 321 LSE
Linx SA Software 231 Bovespa
Broadleaf Co Ltd Software 211 Tokyo
Marin Software Inc Software 105 NYSE
Model N Inc Software 105 NYSE
Xoom Corp Internet Software and Services 101 Nasdaq
ExOne Computers & Peripherals 95 Nasdaq
Silver Spring Networks Inc Communications Equipment 81 NYSE
Wooree E & L Co Ltd
Semiconductors 42 KOSDAQ
PwC 4
0
10
20
30
40
0
5,000
10,000
15,000
20,000
Q1
201
2 Q
2 2
01
2 Q
3 2
01
2 Q
4 2
01
2 Q
1 2
01
3
No
. o
f IP
Os
In U
S$
mn
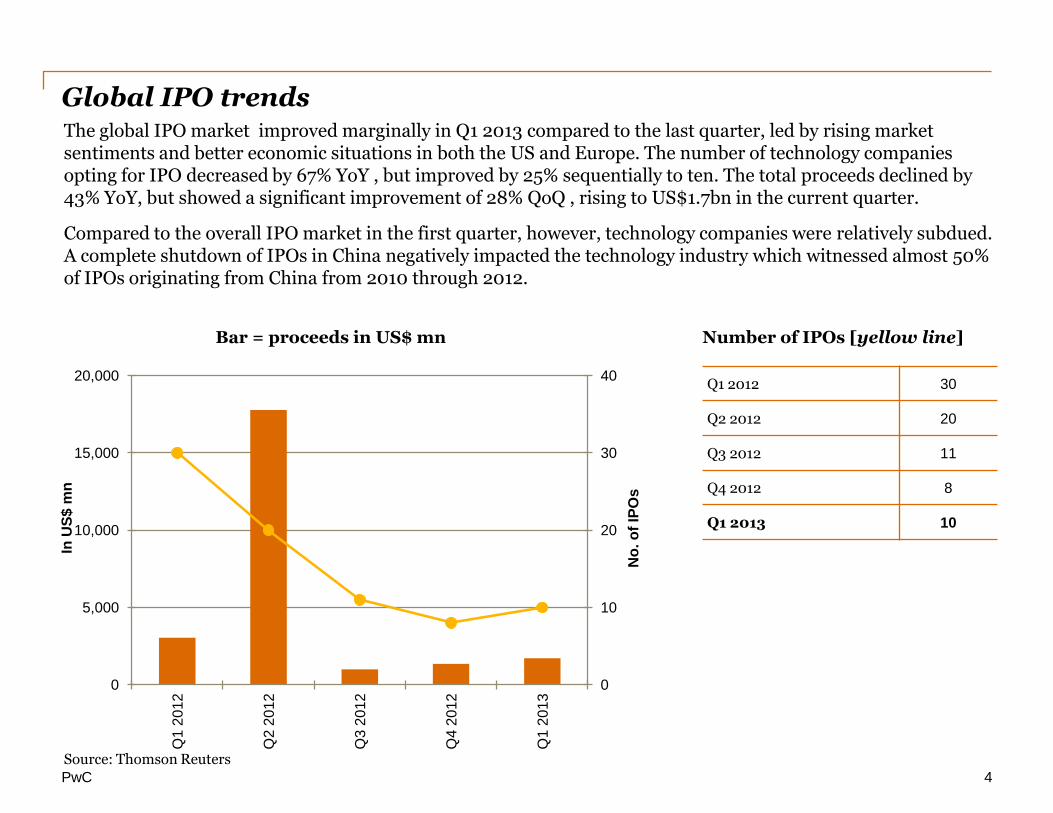
Global IPO trends
Source: Thomson Reuters
Bar = proceeds in US$ mn Number of IPOs [yellow line]
Q1 2012 30
Q2 2012 20
Q3 2012 11
Q4 2012 8
Q1 2013 10
The global IPO market improved marginally in Q1 2013 compared to the last quarter, led by rising market sentiments and better economic situations in both the US and Europe. The number of technology companies opting for IPO decreased by 67% YoY , but improved by 25% sequentially to ten. The total proceeds declined by 43% YoY, but showed a significant improvement of 28% QoQ , rising to US$1.7bn in the current quarter.
Compared to the overall IPO market in the first quarter, however, technology companies were relatively subdued. A complete shutdown of IPOs in China negatively impacted the technology industry which witnessed almost 50% of IPOs originating from China from 2010 through 2012.
PwC 5
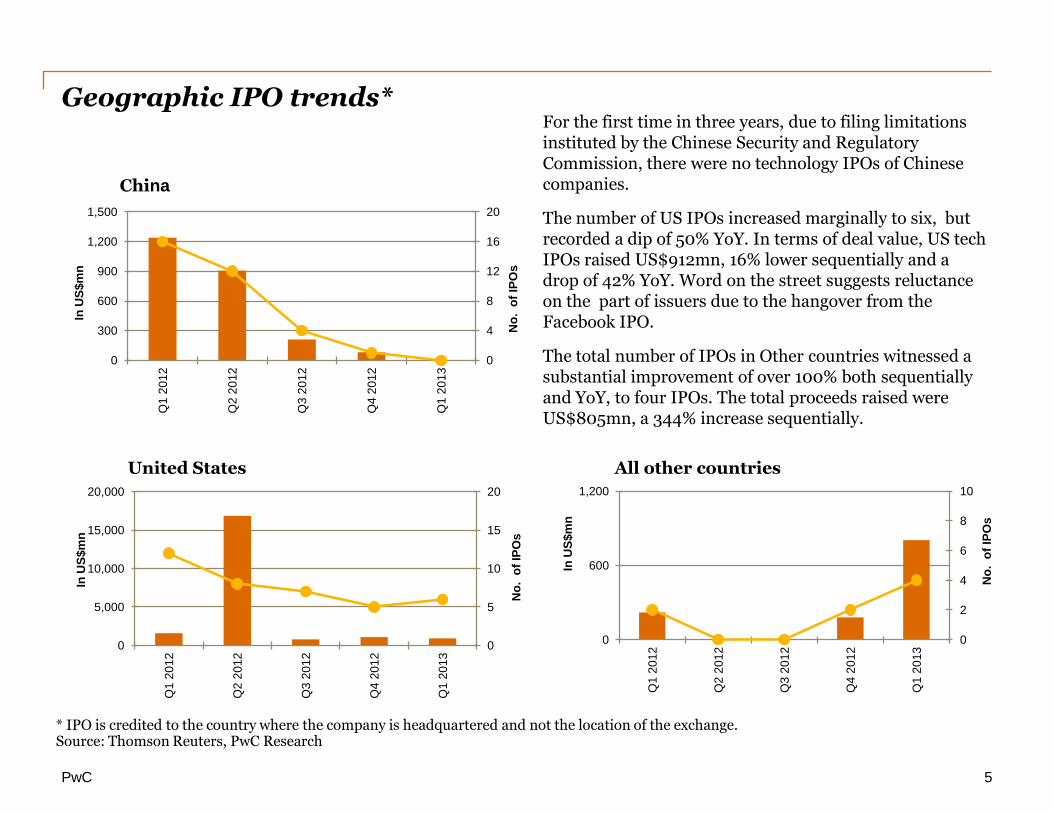
Geographic IPO trends*
0
4
8
12
16
20
0
300
600
900
1,200
1,500
Q1
20
12
Q2
20
12
Q3
20
12
Q4
20
12
Q1
20
13
No
. o
f IP
Os
In U
S$m
n
0
5
10
15
20
0
5,000
10,000
15,000
20,000
Q1
20
12
Q2
20
12
Q3
20
12
Q4
20
12
Q1
20
13
No
. o
f IP
Os
In U
S$m
n
0
2
4
6
8
10
0
600
1,200
Q1
20
12
Q2
20
12
Q3
20
12
Q4
20
12
Q1
20
13
No
. o
f IP
Os
In U
S$m
n
China
United States All other countries
* IPO is credited to the country where the company is headquartered and not the location of the exchange.
For the first time in three years, due to filing limitations instituted by the Chinese Security and Regulatory Commission, there were no technology IPOs of Chinese companies.
The number of US IPOs increased marginally to six, but recorded a dip of 50% YoY. In terms of deal value, US tech IPOs raised US$912mn, 16% lower sequentially and a drop of 42% YoY. Word on the street suggests reluctance on the part of issuers due to the hangover from the Facebook IPO.
The total number of IPOs in Other countries witnessed a substantial improvement of over 100% both sequentially and YoY, to four IPOs. The total proceeds raised were US$805mn, a 344% increase sequentially.
Source: Thomson Reuters, PwC Research
PwC
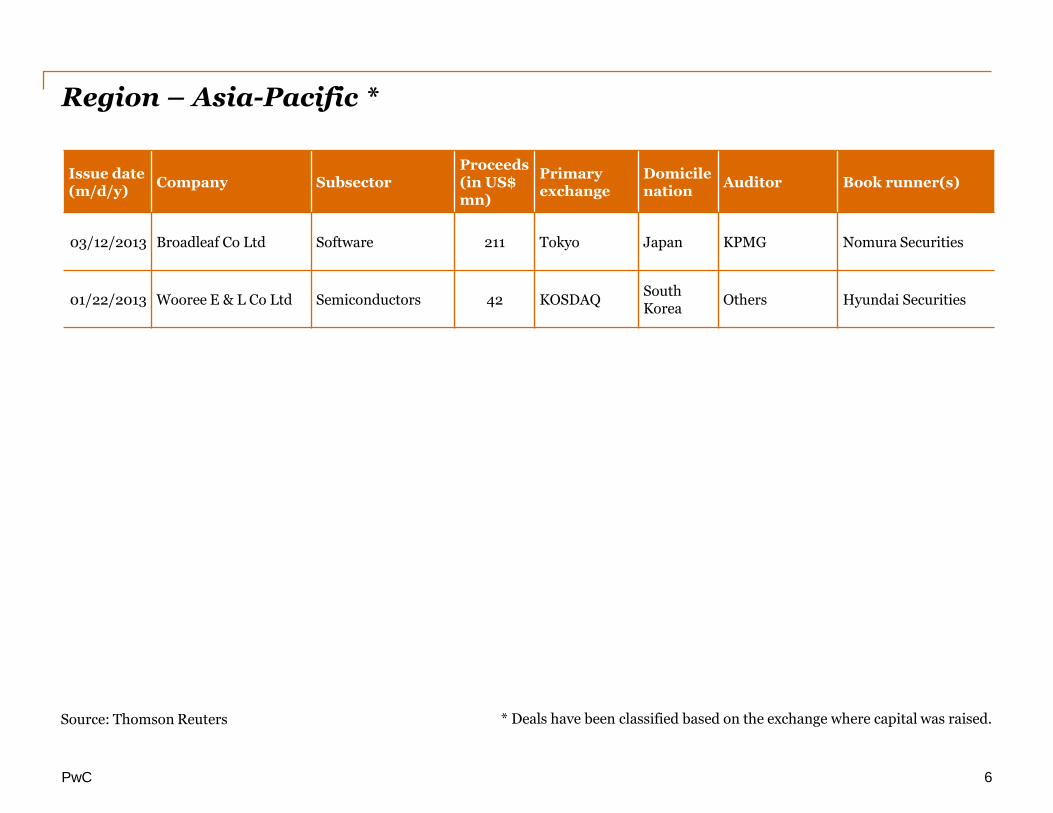
Region – Asia-Pacific *
Source: Thomson Reuters
6
* Deals have been classified based on the exchange where capital was raised.
Issue date (m/d/y)
Company Subsector Proceeds (in US$ mn)
Primary exchange
Domicile nation
Auditor Book runner(s)
03/12/2013 Broadleaf Co Ltd Software 211 Tokyo Japan KPMG Nomura Securities
01/22/2013 Wooree E & L Co Ltd Semiconductors 42 KOSDAQ South Korea
Others Hyundai Securities
PwC
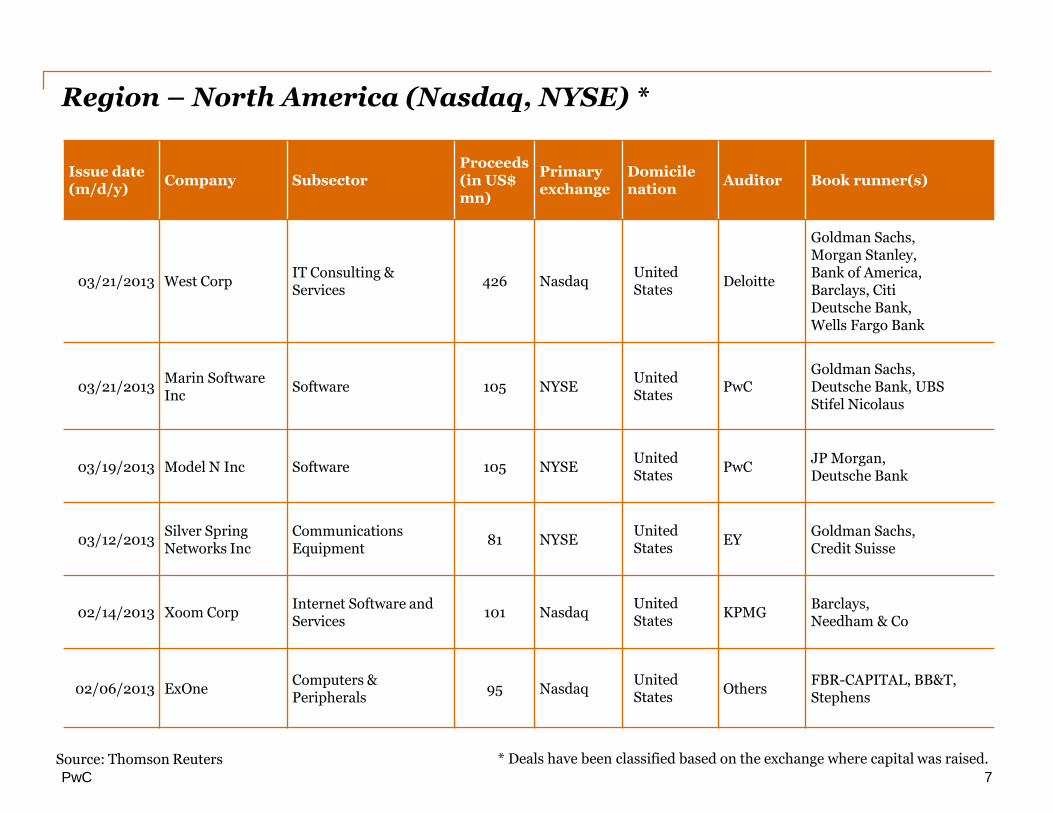
Region – North America (Nasdaq, NYSE) *
Source: Thomson Reuters
7
* Deals have been classified based on the exchange where capital was raised.
Issue date (m/d/y)
Company Subsector Proceeds (in US$ mn)
Primary exchange
Domicile nation
Auditor Book runner(s)
03/21/2013 West Corp IT Consulting & Services
426 Nasdaq United States
Deloitte
Goldman Sachs, Morgan Stanley, Bank of America, Barclays, Citi Deutsche Bank, Wells Fargo Bank
03/21/2013 Marin Software Inc
Software 105 NYSE United States
PwC Goldman Sachs, Deutsche Bank, UBS Stifel Nicolaus
03/19/2013 Model N Inc Software 105 NYSE United States
PwC JP Morgan, Deutsche Bank
03/12/2013 Silver Spring Networks Inc
Communications Equipment
81 NYSE United States
EY Goldman Sachs, Credit Suisse
02/14/2013 Xoom Corp Internet Software and Services
101 Nasdaq United States
KPMG Barclays, Needham & Co
02/06/2013 ExOne Computers & Peripherals
95 Nasdaq United States
Others
FBR-CAPITAL, BB&T, Stephens
PwC
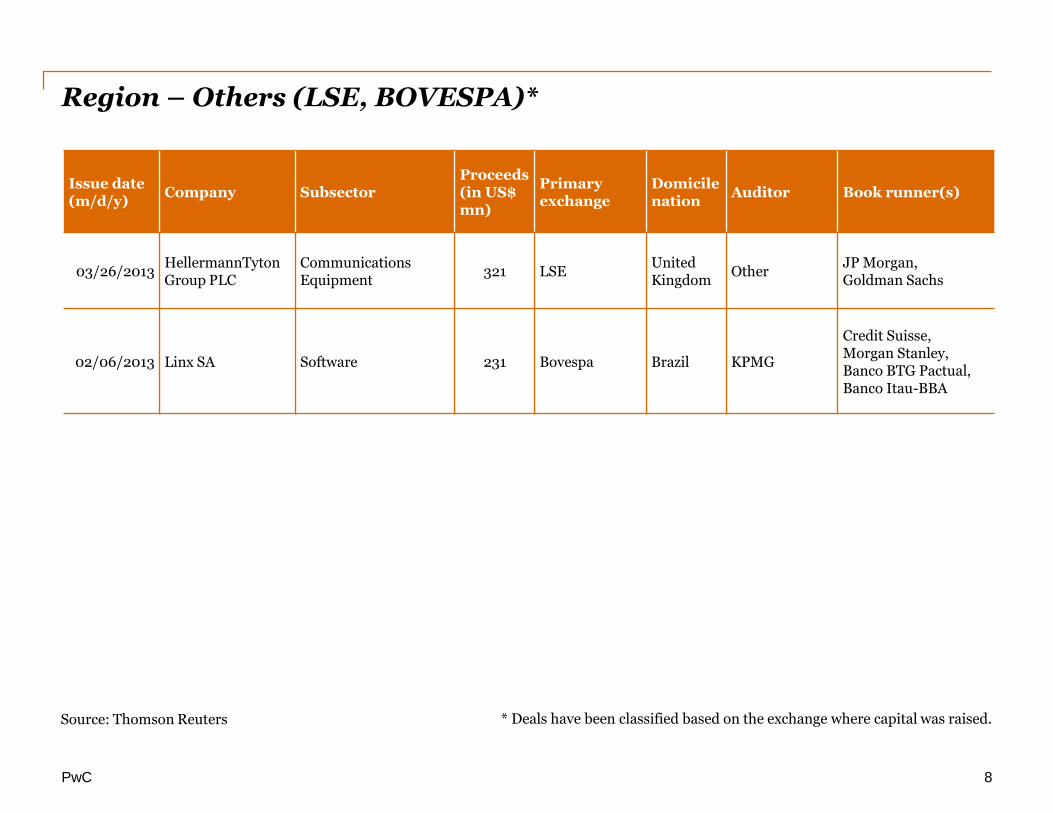
Region – Others (LSE, BOVESPA)*
Source: Thomson Reuters
8
* Deals have been classified based on the exchange where capital was raised.
Issue date (m/d/y)
Company Subsector Proceeds (in US$ mn)
Primary exchange
Domicile nation
Auditor Book runner(s)
03/26/2013 HellermannTyton Group PLC
Communications Equipment
321 LSE United Kingdom
Other JP Morgan, Goldman Sachs
02/06/2013 Linx SA Software 231 Bovespa Brazil KPMG
Credit Suisse, Morgan Stanley, Banco BTG Pactual, Banco Itau-BBA
PwC
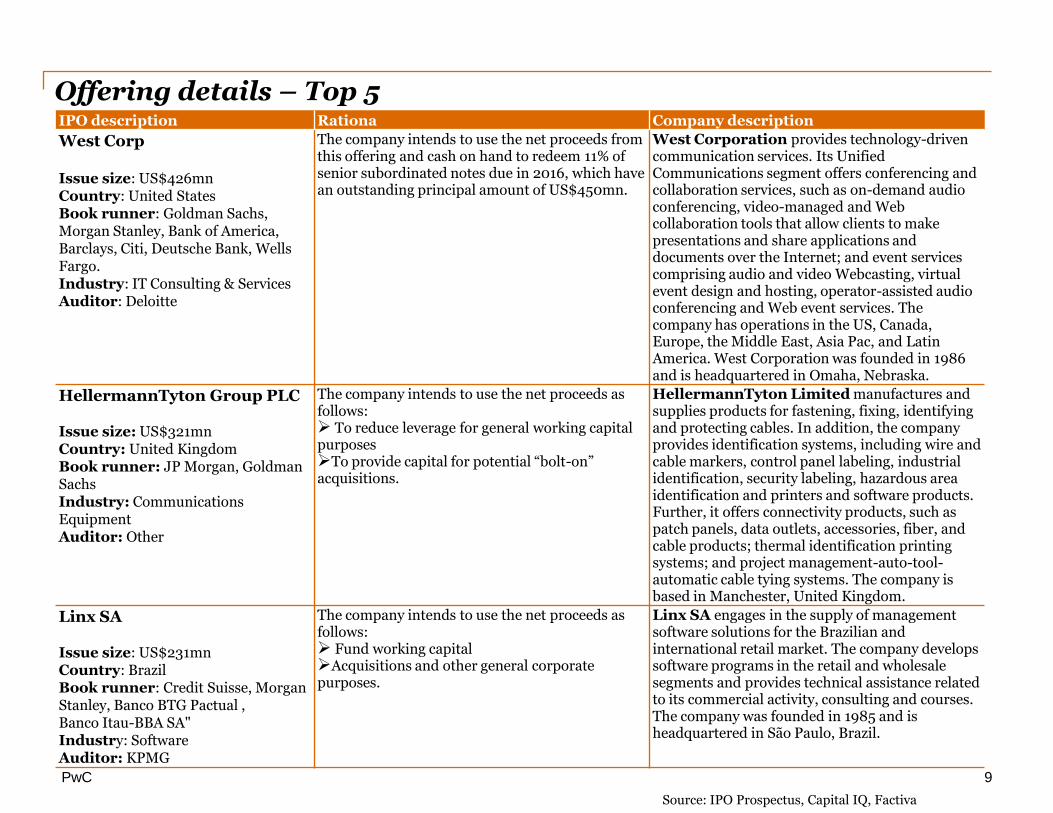
IPO description Rationa Company description
West Corp Issue size: US$426mn Country: United States Book runner: Goldman Sachs, Morgan Stanley, Bank of America, Barclays, Citi, Deutsche Bank, Wells Fargo. Industry: IT Consulting & Services Auditor: Deloitte
The company intends to use the net proceeds from this offering and cash on hand to redeem 11% of senior subordinated notes due in 2016, which have an outstanding principal amount of US$450mn.
West Corporation provides technology-driven communication services. Its Unified Communications segment offers conferencing and collaboration services, such as on-demand audio conferencing, video-managed and Web collaboration tools that allow clients to make presentations and share applications and documents over the Internet; and event services comprising audio and video Webcasting, virtual event design and hosting, operator-assisted audio conferencing and Web event services. The company has operations in the US, Canada, Europe, the Middle East, Asia Pac, and Latin America. West Corporation was founded in 1986 and is headquartered in Omaha, Nebraska.
HellermannTyton Group PLC Issue size: US$321mn Country: United Kingdom Book runner: JP Morgan, Goldman Sachs Industry: Communications Equipment Auditor: Other
The company intends to use the net proceeds as follows: To reduce leverage for general working capital purposes To provide capital for potential “bolt-on” acquisitions.
HellermannTyton Limited manufactures and supplies products for fastening, fixing, identifying and protecting cables. In addition, the company provides identification systems, including wire and cable markers, control panel labeling, industrial identification, security labeling, hazardous area identification and printers and software products. Further, it offers connectivity products, such as patch panels, data outlets, accessories, fiber, and cable products; thermal identification printing systems; and project management-auto-tool-automatic cable tying systems. The company is based in Manchester, United Kingdom.
Linx SA Issue size: US$231mn Country: Brazil Book runner: Credit Suisse, Morgan Stanley, Banco BTG Pactual , Banco Itau-BBA SA" Industry: Software Auditor: KPMG
The company intends to use the net proceeds as follows: Fund working capital Acquisitions and other general corporate purposes.
Linx SA engages in the supply of management software solutions for the Brazilian and international retail market. The company develops software programs in the retail and wholesale segments and provides technical assistance related to its commercial activity, consulting and courses. The company was founded in 1985 and is headquartered in São Paulo, Brazil.
Offering details – Top 5
Source: IPO Prospectus, Capital IQ, Factiva
9
PwC
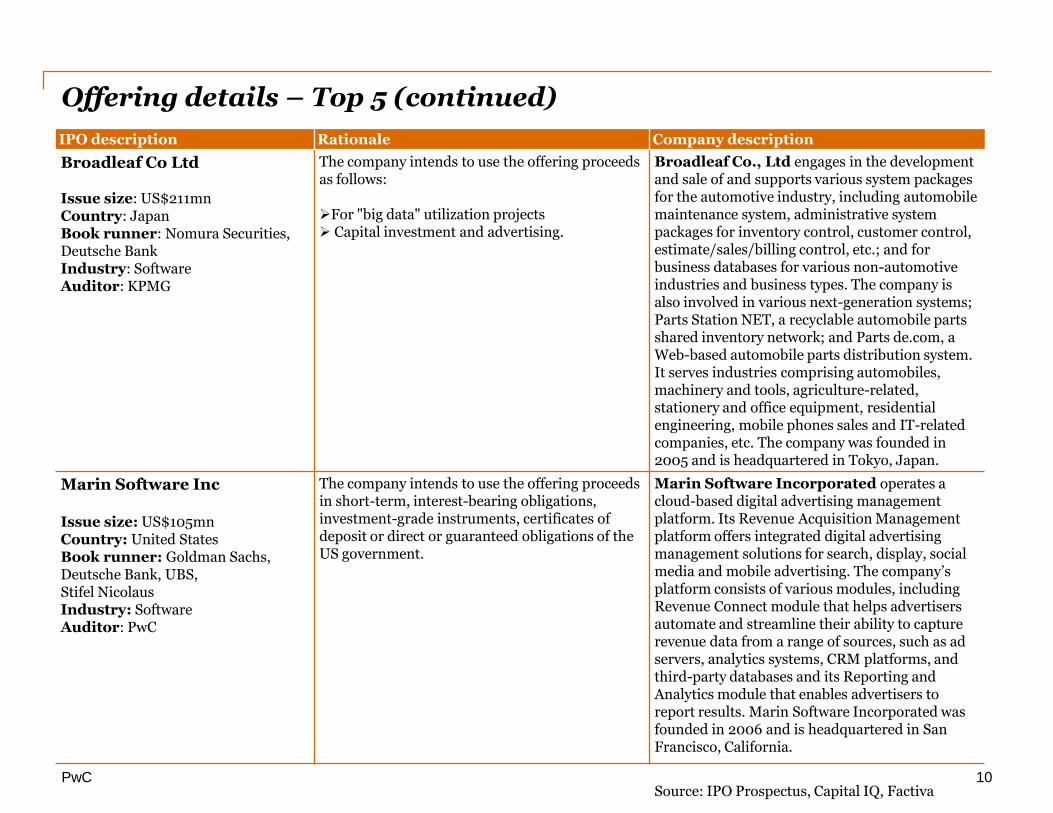
IPO description Rationale Company description
Broadleaf Co Ltd Issue size: US$211mn Country: Japan Book runner: Nomura Securities, Deutsche Bank Industry: Software Auditor: KPMG
The company intends to use the offering proceeds as follows: For "big data" utilization projects Capital investment and advertising.
Broadleaf Co., Ltd engages in the development and sale of and supports various system packages for the automotive industry, including automobile maintenance system, administrative system packages for inventory control, customer control, estimate/sales/billing control, etc.; and for business databases for various non-automotive industries and business types. The company is also involved in various next-generation systems; Parts Station NET, a recyclable automobile parts shared inventory network; and Parts de.com, a Web-based automobile parts distribution system. It serves industries comprising automobiles, machinery and tools, agriculture-related, stationery and office equipment, residential engineering, mobile phones sales and IT-related companies, etc. The company was founded in 2005 and is headquartered in Tokyo, Japan.
Marin Software Inc Issue size: US$105mn Country: United States Book runner: Goldman Sachs, Deutsche Bank, UBS, Stifel Nicolaus Industry: Software Auditor: PwC
The company intends to use the offering proceeds in short-term, interest-bearing obligations, investment-grade instruments, certificates of deposit or direct or guaranteed obligations of the US government.
Marin Software Incorporated operates a cloud-based digital advertising management platform. Its Revenue Acquisition Management platform offers integrated digital advertising management solutions for search, display, social media and mobile advertising. The company’s platform consists of various modules, including Revenue Connect module that helps advertisers automate and streamline their ability to capture revenue data from a range of sources, such as ad servers, analytics systems, CRM platforms, and third-party databases and its Reporting and Analytics module that enables advertisers to report results. Marin Software Incorporated was founded in 2006 and is headquartered in San Francisco, California.
Offering details – Top 5 (continued)
10 Source: IPO Prospectus, Capital IQ, Factiva

PwC
Geographic distribution*
11
0
1
2
3
4
5
6
7
0
150
300
450
600
750
900
1,050
Un
ite
d
Sta
tes
UK
Bra
zil
Ja
pa
n
So
uth
Ko
rea
No
. o
f IP
Os
In U
S$
mn
Number of IPOs [yellow line]
In the current quarter, US led with six IPOs. US funds raised equaled a little over half of the total at US$912mn. West Corp was the biggest issue in terms of amount raised in US, with US$426mn. In terms of other countries, HellermannTyton Group PLC raised US$321mn in the UK and Linx SA raised US$231mn in Brazil.
Bar = proceeds in US$ mn
Source: Thomson Reuters
United States 6
UK 1
Brazil 1
Japan 1
South Korea 1
Total 10
* IPO is credited to the country where the company is headquartered and not the location of the exchange.
PwC
Sector distribution
12
0
1
2
3
4
5
6
7
8
0
100
200
300
400
500
600
700
Soft
ware
Co
mm
unic
ation
s
Eq
uip
me
nt
Inte
rnet S
oft
wa
re &
S
erv
ice
s
Se
mic
on
du
cto
rs
IT C
onsu
ltin
g &
S
erv
ice
s
Co
mp
ute
rs &
P
eriph
era
ls
No
. o
f IP
Os
In U
S$
mn
Number of IPOs [yellow line] Bar = proceeds in US$ mn
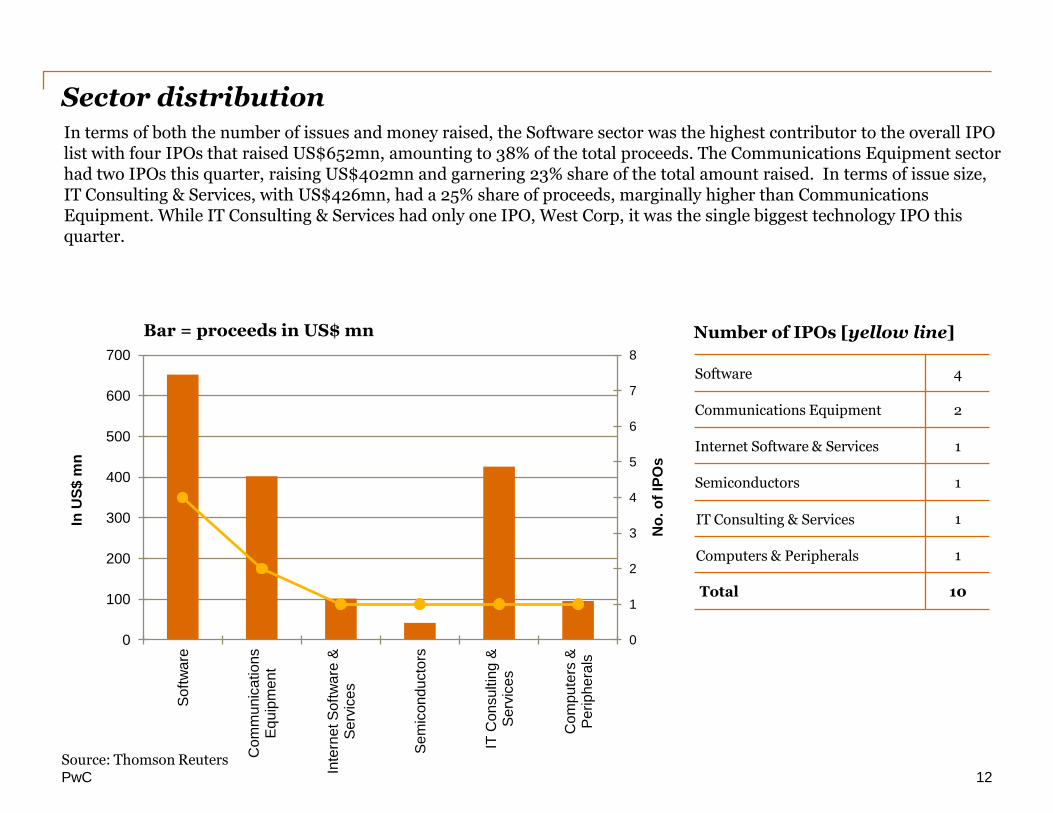
In terms of both the number of issues and money raised, the Software sector was the highest contributor to the overall IPO list with four IPOs that raised US$652mn, amounting to 38% of the total proceeds. The Communications Equipment sector had two IPOs this quarter, raising US$402mn and garnering 23% share of the total amount raised. In terms of issue size, IT Consulting & Services, with US$426mn, had a 25% share of proceeds, marginally higher than Communications Equipment. While IT Consulting & Services had only one IPO, West Corp, it was the single biggest technology IPO this quarter.
Source: Thomson Reuters
Software 4
Communications Equipment 2
Internet Software & Services 1
Semiconductors 1
IT Consulting & Services 1
Computers & Peripherals 1
Total 10
PwC
Stock exchange distribution
13
0
1
2
3
4
5
6
7
8
9
0
100
200
300
400
500
600
700
800
900
Na
sda
q
NY
SE
Oth
ers
No
. o
f IP
Os
In U
S$
mn
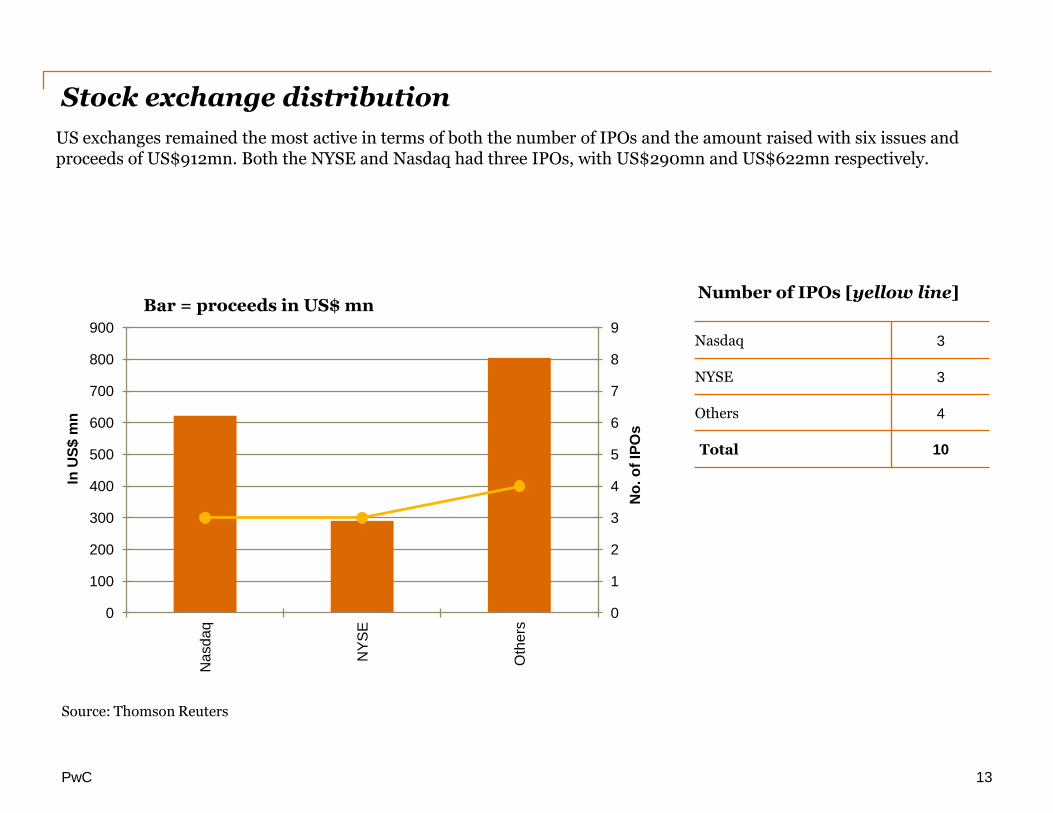
US exchanges remained the most active in terms of both the number of IPOs and the amount raised with six issues and proceeds of US$912mn. Both the NYSE and Nasdaq had three IPOs, with US$290mn and US$622mn respectively.
Source: Thomson Reuters
Number of IPOs [yellow line]
Nasdaq 3
NYSE 3
Others 4
Total 10
Bar = proceeds in US$ mn
PwC
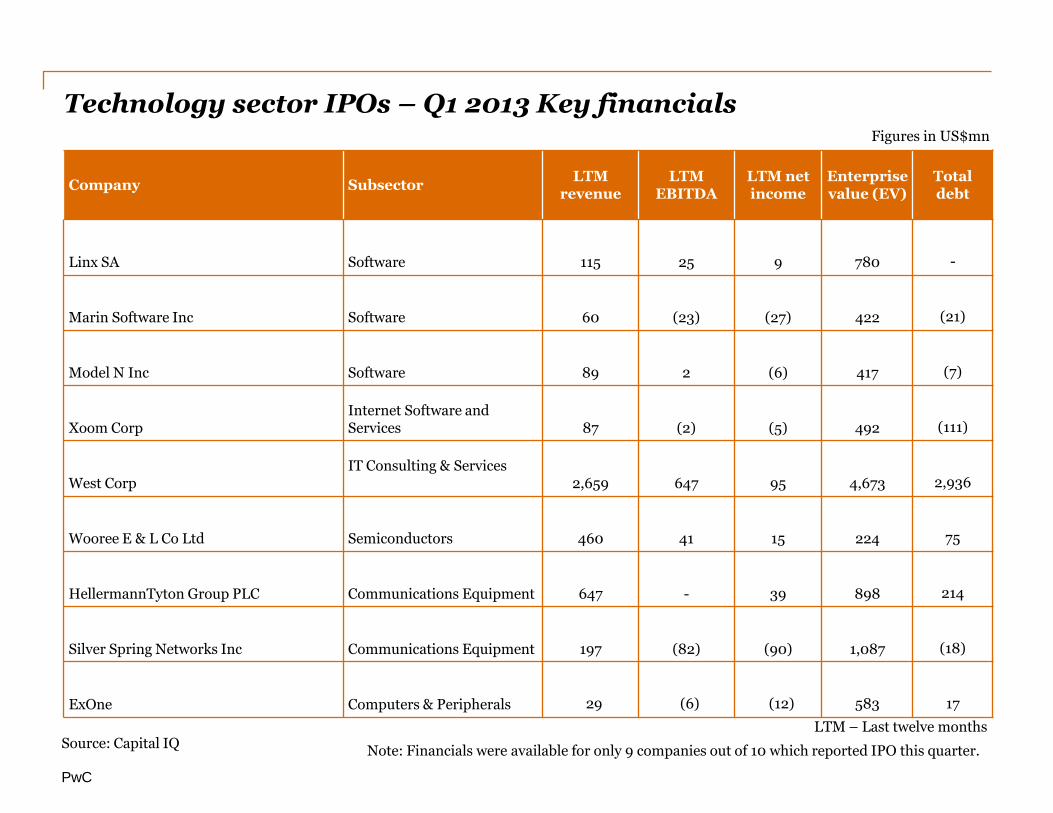
Technology sector IPOs – Q1 2013 Key financials
Source: Capital IQ
Company Subsector LTM
revenue LTM
EBITDA LTM net income
Enterprise value (EV)
Total debt
Linx SA Software 115 25 9 780 -
Marin Software Inc Software 60 (23) (27) 422 (21)
Model N Inc Software 89 2 (6) 417 (7)
Xoom Corp Internet Software and Services 87 (2) (5) 492 (111)
West Corp IT Consulting & Services 2,659 647 95 4,673 2,936
Wooree E & L Co Ltd Semiconductors 460 41 15 224 75
HellermannTyton Group PLC Communications Equipment 647 - 39 898 214
Silver Spring Networks Inc Communications Equipment 197 (82) (90) 1,087 (18)
ExOne Computers & Peripherals 29 (6) (12) 583 17
Figures in US$mn
LTM – Last twelve months
Note: Financials were available for only 9 companies out of 10 which reported IPO this quarter.
PwC
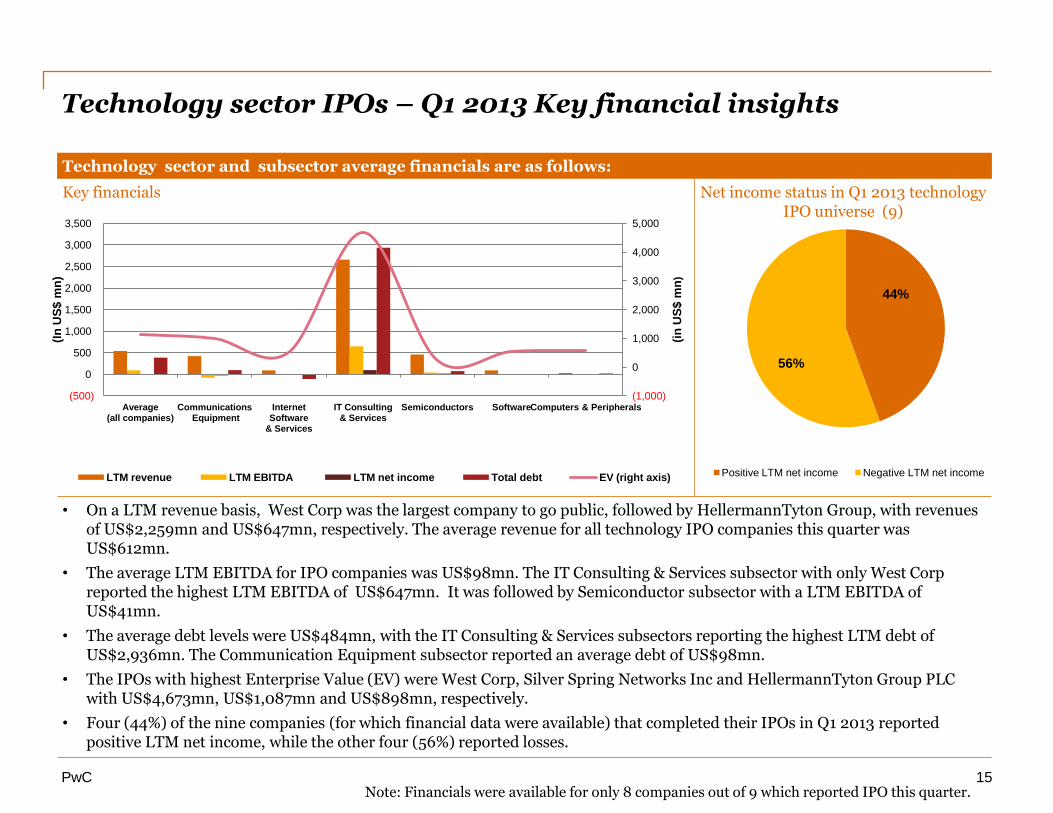
Technology sector and subsector average financials are as follows:
Key financials
Net income status in Q1 2013 technology IPO universe (9)
• On a LTM revenue basis, West Corp was the largest company to go public, followed by HellermannTyton Group, with revenues of US$2,259mn and US$647mn, respectively. The average revenue for all technology IPO companies this quarter was US$612mn.
• The average LTM EBITDA for IPO companies was US$98mn. The IT Consulting & Services subsector with only West Corp reported the highest LTM EBITDA of US$647mn. It was followed by Semiconductor subsector with a LTM EBITDA of US$41mn.
• The average debt levels were US$484mn, with the IT Consulting & Services subsectors reporting the highest LTM debt of US$2,936mn. The Communication Equipment subsector reported an average debt of US$98mn.
• The IPOs with highest Enterprise Value (EV) were West Corp, Silver Spring Networks Inc and HellermannTyton Group PLC with US$4,673mn, US$1,087mn and US$898mn, respectively.
• Four (44%) of the nine companies (for which financial data were available) that completed their IPOs in Q1 2013 reported positive LTM net income, while the other four (56%) reported losses.
44%
56%
Positive LTM net income Negative LTM net income
Technology sector IPOs – Q1 2013 Key financial insights
(1,000)
0
1,000
2,000
3,000
4,000
5,000
(500)
0
500
1,000
1,500
2,000
2,500
3,000
3,500
Average (all companies)
Communications Equipment
Internet Software
& Services
IT Consulting & Services
Semiconductors Software Computers & Peripherals
(in
US
$ m
n)
(In
US
$ m
n)
LTM revenue LTM EBITDA LTM net income Total debt EV (right axis)
15 Note: Financials were available for only 8 companies out of 9 which reported IPO this quarter.
PwC
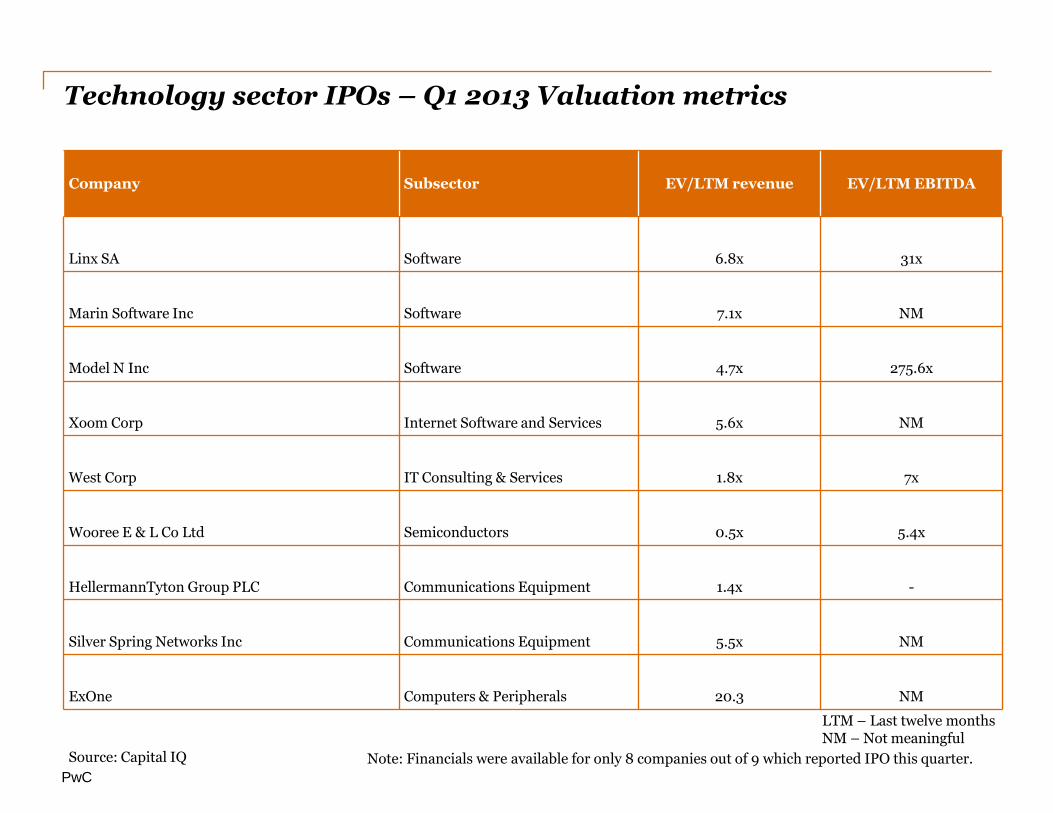
Technology sector IPOs – Q1 2013 Valuation metrics
Source: Capital IQ
Company Subsector EV/LTM revenue EV/LTM EBITDA
Linx SA Software 6.8x 31x
Marin Software Inc Software 7.1x NM
Model N Inc Software 4.7x 275.6x
Xoom Corp Internet Software and Services 5.6x NM
West Corp IT Consulting & Services 1.8x 7x
Wooree E & L Co Ltd Semiconductors 0.5x 5.4x
HellermannTyton Group PLC Communications Equipment 1.4x -
Silver Spring Networks Inc Communications Equipment 5.5x NM
ExOne Computers & Peripherals 20.3 NM
LTM – Last twelve months NM – Not meaningful
Note: Financials were available for only 8 companies out of 9 which reported IPO this quarter.
PwC
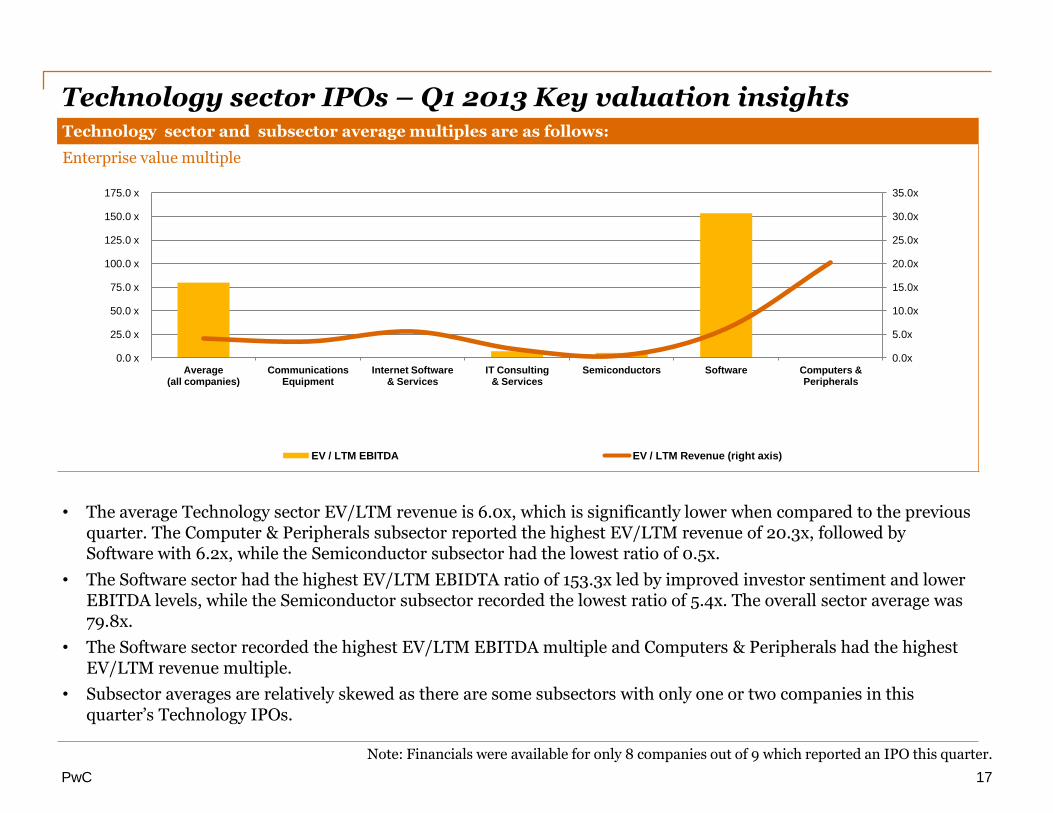
Technology sector IPOs – Q1 2013 Key valuation insights Technology sector and subsector average multiples are as follows:
Enterprise value multiple
• The average Technology sector EV/LTM revenue is 6.0x, which is significantly lower when compared to the previous quarter. The Computer & Peripherals subsector reported the highest EV/LTM revenue of 20.3x, followed by Software with 6.2x, while the Semiconductor subsector had the lowest ratio of 0.5x.
• The Software sector had the highest EV/LTM EBIDTA ratio of 153.3x led by improved investor sentiment and lower EBITDA levels, while the Semiconductor subsector recorded the lowest ratio of 5.4x. The overall sector average was 79.8x.
• The Software sector recorded the highest EV/LTM EBITDA multiple and Computers & Peripherals had the highest EV/LTM revenue multiple.
• Subsector averages are relatively skewed as there are some subsectors with only one or two companies in this quarter’s Technology IPOs.
0.0x
5.0x
10.0x
15.0x
20.0x
25.0x
30.0x
35.0x
0.0 x
25.0 x
50.0 x
75.0 x
100.0 x
125.0 x
150.0 x
175.0 x
Average (all companies)
Communications Equipment
Internet Software & Services
IT Consulting & Services
Semiconductors Software Computers & Peripherals
EV / LTM EBITDA EV / LTM Revenue (right axis)
17
Note: Financials were available for only 8 companies out of 9 which reported an IPO this quarter.
PwC
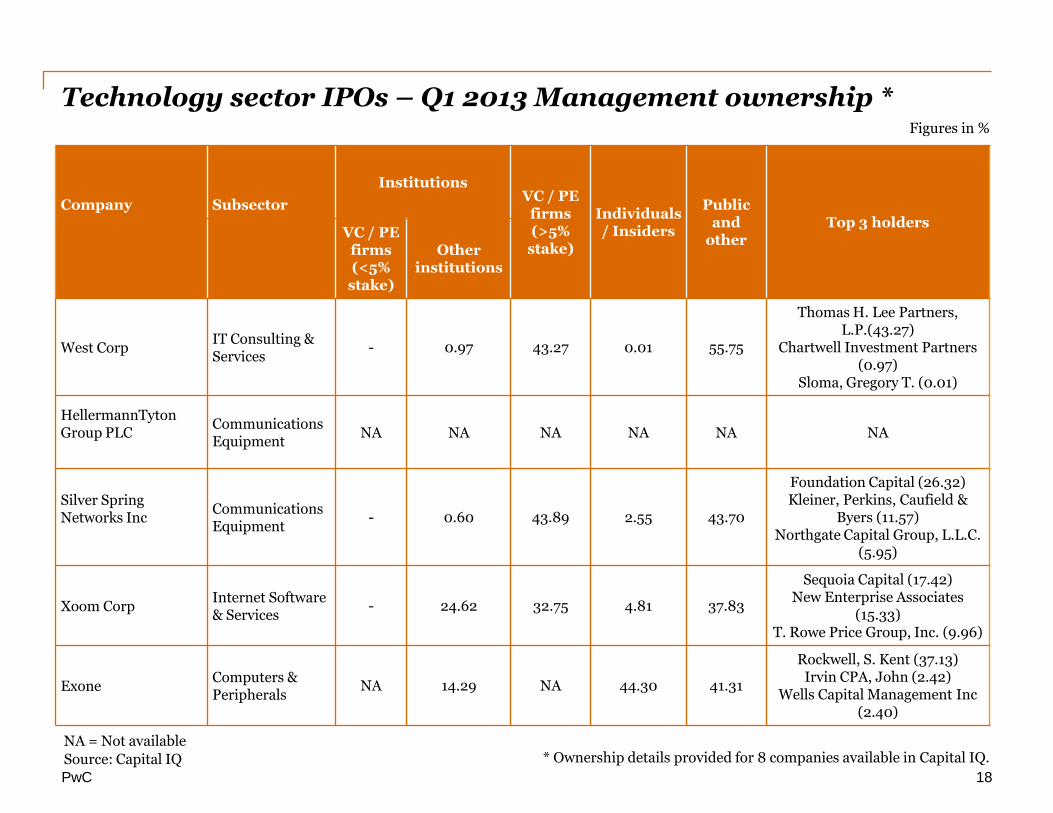
Technology sector IPOs – Q1 2013 Management ownership *
Source: Capital IQ
18
Company Subsector
Institutions VC / PE
firms (>5%
stake)
Individuals / Insiders
Public and
other Top 3 holders
VC / PE firms (<5%
stake)
Other institutions
West Corp IT Consulting & Services
- 0.97 43.27 0.01 55.75
Thomas H. Lee Partners, L.P.(43.27)
Chartwell Investment Partners (0.97)
Sloma, Gregory T. (0.01)
HellermannTyton Group PLC
Communications Equipment
NA NA NA NA NA NA
Silver Spring Networks Inc
Communications Equipment
- 0.60 43.89 2.55 43.70
Foundation Capital (26.32) Kleiner, Perkins, Caufield &
Byers (11.57) Northgate Capital Group, L.L.C.
(5.95)
Xoom Corp Internet Software & Services
- 24.62 32.75 4.81 37.83
Sequoia Capital (17.42) New Enterprise Associates
(15.33) T. Rowe Price Group, Inc. (9.96)
Exone Computers & Peripherals
NA 14.29 NA 44.30 41.31
Rockwell, S. Kent (37.13) Irvin CPA, John (2.42)
Wells Capital Management Inc (2.40)
* Ownership details provided for 8 companies available in Capital IQ.
Figures in %
NA = Not available
PwC
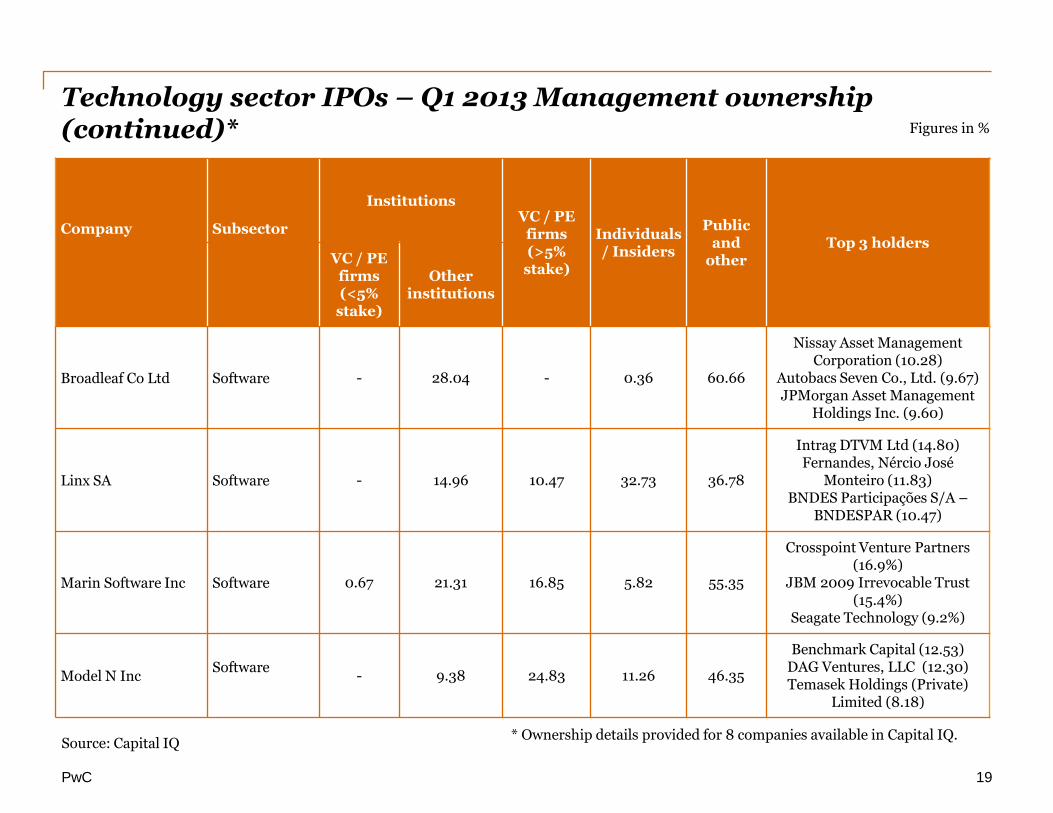
Technology sector IPOs – Q1 2013 Management ownership (continued)*
Source: Capital IQ
19
Company Subsector
Institutions VC / PE
firms (>5%
stake)
Individuals / Insiders
Public and
other Top 3 holders
VC / PE firms (<5%
stake)
Other institutions
Broadleaf Co Ltd Software - 28.04 - 0.36 60.66
Nissay Asset Management Corporation (10.28)
Autobacs Seven Co., Ltd. (9.67) JPMorgan Asset Management
Holdings Inc. (9.60)
Linx SA Software - 14.96 10.47 32.73 36.78
Intrag DTVM Ltd (14.80) Fernandes, Nércio José
Monteiro (11.83) BNDES Participações S/A –
BNDESPAR (10.47)
Marin Software Inc Software 0.67 21.31 16.85 5.82 55.35
Crosspoint Venture Partners (16.9%)
JBM 2009 Irrevocable Trust (15.4%)
Seagate Technology (9.2%)
Model N Inc Software
- 9.38 24.83 11.26 46.35
Benchmark Capital (12.53) DAG Ventures, LLC (12.30) Temasek Holdings (Private)
Limited (8.18)
* Ownership details provided for 8 companies available in Capital IQ.
Figures in %
PwC
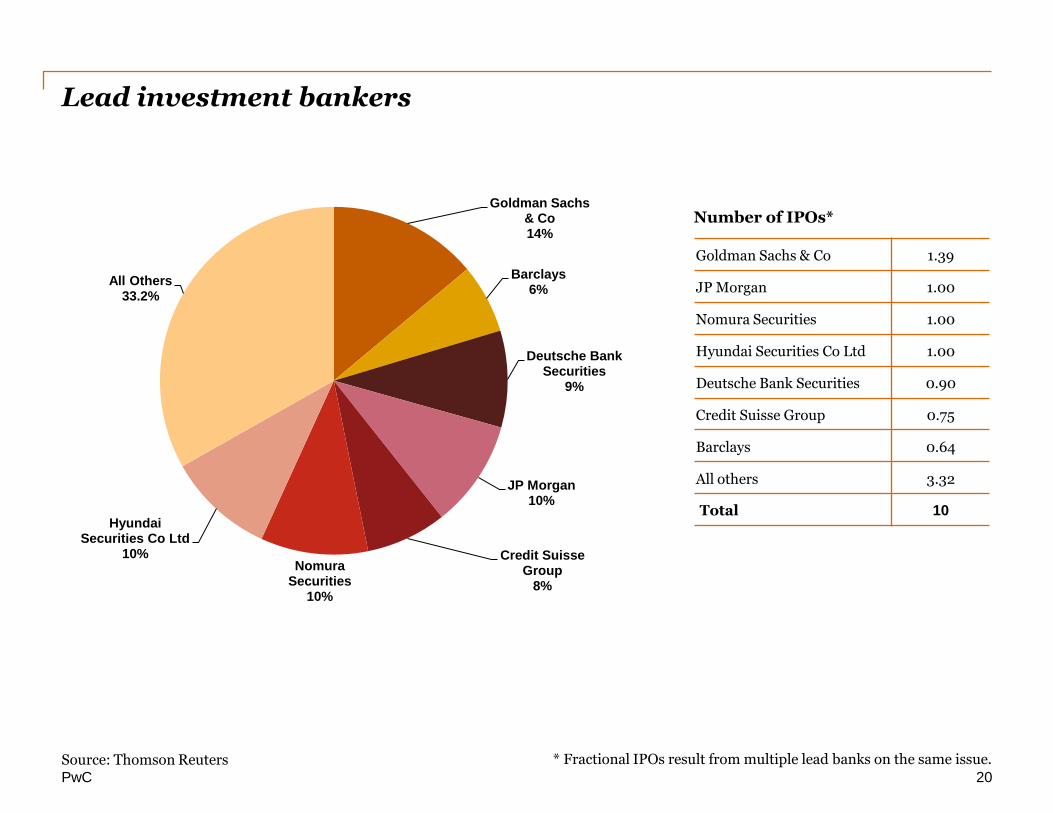
Lead investment bankers
20
* Fractional IPOs result from multiple lead banks on the same issue.
Number of IPOs*
Goldman Sachs & Co 1.39
JP Morgan 1.00
Nomura Securities 1.00
Hyundai Securities Co Ltd 1.00
Deutsche Bank Securities 0.90
Credit Suisse Group 0.75
Barclays 0.64
All others 3.32
Total 10
Source: Thomson Reuters
Goldman Sachs & Co 14%
Barclays 6%
Deutsche Bank Securities
9%
JP Morgan 10%
Credit Suisse Group
8%
Nomura Securities
10%
Hyundai Securities Co Ltd
10%
All Others 33.2%
PwC
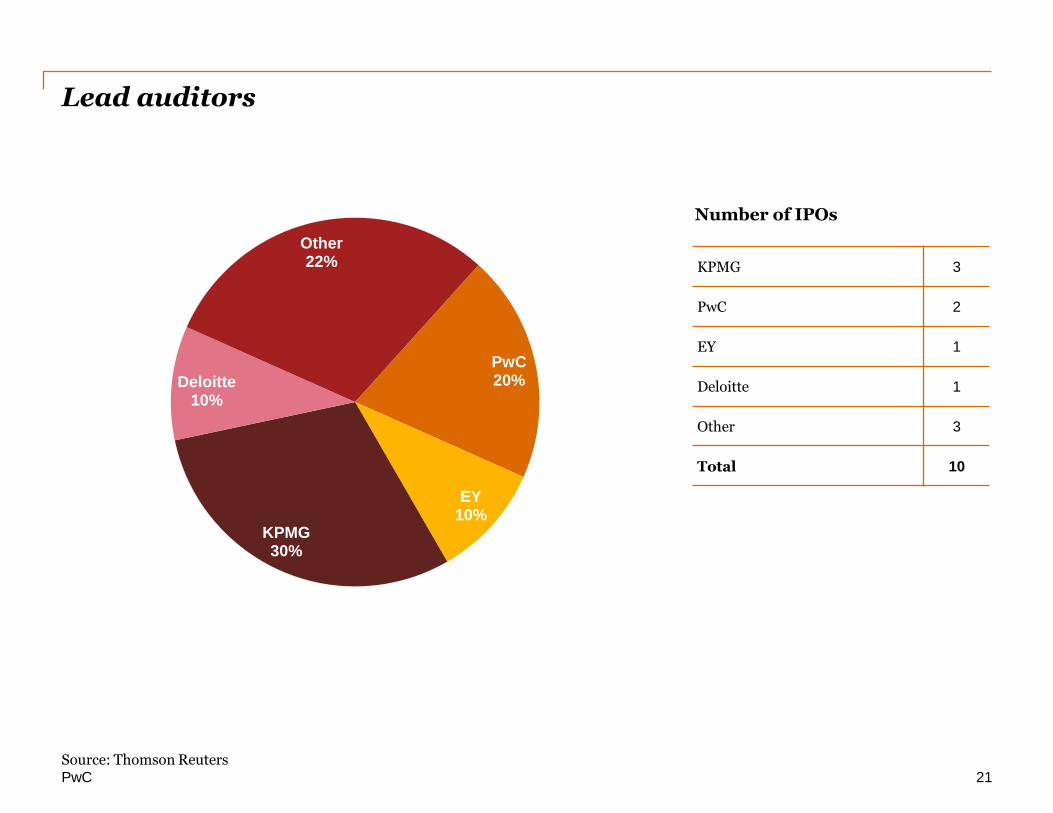
Lead auditors
Source: Thomson Reuters 21
Number of IPOs
KPMG 3
PwC 2
EY 1
Deloitte 1
Other 3
Total 10
PwC 20%
EY 10%
KPMG 30%
Deloitte 10%
Other 22%
PwC
Methodology
• The Global Technology IPO Review for Q1 2013 is based on PwC’s analysis of transaction data extracted from Thomson Reuters and Capital IQ. The analysis considers IPOs across all countries worldwide from 1 Jan 2013 to 31st March 2013. Financial data was obtained from Capital IQ.
• The definition of the Technology sector is based on Thomson Reuters and Capital IQ database industry classifications and includes the following subsectors:
- Internet Software & Services
- IT Consulting & Services
- Professional Services (e.g., Application Software, Software Solutions)
- Semiconductors
- Software
- Computer Storage & Peripherals
◦ Computer, Computer Peripheral Equipment
◦ Computer Storage Device Manufacturing
- Electronic Computer Manufacturing
- Communications Equipment
• Only IPOs with issue size greater than US$40mn were included in the analysis.
• All monetary amounts are in US dollars unless otherwise indicated.
• LTM – Last twelve months
22
We exercised reasonable professional care and diligence in the collection, processing and reporting of this information. However, the data used is from third-party sources and PwC has not independently verified, validated or audited the data. PwC makes no representations or warranties with respect to the accuracy of the information, or whether it is suitable for the purposes to which it is put by users.
PwC
Technology industry leaders
23
Rod Dring – Australia Werner Ballhaus – Germany Yury Pukha – Russia Phone: 61 2 8266 7865 Email: [email protected]
Phone: 49 211 981 5848 Email: [email protected]
Phone: 7 495 223 5177 Email: [email protected]
Estela Vieira – Brazil Sanjay Dhawan– India Greg Unsworth – Singapore
Phone: 55 1 3674 3802 Email: [email protected]
Phone: 91 80 4079 7003 Email: sanjay.,[email protected]
Phone: 65 6236 3738 Email: [email protected]
Christopher Dulny– Canada Kenji Katsura– Japan Douglas Mahony – UAE
Phone: +416 869 2355 Email: [email protected]
Phone: 81 90 5428 7687 Email: [email protected]
Phone: 97 1 43043151 Email: [email protected]
JianBin Gao – China Hoonsoo Yoon – Korea Jass Sarai – UK
Phone: 86 21 2323 3362 Email: [email protected]
Phone: 82 2 709 0201 Email: [email protected]
Phone: 44 0 1895 52 2206 Email: [email protected]
Xavier Cauchois – France Ilja Linnemeijer– The Netherlands Tom Archer– US
Phone: 33 1 5657 10 33 Email: [email protected]
Phone: 31 88 792 4956 Email: [email protected]
Phone: 1 408 817 3836 Email: [email protected]
Raman Chitkara Global Technology Leader Phone: 1 408 817 3746 Email: [email protected]
PwC
For questions or comments, please contact:
24
Raman Chitkara Jan Akers
Global Technology Leader Phone: 1 408 817 3746 Email: [email protected]
Global Technology Marketing Phone: 1 408 817 4449 Email: [email protected]
This presentation is prepared by PwC, KSDC Research & Analytics team.
©2013 PricewaterhouseCoopers LLP. All rights reserved. “PricewaterhouseCoopers” refers to PricewaterhouseCoopers LLP, a Delaware Ltd. liability partnership, or, as the context requires, the PricewaterhouseCoopers global network or other member firms of the network, each of which is a separate and independent legal entity.