Embed Size (px)
Citation preview

Global Tech Support Scam Research
Global Summary, September 2018

2
Consumers reduced their exposure and losses from tech support scams*: Over six-in-ten consumers experienced a tech support scam down 5-points since 2016 driven by a decline in pop-up ads/windows, the most common type of tech support scam (49%). Scammers most often tricked consumers into downloading software (44%) or directing them to a specific website (34%). Fewer consumers reported losing money directly as a result of the tech support scam; 6% vs. 9% in 2016.
Tech support scams cause more than financial losses: An additional 8% of consumers who didn't directly lose money to scams spent time and money checking and repairing their PCs. The combination of monetary and time losses produced high levels of stress as 76% of consumers who encountered tech support scams said they suffered moderate to severe stress from the scam.
Consumers were more suspicious of potential tech support scams: Heightened skepticism and distrust about potential tech support scams contributed to better outcomes for consumers. 75% of consumers believed it highly unlikely that a reputable company would initiate unsolicited contact and 83% would distrust that type of communication, up 12 and 17-points respectively. Only 41% of consumers who experienced a tech support scam would trust companies not to sell them unnecessary support or repair services. Over seven-in-ten consumers who experienced scams lost trust in software and technology companies ability to protect them from tech support scams.
Scammers most often requested consumers to download software or visit a specific website: Unfortunately,consumers took these two actions most often during a potential tech support scam interaction. In response to a hypothetical unsolicited contact, 38% reported they would try to block the company from contacting them while 33% would spent time researching the problem. Search engines (46%) and company websites (31%) were employed most often to learn and get help with tech support scams.
Gen Z, Millennials and Males were the most vulnerable to tech support scams: These groups were the most likely to lose money after continuing an interaction. They engaged in riskier online behavior such as visiting torrent sites, have a greater familiarity with technology companies than older generations and were potentially hurt by overconfidence in their device and Web expertise. Telephone tech support scams were the one area experienced more by Boomers/older consumers than by younger internet users.
The future of tech support scams: This research suggests that both education and technology can play a role in reducing consumer’s vulnerability to tech support scams. A 12-point drop in scammers asking for social security numbers (or their international equivalents) reflects the power of awareness building and education while increased adoption of ad-blocking technology in recent years potentially contributed to a significant decline in pop-up ads/windows scams.
The state of tech support scams in 2018
*A tech support scam is a phone call, email or online interaction which appears to be from a reputable company, claiming that your computer is infected with a virus

Study overview
3
Examines the incidence and consequences of tech support scams worldwide
Web based survey of 16,048 adult internet users in 16 countries worldwide (1,000 per country)
Sampled users 18 and older, proportional to internet user population. Equally divided between males and females*
Updates a twelve country study done in 2016
Participating countries: (those added in 2018 shown in italics)
Australia Denmark Japan South Africa
Brazil France Mexico Switzerland
Canada Germany New Zealand United Kingdom
China India Singapore USA
Changes seen in 2018 vs 2016 results remain consistent even if new geos are excluded
*Within each country readable samples of Gen Z, Millennials, Gen X and Boomers were gathered. Worldwide sample is weighted 36% ages 18-34, 30% ages 35-49, and 34% ages 50+. Exact percentages in each geo reflect that nation’s internet population.
Glossary of terms
4
Types of tech support scams
• Email: An unsolicited email that appears to be from a reputable company which claims that your computer is infected with a virus and
that they can help resolve the issue.
• Pop-Up: A pop-up window or advertisement online that appears to be from a reputable company which claims that your computer is
infected with a virus and that they can help resolve the issue.
• Phone: An unsolicited telephone call from someone claiming to be from a reputable company where the caller told you that your
computer may be infected with a virus or some other security or network problem, and that they can help resolve the issue.
• Redirect: Been redirected to a website that appears to be from a reputable company which claims that your computer is infected with a
virus and that they can help resolve the issue.
Types of actions taken after encountering a tech support scam
• Ignored the interaction completely
• Continued with the interaction:
Continued with the interaction and took the recommended actions
Initially continued with the interaction, but then did not take further action
Online activities description
• Access my bank accounts and/or credit card accounts online
• Change passwords for email, social media and financial accounts
• Share my email address in exchange for access to website content
• Use a social media site (e.g., Facebook, Snapchat, Instagram, etc.…)
• Download the latest software updates shortly after they are made available
• Download movies, tv shows, music, other video
• Use torrent sites
• Buy products online (includes online auctions and classified ads)

How pervasive are tech support scams today?
5
The percentage of consumers who
reported experiencing a tech
support scam was 63%, down from
68% in 2016. Fewer pop-up
ads/windows fueled the decline.
Those who lost money directly
from a tech support scam fell 3-
points to 6%.
Consumers successfully migrate
their response to tech support
scams from ignoring (-6) to
avoiding the scam completely (+5)
potentially via increased
deployment of pop-up ad-blockers.
Scammers were successful in
tricking nearly one-in-five
consumers into continuing with a
potentially fraudulent interaction
about the same as in 2016.
37%32%
43%49%
13%11%
6%9%
20182016
Actions taken after
encountering a tech support
scam(Base: Experienced scam)
Continued, lost
money
Continued,
didn't lose
money
Ignored
No interaction
Fewer lost money
More avoided scam
completely
44%49%
37%39%
36%37%
27%
30%
20182016
Types of tech support scams
Unsolicited call
Redirect to
website
Unsolicited email
Pop-up ad or
window
Fewer pop-up ads/windows
Q1a. Please indicate whether you have experienced any of the following in the last year or so (2017 and later).
Q2. For each of the interactions you experienced, please indicate which actions you took

Millennials, Males & Gen Z had the highest exposure to tech support scams
6Q1a. Please indicate whether you have experienced any of the following in the last year or so (2017 and later).
Q2. For each of the interactions you experienced, please indicate which actions you took
Q8. As a result of this interaction, have you lost any money?
53%
52%
43%
33%
50%
39%
35%
43%
36%
31%
42%
32%
48%
43%
33%
26%
40%
32%
25%
27%
25%
31%
30%
24%
Gen Z: 18-23
Millennials: 24-37
Gen X: 38-53
Boomers: 54+
Male
Female
Tech Support Scam incidence by Age &
Gender
Pop-up ad or window
Unsolicited email
Redirect to website
Unsolicited call
16% 16%12%
10%
9% 10%
4%
2%
Gen Z Millennials Gen X Boomers
Millennials were most likely to
lose money
Continued, lost money
Continued, didn't lose money
14% 13%
7%
5%
Male Female
Males were more likely to lose
money
Continued, lost money
Continued, didn't lose money

Tech support scams cause more than financial losses
7
30%
19%
2%
48%
0%
10%
20%
30%
40%
50%
60%
70%
80%
90%
100%
Axis Title
Time spent checking & repair
their PC (Base: experienced a scam)
No time
>Week
Week or less
< Few hours
5%
19%
44%
32%
0%
10%
20%
30%
40%
50%
60%
70%
80%
90%
100%
Axis Title
Amount of stress created by
the scam (Base: continued)
Severe stress
Moderate
stress
Mild stress
No stress
Q12a. To date, how much time has it taken to fix or investigate further as to whether your computer had been compromised after this interaction?Q13. Thinking back on each interaction, how much stress did you suffer? If you had multiple interactions, think how you felt about the most stressful one. The most stressful interaction caused me…
Among those who experienced a
scam, 52% ended up spending time
checking and repairing their PC.
Over three-in-four consumers who
continued with a scam* reported
suffering from moderate to severe
stress due to the fraudulent
interaction.
76% moderate to severe stress
52% spent time checking &
repairing their PC
New items in 2018
*That is, consumers who encountered a scam and at least initially
started doing what was asked/did not just ignore it. This is a mix of
those who:
• Continued with the interaction and took the recommended actions
• Initially continued with the interaction, but then did not take
further action

How are consumers fighting back against tech support scams?
8
Consumers have developed a
healthy skepticism about
unsolicited contact from
technology and software
companies. Unsolicited contact
has become a red flag for
consumers that signals a
potential scam.
If faced with an unsolicited
contact from a reputable tech
company, 38% of consumers
would try to block that
company from making contact
in the future and 33% would
look up the issue online.
46% of consumers rely on
search engines to research tech
support scams and 31% use
company websites.41%
28%
31%
0%
20%
40%
60%
80%
100%
Trust companies not to sell unnecessary
support services(Base – experience any scam)
Distrust a lot/no
trust at all
Distrust a little
Trust a lot/a little
37%25%
63%75%
2016 2018
Most believed companies would not initiate
unsolicited contact (Base: Total)
Very/Somewhat
unlikely
Very/Somewhat
likely
3%13%
22%
61%
0%
20%
40%
60%
80%
100%
Most were distrustful of unsolicited contact (Base – total)
Very unlikely
Somewhat
unlikely
Somewhat likely
Very likely
28%
44%
22%
6%
0%
20%
40%
60%
80%
100%
72% lost trust in companies ability to
protect people from scams (Base – experience
any scam)
Lost all trust
Lost a lot of
trust
Lost a little trust
Did not lose any
trustNew item in 2018
Q14. If you were to receive an unsolicited call or email like this from someone claiming to be from a reputable company offering you help, how likely would you be to trust them? Q15. How likely do you think it is that a reputable company would contact customers without first receiving some form of interaction from the customer? Q13b. How much do you trust software and technology companies not to sell you unnecessary support or repair services to fix new problems that are discovered on your computer? Q13c. Thinking back on each interaction, how much trust have you lost in reputable companies like Apple, Facebook, Google and Microsoft to protect you from the types of interactions you experienced?
New item in 2018
New item in 2018

Why are Gen Z, Millennials & Males more vulnerable to tech support scams?
9
72%
39%
37%
40%
25%
32%
36%
17%
69%
50%
43%
40%
28%
30%
30%
16%
0% 20% 40% 60% 80%
Use social media
Access bank, credit card
accounts
Buy products online
Timely download of software
updates
Regularly change passwords
Share email in exchange for
content
Download movie, music,
videos
Use Torrent sites
Online activities (% almost always/often)
Gen Z: 18-23 Millennials:24-37
Gen X:38-53 Boomers: 54+
Millennials and Gen Z engage in
more risky online activities than
older generations that included
exchanging email for access to
content, downloading movies, music,
videos or using torrent sites.
The youngest generations rated
themselves highest on web and
computer expertise suggesting that
overconfidence in their online
abilities could cause them to be less
cautious and thereby more
susceptible to scams.
Millennials and Gen Z were found to
be more trusting than older
generations of reputable companies
making unsolicited contact. Greater
trust may result from a lack of
experience or naivete as well as
differing expectations among those
more familiar with technology
companies than older generations.
30%
33%
22%
18%
70%
67%
78%
82%
Gen Z
Millennials
Gen X
Boomers
Millennials were most likely to
believe unsolicited contact is
normal
Very/Somewhat likely
Very/Somewhat unlikely
Those who continued & lost money engaged more frequently in these activities
Q15. How likely do you think it is that a reputable company would contact customers without first receiving some form of interaction from the customer? Q21a. Please check how often you do the following activities when you are online?
New item in 2018
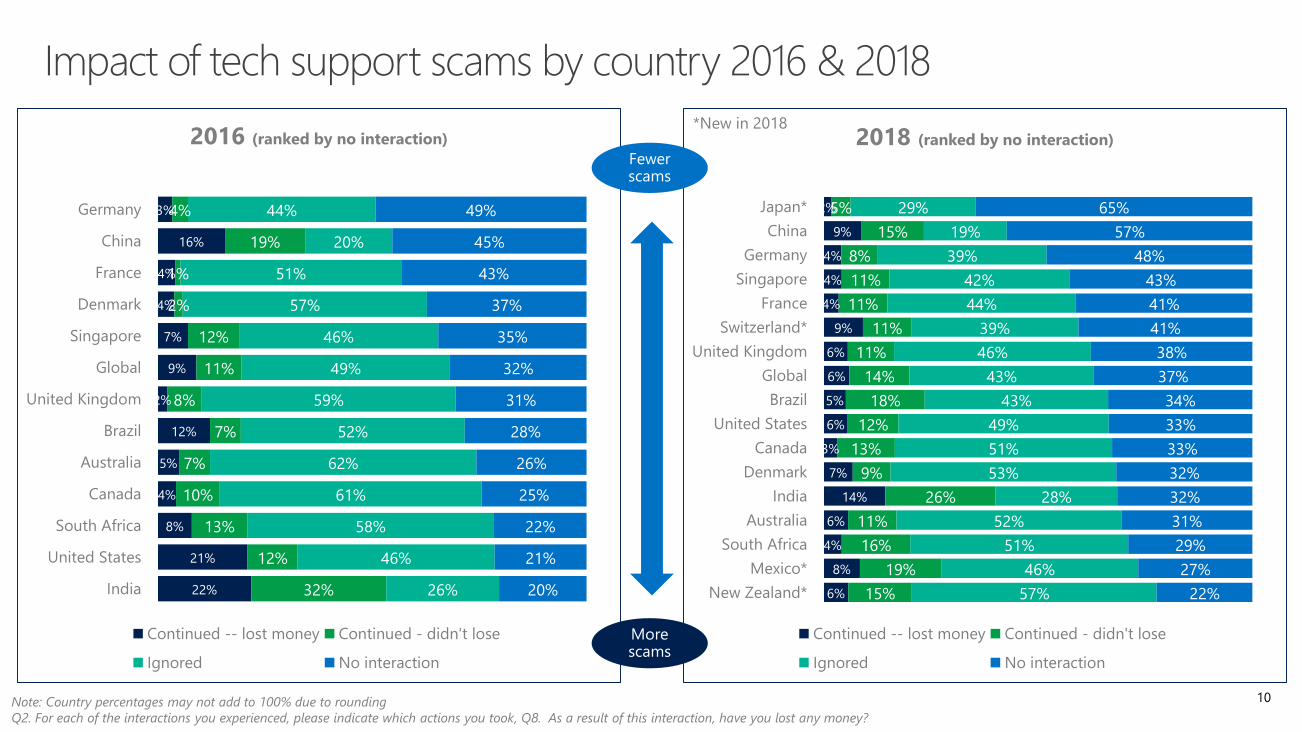
Impact of tech support scams by country 2016 & 2018
10
2%
9%
4%
4%
4%
9%
6%
6%
5%
6%
3%
7%
14%
6%
4%
8%
6%
5%
15%
8%
11%
11%
11%
11%
14%
18%
12%
13%
9%
26%
11%
16%
19%
15%
29%
19%
39%
42%
44%
39%
46%
43%
43%
49%
51%
53%
28%
52%
51%
46%
57%
65%
57%
48%
43%
41%
41%
38%
37%
34%
33%
33%
32%
32%
31%
29%
27%
22%
0% 20% 40% 60% 80% 100%
Japan*
China
Germany
Singapore
France
Switzerland*
United Kingdom
Global
Brazil
United States
Canada
Denmark
India
Australia
South Africa
Mexico*
New Zealand*
2018 (ranked by no interaction)
Continued -- lost money Continued - didn't lose
Ignored No interaction
3%
16%
4%
4%
7%
9%
2%
12%
5%
4%
8%
21%
22%
4%
19%
1%
2%
12%
11%
8%
7%
7%
10%
13%
12%
32%
44%
20%
51%
57%
46%
49%
59%
52%
62%
61%
58%
46%
26%
49%
45%
43%
37%
35%
32%
31%
28%
26%
25%
22%
21%
20%
0% 20% 40% 60% 80% 100%
Germany
China
France
Denmark
Singapore
Global
United Kingdom
Brazil
Australia
Canada
South Africa
United States
India
2016 (ranked by no interaction)
Continued -- lost money Continued - didn't lose
Ignored No interaction
*New in 2018
Note: Country percentages may not add to 100% due to rounding
Q2. For each of the interactions you experienced, please indicate which actions you took, Q8. As a result of this interaction, have you lost any money?

Anatomy of tech support scamsScam exposure had costs beyond the initial loss of money
11
37%
No Interaction
63%
Exposed to Scam
19%
Continued
6%
Lost money to scam
3%
Spent money on
checking & repairing
5%
Invested time
checking & repairing
5%
Nothing happened
44%
Ignored scam
Q2. For each of the interactions you experienced, please indicate which actions you took
Q8. As a result of this interaction, have you lost any money?
Q12. To date, how much money, if any, has it cost you to fix or investigate further as to whether your computer had been compromised after this interaction?
Q12A. To date, how much time has it taken to fix or investigate further as to whether your computer had been compromised after this interaction?
Those who avoided direct scam losses spend time and money on repairs or to ensure their devices
were not compromised
Nearly half of those continuing incurred a direct economic cost

Rates of tech support scam loss became more consistent worldwide
12Q1a. Please indicate whether you have experienced any of the following in the last year or so (2017 and later). Q2. For each of the items you experienced, please indicate whether you continued with the interaction and took the recommended actions, initially continued but then did not take further action, or ignored the interaction. Q8. As a result of this interaction, have you lost any money?
The worldwide decline in scam loss was driven by declines in countries that had the highest rates of loss in 2016, lead by India, U.S., China and Brazil.
Conversely, countries which had the lowest scam incidence in 2016 (UK, Germany, Denmark) have regressed toward the worldwide average.
The U.S. was the single greatest ‘success story’, going from over two in 10 suffering losses to only 6%.
22%21%
16%
12%
9%8%
7%
5%
4% 4%
4% 3% 2%
14%
6%
9%
5%6%
4% 4%
6%
3% 4%
7%
4%
6%
India United
States
China Brazil Global South
Africa
Singapore Australia Canada France Denmark Germany United
Kingdom
Percent who Continued & Lost Money 2016-2018
2016 2018
Money loss increased
New in 2018 2018
Switzerland 9%
Mexico 8%
New Zealand 6%
Japan 2%

13

14
31%26%
52%62%
11%7%6%5%
20182016
Possible scam outcomes
Continued, lost
money
Continued, didn't
lose money
Ignored
No interaction
Country Snapshot Australia
66%
48%
33%
33%
25%
23%
29%
13%
61%
60%
39%
39%
29%
25%
23%
14%
Use social media
Access bank/credit card site
Download latest updates
Buy products online
Change passwords regularly
Share email in exchange for content
Download movies, music, videos
Use torrent sites
Online activities (% almost always/often)
Gen Z: 18-23 Millennials:24-37
Gen X:38-53 Boomers: 54+
Those who continued & lost money
engaged more frequently in
these activities
47% 42%
40% 40%
33% 34%
50% 46%
Types of tech support scams
Unsolicited call
Redirect to website
Unsolicited email
Pop-up ad or
window
Slight increase in
losing money
More avoided scam
completely
69% 73%
52%
76%
Spent time
checking/repairing PC
Level of stress
(Severe/Moderate)
Costs spread beyond monetary loss (Base: those who continued)
Australia Global
21%9%
79%91%
Percent believing companies would not
initiate unsolicited contact fell
Very/Somewhat
unlikely
Very/Somewhat
likely
56%
52%
38%
31%
50%
34%
37%
46%
37%
38%
47%
34%
49%
46%
29%
24%
40%
29%
40%
39%
39%
59%
49%
42%
Gen Z: 18-23
Millennials: 24-37
Gen X: 38-53
Boomers: 54+
Male
Female
Tech support scam incidence by age &
gender
Pop-up ad or window Unsolicited email
Redirect to website Unsolicited call
New item in 2018
New item in 2018

15
34%28%
43%52%
19%7%
5%12%
20182016
Possible scam outcomes
Continued, lost
money
Continued, didn't
lose money
Ignored
No interaction
Country Snapshot Brazil
81%
40%
47%
39%
21%
38%
45%
28%
78%
49%
48%
46%
27%
39%
41%
26%
Use social media
Access bank/credit card site
Download latest updates
Buy products online
Change passwords regularly
Share email in exchange for content
Download movies, music, videos
Use torrent sites
Online activities (% almost always/often)
Gen Z: 18-23 Millennials:24-37
Gen X:38-53 Boomers: 54+
Those who continued & lost money
engaged more frequently in
these activities
57% 44%
44%37%
47%
36%
14%
16%
Types of tech support scams
Unsolicited call
Redirect to website
Unsolicited email
Pop-up ad or
window
Fewer lost money
More avoided scam
completely
69%
82%
52%
76%
Spent time
checking/repairing PC
Level of stress
(Severe/Moderate)
Costs spread beyond monetary loss (Base: those who continued)
Brazil Global
17%23%
83%77%
Most believed companies would not
initiate unsolicited contact
Very/Somewhat
unlikely
Very/Somewhat
likely
49%
52%
37%
45%
58%
64%
39%
48%
37%
38%
47%
57%
42%
45%
37%
38%
47%
57%
14%
18%
11%
13%
20%
19%
Female
Male
Boomers: 54+
Gen X: 38-53
Millennials: 24-37
Gen Z: 18-23
Tech support scam incidence by age &
gender
Pop-up ad or window Unsolicited email
Redirect to website Unsolicited call
New item in 2018
New item in 2018
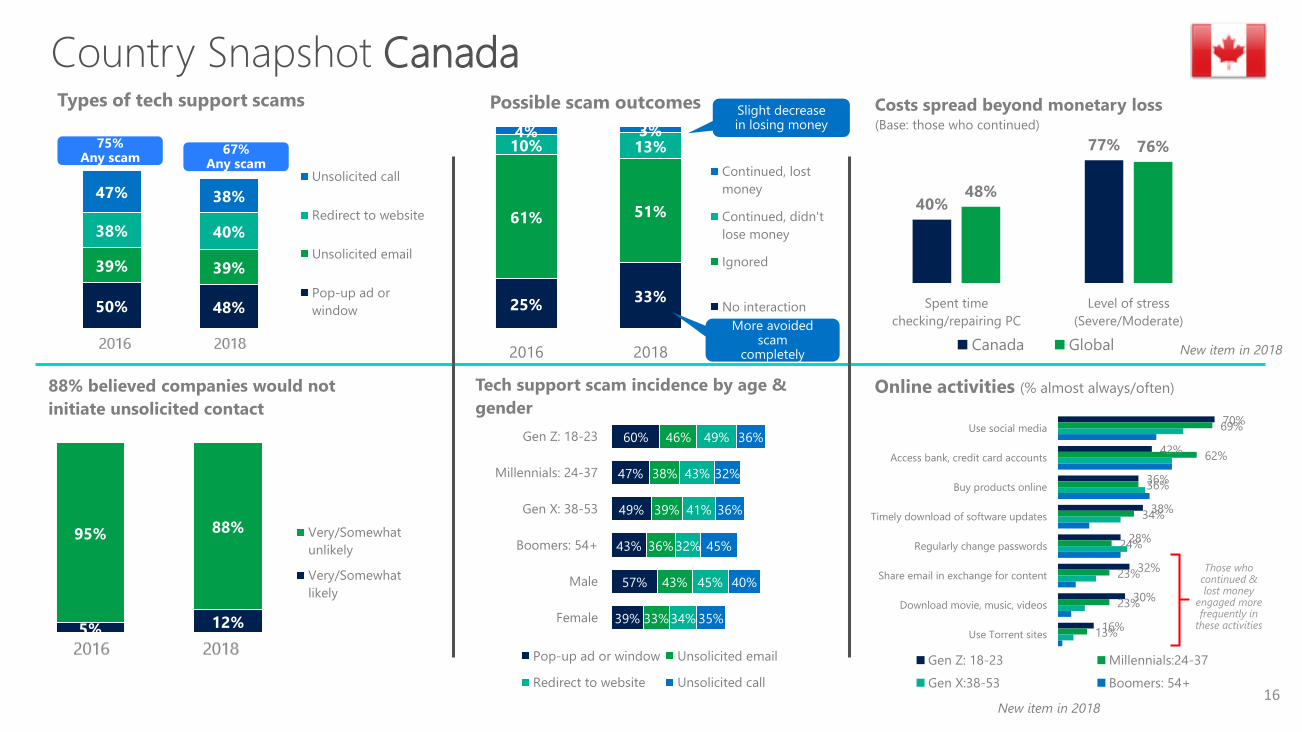
16
33%25%
51%61%
13%10%3%4%
20182016
Possible scam outcomes
Continued, lost
money
Continued, didn't
lose money
Ignored
No interaction
Country Snapshot Canada
70%
42%
36%
38%
28%
32%
30%
16%
69%
62%
36%
34%
24%
23%
23%
13%
Use social media
Access bank, credit card accounts
Buy products online
Timely download of software updates
Regularly change passwords
Share email in exchange for content
Download movie, music, videos
Use Torrent sites
Online activities (% almost always/often)
Gen Z: 18-23 Millennials:24-37
Gen X:38-53 Boomers: 54+
Those who continued & lost money
engaged more frequently in
these activities
50% 48%
39% 39%
38% 40%
47% 38%
Types of tech support scams
Unsolicited call
Redirect to website
Unsolicited email
Pop-up ad or
window
Slight decrease in losing money
More avoided scam
completely
40%
77%
48%
76%
Spent time
checking/repairing PC
Level of stress
(Severe/Moderate)
Costs spread beyond monetary loss (Base: those who continued)
Canada Global
12%5%
88%95%
88% believed companies would not
initiate unsolicited contact
Very/Somewhat
unlikely
Very/Somewhat
likely
60%
47%
49%
43%
57%
39%
46%
38%
39%
36%
43%
33%
49%
43%
41%
32%
45%
34%
36%
32%
36%
45%
40%
35%
Gen Z: 18-23
Millennials: 24-37
Gen X: 38-53
Boomers: 54+
Male
Female
Tech support scam incidence by age &
gender
Pop-up ad or window Unsolicited email
Redirect to website Unsolicited call
New item in 2018
New item in 2018

17
57%45%
19%
20%
15%19%
9%16%
20182016
Possible scam outcomes
Continued, lost
money
Continued, didn't
lose money
Ignored
No interaction
Country Snapshot China
56%
16%
35%
51%
12%
15%
52%
15%
60%
36%
33%
55%
20%
19%
42%
17%
Use social media
Access bank/credit card site
Download latest updates
Buy products online
Change passwords regularly
Share email in exchange for content
Download movies, tv shows, music,
videos
Use torrent sites
Online activities (% almost always/often)
Gen Z:18-23 Millennials: 24-37
Gen X: 38-53 Boomers: 54+
Those who continued & lost money engaged
more frequently in
these activities
42% 32%
28%21%
27%
20%
20%
15%
2016 2018
Types of tech support scams
Unsolicited call
Redirect to website
Unsolicited email
Pop-up ad or
window
Fewer lost money
More avoided scam
completely
71%77%
52%
76%
Spent time
checking/repairing PC
Level of stress
(Severe/Moderate)
Costs spread beyond monetary loss (Base: those who continued)
China Global
28% 31%
72% 69%
Most believed companies would not
initiate unsolicited contact
Very/Somewhat
unlikely
Very/Somewhat
likely
36%
40%
29%
21%
37%
27%
19%
31%
18%
11%
23%
19%
22%
28%
19%
10%
20%
21%
20%
22%
12%
9%
15%
16%
Gen Z: 18-23
Millennials: 24-37
Gen X: 38-53
Boomers: 54+
Male
Female
Tech support scam incidence by age &
gender
Pop-up ad or window
Unsolicited email
Redirect to website
New item in 2018
New item in 2018

18
32%37%
52%57%
9%7%4%
20182016
Possible scam outcomes
Continued, lost
money
Continued, didn't
lose money
Ignored
No interaction
Country Snapshot Denmark
73%
49%
39%
33%
24%
25%
31%
16%
62%
43%
43%
29%
23%
24%
23%
15%
Use social media
Access bank/credit card site
Download latest updates
Buy products online
Change passwords regularly
Share email in exchange for content
Download movies, tv shows, music,
videos
Use torrent sites
Online activities (% almost always/often)
Gen Z:18-23 Millennials: 24-37
Gen X: 38-53 Boomers: 54+
Those who continued & lost money
engaged more frequently in
these activities
42% 43%
38% 44%
24%31%
27%
37%
2016 2018
Types of tech support scams
Unsolicited call
Redirect to website
Unsolicited email
Pop-up ad or
window
More lostmoney
Fewer avoided scam
completely
56%67%
52%
76%
Spent time
checking/repairing PC
Level of stress
(Severe/Moderate)
Costs spread beyond monetary loss (Base: those who continued)
Denmark Global
16%8%
84%92%
Most believed companies would not
initiate unsolicited contact
Very/Somewhat
unlikely
Very/Somewhat
likely
56%
52%
43%
30%
48%
37%
43%
51%
49%
34%
49%
39%
43%
42%
29%
21%
38%
24%
31%
39%
36%
38%
41%
34%
Gen Z: 18-23
Millennials: 24-37
Gen X: 38-53
Boomers: 54+
Male
Female
Tech support scam incidence by age &
gender
Pop-up ad or window
Unsolicited email
Redirect to website
New item in 2018
New item in 2018

19
41%43%
44%51%
11%4%4%
20182016
Possible scam outcomes
Continued, lost
money
Continued, didn't
lose money
Ignored
No interaction
Country Snapshot France
70%
55%
52%
43%
24%
40%
22%
13%
68%
63%
37%
47%
26%
33%
20%
14%
Use social media
Access bank/credit card site
Download latest updates
Buy products online
Change passwords regularly
Share email in exchange for content
Download movies, tv shows, music,
videos
Use torrent sites
Online activities (% almost always/often)
Gen Z:18-23 Millennials: 24-37
Gen X: 38-53 Boomers: 54+
Those who continued & lost money
engaged more frequently in
these activities
43% 45%
37% 34%
29% 33%
17% 17%
Types of tech support scams
Unsolicited call
Redirect to website
Unsolicited email
Pop-up ad or
window
48%
78%
52%
76%
Spent time
checking/repairing PC
Level of stress
(Severe/Moderate)
Costs spread beyond monetary loss (Base: those who continued)
France Global
12%4%
88%96%
Most believed companies would not
initiate unsolicited contact
Very/Somewhat
unlikely
Very/Somewhat
likely
58%
49%
44%
40%
53%
37%
35%
38%
32%
32%
38%
30%
52%
38%
28%
29%
37%
29%
25%
19%
13%
15%
19%
15%
Gen Z: 18-23
Millennials: 24-37
Gen X: 38-53
Boomers: 54+
Male
Female
Tech support scam incidence by age &
gender
Pop-up ad or window
Unsolicited email
Redirect to website
New item in 2018
New item in 2018

20
48%49%
39%44%
8%4% 4%3%
20182016
Possible scam outcomes
Continued, lost
money
Continued, didn't
lose money
Ignored
No interaction
Country Snapshot Germany
65%
27%
31%
37%
22%
34%
18%
13%
54%
36%
41%
47%
24%
22%
15%
14%
Use social media
Access bank, credit card accounts
Buy products online
Timely download of software updates
Regularly change passwords
Share email in exchange for content
Download movie, music, videos
Use Torrent sites
Online activities (% almost always/often)
Gen Z:18-23 Millennials: 24-37
Gen X: 38-53 Boomers: 54+
Those who continued & lost money
engaged more frequently in
these activities
32% 34%
35% 34%
23% 26%
12%16%
Types of tech support scams
Unsolicited call
Redirect to website
Unsolicited email
Pop-up ad or
window
Slight increase in
losing money
48%
80%
52%
76%
Spent time
checking/repairing PC
Level of stress
(Severe/Moderate)
Costs spread beyond monetary loss (Base: those who continued)
Germany Global
11%8%
89%92%
Most believed companies would not
initiate unsolicited contact
Very/Somewhat
unlikely
Very/Somewhat
likely
53%
44%
31%
24%
40%
27%
38%
39%
34%
30%
41%
28%
48%
30%
23%
20%
32%
20%
24%
16%
16%
14%
21%
11%
Gen Z: 18-23
Millennials: 24-37
Gen X: 38-53
Boomers: 54+
Male
Female
Tech support scam incidence by age &
gender
Pop-up ad or window
Unsolicited email
Redirect to website
New item in 2018
New item in 2018

21
32%20%
28%
26%
26%
32%
14%22%
20182016
Possible scam outcomes
Continued, lost
money
Continued, didn't
lose money
Ignored
No interaction
Country Snapshot India
75%
43%
48%
58%
43%
40%
57%
32%
78%
59%
48%
60%
48%
46%
54%
28%
Use social media
Access bank, credit card accounts
Buy products online
Timely download of software updates
Regularly change passwords
Share email in exchange for content
Download movie, music, videos
Use Torrent sites
Online activities (% almost always/often)
Gen Z:18-23 Millennials: 24-37
Gen X: 38-53 Boomers: 54+
Those who continued & lost money
engaged more frequently in
these activities
63% 56%
49%44%
56%48%
30%
24%
Types of tech support scams
Unsolicited call
Redirect to website
Unsolicited email
Pop-up ad or
window
Fewer lost money
More avoided scam
completely
71%
84%
52%
76%
Spent time
checking/repairing PC
Level of stress
(Severe/Moderate)
Costs spread beyond monetary loss (Base: those who continued)
India Global
32%38%
68%62%
Most believed companies would not
initiate unsolicited contact
Very/Somewhat
unlikely
Very/Somewhat
likely
60%
64%
54%
37%
57%
54%
42%
53%
41%
33%
49%
40%
60%
56%
41%
35%
50%
46%
23%
29%
20%
18%
23%
23%
Gen Z: 18-23
Millennials: 24-37
Gen X: 38-53
Boomers: 54+
Male
Female
Tech support scam incidence by age &
gender
Pop-up ad or window
Unsolicited email
Redirect to website
New item in 2018
New item in 2018

22
65%
37%
29%
43%
5%
13%
2%6%
JapanGlobal
Possible scam outcomes
Continued, lost
money
Continued, didn't
lose money
Ignored
No interaction
Country Snapshot Japan
61%
13%
37%
28%
12%
24%
19%
16%
53%
29%
36%
46%
14%
29%
21%
16%
Use social media
Access bank/credit card site
Download latest updates
Buy products online
Change passwords regularly
Share email in exchange for content
Download movies, music, videos
Use torrent sites
Online activities (% almost always/often)
Gen Z: 18-23 Millennials:24-37
Gen X:38-53 Boomers: 54+
Those who continued & lost money
engaged more frequently in
these activities
44%30%
37%
18%
36%
19%
27%
27%
Global Japan
Types of tech support scams
Unsolicited call
Redirect to website
Unsolicited email
Pop-up ad or
window
Fewer lost money
More avoided scam
completely
52%
76%
40%
80%
Spent time
checking/repairing PC
Level of stress
(Severe/Moderate)
Costs spread beyond monetary loss (Base: those who continued)
Global Japan
17% 10%
83% 90%
Most believed companies would not
initiate unsolicited contact
Very/Somewhat
unlikely
Very/Somewhat
likely
18%
34%
34%
26%
34%
25%
13%
17%
20%
18%
22%
14%
14%
23%
22%
15%
25%
13%
6%
9%
6%
6%
10%
4%
Gen Z: 18-23
Millennials: 24-37
Gen X: 38-53
Boomers: 54+
Male
Female
Tech support scam incidence by age &
gender
Pop-up ad or window Unsolicited email
Redirect to website Unsolicited call
New item in 2018
New item in 2018

23
27%37%
46%43%
19%14%
8%6%
MexicoGlobal
Possible scam outcomes
Continued, lost
money
Continued, didn't
lose money
Ignored
No interaction
Country Snapshot Mexico
82%
33%
30%
36%
34%
35%
13%
16%
81%
44%
37%
36%
34%
32%
14%
16%
Use social media
Access bank/credit card site
Download latest updates
Buy products online
Change passwords regularly
Share email in exchange for content
Download movies, music, videos
Use torrent sites
Online activities (% almost always/often)
Gen Z: 18-23 Millennials:24-37
Gen X:38-53 Boomers: 54+
Those who continued & lost money
engaged more frequently in
these activities
More lost money
Fewer avoided scam
completely
52%
76%70%
78%
Spent time
checking/repairing PC
Level of stress
(Severe/Moderate)
Costs spread beyond monetary loss (Base: those who continued)
Global Mexico
17% 19%
83% 81%
Global Mexico
Most believed companies would not
initiate unsolicited contact
Very/Somewhat
unlikely
Very/Somewhat
likely
67%
68%
58%
43%
66%
54%
34%
50%
45%
30%
51%
33%
62%
60%
52%
34%
58%
48%
19%
22%
16%
12%
22%
14%
Gen Z: 18-23
Millennials: 24-37
Gen X: 38-53
Boomers: 54+
Male
Female
Tech support scam incidence by age &
gender
Pop-up ad or window Unsolicited email
Redirect to website Unsolicited call
New item in 2018
New item in 2018
44%62%
37%
42%36%
53%27%
22%
Global Mexico
Types of tech support scams
Unsolicited call
Redirect to website
Unsolicited email
Pop-up ad or
window
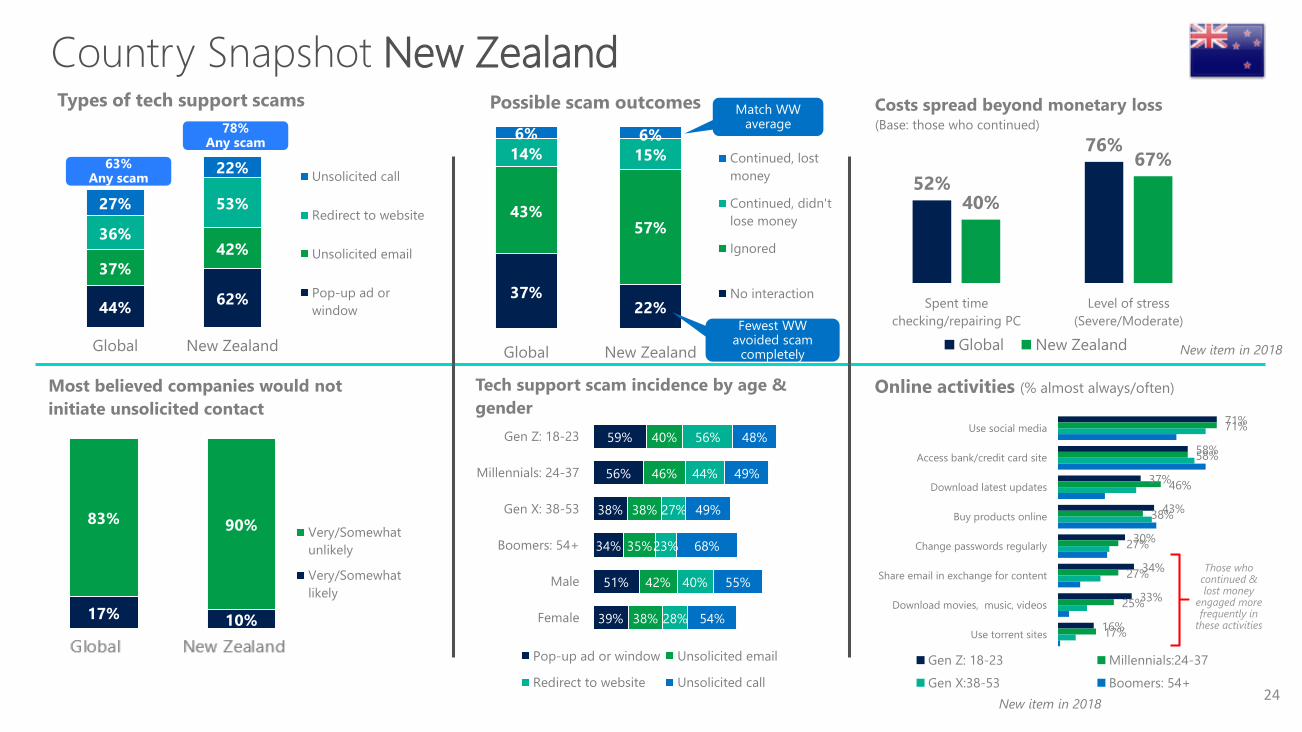
24
22%37%
57%43%
15%14%
6%6%
New ZealandGlobal
Possible scam outcomes
Continued, lost
money
Continued, didn't
lose money
Ignored
No interaction
Country Snapshot New Zealand
71%
58%
37%
43%
30%
34%
33%
16%
71%
58%
46%
38%
27%
27%
25%
17%
Use social media
Access bank/credit card site
Download latest updates
Buy products online
Change passwords regularly
Share email in exchange for content
Download movies, music, videos
Use torrent sites
Online activities (% almost always/often)
Gen Z: 18-23 Millennials:24-37
Gen X:38-53 Boomers: 54+
Those who continued & lost money
engaged more frequently in
these activities
Match WW average
Fewest WW avoided scam
completely
52%
76%
40%
67%
Spent time
checking/repairing PC
Level of stress
(Severe/Moderate)
Costs spread beyond monetary loss (Base: those who continued)
Global New Zealand
17% 10%
83% 90%
Global New Zealand
Most believed companies would not
initiate unsolicited contact
Very/Somewhat
unlikely
Very/Somewhat
likely
59%
56%
38%
34%
51%
39%
40%
46%
38%
35%
42%
38%
56%
44%
27%
23%
40%
28%
48%
49%
49%
68%
55%
54%
Gen Z: 18-23
Millennials: 24-37
Gen X: 38-53
Boomers: 54+
Male
Female
Tech support scam incidence by age &
gender
Pop-up ad or window Unsolicited email
Redirect to website Unsolicited call
New item in 2018
New item in 2018
44%62%
37%
42%36%
53%27%
22%
Global New Zealand
Types of tech support scams
Unsolicited call
Redirect to website
Unsolicited email
Pop-up ad or
window

25
43%35%
42%46%
11%12%
4%7%
20182016
Possible scam outcomes
Continued, lost
money
Continued, didn't
lose money
Ignored
No interaction
Country Snapshot Singapore
78%
52%
31%
32%
19%
31%
32%
11%
71%
58%
35%
39%
19%
26%
22%
9%
Use social media
Access bank, credit card accounts
Buy products online
Timely download of software updates
Regularly change passwords
Share email in exchange for content
Download movie, music, videos
Use Torrent sites
Online activities (% almost always/often)
Gen Z: 18-23 Millennials:24-37
Gen X:38-53 Boomers: 54+
Those who continued & lost money
engaged more frequently in
these activities
52% 43%
43%35%
40%
37%
24%
20%
Types of tech support scams
Unsolicited call
Redirect to website
Unsolicited email
Pop-up ad or
window
Fewer lost money
More avoided scam
completely
50%
81%
52%
76%
Spent time
checking/repairing PC
Level of stress
(Severe/Moderate)
Costs spread beyond monetary loss (Base: those who continued)
Singapore Global
16%16%
84%84%
Most believed companies would not
initiate unsolicited contact
Very/Somewhat
unlikely
Very/Somewhat
likely
45%
48%
46%
28%
46%
41%
27%
43%
35%
24%
40%
30%
43%
41%
36%
23%
40%
33%
18%
21%
23%
12%
24%
15%
Gen Z: 18-23
Millennials: 24-37
Gen X: 38-53
Boomers: 54+
Male
Female
Tech support scam incidence by age &
gender
Pop-up ad or window Unsolicited email
Redirect to website Unsolicited call
New item in 2018
New item in 2018
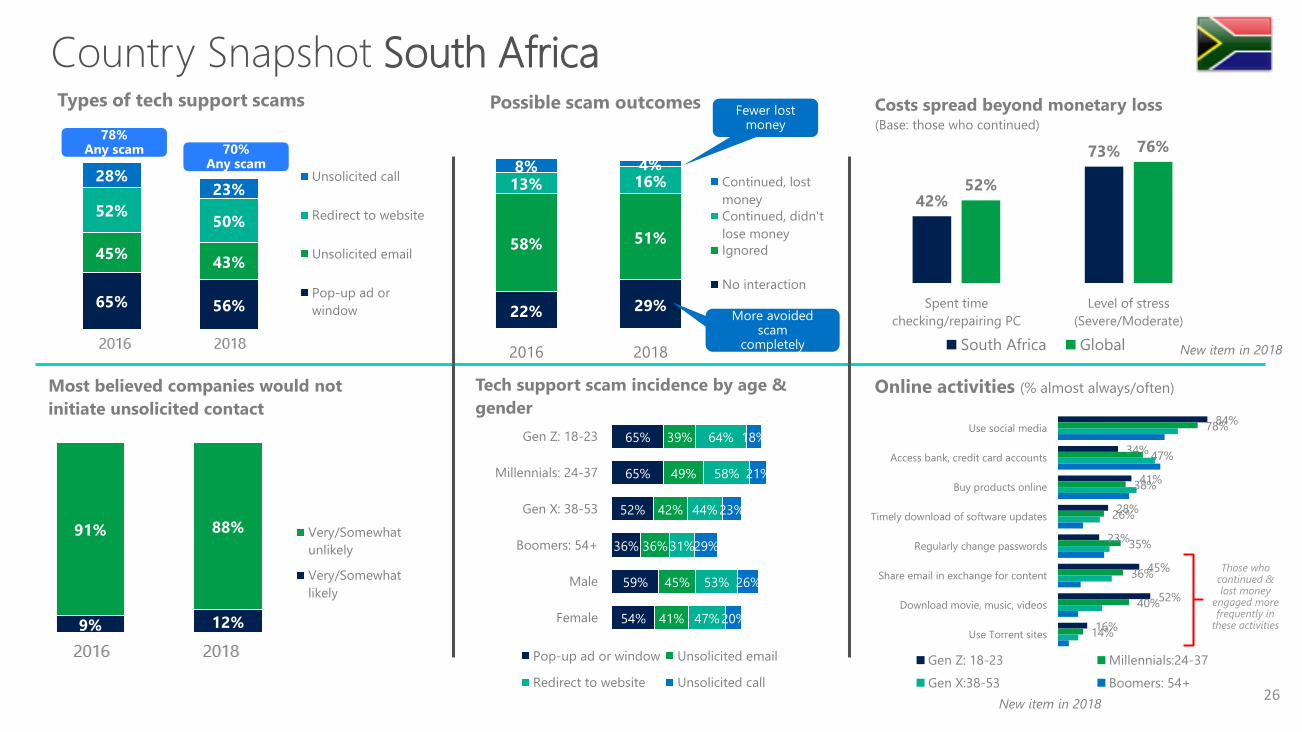
26
22% 29%
58% 51%
13% 16%8% 4%
2016 2018
Possible scam outcomes
Continued, lost
money
Continued, didn't
lose money
Ignored
No interaction
Country Snapshot South Africa
84%
34%
41%
28%
23%
45%
52%
16%
78%
47%
38%
26%
35%
36%
40%
14%
Use social media
Access bank, credit card accounts
Buy products online
Timely download of software updates
Regularly change passwords
Share email in exchange for content
Download movie, music, videos
Use Torrent sites
Online activities (% almost always/often)
Gen Z: 18-23 Millennials:24-37
Gen X:38-53 Boomers: 54+
Those who continued & lost money
engaged more frequently in
these activities
65% 56%
45%43%
52%50%
28%23%
Types of tech support scams
Unsolicited call
Redirect to website
Unsolicited email
Pop-up ad or
window
Fewer lost money
More avoided scam
completely
42%
73%
52%
76%
Spent time
checking/repairing PC
Level of stress
(Severe/Moderate)
Costs spread beyond monetary loss (Base: those who continued)
South Africa Global
12%9%
88%91%
Most believed companies would not
initiate unsolicited contact
Very/Somewhat
unlikely
Very/Somewhat
likely
65%
65%
52%
36%
59%
54%
39%
49%
42%
36%
45%
41%
64%
58%
44%
31%
53%
47%
18%
21%
23%
29%
26%
20%
Gen Z: 18-23
Millennials: 24-37
Gen X: 38-53
Boomers: 54+
Male
Female
Tech support scam incidence by age &
gender
Pop-up ad or window Unsolicited email
Redirect to website Unsolicited call
New item in 2018
New item in 2018
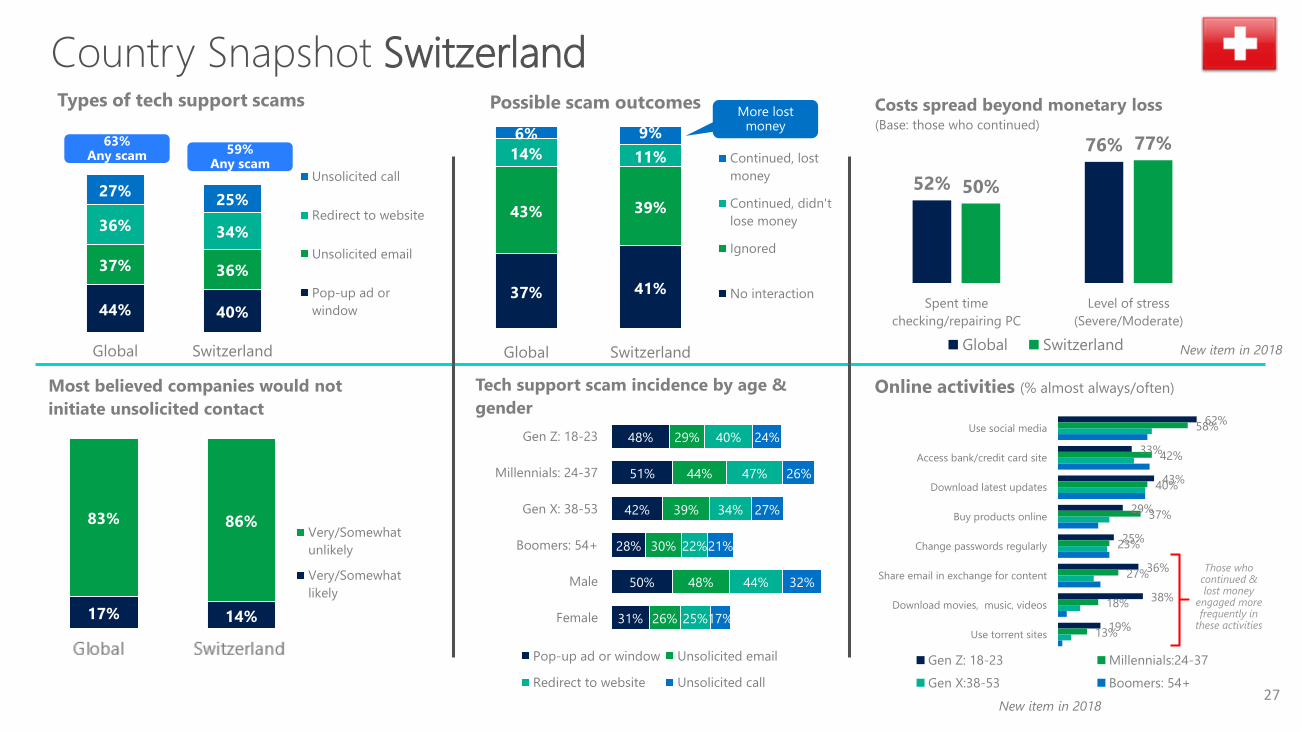
27
41%37%
39%43%
11%14%
9%6%
SwitzerlandGlobal
Possible scam outcomes
Continued, lost
money
Continued, didn't
lose money
Ignored
No interaction
Country Snapshot Switzerland
62%
33%
43%
29%
25%
36%
38%
19%
58%
42%
40%
37%
23%
27%
18%
13%
Use social media
Access bank/credit card site
Download latest updates
Buy products online
Change passwords regularly
Share email in exchange for content
Download movies, music, videos
Use torrent sites
Online activities (% almost always/often)
Gen Z: 18-23 Millennials:24-37
Gen X:38-53 Boomers: 54+
Those who continued & lost money
engaged more frequently in
these activities
44% 40%
37% 36%
36% 34%
27%25%
Global Switzerland
Types of tech support scams
Unsolicited call
Redirect to website
Unsolicited email
Pop-up ad or
window
More lost money
52%
76%
50%
77%
Spent time
checking/repairing PC
Level of stress
(Severe/Moderate)
Costs spread beyond monetary loss (Base: those who continued)
Global Switzerland
17% 14%
83% 86%
Global Switzerland
Most believed companies would not
initiate unsolicited contact
Very/Somewhat
unlikely
Very/Somewhat
likely
48%
51%
42%
28%
50%
31%
29%
44%
39%
30%
48%
26%
40%
47%
34%
22%
44%
25%
24%
26%
27%
21%
32%
17%
Gen Z: 18-23
Millennials: 24-37
Gen X: 38-53
Boomers: 54+
Male
Female
Tech support scam incidence by age &
gender
Pop-up ad or window Unsolicited email
Redirect to website Unsolicited call
New item in 2018
New item in 2018

28
38%31%
46%59%
11%8%
6%2%
20182016
Possible scam outcomes
Continued, lost
money
Continued, didn't
lose money
Ignored
No interaction
Country Snapshot United Kingdom
73%
50%
41%
48%
27%
27%
34%
15%
75%
60%
43%
50%
34%
31%
26%
13%
Use social media
Access bank, credit card accounts
Buy products online
Timely download of software updates
Regularly change passwords
Share email in exchange for content
Download movie, music, videos
Use Torrent sites
Online activities (% almost always/often)
Gen Z: 18-23 Millennials:24-37
Gen X:38-53 Boomers: 54+
Those who continued & lost money
engaged more frequently in
these activities
38% 36%
31% 36%
25% 30%
46% 40%
2016 2018
Types of tech support scams
Unsolicited call
Redirect to website
Unsolicited email
Pop-up ad or
window
More lost money
More avoided scam
completely
40%
66%
48%
76%
Spent time
checking/repairing PC
Level of stress
(Severe/Moderate)
Costs spread beyond monetary loss (Base: those who continued)
United Kingdom Global
12%3%
88%97%
Most believed companies would not
initiate unsolicited contact
Very/Somewhat
unlikely
Very/Somewhat
likely
51%
40%
36%
26%
40%
32%
40%
42%
35%
29%
40%
31%
48%
36%
25%
24%
32%
27%
31%
36%
36%
53%
43%
38%
Gen Z: 18-23
Millennials: 24-37
Gen X: 38-53
Boomers: 54+
Male
Female
Tech support scam incidence by age &
gender
Pop-up ad or window Unsolicited email
Redirect to website Unsolicited call
New item in 2018
New item in 2018

29
33%21%
49%
46%
11%
12%
6%21%
20182016
Possible scam outcomes
Continued, lost
money
Continued, didn't
lose money
Ignored
No interaction
Country Snapshot United States
74%
37%
35%
27%
31%
30%
29%
14%
68%
53%
38%
42%
31%
27%
25%
13%
Use social media
Access bank, credit card accounts
Buy products online
Timely download of software updates
Regularly change passwords
Share email in exchange for content
Download movie, music, videos
Use Torrent sites
Online activities (% almost always/often)
Gen Z: 18-23 Millennials:24-37
Gen X:38-53 Boomers: 54+
Those who continued & lost money
engaged more frequently in
these activities
60% 50%
48%37%
48%
41%
42%
40%
Types of tech support scams
Unsolicited call
Redirect to website
Unsolicited email
Pop-up ad or
window
Fewer lost money
More avoided scam
completely
43%
75%
52%
76%
Spent time
checking/repairing PC
Level of stress
(Severe/Moderate)
Costs spread beyond monetary loss (Base: those who continued)
United States Global
13%26%
87%74%
Most believed companies would not
initiate unsolicited contact
Very/Somewhat
unlikely
Very/Somewhat
likely
46%
48%
53%
52%
54%
47%
33%
38%
36%
40%
42%
32%
46%
41%
41%
40%
44%
38%
33%
34%
37%
50%
44%
36%
Gen Z: 18-23
Millennials: 24-37
Gen X: 38-53
Boomers: 54+
Male
Female
Tech support scam incidence by age &
gender
Pop-up ad or window Unsolicited email
Redirect to website Unsolicited call
New item in 2018
New item in 2018

30
37%37%
46%43%
11%14%
5%6%
EMEAGlobal
Possible scam outcomes
Continued, lost
money
Continued, didn't
lose money
Ignored
No interaction
Regional Snapshot: EMEA (France, Germany, Denmark, South Africa, Switzerland, United Kingdom)
72%
41%
41%
36%
24%
35%
34%
15%
67%
49%
40%
38%
28%
30%
25%
13%
Use social media
Access bank/credit card site
Download latest updates
Buy products online
Change passwords regularly
Share email in exchange for content
Download movies, music, videos
Use torrent sites
Online activities (% almost always/often)
Gen Z: 18-23 Millennials:24-37
Gen X:38-53 Boomers: 54+
Those who continued & lost money
engaged more frequently in
these activities
44% 42%
37% 38%
36% 34%
27% 26%
Global EMEA
Types of tech support scams
Unsolicited call
Redirect to website
Unsolicited email
Pop-up ad or
window
52%
76%
51%
74%
Spent time
checking/repairing PC
Level of stress
(Severe/Moderate)
Costs spread beyond monetary loss (Base: those who continued)
Global EMEA
17% 13%
83% 87%
Global EMEA
Most believed companies would not
initiate unsolicited contact
Very/Somewhat
unlikely
Very/Somewhat
likely
56%
52%
41%
30%
48%
36%
38%
44%
38%
31%
43%
32%
51%
43%
30%
24%
40%
29%
25%
26%
25%
28%
30%
22%
Gen Z: 18-23
Millennials: 24-37
Gen X: 38-53
Boomers: 54+
Male
Female
Tech support scam incidence by age &
gender
Pop-up ad or window Unsolicited email
Redirect to website Unsolicited call
New item in 2018
New item in 2018

31
41%37%
38%43%
14%14%
7%6%
APACGlobal
Possible scam outcomes
Continued, lost
money
Continued, didn't
lose money
Ignored
No interaction
Regional Snapshot: APAC (Australia, China, India, Japan, New Zealand, Singapore)
69%
39%
38%
40%
24%
28%
38%
18%
67%
51%
38%
48%
27%
29%
32%
17%
Use social media
Access bank/credit card site
Download latest updates
Buy products online
Change passwords regularly
Share email in exchange for content
Download movies, music, videos
Use torrent sites
Online activities (% almost always/often)
Gen Z: 18-23 Millennials:24-37
Gen X:38-53 Boomers: 54+
Those who continued & lost money
engaged more frequently in
these activities
44% 41%
37% 33%
36%32%
27%28%
Global APAC
Types of tech support scams
Unsolicited call
Redirect to website
Unsolicited email
Pop-up ad or
window
52%
76%
48%
77%
Spent time
checking/repairing PC
Level of stress
(Severe/Moderate)
Costs spread beyond monetary loss (Base: those who continued)
Global APAC
17% 18%
83% 82%
Global APAC
Most believed companies would not
initiate unsolicited contact
Very/Somewhat
unlikely
Very/Somewhat
likely
46%
50%
39%
30%
46%
37%
30%
40%
31%
27%
37%
29%
42%
41%
29%
21%
36%
28%
25%
28%
24%
32%
29%
26%
Gen Z: 18-23
Millennials: 24-37
Gen X: 38-53
Boomers: 54+
Male
Female
Tech support scam incidence by age &
gender
Pop-up ad or window Unsolicited email
Redirect to website Unsolicited call
New item in 2018
New item in 2018

© 2018 Microsoft Corporation. All rights reserved. This material is provided for informational purposes only. Microsoft makes no warranties, express or implied.
32