Embed Size (px)
Citation preview

All authors are affiliated with the Environmental and Production Technology Division of the International Food Policy Research Institute 2033 K Street NW, Washington, DC 20006. Email contact: [email protected] *presenting author
Global Scenarios for Biofuels: Impacts And Implications For Food Security And Water Use
Siwa Msangi
Timothy Sulser*
Mark Rosegrant
Rowena Valmonte-Santos
Paper presented at the Tenth Annual Conference on Global Economic Analysis special session on “CGE Modeling of Climate, Land Use, and Water: Challenges and
Applications”
Purdue University, West Lafayette, Indiana
7-9 June 2007
Keywords: Biofuels, Agricultural Policy, Energy Policy
Biofuels and Global Food Balance Msangi et al.
2
Abstract
In recent years, bioenergy has drawn attention as a sustainable energy source that may help cope with rising energy prices, but also maybe provide income to poor farmers and rural communities around the globe. Rising fuel prices, growing energy demand, concerns over global warming from GHG emissions and increased openness to renewable energy resources, domestic energy security, and the push for expansion into new markets for crops in the face of world trade outlooks are all factors driving interest in expanding bioenergy use. Despite keen interest in this sector, there are currently few players in this field: In 2005, Brazil and the United States together accounted for 99 percent of global ethanol production, whereas Germany and France accounted for 69 percent of global biodiesel production. However, developing countries with tropical climates may have a comparative advantage in growing energy-rich biomass; and second-generation technologies could enable expansion of the range of feedstock used from the traditional sugarcane, maize, and rapeseed to grasses and trees that can thrive in less fertile and more drought-prone regions. Potentially adverse impacts from a rapid bioenergy expansion include upward pressure on international food prices, making staple crops less affordable for poor consumers; potentially significant adverse impacts on both land (soil quality and fertility) and water resources; and on biodiversity and ecosystems, in general. Given the numerous and high level of uncertainties regarding future biofuel supply, demand, and technologies, the paper examines three alternative scenarios: a conventional scenario, which focuses on rapid global growth in biofuel production under conventional conversion technologies; a second generation scenario, which incorporates a ‘softening’ of demand on food crops due to 2nd generation, ligno-cellulosic technologies coming online; and a ‘second generation plus scenario’, which adds crop productivity improvements to the second generation scenario, which essentially further reduce potentially adverse impacts from expansion of biofuels. Results from the analysis show a potential food and water-versus-fuel tradeoff if innovations and technology investments in crop productivity are slow, and if reliance is placed solely on conventional feedstock conversion technologies to meet future blending requirements (or displacement) of fossil fuels with biofuels. This situation changes considerably with increased investments in biofuel conversion and crop productivity improvements. To mitigate potentially adverse impacts from aggressive increases in biofuel production therefore requires a renewed focus of crop breeding for productivity improvement in wheat, maize and even sugar crops. While some crops may be more favorable from the perspective of profitability, they may encounter binding environmental constraints, in particular water, for example, for sugarcane in India, and wheat or maize in Northern China. And even where water might be available, other natural resource constraints, such as land availability can constrain expansion, such as in Southern China. Impacts of global biofuel development and growth on rural poor can be both positive and negative. Biofuel crops do not necessarily crowd out food crops, at least not under the alternative scenarios examined here. Instead there is room for complementarities and synergy and rural

Biofuels and Global Food Balance Msangi et al.
3
agricultural development and socioeconomic growth can go hand-in-hand with enhancement of bioenergy production capacity.

Biofuels and Global Food Balance Msangi et al.
4
We can get fuel from fruit, from that shrub by the roadside, or from apples,
weeds, saw-dust—almost anything! There is fuel in every bit of vegetable matter
that can be fermented. There is enough alcohol in one year’s yield of a hectare of
potatoes to drive the machinery necessary to cultivate the field for a hundred
years. And it remains for someone to find out how this fuel can be produced
commercially—better fuel at a cheaper price than we know now.
~ Henry Ford, 1925
1. Introduction
Rising world fuel prices, the growing demand for energy, and concerns about global warming are
the key factors driving renewed interest in renewable energy sources and in bioenergy, in
particular. Henry Ford’s seemingly prescient outlook is thus becoming much more relevant 80
years on. Within a global context, fossil fuel consumption still dominates the world energy
market (Figure 1). However, the uncertainty in future supply, potentially unsustainable patterns
of energy consumption, and the costs of expanding proven reserves of fossil fuels have lead
many energy analysts and managers around the world to seek alternatives from other more
renewable resources, such as bioenergy. The steadily increasing trend of gasoline prices over
time (Figure 2) strengthens the rationale for seeking cheaper supply alternatives. Biofuels
already constitute the major source of energy for over half of the world’s population, accounting
for more than 90% of the energy consumption in poor developing countries (FAO 2005a).
Besides alleviating the reliance of energy-driven economies on limited fossil fuel sources,
bioenergy has continued to receive increasing attention from those concerned with promoting
agricultural and environmental sustainability through the reduction of carbon emissions, an
important component of climate change mitigation. Bioenergy is also considered by some to be a
potentially significant contributor towards the economic development of rural areas, and a means
of reducing poverty through the creation of employment and incomes – and biofuel development
is directly or indirectly linked with multiple Millennium Development Goals (FAO 2005b;
Kammen 2006). Thus, bioenergy is seen, more and more, as a promising and largely untapped

Biofuels and Global Food Balance Msangi et al.
5
renewable energy resource, and its potential environmental and economic benefits are becoming
more apparent as technological improvements continue to emerge.
Large amount of biomass from forest and agricultural activities such as branches, tree tops,
straw, corn stover and bagasse from sugar cane can be utilized as feedstock for bioenergy.
Likewise, bioethanol and biodiesel can be produced from sugar, grain, and other oil crops. In
parts of the world, animal dung is processed as fuel while effluents are digested to produce
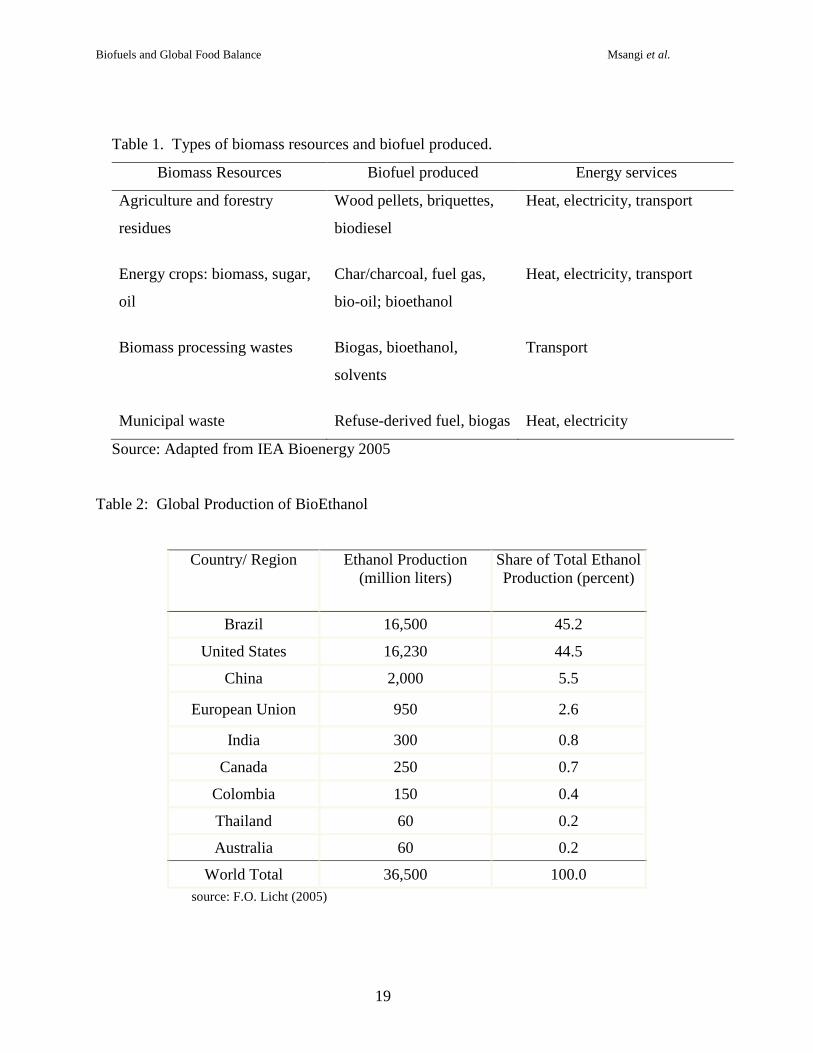
biogas (IEA Bioenergy 2005). Table 1 shows typical types of biofuel generated together with the
energy services they supply using a number of biomass resources.
The development of commercial bioenergy production dates back to the use of maize for ethanol,
and has seen consistent growth in a few countries. Ethanol is produced from maize in the Unite
States, India, and China, for example. Moreover, in Brazil 50% of all sugarcane produced out of
357.5 million tons in 2003-2004 was devoted to ethanol (Szwarc 2004). Globally, bioethanol
production is concentrated in two countries, Brazil and the United States (Table 2).
Biodiesel production, on the other hand, is geographically concentrated in the EU – with
Germany and France leading production (Table 3). The production processes used to
manufacture biodiesel from its feedstock sources differs from that used for bioethanol, as it relies
on trans-esterification of oils, whereas bioethanol production relies on the hydrolysis of the
constituent grains and sugars of plants into ethanol, under conventional technologies
(Worldwatch 2006).
Despite the apparent success of bioenergy production in these countries, other countries have
been reluctant to take a more aggressive approach towards bioenergy development, due to the
existence of institutional, financial or political constraints. Several factors could contribute
towards this hesitancy to adopt these technologies. They include a) a lack of understanding,
among policymakers, of the potential benefits; b) the neglect of biofuel within the national
political, economic, and social agendas, thereby preventing its integration into energy statistics
and national energy planning; c) the prevailing regulatory, institutional and legal restrictions that
discourage the development of biomass energy; d) the inattention of forestry and agricultural

Biofuels and Global Food Balance Msangi et al.
6
agencies towards the development, management and use of biomass energy resources; and e) the
lack of policy attention paid to the introduction and distribution of modern, efficient and clean
bioenergy production system (FAO, 2003).
Some policymakers have also voiced concerns that aggressive growth in bioenergy production
could “crowd out” the production of food crops in some developing countries that try to adopt it,
in order to substitute for the import of increasingly expensive fossil fuels (Graham-Harrison
2005).
In this paper, we investigate the interaction of biofuel demand with the demand and production
of food and feed crops, to examine potential impacts on food prices, trade, and food security. The
analysis does not only focus on the United States, Brazil and China – which, nevertheless,
account for the global share of energy demand increase, but takes on a global approach to future
bioenergy uses.
2. Scenario analysis
Over the next several decades, the most certain increase in demand for biofuels is going to focus
on displacing liquid fuels for transport, mostly in the form of ethanol which currently supplies
over 95% of the biofuels for transportation (Fulton et al., 2004). At present, the most efficient
production of ethanol is based on dedicated energy crops, such as sugarcane and maize. At the
same time, these dedicated ethanol crops will likely have the greatest impact on food supply and
demand systems. This is particularly true if the production occurs on prime agricultural lands as
is likely given the need to reduce transportation costs of both the feedstocks and fuel products to
and from larger, centralized ethanol production facilities.
The projected demand for transportation fuel is shown in Figure 3, where we see very high and
rapidly increasing demand for countries like China. These projections are based on projections of
energy demand obtained from the energy outlooks given by the International Energy Association
(2004) as well as outlooks given in the agricultural baseline projections of the USDA (2006).
Biofuels and Global Food Balance Msangi et al.
7
On the basis of these projected demands, we estimate fossil-based fuel displacement (with
biofuels), in order to obtain projections of biofuels used for transportation uses (Figure 4). The
expected rate of blending or displacement of fossil-based fuels with biofuels was obtained (for
major biofuel-producing countries) from projections by the International Energy Association
(IEA) Bioenergy Task 40 group, for Brazil to 2010 and 2015, and by the targets for biofuel
production currently being considered in China (Liu 2006). We also use the USDA’s
Agricultural Baseline projections for fuel alcohol use from maize in the USA (USDA 2006) in
our model quantification. For those countries with no published data on future fuel displacement,
we assumed a rate of displacement that corresponds to 10 percent displacement by 2010, 15
percent by 2015 and 20 percent by 2020. This constitutes a fairly aggressive rate of biofuel
production growth, but allows us to see the ‘upper bound’ impacts that would occur if biofuel
adoption were to be undertaken in earnest, in response to global energy price trends. No growth
in biodiesel production was assumed outside of the European Union, since those countries
currently dominate global production (Table 3), and do so with the help of agricultural support
policies that would be hard for other emerging producers to follow suit and adopt in a likewise
fashion, within the current WTO trade regime.
In order to examine the potential impact of biofuel production growth on country-level and
domestic agricultural markets, we use a partial-equilibrium modeling framework that can capture
the interactions between agricultural commodity supply and demand, as well as trade, at the
global level. In doing so, we are able to simulate the resulting growth in demand for the
agricultural crop feedstocks that biofuel production relies on, while also tracking the demand for
food and feed for those same agricultural crops.
The model used for this analysis is the International Model for Policy Analysis of Agricultural
Commodities and Trade (IMPACT), which has been used by the International Food Policy
Research Institute (IFPRI) for projecting global food supply, food demand and food security to
2020 and beyond (Rosegrant et al. 2001). The model contains three categories of commodity
demand – food, feed and other use demand. The ‘other use’ demand category is expanded in this
study to reflect the utilization of a particular commodity as biofuel feedstock. The utilization
level is determined by the projected level of biofuel production for the particular commodity in

Biofuels and Global Food Balance Msangi et al.
8
question By converting the target levels of ethanol production into the necessary tonnage of
maize, sugarcane or other crop feedstock, we can shift the levels of ‘other demand’ appropriately
to reflect the increased utilization of these commodities as biofuel feedstock. The conversion
rates used are 400 liters of ethanol for every 1 ton of maize, and 80 liters of ethanol for every 1
ton of sugarcane. These rates are in line with a variety of sources, including Bullock (2002),
Durante and Miltenberg (2004), Fulton et al. (2004), Giampietro and Ulgiati (2005), Moriera
(2000), and Walter et al. (2006).
Drawing on projections for biofuel demand for the relevant countries and regions, we construct
three alternative scenarios:
1. Conventional scenario (aggressive biofuel growth with no crop productivity change).
This scenario assumes very rapid growth in demand for bioethanol across all regions and
for biodiesel in Europe, together with continued high oil prices, and rapid breakthroughs
in biofuel technology to support expansion of supply to meet the growth in energy
demand – but holding projected productivity increases for yields at baseline projection
levels. The “aggressive” biofuel scenario contains the biofuel demand projections
described previously, and shown in Figure 4. For bioethanol we consider maize,
sugarcane, sugarbeet, and wheat as feedstock crops, whereas we consider oilseed crops
and soybean for biodiesel.
2. 2nd Generation scenario (or cellulosic biofuel scenario). In this scenario, second-
generation cellulosic conversion technologies come on line for large-scale production by
2015. In this case, we hold the volume of biofuel feedstock demand constant starting in
2015, in order to represent the relaxation in the demand for food-based feedstock crops
created by the rise of the new technologies that convert nonfood grasses and forest
products. Crop productivity changes are still held to baseline levels.
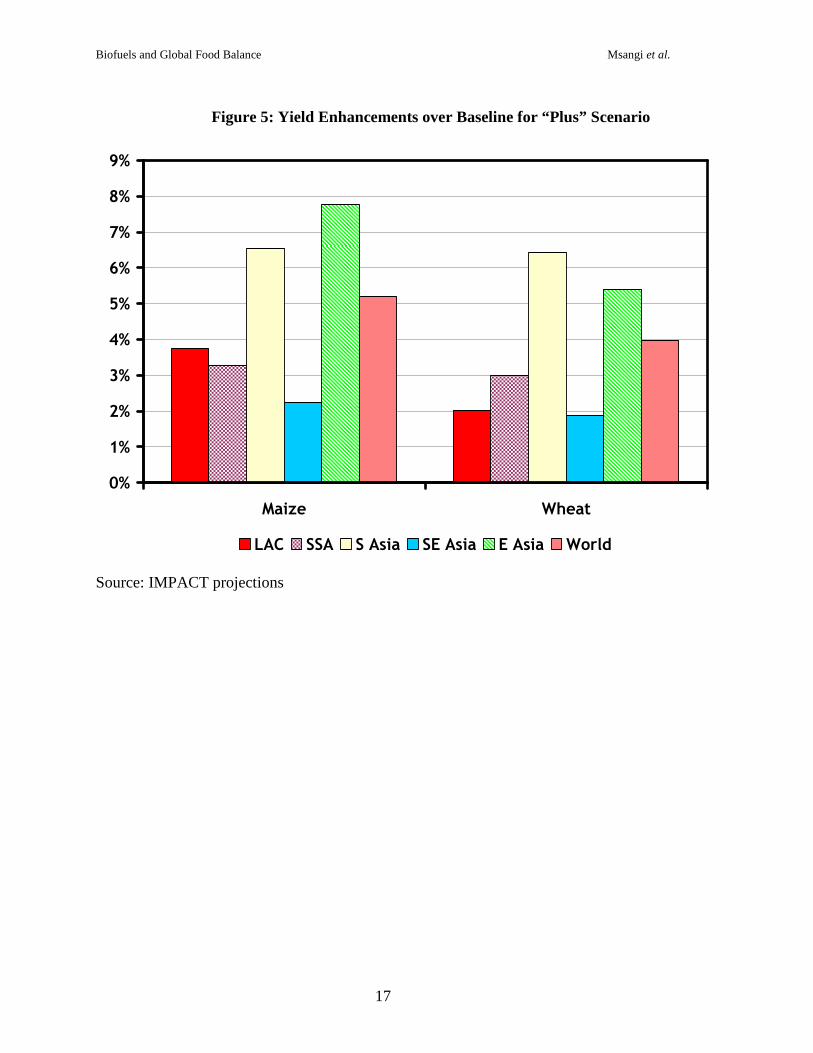
3. 2nd Generation Plus scenario (aggressive’ biofuel growth scenario with productivity
change and cellulosic conversion). This scenario considers, in addition to second-
generation technologies, the effect of crop technology investments that would lead to
Biofuels and Global Food Balance Msangi et al.
9
increased productivity over time, in order to better support the expansion of feedstock
supply in response to biofuel demand growth. Productivity improvements are in line with
other projections studies relating the benefits of increased agricultural investment policies
with agricultural productivity growth (see, for example, Rosegrant et al. 2005;
SEARCA/IFPRI/CRESCENT 2003). Here, emphasis is given to agricultural productivity
growth in Sub-Saharan Africa. The ‘boost’ that is given to crop productivity growth,
under this scenario, is shown in Figure 5.
On the basis of these scenarios, we solve the model such that the commodity demands are
modified to reflect the feedstock requirements for the projected bioenergy production levels in
these countries after 2005. The resulting long-run market equilibria are compared to baseline
model projections (without biofuels), and are reported in the next section of the paper, along with
impacts on calorie availability and childhood malnutrition levels.
3. Discussion of Results and Policy Implications
The first, “conventional”, aggressive biofuel growth scenario shows dramatic increases in world
prices for feedstock crops by 2020 (Figure 6). The highest price impacts are seen for oil crops, as
well as for sugar crops, followed by staple crops. Part of this differential is due to the relative
‘thickness’ of markets: markets for staple grains are larger in volume and geographic scale. The
relative productivity of irrigated and rainfed grains and sugar crops, compared to mostly rainfed
oilseed crops, also contributes to the relative price increases seen in Figure 6. Thus, such a
scenario entails large profits for net producers of the bioenergy crop. Thus, such a scenario
would entail subsidies for the biofuel sector, who would be net consumers of the feedstock crop,
in order to keep bioethanol production from that feed source on a competitive level. These kind
of supports for biofuel producers already exist for many countries (e.g. within the EU), and could
be in the form of tax concessions at the pump or producer credits. The high price increases for
oilseed crops suggest that the relatively low-yielding oil crops will have to make up fairly high
shares of total production in order to meet the oil-displacement trends embedded in the
“aggressive bioenergy growth” scenario.
Biofuels and Global Food Balance Msangi et al.
10
By contrast, the second or 2nd Generation scenario, which simulates the impact of cellulosic
technologies, shows a considerable softening of upward price pressures, especially for oil crops,
and underlies the potential importance of such technical innovations at the industry-level. We do
not introduce improvements in conversion efficiency for non-cellulosic processes, as these
technologies have been in use for some time, and show little room for improvement, based on
studies cited in the literature (Worldwatch, 2006).
The third scenario, finally, illustrates the importance of crop technology innovation at the farm
production level, and shows a further softening of price impacts. This third scenario, in
particular, shows how investments within both the biofuel industry and the agricultural sector,
itself, can be combined to produce more favorable outcomes, which can partially mitigate
adverse consumer-level impacts. Among the three scenarios examined, this scenario seems to
present the most plausible outcomes of all three scenarios, as neither national governments nor
fuel producers would want to engage in a large-scale expansion of production without the
necessary investments being in place to ensure reliable supply of feedstock material at
reasonable cost, both for producers as well as for consumers of food and feed commodities.
While we have not modeled the mechanisms by which feedstocks might be substituted in and out
of biofuel production, according to their competitiveness with long-term fossil-fuel prices and
each other, we have shown an illustrative set of results (for a ‘fixed’ menu of inputs) which argue
strongly for preparatory investments in both the agricultural sector, as well as within the fuel
industry itself.
4. Summary and Conclusions
In our analysis, the results show a “food-versus-fuel” tradeoff in cases where innovations and
technology investments are largely absent and where policies aimed at efficiency enhancement
within the sector are not undertaken. Such a bleak picture is already considerably changed when
biofuel and crop production technology advancements are taken into account. While there is
some uncertainty as to the timing of eventual large-scale use of cellulosic conversion
technologies for biofuel production, the potential benefits to developing-country employment,
Biofuels and Global Food Balance Msangi et al.
11
and soil and water conservation are well-recognized in the literature, and make a strong case for
further research in that area.
Our solutions suggest that the cost of biofuels could be considerably higher than the projected
price of oil so there would need to be compelling non-price factors for its uptake at the
aggressive levels assumed, particularly in first scenario. Indeed, there might be factors favoring
the decision to adopt biofuel production that might not be captured within a strict quantitative
comparison of biofuel versus fossil fuel costs, including concerns of national energy security or
positive externalities to the environment. Notwithstanding, we maintain the argument that if
developing economies are to participate beneficially in the growth of renewable bioenergy
production, and to also maintain adequate levels of food security, a complementary set of
aggressive investments are necessary. Such investments could bring about benefits for
consumers of both food and energy, while also contributing to the broader growth of their
economies and improved livelihoods.
While this paper does not directly address water-related implications of increased bioenergy crop
production, there is no doubt that while some crops may be more favorable from the perspective
of profitability, they will encounter binding environmental constraints, in particular water, for
example, for sugarcane in India, and wheat or maize in Northern China. And even where water
might be available, other natural resource constraints, such as land availability can constrain
expansion, such as in Southern China. Both constraints will be binding in Sub-Saharan Africa,
unless these crops are developed together with aggressive irrigation investment, and large-scale
soil-fertility improvements, including increased levels of fertilizer applications.

Biofuels and Global Food Balance Msangi et al.
12
5. References
Bullock, GE. 2002. Ethanol from sugarcane. Sugar Research Institute.
http://www.zeachem.com/pubs/Ethanol%20from%20Sugarcane.pdf
Durante, D. and M. Miltenberger. 2004. Issue Brief: Net Energy Balance of Ethanol
Production, Publication of Ethanol Across America
http://www.ethanolacrossamerica.net/04CFDC-003_IssueBrief.pdf
FAO 2005a. Bioenergy. Sustainable Development Department, FAO, Rome, Italy.
http://www.fao.org/sd/dim_en2/en2_050402_en.htm, accessed on April 11, 2006
FAO 2005b. Bioenergy and the Millennium Development Goals. Forestry Department, FAO,
Rome, Italy. http://www.fao.org/forestry/energy, accessed on April 11, 2006
FAO 2003. FAO and Bioenergy. Forestry Department, FAO, Rome, Italy,
http://www.fao.org/forestry/energy, accessed on April 11, 2006
Licht, F.O. 2005. World Ethanol and Biofuels Report. vol 3., Tunbridge Wells, United Kingdom.
Fulton, L., T. Howes, and J. Hardy. 2004. Biofuels for Transport: An International Perspective.
International Energy Agency, Paris.
Giampietro, M. and S. Ulgiati. 2005. Integrated assessment of large scale biofuel production.
Critical Reviews in Plant Sciences 24:365-384.
Graham-Harrison, Emma. 2005. Food Security Worries Could Limit China Biofuels. Planet Ark
(Sept. 26th, 2005). http://www.planetark.com/dailynewsstory.cfm/newsid/32656/story.htm
accessed on June 12th 2006.
IEA Bioenergy 2005. Benefits of bioenergy. http://www.ieabioenergy.com accessed on May 2,
2006
International Energy Agency (IEA) 2004. World Energy Outlook 2004. OECD/IEA, Paris,
France.
Kammen, D. M. 2006. Bioenergy in developing countries: Experiences and prospects. In
Bioenergy and agriculture: Promises and challenges, eds. P. Hazell and R.K. Pachauri.
Washington, D.C.: IFPRI.
Liu, Y. 2006. China to Boost Bioenergy through Financial Incentives. China Watch (June 13th
2006). Worldwatch Institute, Washington, DC.
Biofuels and Global Food Balance Msangi et al.
13
http://www.worldwatch.org/node/44. accessed on June 12th 2006.
Moreira, J.R. 2000. Sugarcane for energy – recent results and progress in Brazil. Energy for
Sustainable Development IV (3): 43-54
Rosegrant, M.W., C. Ringler, T. Benson, X. Diao, D. Resnick, J. Thurlow, M. Torero, and D.
Orden. 2005. Agriculture and achieving the Millennium Development Goals. Washington,
D.C.: World Bank [Report No. 32729-GLB].
Rosegrant, M.W., X. Cai and S.A. Cline. 2002. World water and food to 2025: dealing with
scarcity. Joint publication of IFPRI, Washington DC, USA and International Water
Management Institute (IWMI), Sri Lanka
Rosegrant, M. W., M. Paisner, S. Meijer, and J. Witcover. 2001. Global Food Projections to
2020: Emerging Trends and Alternative Futures. Washington D.C., International Food Policy
Research Institute.
SEARCA/IFPRI/CRESCENT. 2003. Pro-poor Agricultural and Rural Development in Indonesia.
Public Policies, Investment, and Governance. Laguna, Philippines: SEARCA.
Szwarc, A. 2004. Use of biofuels in Brazil. A powerpoint presentation given during In-Session
Workshop on Mitigation, Buenos Aires, Argentina, December 9, 2004.
United States Department of Agriculture Interagency Agricultural Projections Committee
(USDA). 2006. USDA Agricultural Baseline Projections to 2015. Baseline Report OCE-
2006-1. Office of the Chief Economist, World Agricultural Outlook Board, U.S. Department
of Agriculture: Washington, DC.
Walter, A., P. Dolzan, and E. Piacente. 2006. Biomass Energy and Bio-energy Trade: Historic
Developments in Brazil and Current Opportunities. Country Report: Brazil – Task 40 –
Sustainable Bio-energy Trade, Securing Supply and Demand (Final Version). Brazilia,
International Energy Agency, Paris.
Worldwatch Institute. 2006. Biofuels for Transportation: Global Potential and Implications for
Sustainable Agriculture and Energy in the 21st Century. Extended Summary of Report for the
German Federal Ministry of Food Agriculture and Consumer Protection (BMELV).
Washington, DC.

Biofuels and Global Food Balance Msangi et al.
14
Figure 1: Share of different energy forms in global total primary energy
supply at 10,345 mtoe (million tons of oil equivalent), 2002.
Coal23%
Oil35%
Gas21%
Nuclear7% Hydro
2%
Biomass and waste11%
Other renewables1%
Renewables14%
Source: IEA 2004
Figure 2: Gasoline prices from 1960-1996.
Source: Moreira and Goldenberg 1999

Biofuels and Global Food Balance Msangi et al.
15
Figure 3: Projected Transportation Demand for Gasoline
(millions of tons oil equivalent – MTOE)
Source: author calculations
0
50
100
150
200
250
300
350
400
450
2005 2010 2015 2020 2025 2030
million tons oil equivalent
China
India
Brazil
USA
EU

Biofuels and Global Food Balance Msangi et al.
16
Figure 4: Simulated Total (Bioethanol + Biodiesel) Biofuel Production for Transport
(millions of tons oil equivalent)
Source: author calculations
0
20
40
60
80
100
120
2005 2010 2015 2020 2025 2030
million tons oil equivalent
China
India
Brazil
USA
EU
Biofuels and Global Food Balance Msangi et al.
17
Figure 5: Yield Enhancements over Baseline for “Plus” Scenario
Source: IMPACT projections
0%
1%
2%
3%
4%
5%
6%
7%
8%
9%
Maize Wheat
LAC SSA S Asia SE Asia E Asia World

Biofuels and Global Food Balance Msangi et al.
18
Figure 6: Changes in Global Commodity Prices from Baseline Across Scenarios in
2020
Source: IMPACT projections
41
29
23
76
45 43
66
49
43
30
2116
0
10
20
30
40
50
60
70
80
Conventional 2nd Generation 2nd Generation Plus
% difference from baseline
Maize Oilseeds Sugarcane Wheat
Biofuels and Global Food Balance Msangi et al.
19
Table 1. Types of biomass resources and biofuel produced.
Biomass Resources Biofuel produced Energy services
Agriculture and forestry
residues
Wood pellets, briquettes,
biodiesel
Heat, electricity, transport
Energy crops: biomass, sugar,
oil
Char/charcoal, fuel gas,
bio-oil; bioethanol
Heat, electricity, transport
Biomass processing wastes Biogas, bioethanol,
solvents
Transport
Municipal waste Refuse-derived fuel, biogas Heat, electricity
Source: Adapted from IEA Bioenergy 2005
Table 2: Global Production of BioEthanol
Country/ Region Ethanol Production (million liters)
Share of Total Ethanol Production (percent)
Brazil 16,500 45.2
United States 16,230 44.5
China 2,000 5.5
European Union 950 2.6
India 300 0.8
Canada 250 0.7
Colombia 150 0.4
Thailand 60 0.2
Australia 60 0.2
World Total 36,500 100.0 source: F.O. Licht (2005)

Biofuels and Global Food Balance Msangi et al.
20
Table 3: Global Production of BioDiesel
Country/ Region Biodiesel Production (million liters)
Share of Total Ethanol Production (percent)
Germany 1,921 54.5
France 511 14.5
Italy, Austria, Denmark, United Kingdom, Czech Republic, Poland,
Spain, Sweden
9 - 227 0.1 – 6.4
Europe Total 3,121 88.6
United States 290 8.2
Other 114 3.2
World Total 3,524 100.0 source: F.O. Licht (2005)