Embed Size (px)
Citation preview

1
Global Response Analysis of Wind Turbine Installation Vessels in Semi-submerged Condition.
A Modified Quasi-Static Approach
Ramón Elías Acevedo Ortega
Master Thesis
presented in partial fulfillment
of the requirements for the double degree:
“Advanced Master in Naval Architecture” conferred by University of Liege
"Master of Sciences in Applied Mechanics, specialization in Hydrodynamics,
Energetics and Propulsion” conferred by Ecole Centrale de Nantes
developed at West Pomeranian University of Technology, Szczecin
in the framework of the
“EMSHIP”
Erasmus Mundus Master Course
in “Integrated Advanced Ship Design”
Ref. 159652-1-2009-1-BE-ERA MUNDUS-EMMC
Supervisor:
Dr Maciej Taczała, West Pomeranian University of
Technology, Szczecin
Reviewer: Prof. Dario Boote, Universitá degli Studi di Genova
Szczecin, February 2016

P 2 Ramón Acevedo
Master Thesis developed at West Pomeranian University of Technology, Szczecin

Global Response Analysis of Wind Turbine Installation Vessels in Semi-submerged Condition. A
Modified Quasi-Static Approach
3
“EMSHIP” Erasmus Mundus Master Course, period of study September 2014 – February 2016
TABLE OF CONTENTS
ABSTRACT ............................................................................................................................. 13
1 INTRODUCTION ............................................................................................................ 15
1.1 The Problem .............................................................................................................. 15
1.2 Objective .................................................................................................................... 16
1.3 Scope of Work ........................................................................................................... 16
2 THE STUDY OF OFFSHORE WIND TURBINE INSTALLATION VESSELS .......... 19
2.1 Offshore Wind Turbine Industry ............................................................................... 19
2.2 Wind Turbine Installation Units ................................................................................ 20
2.3 The Global Response Analysis .................................................................................. 26
2.4 Loads Acting On WTIU ............................................................................................ 28
2.5 Rules and standards for WTIU Design ...................................................................... 32
2.6 Analysis Methods ...................................................................................................... 34
2.7 Static and Dynamic Structural Response ................................................................... 38
2.8 Problem Physics Discussion ...................................................................................... 45
3 STATE OF THE ART ...................................................................................................... 49
3.1 Reference review #1: A Parametric Study of the Non-Linear Dynamic Behavior of
an Offshore Jack-Up Unit .................................................................................................... 49
3.2 Reference review #2: Wave Load and Structural Analysis for a Jack-Up Platform in
Freak Waves ......................................................................................................................... 53
3.3 Reference review #3: Sea Loads on Ships and Offshore Structures ........................ 56
3.4 Notes and Comments Concerning WTIU Design ..................................................... 57
4 METHODOLOGY ........................................................................................................... 59
4.1 Global Response Analysis ......................................................................................... 59
4.2 Model Data ................................................................................................................ 62
4.3 Simulation Model ...................................................................................................... 69
4.4 Structural Model ........................................................................................................ 69
4.5 Hydrodynamic Model ................................................................................................ 87
4.6 Determining Dynamic Response. Data Post Processing ........................................... 92
5 CASES OF STUDY. GLOBAL RESPONSE OF WTIV IN FINITE WATER DEPTHS
DURING TRANSIENT PHASES. .......................................................................................... 95
5.1 Case 1. Quasi-Static vs Dynamic Response .............................................................. 95
5.2 Case 2. Semi-Submerged vs Elevated Condition .................................................... 104
5.3 Case 3. Effect of Wet Hull Area on Lateral and Vertical Loading. ........................ 111

P 4 Ramón Acevedo
Master Thesis developed at West Pomeranian University of Technology, Szczecin
6 CONCLUSIONS ............................................................................................................ 117
6.1 SUMMARY............................................................................................................. 117
6.2 Recommendations for Further Work ....................................................................... 120
7 REFERENCES ............................................................................................................... 123
AKNOWLEDGEMENT ........................................................................................................ 125

Global Response Analysis of Wind Turbine Installation Vessels in Semi-submerged Condition. A
Modified Quasi-Static Approach
5
“EMSHIP” Erasmus Mundus Master Course, period of study September 2014 – February 2016
LIST OF FIGURES
Figure 1. Types on Offshore Wind Turbines & application according to the water depth. ..... 21
Figure 2. Overview of a WTIU ................................................................................................ 22
Figure 3. WTIU components .................................................................................................... 23
Figure 4. Wind Turbine Installation in Elevated Condition. .................................................... 23
Figure 5. In-service WTIU ....................................................................................................... 25
Figure 6. Operation of WTIU ................................................................................................... 25
Figure 7. Environmental load effects during elevated condition. ............................................ 26
Figure 8. Methods for response analysis, DNV GL RP C104 Figure 4-4 ................................ 35
Figure 9. Dynamic effects corrected by hull displacements, Figure 4-7 taken from DNV GL
RP C104-4.4 ............................................................................................................................. 42
Figure 10. P-Δ effect by horizontal loads. Figure 4-9 of DNV RP-C104 ................................ 44
Figure 11. Typical Jack-up Unit and Plane Finite element model of a representative jack-up.
Fig 1 and 2 respectively. (M. Williams, 1999) ......................................................................... 50
Figure 12. Quasi-static displacements for a Wave Height of 13m. Fig 5 from (M. Williams,
1999) ......................................................................................................................................... 51
Figure 13. Variation of total rig loads for a wave height of 13m. Fig 6 from (M. Williams,
1999) ......................................................................................................................................... 51
Figure 14. Dynamic Maximum hull displacement for 13 m waves. Fig 8 (M. Williams, 1999)
.................................................................................................................................................. 52
Figure 15. Linear approximations to double DAF curves. Fig 12 (M. Williams, 1999) ......... 52
Figure 16. Comparative results of base shear for the 11.6m wave. Fig 13 (O. Moctar, 2009) 55
Figure 17. Comparative results of overturning moment for the 11.6m wave. Fig 17 (O.
Moctar, 2009) ........................................................................................................................... 55
Figure 18. Comparative results of base shear for the 23.7m wave. Fig 16 (O. Moctar, 2009) 55
Figure 19. Comparative results of overturning moment for the 23.7m wave. Fig 20 (O.
Moctar, 2009) ........................................................................................................................... 55
Figure 20. Time histories of base shear. Fig 9 (O. Moctar, 2009) ........................................... 55
Figure 21. Time histories of overturning moment. Fig 10 (O. Moctar, 2009) ......................... 55
Figure 22. Flowchart displaying input data, simulation model, sub-models an output
interaction. . .............................................................................................................................. 59
Figure 23. Flow-chart Global Response Analysis. ................................................................... 60
Figure 24. Continuation. Flow-chart Global Response Analysis ............................................. 61

P 6 Ramón Acevedo
Master Thesis developed at West Pomeranian University of Technology, Szczecin
Figure 25. Modeling of operational conditions in FE software. .............................................. 62
Figure 26. Variation of Vertical center of gravity for different for different WD. .................. 65
Figure 27. Variation of Ixx for different for different WD. ...................................................... 67
Figure 28. Variation of Iyy for different for different WD. ...................................................... 67
Figure 29. Global FE model build. Loading planes for incoming wave headings. 90 degrees
(middle figure) and 180 degrees (rightmost figure). ................................................................ 70
Figure 30. Hull shell and hull structure built. .......................................................................... 71
Figure 31. Modeled amidships section description. ................................................................. 71
Figure 32. Fore section. ............................................................................................................ 71
Figure 33. Example of plate and stiffener assemblies. Fig 2-5 DNV GL – CG – 0127 .......... 72
Figure 34. Equivalent stiffener modeling in transversal cross section view. ........................... 73
Figure 35. Stiffener modeling in longitudinal section view ..................................................... 73
Figure 36. Stiffener modeling in the fore part of the vessel. .................................................... 74
Figure 37. Typical leg-to-hull connection detailed leg model. Hull and jack house simplified
with beams. Fig 4-3 DNV GL – RP – C104. ........................................................................... 74
Figure 38. Contact between legs and guides. Fig 4-8 DNV GL RP – C104 ............................ 75
Figure 39. Contact between legs and guides. ........................................................................... 76
Figure 40. (a) Construction of the Leg-Hull connection with beam elements. ................... 76
Figure 41. Example of WTIV during transient phase and cargo on deck. ............................... 77
Figure 42. (a) Model of deck load in FE model; (b) Isometric view of model arrangement. .. 78
Figure 43. Leg boundary condition in beam element (at node) and final structural model of
WTIU ....................................................................................................................................... 79
Figure 44. FE Hull mesh build with 4-node shell elements. .................................................... 80
Figure 45. Principal structural element mesh build with 4-node shell elements. ..................... 80
Figure 46. From top to bottom of figure, transversal bulkhead, frame and longitudinal
bulkhead mesh. ......................................................................................................................... 81
Figure 47. Mesh arrangement. Primary and Secondary structural elements. ........................... 82
Figure 48. Jack House model mesh. ......................................................................................... 82
Figure 49. Graphical comparison of modal response for Semi-submerged and Elevated
condition ................................................................................................................................... 86
Figure 50. Wave Breaking Limit at Specific Water Depth ...................................................... 90
Figure 51. Hydrodynamic model components. ........................................................................ 92
Figure 52. Hydrodynamic model representation in HydroD Wadam. ..................................... 92
Figure 53. DAF for 180° incident waves. Semisubmerged. Case 1 ......................................... 97
Global Response Analysis of Wind Turbine Installation Vessels in Semi-submerged Condition. A
Modified Quasi-Static Approach
7
“EMSHIP” Erasmus Mundus Master Course, period of study September 2014 – February 2016
Figure 54. DAF for 90° incident waves. Semisubmerged. Case 1 ........................................... 97
Figure 55. Quasi-static and Dynamic Respoonse for design waves -Case 1. (a) Quasi-static
Base Shear; (b) Dynamic Base Shear; (c) Quasi-static Vertical Force; (d) Dynamic Vertical
Force; (e)Quasi-static Global Overturning Moment; (f) Dynamic Global Overturning
Moment. ................................................................................................................................... 98
Figure 56. Wave force cancelling representation. .................................................................... 99
Figure 57. Wave length – Ship length ratio for different Water depths. Head Seas .............. 101
Figure 58. Wave length – Ship Besm ratio for different Water depths. Beam Seas .............. 101
Figure 59. Hull motions by Quasi-static and Dynamic Response Case 1. (a) Quasi-static 180°
heading; (b) Dynamic 180° heading; (c) Quasi-static 90° heading; (d) Dynamic 90° heading.
................................................................................................................................................ 103
Figure 60. Total Base Shear – Case 2. (a) 180° heading; (b) 90° heading. ............................ 107
Figure 61. Global Overturning Moment – Case 2. (a) 180° heading; (b) 90° heading. ......... 108
Figure 62. Hull Surge and Sway motion – Case 2. (a) 180° heading; (b) 90° heading. ........ 109
Figure 63. DAF for 180° incident waves. Semisubmerged with different drafts. Case 3 ...... 113
Figure 64. DAF for 90° incident waves. Semisubmerged with different drafts. Case 3 ........ 114
Figure 65. DAF for 90° incident waves. Semisubmerged with different drafts. Case 3 ........ 115

P 8 Ramón Acevedo
Master Thesis developed at West Pomeranian University of Technology, Szczecin
Global Response Analysis of Wind Turbine Installation Vessels in Semi-submerged Condition. A
Modified Quasi-Static Approach
9
“EMSHIP” Erasmus Mundus Master Course, period of study September 2014 – February 2016
LIST OF TABLES
Table 1. Main particulars of WTIV. ......................................................................................... 50
Table 2. Loads considered for the load combination assessment. ........................................... 58
Table 3. Main particulars of WTIV. ......................................................................................... 63
Table 4. Location of center of gravity. ..................................................................................... 65
Table 5. Inertial Properties for different geometrical configurations at CM. .......................... 68
Table 6. Main moments of inertia measured at the sea bottom level. ...................................... 68
Table 7. Detailed and simplified model features comparison. ................................................. 83
Table 8. Structural natural periods for detailed and simplified model ..................................... 83
Table 9. Modal comparison between detailed and simplified models. .................................... 84
Table 10. Structure natural periods for different geometrical configurations. ......................... 85
Table 11. Environmental exposure limitations ........................................................................ 87
Table 12. Morison properties for Vessel Leg. Added mass and drag coefficients for
hydrodynamic calculations. ...................................................................................................... 90
Table 13. Input conditions. Design Parameters Case 1. ........................................................... 96
Table 14. Jack-up system geometrical features. Case 1. .......................................................... 96
Table 15. Max Base Shear Comparison. Case 1, Quasi-static vs dynamic. ............................. 99
Table 16. Wave length ratio with ship main geometric parameters. ...................................... 100
Table 17. Max Global Overturning Moment Comparison. Case 1, Quasi-static vs dynamic.
................................................................................................................................................ 102
Table 18. Max Hull motions for 180° incident waves. Case 1, Quasi-static vs dynamic. ..... 102
Table 19. Input conditions. Design Parameters Case 2. ......................................................... 104
Table 20. Jack-up system geometrical features. Case 1. ........................................................ 105
Table 21. Waves considered for Simulation Model. .............................................................. 105
Table 22. Summary of limits exceeded. Semi-sub. Vs Elevated. Case 2. .............................. 110
Table 23. Leg Preloading. Case 3. ......................................................................................... 111
Table 24. Changes of hull projected wet area. Case 3. .......................................................... 112
Table 25. Changes of Net Pressure and Net drift force. Case 3. ............................................ 112
Table 26. Changes of Net Vertical forces. Case 3. ................................................................ 113

P 10 Ramón Acevedo
Master Thesis developed at West Pomeranian University of Technology, Szczecin

Global Response Analysis of Wind Turbine Installation Vessels in Semi-submerged Condition. A
Modified Quasi-Static Approach
11
“EMSHIP” Erasmus Mundus Master Course, period of study September 2014 – February 2016
Declaration of Authorship
I declare that this thesis and the work presented in it are my own and have been generated by
me as the result of my own original research.
Where I have consulted the published work of others, this is always clearly attributed.
Where I have quoted from the work of others, the source is always given. With the exception of
such quotations, this thesis is entirely my own work.
I have acknowledged all main sources of help.
Where the thesis is based on work done by myself jointly with others, I have made clear exactly
what was done by others and what I have contributed myself.
This thesis contains no material that has been submitted previously, in whole or in part, for the
award of any other academic degree or diploma.
I cede copyright of the thesis in favor of the West Pomeranian University of Technology,
Szczecin.
Date: Signature

P 12 Ramón Acevedo
Master Thesis developed at West Pomeranian University of Technology, Szczecin

Global Response Analysis of Wind Turbine Installation Vessels in Semi-submerged Condition. A
Modified Quasi-Static Approach
13
“EMSHIP” Erasmus Mundus Master Course, period of study September 2014 – February 2016
ABSTRACT
Wind Turbine Installation Vessels (WTIV) have a significant importance for the installation
and maintenance of offshore wind farms. For a range of water depth, wind turbines will require
a fixed foundation which can be installed with a jack up vessel. Jack up leg and jacking system
design had been traditionally governed around consideration of the fully elevated condition,
called also as survival condition.
Industry, nonetheless, had seen various leg and jacking system damages happening in transient
phases (more often during semi-submerged condition) whether elevating or lowering legs for
installation or maintenance duties at the required locations. The semi-submerged condition is a
geometrical configuration where legs are attached to the seabed with a specific leg penetration
and with the hull partially immersed. During this condition the exposure to wave loads, current
loads, wind, and soil-leg interaction exposes the structure to high non-linear effects which
worsen with large hull drifts, structure flexibility and dynamic effects.
Such conditions are not commonly covered by class societies or well acknowledged by
designers. This transient phase is important for the vessel operation and depending on the
environmental conditions it will be possible to become the governing design load case for some
elements of the leg, jack up system, or other vessel components.
Knowing the global behave of the structure and the stress distribution during such conditions
will allow the preparation of better designs, so analysis should be dedicated and delicately
performed. To demonstrate the importance and risk associated, a study for the global response
of WTIV in semi-submerged condition is performed characterizing the global behave of the
structure and comparing it against the common design load case, the survival condition in
extreme response.
A simplified structural model of a WTIV is used. Subsequently a CFD Hydrodynamic analysis
coupled with a FE solver is performed to verify load increments during exposure to different
sea states in the conditions mentioned. The analysis proposed is a Deterministic Linear Quasi-
Static analysis where dynamic effects are modelled by modifying the FE model with additional
inertial loads acting on the hull center.
Inertial wave loads acting on the body are determined by Potential Flow Theory solving the
diffractive potential. Pressure distribution around the hull is calculated applying Panel Method
with direct numerical integration over the surface. Additionally, Morison formulation is used
to determine drag forces acting on the legs and later applied and solved on the FE model.
Current profile is modelled as a constant of 5 m/s along the sea bed, used for drag linearization.
Different geometrical configurations of the semi-submerged condition are investigated by
varying the water depth. The structure response is characterized: verifying the dynamic effects
of the structure for the semi-submerged condition, comparing the structure response against the
survival condition, varying the percentage of weight carried by the legs during the transient
phase. Cases are evaluated and reported where hull displacements, base shear, vertical forces
and overturning moment are reported for every case.
The study resulted in some interesting findings and discernments. It is uncovered that the
semisubmersible condition represents a high risk operational condition that should be
considered during the vessel design to reduce operational risk.

P 14 Ramón Acevedo
Master Thesis developed at West Pomeranian University of Technology, Szczecin
Global Response Analysis of Wind Turbine Installation Vessels in Semi-submerged Condition. A
Modified Quasi-Static Approach
15
“EMSHIP” Erasmus Mundus Master Course, period of study September 2014 – February 2016
1 INTRODUCTION
This document has the purpose to present the research project performed regarding the Global
Response Analysis of Wind Turbine Installation Units in semi-submerged condition. In this
chapter, a description of the problem being studied as well as the main aim and scope of the
study is given.
For a brief introduction to the subject, general information and other relevant for the study is
presented in the Chapter 3.
1.1 The Problem
Since structural assessment of wind turbine installation vessels during semi-submerged
condition are not commonly covered by class requirement or either well documented by
designers, and considering that the industry had seen numerous leg and jacking system damages
occurring in transient phases mainly during the semi-submerged condition, it is necessary to
study the global response of such units to guarantee safety during operation and to understand
and measure the risks that the industry may face.
Supposing a unit on a specific location for purposes of wind turbine equipment installation or
other similar operation. As a transient phase, legs are supported on the seabed and the hull is in
semi-jacked position, i.e. it remains partly submerged. There are two reasons why the unit is in
such condition. One is related to temporary phase during jacking-up of unit and second it is
related to units operation in limited soil bearing capacity condition.
This requires that when modeling, combined environmental and operational loads should be
within adequate design limits, established for such operation.
Wave induced loads on the hull are expected to be dominating when considering the global
response magnitudes, dependent also on the hull immersion level. This implies that special
attention should be given for wave induced load calculation.

P 16 Ramón Acevedo
Master Thesis developed at West Pomeranian University of Technology, Szczecin
1.2 Objective
The aim of the analysis is to verify these design limits against safety of the Unit during the
Semi-submerged condition and compared it against the common design load case for such
vessels called, survival or elevated condition.
The general purpose of the project is to find the best way of analyzing the semi-jacked condition
with application of a hydrodynamic software coupled with a FEM software. As secondary goal,
the global characterization of the structure behave under environmental loading in such
operational conditions is a matter of special concern. This is expected to be solved considering
the output from the analysis compelling the various loads acting on the unit's structure (mainly
in the hull and legs) such as:
Total resultant base shear force and vertical loads in the global model and in each leg.
Total overturning bending moment in the global model and in each leg.
Hull motions RAO’s.
1.3 Scope of Work
The study proposed in this document is a deterministic, modified linear quasi-static approach
for global dynamic response characterization. For this type of analysis, assumptions have been
taken for hydrodynamic load modelling, strength assessment and dynamic response
characterization. The scope of each of this activities are mentioning below.
Modelling of Hydrodynamic loads is divided in Inertial and drag load calculations. In case of
inertial load modelling for large bodies:
Inertial forces are determined using Potential flow in combination with diffractive wave
with direct numerical integration in frequency domain to determine the pressure
distribution on the hull surface.
First order velocity potential is used to determine the linear wave loads. I.e. non-linear
wave is not considered in this study so higher harmonics to the first order are neglected.
In the case of the drag force modelling for small bodies:

Global Response Analysis of Wind Turbine Installation Vessels in Semi-submerged Condition. A
Modified Quasi-Static Approach
17
“EMSHIP” Erasmus Mundus Master Course, period of study September 2014 – February 2016
Drag forces are determined using Morison formulation solved with the wave kinematics
determined with the diffractive potential. Drag coefficients are assumed for the leg cross
section considered.
Current loads are modeled considering a constant current velocity of 5 m/s for drag
linearization of the Morison equation. No current profile is considered.
Modelling of large bodies with considerable drag effect.
Under the presence of large bodies with non-negligible drag forces, inertial loads are
calculated by Potential flow Theory and separately Morison formulation is used to
determine drag forces on such bodies considering the characteristic length and wave
kinematics from the diffractive potential. I.e. superposition of both effects is applied to
determine the loads on such bodies to correct forces, damping and added mass matrices.
Strength calculation by FE method.
A Quasi-static structural analysis is used to solve the FE model.
To account the dynamic effects when significant (frequency encounter), P-Delta Effect
and Ship drift due to environmental loading, Dynamic Amplification Factors (DAF) are
used to determine the load increments when needed. Further explanation is found in the
points 2.7 and chapter 4 of this section.
Principal structural elements are modeled using 4-node shell elements. Longitudinal and
transversal bulkheads, girders and hull shell are modeled in such way.
Secondary structural elements are modeled with 2-node beam elements. Stiffeners and
leg-columns are modeled in this way.
Foundation models for soil-leg interaction are not considered. Instead, boundary
conditions in legs are assumed to be pinned with a leg penetration of 5 m. Soil stiffness
influence on dynamic response is determined varying the leg fixation coefficients.

P 18 Ramón Acevedo
Master Thesis developed at West Pomeranian University of Technology, Szczecin

Global Response Analysis of Wind Turbine Installation Vessels in Semi-submerged Condition. A
Modified Quasi-Static Approach
19
“EMSHIP” Erasmus Mundus Master Course, period of study September 2014 – February 2016
2 THE STUDY OF OFFSHORE WIND TURBINE INSTALLATION
VESSELS
2.1 Offshore Wind Turbine Industry
Relevant concepts for the understanding of the physical problem are explained in this chapter.
It is presented a brief introduction to the offshore wind turbine industry as well as an explanation
regarding to the type of turbines that can be installed and the vessels required for such activities.
Offshore industry represents nowadays one of the toughest activities that Engineers have been
dealing with since early years of 1940. The activities of this industrial sector primarily comprise
two industry variants known as offshore oil and gas industry and, the offshore wind energy
industry.
Offshore industry began with the purpose of meet the increasing energy demand, for which it
had been forced to grow faster and faster in the coming years. However this represents a
beneficial point for companies due to the rising cost of energy worldwide.
With the develop of the industry, issues had been perceived the last century concerning the
world contamination and climate changes accredited mainly to the oil and gas business. As a
possible alternative to decrease such worsening, wind energy appears as a really feasible
solution.
Today it is considered as one of the most well-known green energy sources, which is second
only after to the hydroelectric generation. Besides onshore wind energy is well developed, the
lack of open fields and their costs, and the need of certain weather conditions push the industry
on the search of better conditions for green energy production.
Here is when offshore wind farms rise up with operations growing rapidly the last years in all
over the world, but nowadays requirements for equipment are more demanding to guarantee a
bigger generation capacity. This means that bigger ships and platforms for wind turbine
installation and maintenance are required.

P 20 Ramón Acevedo
Master Thesis developed at West Pomeranian University of Technology, Szczecin
In the European context, the EU 2020 Goal indicates that the EU must get 20% of its energy
from renewables, reduce its greenhouse emissions by 20% and its energy consumption by 20%
by increase the energy efficiency.
Offshore wind operations will increase significantly up to the 2020 but safety during operation
must be guarantee, where one of key issues is the in-service stability. A typical solution for this
problem is to elevate the units above the water sea level.
Some equipment’s designed specifically to perform such kind of task are the called Wind
Turbine Installation Units (WTIU) and the thesis proposed in this document will study this type
of equipment operating in certain conditions.
2.2 Wind Turbine Installation Units
In this section main concepts required for the understanding of the work presented are given.
Explanation about equipment and their components, types of equipment’s, design conditions,
operational conditions and key aspects for wind turbine installation unit design are given.
2.2.1 Types of Offshore Wind Turbines
Offshore wind turbines are classified by the type of the foundation, which are fixed foundation
and floating foundation. The main factor that determines which type of foundation is the depth
of the sea bed where operations are interested to be developed. The different types of offshore
wind foundations are shown in the figure 1.
For the fixed foundation, the most common type is the monopile which is costless and easier
for installation, followed by tripod and jacket. Floating foundations are employed when water
depths increase significantly making fixed foundation not feasible in the structural and
economical point of view.
After foundation is located in de site of installation, the next stage corresponds to the assembling
of the turbine. Depending of the foundation of the wind turbine either jack up or semi
submerged wind turbine installation units (WTIU) can be used to perform such activity. Since

Global Response Analysis of Wind Turbine Installation Vessels in Semi-submerged Condition. A
Modified Quasi-Static Approach
21
“EMSHIP” Erasmus Mundus Master Course, period of study September 2014 – February 2016
the present document is focus on jack up installation units, further explanation is given just for
this WTIU.
Figure 1. Types on Offshore Wind Turbines & application according to the water depth.
http://www.rya.org.uk/SiteCollectionImages/environment/FloatingTurbineStructuresweb.jpg
2.2.2 Jack-Up Wind Turbine Installation Unit (WTIU)
A Jack up WTIU, is a self-elevating unit or jack-up vessel which dispose a hull with sufficient
buoyancy to transport the unit (turbine) to the desired location, and that is bottom founded in
its operation mode.
The unit reaches its operation mode by lowering the legs to the seabed and then jacking the hull
to the required elevation. This type of vessel is used for the turbine installations where water
depths are not bigger than 50 / 60 m.
The listed maximum operating water depth is a usually a nominal value as the actual limiting
depth for each deployment will depend upon the installed leg length, the leg penetration in the
sea bed, the minimum safe air gap and the required operating air gap. This can only be defined
by the site-specific assessment for each location and the results of the assessment will determine
whether installation and operation of the jack-up is feasible and whether any operating
constraints or weather restrictions will apply which might affect the efficiency of the operation.

P 22 Ramón Acevedo
Master Thesis developed at West Pomeranian University of Technology, Szczecin
The hull and its appendages: gives the buoyancy to the hull structure when other
condition different than installing operational condition.
Accommodation block and major deckhouses for vessel crew.
Helideck and support structure for helicopter landing (optional)
Main lifting equipment (Crane) and Crane pedestal for wind turbine component
handling and installation.
Figure 2. Overview of a WTIU
http://www.swireblueocean.com/files/pdf/sbo_technical_specs_may_2013.pdf
The components of WTIU can be mainly listed as follows:
Legs for structure vertical supporting during installing condition.
Footings/spudcans: inverted cones mounted at the base of the legs which provide
stability to lateral forces when WTIU is deployed into ocean-bed systems.
Jacking system: system used to raise the entire Hull/barge above the water to a
predetermined height leaving an "air gap" sufficient enough to guarantee waves, tidal
and current loading acts only on the legs and not on hull

Global Response Analysis of Wind Turbine Installation Vessels in Semi-submerged Condition. A
Modified Quasi-Static Approach
23
“EMSHIP” Erasmus Mundus Master Course, period of study September 2014 – February 2016
Figure 3. WTIU components
http://www.swireblueocean.com/files/pdf/sbo_technical_specs_may_2013.pdf
Figure 4. Wind Turbine Installation in Elevated Condition.
http://www.renewableuk.com/objects_store/offshore_wind_installation.jpg
2.2.3 Operational conditions of WTIU
Operating conditions are defined as the scenarios to which the WTIU may be exposed.
Depending of the reference, the definition of these scenarios may vary so it is recommended

P 24 Ramón Acevedo
Master Thesis developed at West Pomeranian University of Technology, Szczecin
when performing designing of such equipment, to consult how the operational conditions are
defined.
The following concepts regarding to operational conditions of WTIU are taken directly from
the standard DNV OS-C104 standard.
Installation condition: A condition during which a unit is lowering the legs and
elevating the hull. This is also known as Jacking-up condition
Operating conditions: Conditions wherein a unit is on location for purposes of drilling
lifting, or other similar operations, and combined environmental and operational
loadings are within the appropriate design limits established for such operations. The
unit is supported on the seabed.
Retrieval conditions: Conditions during which a unit is lowering the hull and elevating
the legs.
Semi-Jacked Condition: legs are supported on the seabed and the hull is in semi-jacked
position, i.e. it remains partly submerged. This may happen during jacking-up of unit
or when units operate in limited soil bearing capacity condition.
Survival conditions: Conditions wherein a unit is on location subjected to the most
severe environmental loadings for which the unit is designed. Drilling or similar
operations may have been discontinued due to the severity of the environmental
loadings. The unit is supported on the seabed.
Transportation or transit conditions: All unit movements from one geographical
location to another.
Field move: A wet transit that would require no more than a 12-hour voyage to a
location where the unit could be elevated, or to a protected location.
Ocean transit: A wet transit that would require more than a 12-hour voyage to a
location where the unit could be elevated, or to a protected location.
Dry transit: A transit where the unit is transported on a heavy lift unit.
Wet transit: A transit where the unit is floating during the move.
The operation of the WTIU can be described following the sequence presented below. Once the
unit arrives to the installation area, once equilibrium is reached in terms of hydrostatic, legs
starts to descend until they reach the sea bottom. At this point the legs go over the sea bottom
until a specific depth to guarantee the support of the unit is reached. Then vessel/platform will
start to rise until minimum air gap is guarantee for the operation.

Global Response Analysis of Wind Turbine Installation Vessels in Semi-submerged Condition. A
Modified Quasi-Static Approach
25
“EMSHIP” Erasmus Mundus Master Course, period of study September 2014 – February 2016
Figure 5. In-service WTIU
http://www.offshorewind.biz/tag/anholt/page/10/
http://www.kis-orca.eu/renewable-energy/wind-farms/installation-methods-
practices#.VYldQfmqqko
Figure 6. Operation of WTIU
http://www.modec.com/about/industry/oil_gas.html

P 26 Ramón Acevedo
Master Thesis developed at West Pomeranian University of Technology, Szczecin
2.3 The Global Response Analysis
A study aimed to determine how the various loads are distributed into the structure so motion
and structural behave can be determined. Depending of the operational condition, load
distribution will be different so special attention should be taken to identify the governing case
for the design.
An accurate structural analysis must include realistic models of the wave loading, the
geometrically non-linear behavior of the slender legs, and the complex non-linear response of
the spudcan footings to combined loads. The lateral flexibility is also pending on the moment
restraint at the connection between the leg footing and the soil foundations.
Figure 7. Environmental load effects during elevated condition.
http://www.modec.com/about/industry/oil_gas.html and http://maritime-
connector.com/wiki/offshore-industry/

Global Response Analysis of Wind Turbine Installation Vessels in Semi-submerged Condition. A
Modified Quasi-Static Approach
27
“EMSHIP” Erasmus Mundus Master Course, period of study September 2014 – February 2016
Because jack-up rigs are flexible, dynamic effects are significant. A dynamic analysis is
therefore required and, because of the numerous non-linear effects presented; this must be
carried out by direct integration of the equations of motion in the time domain and/or frequency
domain.
Since dynamic effects are significant and while the structure will typically be subjected to
higher non-linear effects caused by large hull sway and more dynamic actions due to higher
natural periods coinciding with or closer to the wave periods added to the flexibility of the
structure, global response analysis is an important, dedicated and delicate task to perform.
We are interested in determine the global response of the structure for different operational
conditions that are defined in the point 3.2.2. Main parameters of such type of analysis are:
Displacement of spudcans
Displacement of hull
Moment in leg base
Vertical and horizontal forces in legs
Multibody hydrodynamic, interaction and motion
The application of a Global Response Analysis implies the usage of methodologies to perform
the structural design. When the loads that are acting on the structure are defined, LRFD and
WSD methods are the most common used in the industry in combination with Finite Element
Methods (FEM). Now, methodologies for structural design are briefly explained below making
reference to the document DNV – OS C104 and C201 and DNV-RP C104 and C205.
LRFD: Load Resistance design factor method also known as limit state design method (LSD),
is a design methodology by which the target safety level is obtained as closely as possible by
applying load and resistance factors to characteristic reference values of the basic variables
defined as:
Loads acting on the structure
Resistance of the structure or resistance of materials in the structure.
Depending of the design considerations and regulations, limit states can be defined and
considered in the study of WTIU. Some of them are listed below considering DNV RP-C104
standard.

P 28 Ramón Acevedo
Master Thesis developed at West Pomeranian University of Technology, Szczecin
Ultimate Limit States (ULS) corresponding to the ultimate resistance for carrying loads
Fatigue Limit States (FLS) related to the possibility of failure due to the effect of cyclic
loading
Accidental Limit States (ALS) corresponding to damage to components due to an
accidental event or operational failure
WSD: means working stress design (WSD) method also known as the allowable stress method.
This method is based in obtain the component safety level by checking the strength usage
factors against permissible usage factors. Generally, the design of a structural system, its
components and details should account the following principles:
Resistance against relevant mechanical, physical and chemical deterioration is achieved
Fabrication and construction comply with relevant, recognized techniques and practice
Inspection, maintenance and repair are possible.
In the same way as the LRFD method, depending of the design considerations and regulations,
loading cases can be defined and some of them might slightly differ from one reference to
another. According to the DNV RP-C104, the load cases for this design methodology are:
Functional loads
Maximum combination of environmental loads and associated functional loads
Accidental loads and associated functional loads
Annual most probable value of environmental loads and associated functional loads
after credible failures or after accidental events
Annual most probable value of environmental loads and associated functional loads in
a heeled condition
2.4 Loads Acting On WTIU
Loads acting on the platform can be classified depending of their source, time of application
and effect on the structure (elastic or plastic behave of the structure). Following the DNV OS-
C104 standard as a reference, loads acting on WTIU can be classified as:
Permanent loads: loads that will not vary in magnitude, position, or direction during the
period considered and include:

Global Response Analysis of Wind Turbine Installation Vessels in Semi-submerged Condition. A
Modified Quasi-Static Approach
29
“EMSHIP” Erasmus Mundus Master Course, period of study September 2014 – February 2016
o Lightweight' of the unit, including mass of permanently installed modules and
equipment, such as accommodation, helicopter deck, drilling and production
equipment
o Permanent ballast
o Hydrostatic pressures resulting from buoyancy
o Pretension in respect to drilling and production systems (e.g. Risers, etc.).
Variable functional loads Variable functional loads are loads that may vary in
magnitude, position and direction during the period under consideration. This are the
main source of fatigue damage on the structure and some examples of such loads may
be:
o Drilling, production, and combinations
o Consumable re-supply procedures
o Maintenance procedures
o Possible mass re-distributions in extreme conditions
Accidental loads: it’s related to loads linked to accidents. In this way loads usually
considered during design stage are:
o Collision
o Dropped objects (e.g. From crane handling)
o Fire
o Explosion
o Unintended flooding during transit.
Deformation loads: loads caused by inflicted deformations, such as temperature loads,
built-in deformations, etc.
Environmental loads: are loads which may vary in magnitude, position and direction
during the period under consideration, and which are related to operations and normal
use of the installation. These are one the most important group of loads for the design
and this group is mainly characterized by
o Hydrodynamic loads induced by waves and current.
o Inertia forces.
o Wind loads.
o Earthquake.
o Tidal effects.
o Marine growth.

P 30 Ramón Acevedo
Master Thesis developed at West Pomeranian University of Technology, Szczecin
o Snow and ice.
o Combination of previous loads acting on supporting structures and lashing
systems for rigid units of cargo, equipment or other structural components.
Supposing that risks regarding to accidents are low and enough fatigue life of the structure is
given, the design of the structure may be governed by the combination of permanent and
variable loads and environmental loads. Since environmental loads are hard to define since is a
variable that cannot be controlled special considerations are taken to determine their effect on
structures.
Some considerations are mentioned in the document DNV OS-C101 standard regarding to how
environmental loads should be calculated. Some of the points that can be mentioned are the
following.
“The design of mobile offshore units shall be based on the most severe environmental
loads that the structure may experience during its design life. The applied environmental
conditions shall be defined in the design basis or design brief, and stated in the unit's
Operation Manual… The North Atlantic scatter diagram should be used in ULS, ALS
and FLS for unrestricted worldwide operation…The analysis of the data shall be based
on the longest possible time period for the relevant area. In the case of short time series
the statistical uncertainty shall be accounted for when determining design values.
Hindcasting may be used to extend measured time series, or to interpolate to places
where measured data have not been collected. If hindcasting is used, the model shall be
calibrated against measured data, to ensure that the hindcast results comply with
available measured data.”
From all the environmental loads, hydrodynamic loads induced by wave and current as well as
wave loads, wind loads and tidal effects are commonly hard tasks to perform so special attention
should be considered when design is performed.
This means that special models and methodologies should be used for load estimation but it
will depend on the references and credibility of the models used, how loads are characterized.
For example, DNV OS-C101 and C205 present some considerations regarding to some
parameters:

Global Response Analysis of Wind Turbine Installation Vessels in Semi-submerged Condition. A
Modified Quasi-Static Approach
31
“EMSHIP” Erasmus Mundus Master Course, period of study September 2014 – February 2016
For hydrodynamic loads induced by waves and current
Hydrodynamic loads shall be determined by analysis. When theoretical predictions are
subjected to significant uncertainties, theoretical calculations shall be supported by
model tests or full scale measurements of existing structures or by a combination of
such tests and full scale measurements.
Hydrodynamic model tests should be carried out to:
o Confirm that no important hydrodynamic feature has been overlooked by
varying the wave parameters (for new types of installations, environmental
conditions, adjacent structure, etc.)
o Theoretical calculations should be supported when available analytical methods
are susceptible to large uncertainties.
o Verify theoretical methods on a general basis.
o Wind tunnel test should be carried out if wind loads are significant for overall
stability, offset, motions or structural response.
For wave loads on structures:
o Wave theory or kinematics shall be selected according to recognized methods
with due consideration of actual water depth and description of wave kinematics
at the surface and the water column below.
o Linearized wave theories, e.g. Airy, may be used when appropriate. In such
circumstances the influence of finite amplitude waves shall be taken into
consideration.
o For slender structures (typically chords and bracings, tendons, risers) where the
Morison equation is applicable, the wave loads should be estimated by selection
of drag and inertia coefficients depending of the case considered.
o In the case of large volume structures disturbing the free field wave kinematics,
the presence of the adjacent structures may be considered by radiation and
diffraction analyses for calculation of the wave kinematics, wave loads,
excitation forces or pressure.
Further information is supplied in the documents mentioned before as it is the case for the
calculation of inertia forces, forces due to wind, earthquake, tidal effects, marine growth, snow
and ice.

P 32 Ramón Acevedo
Master Thesis developed at West Pomeranian University of Technology, Szczecin
After the loads are defined, global response analysis of the structure can be performed. Since it
is interested that structure remain in an equilibrium condition without significant displacements,
equilibrium studies are also performed for different operative conditions where the main
interest is determine the minimum overturning moment on the legs of the WTIU.
2.5 Rules and standards for WTIU Design
In this section a brief overview of the relevant standards consulted for WTIU design are given.
Moreover, it is considered as a main reference due to its recognition in the industry the DNV
GL recommended practices and offshore standards, as well as other relevant documents.
2.5.1 DNV RP C104 - Self-Elevating Units
Presents recommendations for the strength analyses of main structures of self-elevating units.
It refers to 2 safety formats of analysis: LRFD (Load and Resistance Factor Design method)
and the WSD (Working Stress Design method).
2.5.2 DNV RP C205 - Environmental Conditions and Environmental Loads
Gives guidance for modelling, analysis and prediction of environmental conditions as well
guidance for calculating environmental loads acting on structures. The loads are limited to those
due to wind, wave and current. The RP is based on state of the art within modelling and analysis
of environmental conditions and loads and technical developments in recent R&D projects, as
well as design experience from recent and ongoing projects.
2.5.3 DNV OS C101- Design of Offshore Steel Structures, General (LRFD Method)
Provide principles, technical requirements and guidance for the structural design of offshore structures
considering the LRFD method. The standard is applicable to all types of offshore structures of steel. The
standard is applicable to the design of complete structures including substructures, topside structures,
vessel hulls and foundations.
Global Response Analysis of Wind Turbine Installation Vessels in Semi-submerged Condition. A
Modified Quasi-Static Approach
33
“EMSHIP” Erasmus Mundus Master Course, period of study September 2014 – February 2016
2.5.4 DNV OS C104 - Structural Design of Self-Elevating units (LRFD Method)
Provides principles, technical requirements and guidance for the design and construction of self-
elevating units, which can also be applied to all types of self-elevating units constructed in steel. The
study proposed in this document is based on the load and resistance factor design (LRFD).
2.5.5 DNV OS C201 - Structural Design of Offshore Units (WSD Method)
Provides principles, technical requirements and guidance for the structural design of offshore
structures considering the WSD method. The standard is applicable to all types of offshore
structures of steel. The standard is applicable to the design of complete structures including
substructures, topside structures, vessel hulls and foundations. Examples of application are
column-stabilized units, self-elevating units, tension leg platforms and/or deep draught floaters.
2.5.6 DNV OS C205 - Environmental Conditions and Environmental Loads
Gives guidance for modelling, analysis and prediction of environmental conditions as well
guidance for calculating environmental loads acting on structures. The loads are limited to those
due to wind, wave and current. The document is based on state of the art within modelling and
analysis of environmental conditions and loads and technical developments in recent R&D
projects, as well as design experience from recent and ongoing projects. The scope of the
document is focused in determining the following loads: wind, waves, current and tides.
2.5.7 DNV OS J301 - Wind Turbine Installation Units
This standard provides principles, technical requirements and guidance for the design and
construction of units built to satisfy the service notation “Wind Turbine Installation Unit”. This
standard is in principle applicable to all types of wind turbine installation units including, but
not limited to, the following variants: self-elevating units, column stabilized units. Additionally,
Structural design covering marine operation sequences is not covered in this standard and shall
be undertaken in accordance with the requirements stated in DNV-OS-H101 “Marine
Operations, General” and DNV-OS-H102 “Marine Operations, Design and Fabrication”.

P 34 Ramón Acevedo
Master Thesis developed at West Pomeranian University of Technology, Szczecin
2.5.8 API RP 2A-WS - Planning, Designing, and Constructing Fixed Offshore
Platforms- Working Stress Design
Serves as a guide for those who are concerned with the design and construction of new fixed
offshore platforms and for the relocation of existing platforms used for the drilling,
development, production, and storage of hydrocarbons in offshore areas. The scope of the
document is focused on Planning, design criteria’s, structural design, fatigue, foundation
design, and accidental loads, fabrication, installation and inspection requirements.
2.6 Analysis Methods
Considering the document DNV RP C104 section 4.4, a series of recommended analysis are
presented which can be used to characterize the response of self-elevated units in the elevated
condition. A brief explanation of such methods is presented below.
The equations to be solved to perform a response analysis are:
Dynamic Equation
𝑚 �� + 𝑐 �� + 𝑘 𝑟 = 𝐹 (1)
𝐹 = 𝑐𝑑(𝑣 − ��)|𝑣 − ��| + 𝑐𝑑 𝑎 + 𝑐𝑚(𝑎 ��) (2)
Linearized Dynamic Equation
(𝑚 + 𝑐𝑚)�� + (𝑐𝑙 + 𝑐𝑑𝑙)�� + 𝑘𝑙𝑟 = 𝐹𝑙 (3)
Where,
m = mass of the structure
c = global damping, c=c(r)
k = stiffness, k=k(r)
r = displacement of the structure
�� = velocity of the structure
�� = acceleration of the structure
a = acceleration of the fluid
v = velocity of the fluid
cd = drag force coefficient
cf = froud krilov force coefficient

Global Response Analysis of Wind Turbine Installation Vessels in Semi-submerged Condition. A
Modified Quasi-Static Approach
35
“EMSHIP” Erasmus Mundus Master Course, period of study September 2014 – February 2016
cm = added mass
Fl =cdl+ci a
ci =cf + cm
cdl = cd(v-��)ref for linearization by relative velocity
= cd√(8/𝜋)𝜎𝑣−�� for linearization by standard deviation
𝜎𝑣−�� =√𝜎𝑣2 + 𝜎��
2 − 2𝜎��𝑣
𝜎𝑣 =standard deviation of fluid velocity
𝜎𝑟 =standard deviation of displacement of the structure.
cl , kl = linearized damping and stiffness.
Figure 8shows the methods hierarchy, where the ones located at the top offer better realistic
results for the problems studied in terms of conservatism. I.e. method A will be less
conservative than the methods B, C, D, E and F.
Figure 8. Methods for response analysis, DNV GL RP C104 Figure 4-4

P 36 Ramón Acevedo
Master Thesis developed at West Pomeranian University of Technology, Szczecin
2.6.1 Method A. Stochastic Non-Linear Dynamic Analysis
Method A is the most comprehensive of the methods. In principle it is possible to account for
all of the special effects mentioned above. However, the method requires long computer times
and preliminary calculations with simplified methods should be conducted in advance. The
equations of motion may then be solved in the time domain by recognized methods as for
instance the Newmark-β method.
2.6.2 Method B. Deterministic Non-Linear Dynamic Analysis
Method B is similar to method A except that only regular waves are considered. Fluid velocity
and acceleration are determined from the most accurate wave theory, and the non-linear
equations of equilibrium are solved by time integration. The method is well suited for extreme
response analysis, but not for rigorous fatigue analysis.
2.6.3 Method C. Stochastic Linear Dynamic Analysis
Method C is based on a linearization of the equation of equilibrium where main feature is the
linearization of the coefficient Cdl as presented before, by means of relative velocity or by means
of standard deviation of the relative velocity which implies that an iterative procedure is
required for the evaluation of the spectral density of the response.
2.6.4 Method D. Deterministic Non-Linear Static Analysis
Method D is equivalent to method B for very stiff platforms, for which dynamic effects are
insignificant. The analysis is considerably simplified because the equation of equilibrium is
reduced to:
𝑘 𝑟 = 𝐹𝑠 (4)
Where,
𝐹𝑠 = 𝑐𝑑𝑣|𝑣| + 𝑐𝑖𝑎
(5)
However, jack-up platforms are in general so flexible that dynamic effects should not be
neglected unless the effect is compensated by other conservative assumptions.

Global Response Analysis of Wind Turbine Installation Vessels in Semi-submerged Condition. A
Modified Quasi-Static Approach
37
“EMSHIP” Erasmus Mundus Master Course, period of study September 2014 – February 2016
2.6.5 Method E. Stochastic Linear Static Analysis
Method E is equivalent to method C for very stiff platforms, for which dynamic effects are
insignificant.
2.6.6 Method F. Deterministic Linear Static Analysis
Method F is the most simple of all methods, and in general a number of important effects are
ignored. However, as discussed in connection with the other methods it is often possible to
account for special effects by simple modifications. In many cases method F may be modified
in such a way that the accuracy is not significantly reduced in comparison with method B. The
main corrections will contain:
A Dynamic amplification of the wave/current load, accounted by a horizontal “inertia”
load in hull center. See points 4.4.3 to 4.4.6 of DNV RP C104 for calculation methods.
Base shear and overturning moment amplification due to P-Δ effect (misalignment of
vertical loads combined with hull displacements generating additional moments),
including the nonlinear amplification factors “α”. The non-linear effect of large hull
displacement can be accounted by a horizontal load in hull center, see point 4.4.7 of
DNV RP C104 for calculation methods.
The main advantage of the method is that it is very easy to establish instantaneous load
distributions, and it is possible to work with very large and detailed structural models.
2.6.7 Some Conclusions about Types of Analysis.
With the previous descriptions, it’s understood that a rigorous analysis will correspond to
method A which can be used for special investigations, but expensive in terms of computational
time.
Deterministic methods may be used for extreme response analysis. Dynamic effects and non-
linear effects should be accounted for, but this may be done by approximate modifications of a
linear/static analysis. On the other hand, stochastic methods should be used for fatigue analysis.
Considering the information before, is established from now that the type of analysis proposed
in this document for the survival and semi-jacked condition corresponds to the type E,
Deterministic Linear Static Analysis.

P 38 Ramón Acevedo
Master Thesis developed at West Pomeranian University of Technology, Szczecin
This is decided since displacements and rotations are large but strains are expected to be small,
so stress-strain relations are linear. Non-linear structural response should be consider for local
analysis. Non-linear effects due to soil structure interaction can be quantified by considering
soil non-linear models, but the structural response will continue to be evaluated as linear. A
static analysis is considered since the dynamic effects can be quantified by means of Dynamic
Amplification Factors obtained from a vibration and encounter frequency analysis.
The accuracy of the results won’t be significantly reduced in comparison with method B since
it had been proved that method E provides good approximation for large detailed structural
models. This arguments are stablished in DNV offshore standards and recommended practices
and can be found in DNV OS C-104 for further details.
2.7 Static and Dynamic Structural Response
In structures, the dynamic structural response will depend on the ratio between the excitation
frequency and the structural natural frequency, I.e. in case of a vessel, the structural response
will be conditioned by the incoming wave excitation. Due to this fact an Eigen frequency
analysis should be performed to ascertain the range where resonance occurs and to quantify the
dynamic effects on the structure. The eigenvalue problem is solved in this study applying the
lanczos method.
Tree methods can be generally used to study the structures response under external loads and
these are: Static Analysis, Quasi-Static Analysis and Dynamic Analysis. Each of them are
strictly linked to the features of the loads acting on the body.
When loads are time independent, loads are called static. Contrary, a time dependent load will
be called dynamic. Main difference is that static loads don’t cause inertial effects since no
accelerations and no strain deformation rates are produced on the body. When loads are time
dependent, body accelerations are induced and so inertial forces become significant as well as
strain rates. Nonetheless, if strain rates and inertial effects due to body acceleration are
significantly small, the structure can be analyzed considering several static load cases where
each of them represents a moment in the time-line. This method is called quasi-static analysis.
An example of how the equation of motion is considered to be solved is shown below.

Global Response Analysis of Wind Turbine Installation Vessels in Semi-submerged Condition. A
Modified Quasi-Static Approach
39
“EMSHIP” Erasmus Mundus Master Course, period of study September 2014 – February 2016
Let’s consider a load “F” as a time dependent load acting on a body with “w” as the frequency
linked to the incoming wave. If “wn” is the structural natural frequency for 1 degree of freedom,
and being “w/wn” << 1, dynamic effects can be neglected and equation of motion can be solved
at each time step with a Static Analysis. For the range where “w/wn” > √2 the global damping
of the structure generates a negative effect as known from vibration theory, so lightly damped
system will have lower transmissibility than those with larger damping. I.e when “w/wn” > √2
quasi-static analysis can be used to solve the equation of motion but forces determined will be
bigger than the ones obtained due to the low transmissibility for that range of input frequencies.
�� = 𝐹0 sin(𝑤𝑡) → 𝑡 = 1 �� = ��(1) = 𝐹0
sin(𝑤) → (𝑚 + 𝑐𝑚)�� + (𝑐𝑙 + 𝑐𝑑𝑙)�� + 𝑘𝑙𝑟 = ��(1)
𝐹 = 𝐹0 sin(𝑤𝑡) → 𝑡 = 2 �� = ��(2) = 𝐹0 sin(2𝑤) → (𝑚 + 𝑐𝑚)�� + (𝑐𝑙 + 𝑐𝑑𝑙)�� + 𝑘𝑙𝑟 = ��(2)
𝐸𝑎𝑐ℎ 𝑒𝑞𝑢𝑎𝑡𝑖𝑜𝑛 𝑖𝑠 𝑆𝑜𝑙𝑣𝑒𝑑 𝑤𝑖𝑡ℎ 𝑆𝑡𝑎𝑡𝑖𝑐 𝐴𝑛𝑎𝑙𝑦𝑠𝑖𝑠!
As commented before if dynamic effects are to be significant, a dynamic analysis should be
prepared considering the input frequency. This leads to a situation where equation of motion
must be solved by non-linear methods since large strain rates, deformations and inertial forces
can’t be neglected. In this case the motion equation to be solved is the following.
𝑚 �� + 𝑐 �� + 𝑘 𝑟 = �� (6)
�� = 𝑐𝑑(𝑣 − ��)|𝑣 − ��| + 𝑐𝑑 𝑎 + 𝑐𝑚(𝑎 ��) (7)
As main features of a dynamic response, it can be mentioned that inertial loads increases when
the wave periods are close to structural natural frequencies. This generates significant
accelerations which leads to large displacements and fast oscillations in time contrary when far
from resonance. Is due to this fact that is necessary to perform a dynamic forced response
analysis in the range where dynamic effects may be significant.
For the particular case of WTIU, in the elevated condition the lowest natural frequencies usually
correspond to the longitudinal displacement (surge), transverse displacement (sway) and
vertical rotation (yaw). When verifying the semi-submerged condition the same features can be
found since the configuration is analogous. Meanwhile wave periods are usually small, these
will be the motions excited by the incoming waves and so the main ones to be studied.

P 40 Ramón Acevedo
Master Thesis developed at West Pomeranian University of Technology, Szczecin
The ratio between the input period and the structural natural period (or equivalent ratio in terms
of frequencies) is used to determine the load increments where dynamic effects are significant.
This is done determining the called Dynamic Amplification Factor (DAF) which represents the
factor by which displacements are amplified due to the fact that the external forcing is dynamic
and not static, i.e. by knowing the magnitude of the static displacement and the input frequency,
one can determine the dynamic effect of the structure for harmonic forces.
The DAF is calculated with the ratio between the dynamic deflection with the static deflection
at a given frequency. Regarding to how much the response is amplified, it will depend on how
close we are to the natural frequency (w/wn close to 1 leads to maximum DAF values) and on
the damping ratio of the structure.
From DNV RP-C104 4.4.4, a well-known formulation is given for the calculation of the DAF
and the damping ratio as shown below.
𝐷𝐴𝐹 =1
√⟦1 − (𝑇0𝑇
)2
⟧
2
+ (2𝜉𝑇0𝑇
)2
(8)
𝜉 =𝑐
𝑐𝑟=
𝑐
2√𝑚 𝑘 (9)
Where
To = structural natural period for one degree of freedom
T = wave period
𝜉 = damping ratio
c = global damping including structural, hydrodynamic and soil damping
It has to mention that DAF cannot be applied directly to stress or displacements since non-linear
effects are to be dominant on the structure response. For this, another methodology combined
with the DAF should be applied which is explained below.
Necessarily, the DAF must consider several aspects of the body physics which are:
Dynamic effects due to frequency encounter (w/wn close to 1)

Global Response Analysis of Wind Turbine Installation Vessels in Semi-submerged Condition. A
Modified Quasi-Static Approach
41
“EMSHIP” Erasmus Mundus Master Course, period of study September 2014 – February 2016
P-Δ or P-Delta effect, which refers to the abrupt changes in ground shear, overturning
moment, and/or the axial force distribution at the base of a sufficiently tall structure or
structural component when it is subject to a critical lateral displacement.
Surge and Sway drift due to deformation by environmental loads.
Horizontal offset due to hull form fabrication and installation.
P-Δ and horizontal offset should be always quantified since they will affect significantly the
structure response since self-elevated units are relative flexible structures subject to large hull
surge and sway displacements generally caused by environmental loads. Tolerances during
fabrication will also lead to a “hull sway” increasing the non-linear effects.
Due to hull sway, the vertical spudcan reaction will present an offset relative to the centroid of
the leg at the level of the hull. Thus the legs moments at the hull level will be higher compared
to those calculated by a linear quasi-static analysis.
Two calculations are proposed in the document DNV RP – C104 section 4.4.4. One offers a
methodology to quantify the DAF for the total base Shear only, and the second considers the
hull horizontal displacements, used to quantify dynamic effects, P-Delta effect, horizontal drift
(considering wave direction) and offset of hull. The second method is the one considered for
the calculations in this study.
Because the instantaneous wave/current force resultant for a jack-up platform is not at the
effective center of mass, equivalent “inertial” forces are derived which are to be applied at the
platform effective center of mass of the model in quasi-static global analysis. By superposing
the effects of the linear wave loading with the structural response linked to an Inertial load
(calculated separately which represent a correction of the static approach) one can calculate the
influence of the dynamic response on the base reactions and motions. Once again, this approach
represents a powerful method since it includes the effect of the miss-alignment of the structure
during installation, hull environmental drift, and out of straightness during the construction to
predict the dynamic effects. A procedure to determine the inertial force is now presented.
A calculation of the hull displacements caused by the fabrication, wind, wave and
current have to be done to establish the hull displacement amplitude (P-Δ effect). The
hull displacement may typically be chosen in the hull center, and normally the

P 42 Ramón Acevedo
Master Thesis developed at West Pomeranian University of Technology, Szczecin
displacements from the wave phase angles corresponding to maximum and minimum
base shear can be used to determine the displacement amplitude. This is done through a
static analysis.
In a global analysis the above may be obtained by applying a unit horizontal load
(inertial load) at the platform effective center of mass. The inertia load is obtained by
scaling a unitary load called “FUnit” with a scaling factor (SFAC).
It is necessary to mention that when it is referred to an unitary horizontal load, it will
represent the behave of the structure in the particular horizontal direction where the
force is applied, so several simulations should be performed to be able to describe the
whole dynamic and other effects on the analysis, which will give the hull displacement
by a unit force in the direction evaluated.
Figure 9. Dynamic effects corrected by hull displacements, Figure 4-7 taken from
DNV GL RP C104-4.4
𝐹𝐼 = 𝐹𝑢𝑛𝑖𝑡 x∆𝐴(𝐷𝐴𝐹 − 1)
∆𝑢𝑛𝑖𝑡 (10)
Where,
∆𝐴 = amplitude value of total hull displacement wave/current (quasi-static).
∆𝑢𝑛𝑖𝑡 = the hull displacement from the unit force applied at the platform
effective center of mass
DAF = Dynamic amplification factor
SFAC = ∆𝐴 (DAF - 1)/ΔUnit
∆𝐴 (DAF - 1) = the hull displacement representing the dynamic amplification
inertia force:
The P-Δ effect can be also represented as an inertial force. Thus adding to the ones determined
to account the dynamic effects, one can simulate the non-linear dynamic response of the
Global Response Analysis of Wind Turbine Installation Vessels in Semi-submerged Condition. A
Modified Quasi-Static Approach
43
“EMSHIP” Erasmus Mundus Master Course, period of study September 2014 – February 2016
structure. The Inertial load linked to the P-Δ effect can be modeled as a horizontal load
determined with the following procedure
𝐻 = 𝑊Δ/l (11)
Δ = α(γ𝑓,𝐷𝑒0 + γ𝑓,𝐸𝑒) (12)
α =1
1 −𝑃𝑃𝐸
(13)
𝑃𝐸 = 𝜋2𝐸𝐼/(𝐾𝑙)2 (14)
Where,
H = Horizontal inertial load.
W = nxP. Elevated hull weight (including payload)
n = number of vessel legs
P = Average load on legs at hull level [N]
PE = Euler load
Δ = total hull sway in the considered wave direction
e0 = e1+e2 e3. Maximum horizontal offset of the platform, including initial
out-of-straightness of legs [m]
e = sideway 1st order deflection of barge due to wind, waves and current
include dynamic effects.
γ𝑓,𝐷 = load factor deformation loads [-] –
γ𝑓,𝐸 = Load factor environmental loads [-]
e1 = out-of-straightness [m]
e2 = hull leg clearances [m]
e3 = heel of platform [m]
Once the Inertial loads are determined, it is possible to obtain the standard structural response
under a static load (non-variant in time or frequency). Reaction forces, stress distribution and
motions can be calculated for every inertial load (linked to each wave heading) that is interested
to evaluate then, by applying the superposition theory, we can combine such results after scaling
the response for the inertial force, with the linear quasi-static wave loading and hydrostatic load
case.

P 44 Ramón Acevedo
Master Thesis developed at West Pomeranian University of Technology, Szczecin
Figure 10. P-Δ effect by horizontal loads. Figure 4-9 of DNV RP-C104
To obtain the structural response at each wave heading, the procedure should be repeated
applying the respective inertial loads in the wave direction and subsequently combined with the
results obtained with the quasi-static analysis. Finally it is possible to observe the better
consistency with the reality when referring to base shear forces, vertical forces, bending
moment, stress distribution and displacements.
This procedure is valid only for a specific geometrical configuration, so it is understood that
the methodology should be repeated for other geometrical configurations or operational
conditions.
2.7.1 Some relevant notes
Depending on the structure, typical values for damping ratios may be found and used for a first
estimation. According to the standard DNV RP-C104 4.4.5, “typical values for jack-up vessels
in survival condition are expected to be around 6 to 9% but it should not be taken higher than
7% without justification…The total damping coefficient, c, includes structural damping,
hydrodynamic damping and soil damping. All of these contributions are difficult to determine,
Global Response Analysis of Wind Turbine Installation Vessels in Semi-submerged Condition. A
Modified Quasi-Static Approach
45
“EMSHIP” Erasmus Mundus Master Course, period of study September 2014 – February 2016
and none of them should be neglected”. Besides this dependency, it will be difficult to select a
representative total damping ratio since it will be also dependent on the excitation frequency.
A clear difference between both operational conditions is identified at this point. The damping
for the survival condition is expected to be lower in comparison with the damping of the semi-
jacked condition due to the contribution of the hull hydrodynamic damping which will vary
with the heading angle, and with the incoming wave period.
Is important to remark that this work is not intended to evaluate a specific rig design or either
report the performance or load capability of any existing structure. The product obtained from
this work will serve to understand the general behave of such structures and get an idea of the
loads that WTIV may face on site, which is a valuable information for design stages.
2.8 Problem Physics Discussion
In this section are presented the points the author consider are important to perform the global
response study of the WTIU according the information that has been presented in the section
2.3, 2.4 and 2.6 of this document.
It is notice that special attention should be given when performing a global response study of a
WTIU. Additionally, some aspects are identified and marked as important to take care when
performing the study, which presented and described as follows:
Geometry of the structure: Hull form, legs and features of the possible jack up system
should be known to define load limits, as well as drag coefficients to determine
accurately loads acting either on the hull or the legs.
Methodologies for wave induced loads as well as wind loads, inertial forces, earthquake,
tidal effects, and others shall be correctly defined according to recognized references or
previous studies.
Modeling of the connection of legs with the sea bottom should be modeled properly for
correct overturning moment estimation as well as structure response. Depth of the spud
cans and interaction of them with the soil should be well known to guarantee the
minimum requirements by the standards.

P 46 Ramón Acevedo
Master Thesis developed at West Pomeranian University of Technology, Szczecin
When using Morison formulation for loads acting on structures, update of the form
coefficient for the geometry of the column must be performed precisely to assure quality
of results.
Dynamic analysis of the structure should be performed to determine displacements and
accelerations. It has to be guaranteed that structure response will not present resonance
for the in-site conditions
3D modeling of the structure is required to be performed since CFD analysis is
requested. Attention to flow modeling around structure must be considered.
Stability study of the structure in the case of the study should be performed to guarantee
safety during operations.
Hull motions and accelerations (RAO) due to lateral oscillations, base shear force, base
reaction moment and base reactions in each leg must be reported when finished the
studied.
It should be reported all the loads acting on specific points such as junctions or areas
where may be required and structural analysis in the elastic, useful during the design
stage.
Methodologies for added mass estimation for multibody motion must be consider.
Special attention should be given since operating condition to be analyzed is semi
submerged jack-up condition.
2.8.1 Advantages and limitations of Deterministic Linear Quasi-Static Analysis.
The advantages, disadvantages and limitations to apply a deterministic linear quasi-static
analysis are presented now.
Some advantages are:
Suitable to determine Global Response of the vessel in Survival condition for large
detailed models.
Offers a first good approach of Base Shear and Bending Moment estimation
Accounting of the multibody hydrodynamic, fluid structure interaction and ship motion.
Added mass, Drift forces and Damping can be accounted as well as variable functional
loads, permanent loads, environmental loads and deformation loads
Possible to perform load transfer from global model for local strength assessment of
legs, assessment of tubular joints, hull deck structure, spudcans and capacity of jacking
systems.

Global Response Analysis of Wind Turbine Installation Vessels in Semi-submerged Condition. A
Modified Quasi-Static Approach
47
“EMSHIP” Erasmus Mundus Master Course, period of study September 2014 – February 2016
RAO'S can be determined for all operational conditions. Motion of the center of gravity
and hull center is used to understand the ship motions under the loads mentioned.
Counting of Structure-Soil interaction which guarantees a realistic modeling of the
structure fixity and their effects on the structural response.
Linear flow solvers are able to catch the majority of the wave loads effects on the
structure for which is not usually required turbulent models since inertial loads are to
be dominant rather than drag forces.
Morison model offers good approximation for wave load estimation, differing in no
more than 25% with RANS simulations. This demonstrate its usefulness to evaluate
strength related safety aspects for high hull elevations. (From the work "Wave load and
structural analysis for a jack-up platform in freak waves" discussed in the chapter 3 of
this document).
Possible to account second order bending and axial loading (which reduces lateral
stiffness)
Regular linear wave theory will be enough to characterize the global response of the
structure.
Some dis-advantages and limitations are:
To assess the global response of a specific location, non-linear wave theory may be used
to account the effect of bound waves on the dynamic response.
If linear theory is used, drag from Morison equation is linear since is based on linear
wave kinematics. For a realistic approach, non-linear wave kinematics in combination
with a determistic or stochastic approach should be considered.
Time variant simulations may be needed to catch structural non-linearities of the
response, solved with a dynamic analysis.
If dynamic effects are to be significant, a Structural Dynamic response analysis will be
mandatory to determine the response of the structure in specific locations under certain
environmental condition. Nevertheless, the present modified quasi-static approach will
be suitable to describe the majority of the dynamic effects in the global response of the
structure even for detailed FE models. This will allows to identify a range where
dynamic forced response will be needed decreasing global computational calculations.
Local models cannot be assessed with this modeling technique (I.E moonpool effect on
hull-leg connection).

P 48 Ramón Acevedo
Master Thesis developed at West Pomeranian University of Technology, Szczecin

Global Response Analysis of Wind Turbine Installation Vessels in Semi-submerged Condition. A
Modified Quasi-Static Approach
49
“EMSHIP” Erasmus Mundus Master Course, period of study September 2014 – February 2016
3 STATE OF THE ART
This section presents a briefly description of the work from other authors related with the
physical problem to be studied. Explanation of their work, special considerations and results
are mentioned since their work is considered useful for the proposal of our study. A summary
of each reference is presented as follows.
3.1 Reference review #1: A Parametric Study of the Non-Linear Dynamic
Behavior of an Offshore Jack-Up Unit
Work presented by Martin S. Williams, Richard S.G. Thompson and Guy T. Houlsby, on 1997.
The Abstract of this work is says as follows:
“The dynamic response of an offshore jack-up unit to environmental loads has been
investigated using a two-dimensional, nonlinear finite element model. The model
includes realistic representations of the wave loading, the geometric non-linearities of
the rig legs and the complex non-linear effects of combined loads on the spudcan
footings…. It is shown that the accurate non-linear modelling of both the legs and the
spudcan footings has a significant effect on the rig dynamics. The widespread practice
of modelling the footings as simple pinned supports may be non-conservative for some
sea states”.
For the study of the structure response, a dedicated finite element software is used to
characterize nonlinear effects on the structure, this means that a Dynamic Analysis is
performed. Modeling is performed in 2D so wave forces are assumed to be aligned with the
axes of symmetry of the rig.
Directional seas are not studied in this case and so torsional displacement modes of the rig
cannot be modelled due to the 2D model (This is considered as one of the limitations of the
authors work).
Morison equation is used to determine the loads on the legs (idealized as equivalent cylinders).
Regarding to the wave kinematics and wave non linearity’s, they are modeled using Stokes fifth
order wave theory. No further loads besides incident wave load is considered. RAO of the

P 50 Ramón Acevedo
Master Thesis developed at West Pomeranian University of Technology, Szczecin
structure as well as forces in the base are given considering 3 different junctions of the structure
with the sea bottom.
Figure 11. Typical Jack-up Unit and Plane Finite element model of a representative jack-up.
Fig 1 and 2 respectively. (M. Williams, 1999)
A comparative study between quasi-static analysis, and, Dynamic analysis is performed. The
objective is compared how the loads are amplified considering different models of the soil-leg
fixation to demonstrate that the widespread pined condition not often offers the most
conservative approach. For this study is used Pined fixation type, Fix (clamp) condition, and an
additional mathematical model which represents accurately the spudcan interaction in contact
with clay, called Model B (from the author Martin CM. “Physical and numerical modelling of
offshore foundations under combined loads”. D.Phil. thesis, University of Oxford, 1994).
The author found that for the different fixation conditions, the natural frequency of the structure
varies significantly which conditions the dynamic response of the structure.
Table 1. Main particulars of WTIV.
Fixation Type Structure N.P
[s]
Pined 8.3 (0.12 Hz)
Model B 6.6 (0.15 (Hz)
Fixed (Clamp) 4.6 (0.22 Hz)

Global Response Analysis of Wind Turbine Installation Vessels in Semi-submerged Condition. A
Modified Quasi-Static Approach
51
“EMSHIP” Erasmus Mundus Master Course, period of study September 2014 – February 2016
For the Quasi-Static Analysis, the maximum loads and hull displacements are registered for the
pinned condition, followed by the Model B and Fixed condition. This might make us infer that
pinned condition will be always more conservative than other types of fixation models.
Later, the author performs a dynamic analysis and compares the Hull displacements with the
wave frequency. Peak values are identified in the respective natural periods and in the second
harmonics since significant energy is linked to it. This behave is expected due to the wave non-
linearity’s.
Figure 12. Quasi-static displacements for a
Wave Height of 13m. Fig 5 from (M.
Williams, 1999)
Figure 13. Variation of total rig loads for a
wave height of 13m. Fig 6 from (M.
Williams, 1999)
Here is observed that for a limited range of frequency, Model B presents larger displacements
in comparison with the other cases. This means that pinned conditions not often will be the
most conservative approach, so attention should be given when setting this parameter.
Consequently, comparing the Dynamic Amplification factors against the frequency ratio
“w/wn” interesting findings are shown where maximum values are registered for the Model B
besides the loads registered in this case with the quasi-static analysis were lower for this model
comparing with the pinned condition.

P 52 Ramón Acevedo
Master Thesis developed at West Pomeranian University of Technology, Szczecin
Figure 14. Dynamic Maximum hull displacement for 13 m waves. Fig 8 (M. Williams, 1999)
The points plotted represents the DAF for each type of fixation, determined with the
formulation of DAF given in the section 2.7 of this document. Solid lines represent cases where
Model B and Pined condition are used with 0.05 and 0.06 of damping respectively. Points do
not match exactly numerically but they offer a good approximation for the model B and Pinned
condition, with more discrepancies with the fixed condition.
This results represent an interesting finding that must be considered for all types of analysis
when designing or verifying load limits on Jack-up Units. DAF determined with the formulation
in section 2.7 will offer a good approximation for the load increments besides a quasi-static
analysis is used. Nonetheless, attention should be given when modeling the soil-leg link.
Figure 15. Linear approximations to double DAF curves. Fig 12 (M. Williams, 1999)

Global Response Analysis of Wind Turbine Installation Vessels in Semi-submerged Condition. A
Modified Quasi-Static Approach
53
“EMSHIP” Erasmus Mundus Master Course, period of study September 2014 – February 2016
Other studies such as the listed below describe different models to represent the Soil-leg
interaction. Models such as elastic-plastic, linear springs, fix joints, pin joints, clay and silica
models are some of the models that are mentioned. This demonstrates the importance of
selecting to right model for the specific site conditions since the response of the structure may
not match with the reality. Meanwhile the dynamic response of the structure is an issue of
special concern, it will be also the type of model selected to stablish the fixation of the structure.
“Effects of Foundation Models on Jack-up Site Assessment” from ZHANG Jian, TANG
Wenxian, SU Shijie, GAO Chao, and
“Impact loads on a self-elevating unit during jacking operation. A methodology
incorporating site-specific parameters for weather window assessment” from Viktor D.
And Fredrik O.
“Numerical modelling of the dynamic interaction between jack-up vessel legs and the
seabed”, from Jorrit-Jan Serraris, Mike Woning.
“A FE procedure for calculation of fixity of jack-up foundations with skirts using cyclic
strain contour diagrams” from H.P. Jostad, Ø. Torgersrud and H.K. Engin, H. Hofstede.
“JACK-UP LEG AND JACKCING SYSTEM DESIGN LOADS IN TRASIENT PHASES”
from Jenny Yan Lu, Grezegorz Malinowski, Robin Weizheng Xiang, Colin Nelson and
Rick Rogers.
3.2 Reference review #2: Wave Load and Structural Analysis for a Jack-Up
Platform in Freak Waves
Work presented by Ould el Moctar, Thomas E. Schellin, Thomas Jahnke, Milovan Peric in the
Journal of Offshore mechanics and Antarctic engineering (2009)
The Abstract of this work is the following:
“It was analyzed the effects of freak waves on a mobile jack-up drilling platform
stationed in exposed waters of the North Sea. Under freak wave conditions, highly
nonlinear effects, such as wave run-up on platform legs and impact-related wave loads
on the hull, had to be considered. Traditional methods based on the Morison formula
needed to be critically examined to accurately predict these loads. Our analysis was
based on the use of advanced computational fluid dynamics techniques. The code used
here solves the Reynolds-averaged Navier–Stokes equations and relies on the interface-
capturing technique of the volume-of-fluid type. It computed the two-phase flow of water
P 54 Ramón Acevedo
Master Thesis developed at West Pomeranian University of Technology, Szczecin
and air to describe the physics associated with complex free-surface shapes with
breaking waves and air trapping, hydrodynamic phenomena that had to be considered
to yield reliable predictions. Lastly, the finite element method was used to apply the
wave-induced loads onto a comprehensive finite element structural model of the
platform, yielding deformations and stresses.”
This work results from the necessity of determine with accuracy the load limits of jack-up units
after the oil spill happened in the Gulf of Mexico due to hurricane Katrina. This work differs
from previous one presented since is introduced the usage of CFD coupled with FE solvers to
determine loading on a jack-up platform. The objective is determine the discrepancies and the
feasibility of using Morison Formulation for Leg loadings instead of CFD with direct numerical
integration.
The author uses a CFD solver which is able to solve the Fluid kinematics by the Reynold
Average Navier-Stokes (RANS) method considering the interface-capturing method of VOF
(volume of fluid) to account compressibility effects. Subsequently, CFD calculations are
coupled with a FE solver able to resolve the dynamic motion equations in time domain. Time
domain simulations are justified due to highly non-linear wave effects, non-linear behave of
foundation and dynamic effects.
The second analysis covers the same aim with the difference that the hydrodynamic loads are
determined with the Morison formulation, later transmitted to the FE model and solved to
determine the structure response.
A comparison is done using the base shear force and overturning moment registered on the
platform when exposed to freak waves (storm waves) 11.6 m and 23.7 m. Simulations are run
considering both CFD and Morison Formulation and finally compared. The study revealed that
predictions based on the use of the Morison formula differed by not more than 25% in the worst
cases from predictions in obtained with CFD techniques.
It is observed in the next graphs that results obtained from Morison Formulation follow with a
good approximation the approach obtained by RANS for waves of 11.6 m. In the case of a 23.7
m wave height, a big concordance on the base reactions is found with both approaches but peak
values differs in the worst cases around 25% which can be justified by the wave non-linearities

Global Response Analysis of Wind Turbine Installation Vessels in Semi-submerged Condition. A
Modified Quasi-Static Approach
55
“EMSHIP” Erasmus Mundus Master Course, period of study September 2014 – February 2016
that Morison Formulation can’t catch. These comparative results demonstrated the general
usefulness of the Morison formula to assess strength related safety aspects although only for
cases of high hull elevation.
Figure 16. Comparative results of base shear
for the 11.6m wave. Fig 13 (O. Moctar,
2009)
Figure 17. Comparative results of
overturning moment for the 11.6m wave.
Fig 17 (O. Moctar, 2009)
Figure 18. Comparative results of base shear
for the 23.7m wave. Fig 16 (O. Moctar,
2009)
Figure 19. Comparative results of
overturning moment for the 23.7m wave.
Fig 20 (O. Moctar, 2009)
Figure 20. Time histories of base shear. Fig
9 (O. Moctar, 2009)
Figure 21. Time histories of overturning
moment. Fig 10 (O. Moctar, 2009)

P 56 Ramón Acevedo
Master Thesis developed at West Pomeranian University of Technology, Szczecin
Besides the important findings of the author, it will be necessary to evaluate cases of lower hull
elevations with waves attacking the hull directly. Since pressure distribution will depends on
the incident angle and hull shape, it would be necessary to rely on methods such as CFD
techniques to predict wave loads on irregular surfaces.
3.3 Reference review #3: Sea Loads on Ships and Offshore Structures
Work presented by O.M. Fatilsen, Professor at the Department of Maritime Technology
Norwegian Institute of Technology. (1993).
The author presents his book as a material focused on calculations and considerations for wave-
induced motions and loads for Ships and Offshore Structures. Some of the considerations for
the analysis explained in the book are taken as references for the modeling of the physical
problem in this document. Some of them are mentioned now.
Depending on Reynolds, Flow separation may occur generating transition areas for drag
coefficient. When located in transitional condition of Reynolds, drag coefficients may
increase due to flow separation. One source could be given due to small bilge keel radios
which leads also to an increment of the drift forces.
When considering slender elements where flow detachment is presented, vortex induced
vibration should be an issue of concern and must be accounted when evaluating current
loads and dynamic structural response. The evaluation of the stroudal number can offer
the vortex period for which structure might me excited, depending on Reynolds Number
and the geometry of ship (flow separation) and due to the presence of Von Karman
vortexes’. This phenomena may be found in the legs of a Wind Turbine Installation
Vessel, or other structures with slender elements like Tension Leg Platforms or
Semisubmersibles. Vortex excitation period must be considered during the dynamic
response analysis of the structure.
Offshore structures present a high amount of nonlinear effects that can’t be notice by
analytical formulations. Numerical simulations are capable to account the nonlinearities
of the structure, environmental loading and soil-structure interactions. It also offers an
enormous advantage against model tests, since scale effect may affect the results
affecting the predictions for the real dynamics of the system.
Global Response Analysis of Wind Turbine Installation Vessels in Semi-submerged Condition. A
Modified Quasi-Static Approach
57
“EMSHIP” Erasmus Mundus Master Course, period of study September 2014 – February 2016
3.4 Notes and Comments Concerning WTIU Design
With the information presented before, a variety of points had been discussed for other authors
in the past, serving as a reference and guidelines for the study presented in this document.
Considering this references and others indicated in section 7, it is listed a number of points the
author considers important to perform the global response study of WTIU.
Some aspects identified and marked as facts of special worry are the following:
Geometry features of the structure: Hull form, legs and the jack up system should be
modeled with sufficient detail to catch major effects on such elements. It is of special
worry to determine with accuracy the load limits of the structure especially during
extreme response.
Methodologies to determine wave induced loads as well as wind loads; inertial forces,
earthquake, tidal effects, foundation fixation, and others shall be correctly defined
according to recognized references or previous studies to account major non-linear
effects. The dynamic response will be conditioned by all this parameters.
Modeling of the connection of legs with the sea bottom should be modeled properly to
guarantee that numerical simulations represent the real structure dynamics. Depth of the
spudcans and interaction of them with the soil should be well known and modeled
according to site specific parameters. Pin conditions for leg fixation can be used for
early design stages but it won’t be recommended for detailed designs.
Dynamic analysis of the structure will be the best option to determine displacements
and accelerations considering structural non-linearity’s and dynamic effects due to
frequency encounter. Special care should be given when verifying loads in the range of
resonance.
Usage of Dynamic Amplification Factors represents an alternative and reliable option
to characterize dynamic responses but special attention should be given when selecting
the foundation models to represent the soil-leg interaction if needed to perform a
specific site assessment.
3D modeling of the structure is required since CFD analysis must be used to determine
hydrodynamic loads on the hull. Flow characterization is an issue of special concern to
model accurately inertial and drag forces on submerged bodies.
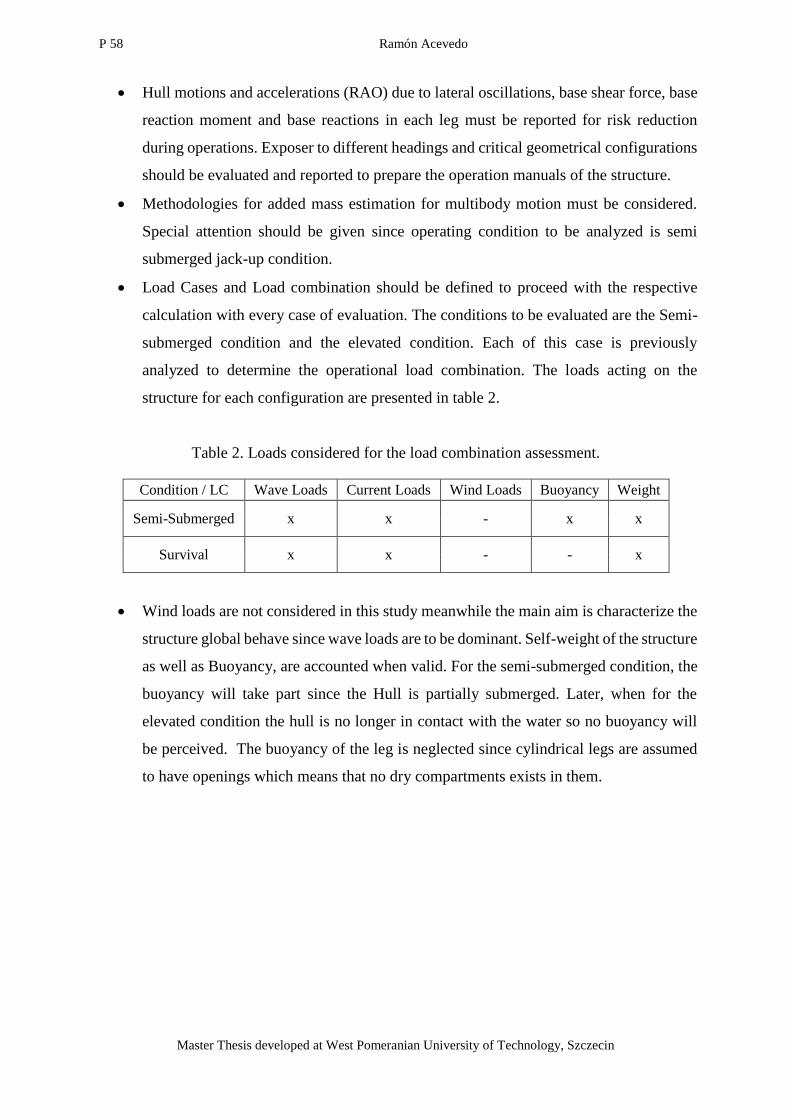
P 58 Ramón Acevedo
Master Thesis developed at West Pomeranian University of Technology, Szczecin
Hull motions and accelerations (RAO) due to lateral oscillations, base shear force, base
reaction moment and base reactions in each leg must be reported for risk reduction
during operations. Exposer to different headings and critical geometrical configurations
should be evaluated and reported to prepare the operation manuals of the structure.
Methodologies for added mass estimation for multibody motion must be considered.
Special attention should be given since operating condition to be analyzed is semi
submerged jack-up condition.
Load Cases and Load combination should be defined to proceed with the respective
calculation with every case of evaluation. The conditions to be evaluated are the Semi-
submerged condition and the elevated condition. Each of this case is previously
analyzed to determine the operational load combination. The loads acting on the
structure for each configuration are presented in table 2.
Table 2. Loads considered for the load combination assessment.
Condition / LC Wave Loads Current Loads Wind Loads Buoyancy Weight
Semi-Submerged x x - x x
Survival x x - - x
Wind loads are not considered in this study meanwhile the main aim is characterize the
structure global behave since wave loads are to be dominant. Self-weight of the structure
as well as Buoyancy, are accounted when valid. For the semi-submerged condition, the
buoyancy will take part since the Hull is partially submerged. Later, when for the
elevated condition the hull is no longer in contact with the water so no buoyancy will
be perceived. The buoyancy of the leg is neglected since cylindrical legs are assumed
to have openings which means that no dry compartments exists in them.

Global Response Analysis of Wind Turbine Installation Vessels in Semi-submerged Condition. A
Modified Quasi-Static Approach
59
“EMSHIP” Erasmus Mundus Master Course, period of study September 2014 – February 2016
4 METHODOLOGY
In this chapter it is explained the methodology used to perform the Global Response Analysis
of WTIV in semi-submerged condition. A flow diagram is provided for the general
understanding and global appreciation required for the study. Further information is given
regarding the software employed for the Hydrodynamic modelling and Structural Modeling.
Limitations of the software as well as relevant assumptions and considerations for the study
performed are also given.
4.1 Global Response Analysis
If a Global Response Analysis is required to be performed, the procedures indicated in the flow
charts of this section should be the minimum required for a proper analysis. The study requires
a wide multidisciplinary knowledge in hydrodynamics, structural mechanics and soil-structure
interaction.
A global response analysis implies built a simulation where the vessel geometry, site specific
parameters and environmental data are the input data for the simulation model. The simulation
model is the result of the interaction of 2 coupled or un-couple sub models called, structural
model and hydrodynamic model.
Figure 22. Flowchart displaying input data, simulation model, sub-models an output
interaction. .

P 60 Ramón Acevedo
Master Thesis developed at West Pomeranian University of Technology, Szczecin
The hydrodynamic model is used to represent the environmental loading on the structure
according to the information known for the site, which are later transmitted to the structural
model where motion equations are solved considering the external forces on the body. The
output of the analysis will cover mainly the response amplitude operators of the system, a global
nominal stress distribution in the model, base reactions and nodal displacements.
A step by step description is now presented. The first stage of the analysis involves the
organization of environmental and site data available for which the structure should be assessed.
With this, all the external loads can be defined and set in the FE model when prepared.
Figure 23. Flow-chart Global Response Analysis.
The second step consists in the preparation of the FE structural model considering the detailed
data given by the designer. If necessary, simplifications of the model can be done according
recommended practices for FE calculations. It is important to select the right type of elements
when building the model so balance between accuracy and computational time consuming is
reached.
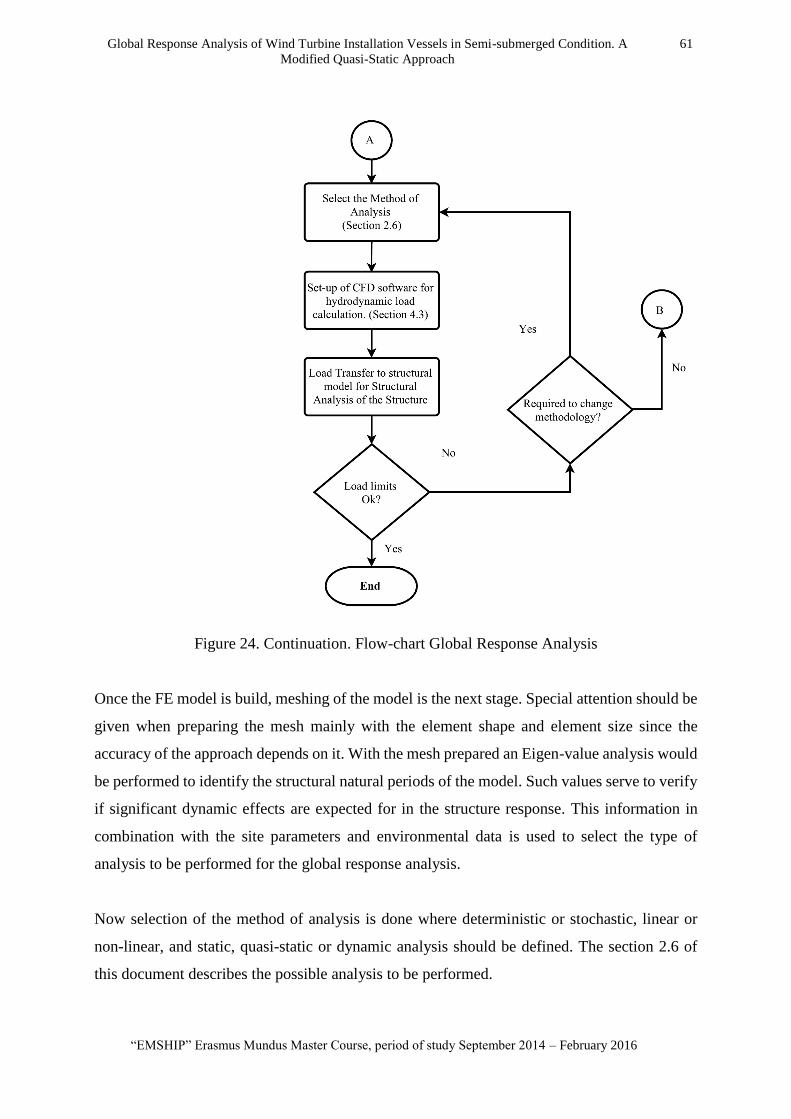
Global Response Analysis of Wind Turbine Installation Vessels in Semi-submerged Condition. A
Modified Quasi-Static Approach
61
“EMSHIP” Erasmus Mundus Master Course, period of study September 2014 – February 2016
Figure 24. Continuation. Flow-chart Global Response Analysis
Once the FE model is build, meshing of the model is the next stage. Special attention should be
given when preparing the mesh mainly with the element shape and element size since the
accuracy of the approach depends on it. With the mesh prepared an Eigen-value analysis would
be performed to identify the structural natural periods of the model. Such values serve to verify
if significant dynamic effects are expected for in the structure response. This information in
combination with the site parameters and environmental data is used to select the type of
analysis to be performed for the global response analysis.
Now selection of the method of analysis is done where deterministic or stochastic, linear or
non-linear, and static, quasi-static or dynamic analysis should be defined. The section 2.6 of
this document describes the possible analysis to be performed.

P 62 Ramón Acevedo
Master Thesis developed at West Pomeranian University of Technology, Szczecin
Subsequently, a CFD software is employed to determine the hydrodynamic forces acting on the
model. The modeling of the environmental forces should be carried using recognized numerical
methods, validated with experimental data. When external loads are determined, a load transfer
from to the FE model should be performed to compute the structural analysis (static, quasi-
static or dynamic). Finally, hull displacements, reaction forces and stress distribution can be
analyzed to verify the load limits of our model.
4.2 Model Data
The case being analyzed is a Wind Turbine installation Vessel (WTIV) with the main particulars
reported below. Dimensions for the modelling are supplied by DNV GL, Gdynia office in
Poland to evaluate a realistic design. Further information than the indicated below cannot be
given due to confidential agreement with the company.
It is requested to evaluate the WTIV at two different operational conditions at 3 specific
locations defined by the water depth. The operational conditions are the semi-jacked (semi-
submerged) and the survival condition. The aim of such considerations is to understand the
global behave of the structure under wave loading for different geometrical configurations and
so, to perform a comparative analysis to identify the maximum risk-operation between the two
conditions. It is not the intention of this study to evaluate a structural design at an specific site.
Main particulars considered for the vessel modeling are presented in table 3.
a) Semi-submerged condition b) Elevated/Survival condition
Figure 25. Modeling of operational conditions in FE software.

Global Response Analysis of Wind Turbine Installation Vessels in Semi-submerged Condition. A
Modified Quasi-Static Approach
63
“EMSHIP” Erasmus Mundus Master Course, period of study September 2014 – February 2016
Table 3. Main particulars of WTIV.
PARAMETER Value Unit
Length 120 [m]
Beam 42 [m]
Depth 9,5 [m]
Tonnage (non -loaded) 9797 [tons]
Gross Tonnage (Loaded) 14797 [tons]
Drat Semi-Submerged (Equilibrium) 2,52 [m]
Air gap (Static Clearance-Survival) 10 [m]
Soil Penetration 5,5 [m]
Max Wave Height (Hs)
-Semi-Submerged 2 [m]
-Survival 10 [m]
Wave Period Range 0-13 [s]
Current Velocity (*) 5 [m/s]
Wind Speed 0 [m/s]
Hull Inclination 0 [°]
Water Depth (WD) 30-40-50 [m]
Number of legs 4 [unit]
Leg Length 100 [m]
Leg Diameter 4 [m]
(*) Current Velocity is assumed to be constant along the vertical
For the 2 operational conditions shown above, the structure is analyzed at 3 different water
depths 30 m, 40 m and 50 m. This will lead to different geometrical configurations which will
modify the natural frequencies for the single degree of freedom problem (SDOF)
4.2.1 Geometrical Features
It is needed to discern how the geometrical configurations affect the Global Response of the
structure. The main worries are the amplification of the structure response due to dynamic
effects due to the geometrical configurations.

P 64 Ramón Acevedo
Master Thesis developed at West Pomeranian University of Technology, Szczecin
It is known that with a change of the geometry, the mass is redistributed affecting the inertial
properties of the structure and natural frequencies. This will be the starting point of the analysis
and the main fact that will uncover the behavior of the structure.
The geometrical configurations analyzed were selected according to the following criteria’s.
Each configuration defines a set of loads acting on the structure.
For the Semi-submerged condition the draft considered for the vessel is the one for the
still-water condition (hydrostatic equilibrium) with the gross tonnage weight. This
emulates de equilibrium condition just before the hull starts to upraise above the free
surface, thus legs are not submitted to axial loads rather than the one linked the extra-
buoyancy due to change of the free-surface. This condition defines a loading condition
as:
o Horizontal forces produced by the waves, acting on the hull and legs of the
vessel
o Vertical forces produced by the excess of buoyancy coming from the wave.
o Overturning Bending moment due to horizontal forces.
o Load amplification of Base Shear and Overturning Bending moment due to P-
Delta effect.
o Load amplification of Base Shear and Overturning Bending moment due to
resonance effect in the surge and sway motion.
For the Elevated condition, an air gap of 10 m is considered as design criteria. Therefore
for any water depth, the hull will be located at the specified distance measured from the
still water level to the vessel keel. This condition defines a loading condition as:
o Horizontal forces produced by the waves, acting only on the legs of the vessel.
o Vertical forces produced by the weight of the structure.
o Overturning Bending moment due to horizontal forces.
o Overturning Bending moment due to resultant vertical forces (P-Delta Effect).
o P-Delta Effect.
o Load amplification of Base Shear and Overturning Bending moment due to
resonance effect in the surge and sway motion.
With an overview of the loading panorama and with the operational conditions defined, it is
presented a table indicating the main geometrical features of the structure for cases being
evaluated.
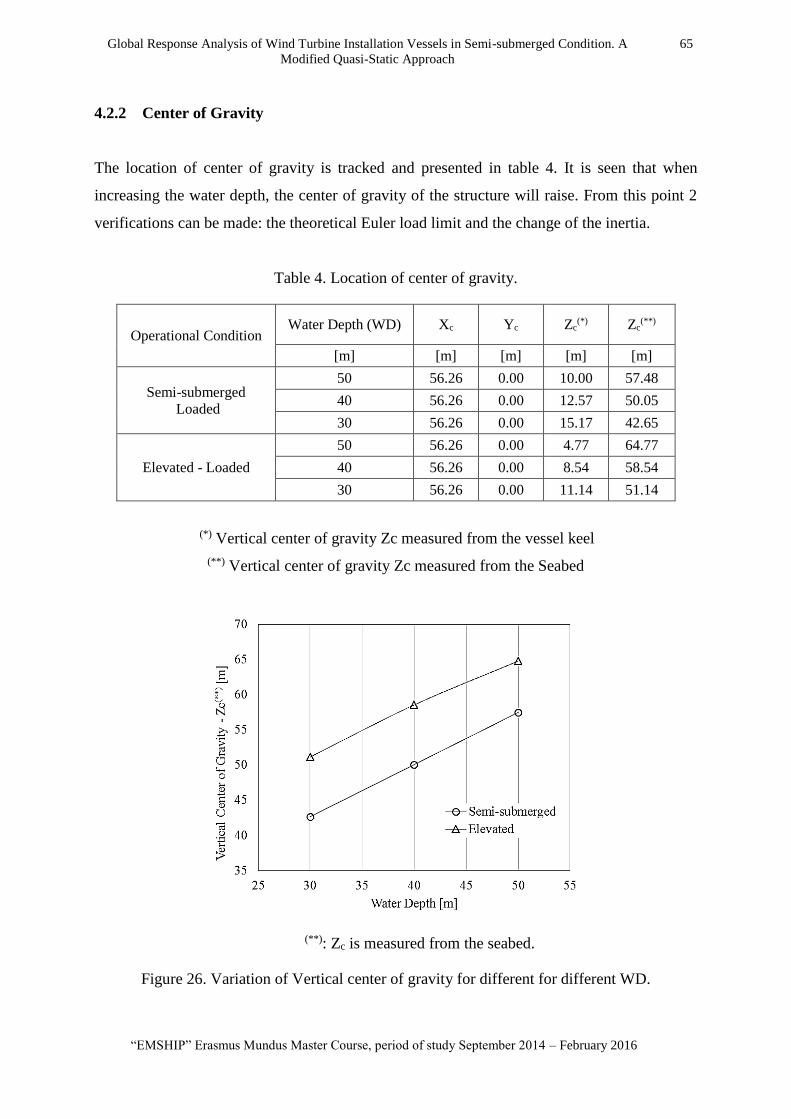
Global Response Analysis of Wind Turbine Installation Vessels in Semi-submerged Condition. A
Modified Quasi-Static Approach
65
“EMSHIP” Erasmus Mundus Master Course, period of study September 2014 – February 2016
4.2.2 Center of Gravity
The location of center of gravity is tracked and presented in table 4. It is seen that when
increasing the water depth, the center of gravity of the structure will raise. From this point 2
verifications can be made: the theoretical Euler load limit and the change of the inertia.
Table 4. Location of center of gravity.
Operational Condition Water Depth (WD) Xc Yc Zc
(*) Zc(**)
[m] [m] [m] [m] [m]
Semi-submerged
Loaded
50 56.26 0.00 10.00 57.48
40 56.26 0.00 12.57 50.05
30 56.26 0.00 15.17 42.65
Elevated - Loaded
50 56.26 0.00 4.77 64.77
40 56.26 0.00 8.54 58.54
30 56.26 0.00 11.14 51.14
(*) Vertical center of gravity Zc measured from the vessel keel
(**) Vertical center of gravity Zc measured from the Seabed
(**): Zc is measured from the seabed.
Figure 26. Variation of Vertical center of gravity for different for different WD.

P 66 Ramón Acevedo
Master Thesis developed at West Pomeranian University of Technology, Szczecin
When considering the Euler load to identify the theoretical buckling limit, it is expected that
with the hull upraise the leg strength against buckling will be reduced inversely proportional to
the square of increment of the vertical hull displacement.
𝑃𝐸 =𝜋2𝐸𝐼
𝑘𝐿2 (15)
𝑘 =3𝐸𝐼
𝑐𝐿3 (16)
Where,
PE = Euler Load for vertical columns
E = Module of elasticity of steel
I = Moment of Inertia of the cross section
K = Column effective length factor. 𝐾 = 2√𝑐
c = Stiffness coefficient. Calculated with the bending flexibility and shear flexibility
of the column. Further detailed calculation procedure is given in Appendix A-A.1 of
DNV RP-C104
The column effective length factor plays a crucial role for the length strength since it depends
on the type of fixation connection (defined by the leg penetration and soil properties). As more
rigid the soil-leg connection, the buckling limit is expected to be reduced. In the same way, as
more slender the column, buckling limit will be reduced.
Certainly the lateral stability of the column will depend on the ratio between the axial load
being applied and the column geometry. Shorter Columns will be more stable and as lower the
axial load, lower the lateral deformation. Semi-submerged operational condition will be less
sensible to lateral displacements since no preloading on legs is given, contrary to the elevated
condition where legs are submitted to axial loads so P-Delta effect will be significant.
4.2.3 Model Inertial properties
When verifying the effect geometry changes on the structure inertia, interesting results are
founded (valid for the model and water depth range considered).

Global Response Analysis of Wind Turbine Installation Vessels in Semi-submerged Condition. A
Modified Quasi-Static Approach
67
“EMSHIP” Erasmus Mundus Master Course, period of study September 2014 – February 2016
Since the structure is attached to the seabed, the structure will be likely to rotate from a point
in the bottom, contrary to the case when the vessel is floating where the rotation is made from
the longitudinal center of flotation. In consequence, we must focus on the inertial properties
measured from the center of rotation.
Figures 27 and 29 shows the variation of the main moments of inertia Ixx and Iyy with the water
depth. Each of them define the resistance capacity of the structure to be moved for the sway
and surge motion respectively.
Figure 27. Variation of Ixx for different for different WD.
Figure 28. Variation of Iyy for different for different WD.

P 68 Ramón Acevedo
Master Thesis developed at West Pomeranian University of Technology, Szczecin
Here is notice that semi submerged condition will be likely to rotate easier than the elevated
(survival) condition since the inertia in the main directions is smaller when compared. This
reveals that under the same loading, by means of a static load supposal, the semi-submerged
condition will present larger displacements.
In particular to the semi-submerged condition, Ixx is around 35% smaller than Iyy for the range
of water depth considered. This founding reveals that it will be expected to have larger
displacements and so load increments for beam sea headings than for head or following seas.
Values of inertias can be observed in table 5 and 6.
Table 5. Inertial Properties for different geometrical configurations at CM.
Operational
Condition
WD Ixx Iyy Izz Ixy Iyz Ixz
[m] [kg*m2] [kg*m2] [kg*m2] [kg*m2] [kg*m2] [kg*m2]
Semi-
submerged
Loaded
50 1.82E+10 6.24E+09 1.67E+10 -2.66E+09 -6.56E+05 -5.17E+07
40 1.81E+10 6.18E+09 1.66E+10 -2.66E+06 -8.88E+05 -7.75E+07
30 1.86E+10 6.69E+09 1.66E+10 -2.66E+06 -1.12E+06 -1.03E+08
Elevated -
Loaded
50 1.94E+10 7.46E+09 1.67E+10 -2.66E+06 -2.97E+05 -1.16E+07
40 1.84E+10 6.51E+09 1.67E+10 -2.66E+06 -5.29E+05 -3.74E+07
30 1.87E+10 6.14E+09 1.66E+10 -2.66E+06 -7.61E+05 -6.33E+07
Table 6. Main moments of inertia measured at the sea bottom level.
WATER DEPTH
Measured from the seabed Measured from the CM
Ixx Iyy Ixx Iyy
kg*m^2 kg*m^2 kg*m^2 kg*m^2
[m] SEMISUB SURVIVAL SEMISUB SURVIVAL SEMISUB SURVIVAL SEMISUB SURVIVAL
50 5.50E+10 7.00E+10 6.69E+10 8.18E+10 6.21E+09 8.04E+09 1.80E+10 1.99E+10
40 4.32E+10 5.71E+10 5.51E+10 6.90E+10 6.18E+09 6.51E+09 1.81E+10 1.84E+10
30 3.36E+10 4.47E+10 4.55E+10 5.67E+10 6.69E+09 6.14E+09 1.86E+10 1.81E+10
The ups and down of the Ixx and Iyy is justified due to the inertial contribution of the legs when
combined with the hull.

Global Response Analysis of Wind Turbine Installation Vessels in Semi-submerged Condition. A
Modified Quasi-Static Approach
69
“EMSHIP” Erasmus Mundus Master Course, period of study September 2014 – February 2016
The previous description will be valid just for this particular case and it cannot be generalized
as a global tendency for all WTIU. A particular study should be carried covering this aspect to
understand how the structure rigidity is affected.
It is expected for the cases when the inertia increase under the same environmental exposure,
hull sway and dynamic effects will reduce and so they will increase when decreasing the inertia
in the directions considered. Thus, it is suppose that beam seas will present higher loading
conditions in the support points.
4.3 Simulation Model
The simulation consists in the preparation of 2 sub-models that are:
A hydrodynamic model for numerical simulation of vessel rigid body motion in waves
and calculation of the hydrodynamic loads in terms of pressure fields acting on the
structure surface. Simulations in this study are performed in frequency domain.
A structural model where static or dynamic equations of motion are solved. The finite
element model is used to solve the equations where a failure criteria may be stablished
and for the structural assessment of the vessel design.
Sections 4.4 and 4.5 will present the general considerations for the preparation of the sub-
models.
4.4 Structural Model
The geometrical FE structural model was prepared with Sesam GeniE, a software tool
developed by DNV GL aimed for the design and analysis of fixed and floating offshore. The
FE model consists of four legs, jack houses and hull. The spudcans were not modeled since no
specific design is intended to be evaluated so they were modeled as pined boundary conditions
located in the point where soil-leg connection is given. For the modeling of the structure,
principal and secondary structural members are represented. Details of the structural
arrangement are provided by DNV GL Gdynia office to perform realistic calculations however,
they are subject to confidentiality and will not be presented in this document. The modelling is

P 70 Ramón Acevedo
Master Thesis developed at West Pomeranian University of Technology, Szczecin
performed in accordance with the Class Guidelines of DNV GL – CG – 0127 (2015) briefly
commented below.
The global model is prepared to represent accurately the global stiffness with respect to the
objective for the analysis. The model is used to calculate nominal global stresses in primary
members away from areas with stress concentrations. Such areas where local stresses are to be
assessed are out of the scope of the global analysis and local models should be used to study
the hotspot areas. The global finite element model developed is shown in figure 29.
Figure 29. Global FE model build. Loading planes for incoming wave headings. 90 degrees
(middle figure) and 180 degrees (rightmost figure).
4.4.1 Principal Structural Elements
The principal structural elements as the hull shell, longitudinal and transversal bulkheads,
frames, double bottom, upper deck, jack-house and girders are modeled with 4-node shell
elements. Figures 30, 31 and 32 present a 3D view of how the elements where modeled in the
software Sesam GeniE.
The hull model is composed by shell and beam finite elements. The sectional properties of the
particular beams have been set to give the resultant hull section characteristics equal to those
obtained in the hull structural design information supplied. Thus the model represents the global
hull bending stiffness in the vertical and horizontal direction. The procedure used was the
lumping technique which is described later on.

Global Response Analysis of Wind Turbine Installation Vessels in Semi-submerged Condition. A
Modified Quasi-Static Approach
71
“EMSHIP” Erasmus Mundus Master Course, period of study September 2014 – February 2016
Figure 30. Hull shell and hull structure built.
Figure 31. Modeled amidships section description.
Figure 32. Fore section.

P 72 Ramón Acevedo
Master Thesis developed at West Pomeranian University of Technology, Szczecin
4.4.2 Secondary Structural Elements.
Secondary structural elements as bars, and stiffeners form the hull and jack house structure are
modeled with 2-node beam elements. No solid elements where used.
In this thesis, the legs are modelled as 2-node beam elements with specific stiffness. A partition
of the hull leg is made in several segments to determine forces in specific points. The beam
sectional properties and their longitudinal distribution have been set to represent actual bending
and tension/compression stiffness. Since no shell or higher order finite elements are used, the
modeling won’t allow the verification of high stress concentration points.
Due to the number of stiffeners, a big number of nodes and elements are created when
generating the mesh of the model which increases considerably the computational time required
to solve the structural problem for 1 set of loads. To avoid such situation the lumping technique
is applied with the recommendations of DNV GL Class Guidelines for FE analysis. (DNV GL
– CG – 0127, 2015).
Figure 33. Example of plate and stiffener assemblies. Fig 2-5 DNV GL – CG – 0127
Stiffeners are lumped to the nearest mesh-line and it will remain as beam elements with the
only condition that with the merging, the cross-section area of the elements merged is to be the
same as the sum of the areas of the lumped stiffeners; bending properties are irrelevant since
the objective is to keep constant the ship cross-sectional area. As a criteria, no more than 3
stiffeners are merged in an equivalent element to assure that the stiffness of the panel is not
affected due to the geometrical changes. Final FE model is represented with figures 34, 35 and
36.

Global Response Analysis of Wind Turbine Installation Vessels in Semi-submerged Condition. A
Modified Quasi-Static Approach
73
“EMSHIP” Erasmus Mundus Master Course, period of study September 2014 – February 2016
Figure 34. Equivalent stiffener modeling in transversal cross section view.
Figure 35. Stiffener modeling in longitudinal section view
One important issue during the structural modeling of WTIV is how is modeled the hull-leg
connection since it is commonly the most highly loaded part of a jack-up leg for the elevated
condition, just below the lower guide. The leg/hull interaction will mainly depend on the design
concept. Three important elements can be identified: the fixation system, the jacking system
and the upper & lower guides.

P 74 Ramón Acevedo
Master Thesis developed at West Pomeranian University of Technology, Szczecin
Figure 36. Stiffener modeling in the fore part of the vessel.
The fixation system is a piece of equipment located between the leg and the hull to avoid relative
movement of the leg and maintain the desired hull elevation. The fixation system can be racks,
pinions or rigid bars which secure the leg, transmitting bending moment between leg and hull
by vertical tension and compression. In this condition the legs are not in touch with the guides
so no additional forces are transmitted from the legs to the jack-house and hull. A representation
of the elements described is presented in figure 37.
Figure 37. Typical leg-to-hull connection detailed leg model. Hull and jack house
simplified with beams. Fig 4-3 DNV GL – RP – C104.
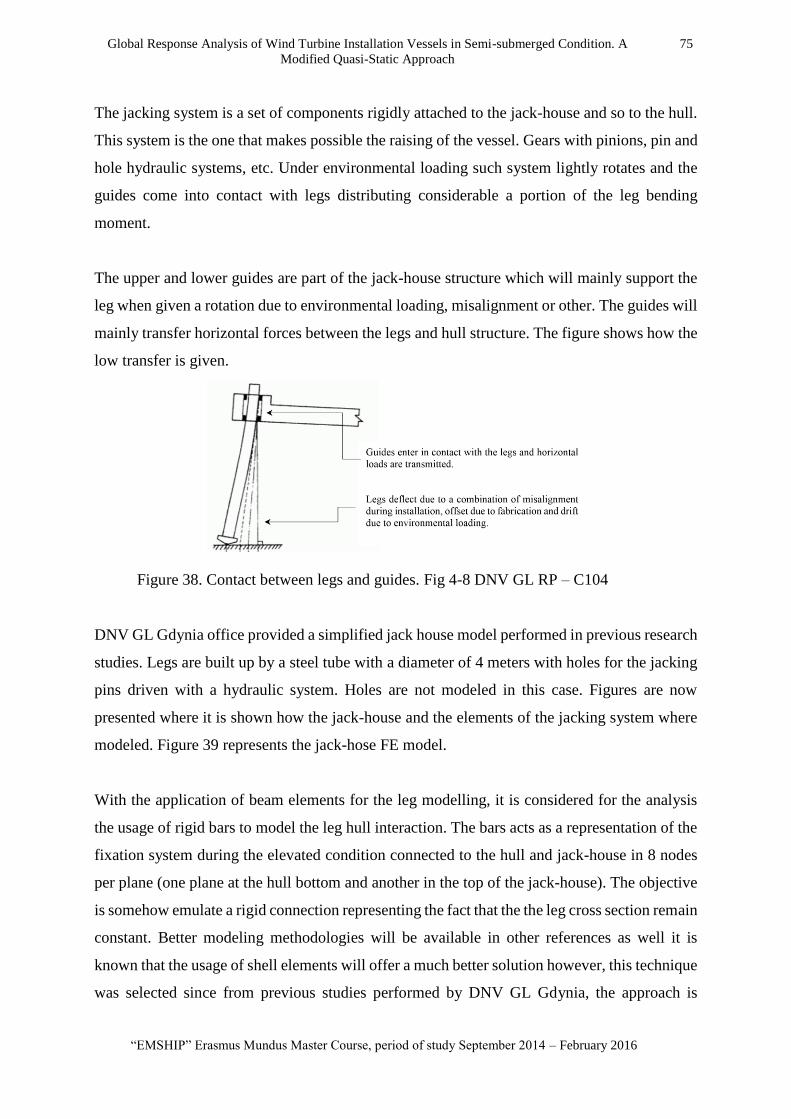
Global Response Analysis of Wind Turbine Installation Vessels in Semi-submerged Condition. A
Modified Quasi-Static Approach
75
“EMSHIP” Erasmus Mundus Master Course, period of study September 2014 – February 2016
The jacking system is a set of components rigidly attached to the jack-house and so to the hull.
This system is the one that makes possible the raising of the vessel. Gears with pinions, pin and
hole hydraulic systems, etc. Under environmental loading such system lightly rotates and the
guides come into contact with legs distributing considerable a portion of the leg bending
moment.
The upper and lower guides are part of the jack-house structure which will mainly support the
leg when given a rotation due to environmental loading, misalignment or other. The guides will
mainly transfer horizontal forces between the legs and hull structure. The figure shows how the
low transfer is given.
Figure 38. Contact between legs and guides. Fig 4-8 DNV GL RP – C104
DNV GL Gdynia office provided a simplified jack house model performed in previous research
studies. Legs are built up by a steel tube with a diameter of 4 meters with holes for the jacking
pins driven with a hydraulic system. Holes are not modeled in this case. Figures are now
presented where it is shown how the jack-house and the elements of the jacking system where
modeled. Figure 39 represents the jack-hose FE model.
With the application of beam elements for the leg modelling, it is considered for the analysis
the usage of rigid bars to model the leg hull interaction. The bars acts as a representation of the
fixation system during the elevated condition connected to the hull and jack-house in 8 nodes
per plane (one plane at the hull bottom and another in the top of the jack-house). The objective
is somehow emulate a rigid connection representing the fact that the the leg cross section remain
constant. Better modeling methodologies will be available in other references as well it is
known that the usage of shell elements will offer a much better solution however, this technique
was selected since from previous studies performed by DNV GL Gdynia, the approach is

P 76 Ramón Acevedo
Master Thesis developed at West Pomeranian University of Technology, Szczecin
suitable for the global understanding of the structural interaction. Figures 40 represent the dianl
representation of the leg-hull connection.
Figure 39. Contact between legs and guides.
(a)
(b) (c)
Figure 40. (a) Construction of the Leg-Hull connection with beam elements.
(b) Leg guides modeled as rigid bars and the interception serves as connection.
(c) Lower part of the leg joined at the bars interception.

Global Response Analysis of Wind Turbine Installation Vessels in Semi-submerged Condition. A
Modified Quasi-Static Approach
77
“EMSHIP” Erasmus Mundus Master Course, period of study September 2014 – February 2016
4.4.3 Deck loads and Boundary Conditions
When the structure is modeled, loading conditions and boundary conditions are the next stages
for the global model. A deck load of 5000 tones is considered to be distributed in the middle
deck area to represent the components of the wind turbines to be installed. To model such loads,
mass points are used and they are located in a weightless rigid structure. This is done to consider
such mass (total of 15000 Tones) for the modal and dynamic analysis. Bars are modelled
rigidly, with really small cross section and massless, so these parameters won’t affect the main
structural frequencies. Figure 41 exemplify a WTIV in transient phases and figure 42 shows the
final representation of FE model developed for our studies.
Figure 41. Example of WTIV during transient phase and cargo on deck.
http://www.siemens.com/press/pool/de/pressebilder/2011/industry_solutions/300dpi/IIS20110
4935-01_300dpi.jpg
A key step for the FE model is define the boundary conditions. As it was commented in previous
sections, this represents an issue of special worry for WTIV modeling since the dynamic
response of the structure can be conditioned for such restrictions. According to DNV standards
and other references discussed in other sections, the possible boundary conditions for the
elevated condition are:
Fix Boundary conditions
Pinned Boundary condition
Spring Boundary conditions
Linear and non-linear foundation models

P 78 Ramón Acevedo
Master Thesis developed at West Pomeranian University of Technology, Szczecin
Solid linear and non-linear FE model of the foundation.
(a)
(b)
Figure 42. (a) Model of deck load in FE model; (b) Isometric view of model arrangement.
The type of restriction at the leg-soil connection will produce loads on the lower parts of the
legs in lesser or major proportion since this also defines the rigidity of the structure. At the end
it will be a matter of the combination of soil stiffness, hydrodynamic damping, soil damping,
and total mass with the structural stiffness and structural damping (which are constant in time).
Additionally, each of this parameters will vary depending of the input frequency (contrary to
the structural stiffness and damping) which complicates the calculation process due to the non-
linear interactions. Finally, for the purposes of the investigation carried, pinned condition at the
bottom leg connection is assumed since many years from now, modeling of jack-up structures
had been carried with such assumptions as conservative way to examine the order of magnitude
of the loads and the structure response. If needed a site specific response, modeling non-linear
foundation models should be considered for the most suitable and less conservative solution.
Figure 43 shows the equivalent representation of the fixation type used for the study.

Global Response Analysis of Wind Turbine Installation Vessels in Semi-submerged Condition. A
Modified Quasi-Static Approach
79
“EMSHIP” Erasmus Mundus Master Course, period of study September 2014 – February 2016
Figure 43. Leg boundary condition in beam element (at node) and
final structural model of WTIU
4.4.4 Meshing
The meshing of the structural model is the last but not less important parameter for the FE
modeling. Structural response results depend in high proportion on the mesh density. The
criteria’s stablished in DNV GL- CG- 0127 and DNV GL –RP – C104 are considered and
maximum mesh size should be decided considering a proper stiffness representation and load
distribution as commented in previous sections of this document.
The standard mesh arrangement is modeled in a way that the grid points are located at the
intersection of primary members. In general, the maximum element size taken was in a way to
have at least one element between each longitudinal girder, stiffener, and transverse webs. I.e
the minimum value between this 3 spacing’s is considered as the nxn size for the meshing.
The aspect ratio of the elements was considered not be bigger than 4 and lower than 2. If the
elements does not meet the criteria, these were divided in 2 defining triangular elements until a
proper element shape was found. The stiffener spacing before applying the lumping technique
was 25 cm but after apply it, and depending of the number of elements merged, the stiffener
spacing changed in the side shell, bottom shell and deck. The values used for the element size
were 50x50 cm and 75x75 cm.

P 80 Ramón Acevedo
Master Thesis developed at West Pomeranian University of Technology, Szczecin
Figure 44. FE Hull mesh build with 4-node shell elements.
Figure 45. Principal structural element mesh build with 4-node shell elements.

Global Response Analysis of Wind Turbine Installation Vessels in Semi-submerged Condition. A
Modified Quasi-Static Approach
81
“EMSHIP” Erasmus Mundus Master Course, period of study September 2014 – February 2016
Figure 46. From top to bottom of figure, transversal bulkhead, frame and longitudinal
bulkhead mesh.

P 82 Ramón Acevedo
Master Thesis developed at West Pomeranian University of Technology, Szczecin
Figure 47. Mesh arrangement. Primary and Secondary structural elements.
Figure 48. Jack House model mesh.
4.4.5 Modal Analysis
A modal analysis is necessary to identify the structural natural periods for which a verification
of the stiffness should be performed. On behalf of this situation, a fully detailed FE model is
developed without the application of the lumping technique and main geometrical properties

Global Response Analysis of Wind Turbine Installation Vessels in Semi-submerged Condition. A
Modified Quasi-Static Approach
83
“EMSHIP” Erasmus Mundus Master Course, period of study September 2014 – February 2016
and Eigen values are identified. The method used for the modal analysis is the Lanczos
eigenvalue method available in the Sesam GeniE software. Since the number of elements and
nodes generated for this model implies long computational time (up to 24 hours for the modal
analysis and around 3 hours for a static solution with a two 2.2 Hz processor, 8 core each and
128 Gb of Ram), a simplification of the model is performed applying the lumping technique
where stiffeners are merged to reduce the amount of elements and nodes.
The lumping procedure is verified using as a comparison criteria the difference between both
models regarding the main geometrical parameters and differences between natural periods.
The aim of this is mainly to decrease the computational time without scarifying the
representation of the global stiffness of the structure. Once the both models are build and the
properties are reported, the following features are identified and compared in tables 7 and 8.
Table 7. Detailed and simplified model features comparison.
Model Mass Xc Yc Zc Ixx Iyy Izz
[Kg] [m] [m] [m] [kg*m2] [kg*m2] [kg*m2]
Detailed 9693027.67 55.8844 0 7.396 1.69E+10 6.00E+09 1.49E+10
Simplified 9704930 55.9158 0 7.432 1.69E+10 6.00E+09 1.49E+10
Difference -0.12% -0.06% 0.00% -0.49% -0.15% -0.05% -0.25%
Table 8. Structural natural periods for detailed and simplified model
Detailed Model Simplified Model
Number of elements 130221 Number of elements 33530
Number of Nodes 69551 Number of Nodes 15315
CPU time (hr) - LANCZOS 26.08 CPU time (hr) - LANCZOS 1.08
No Eigen Value Frequency Period
No Eigen Value Frequency Period
[1/s2] [Hz] [s] [1/s2] [Hz] [s]
1 2.37 0.245 4.08 1 2.23 0.24 4.20
2 2.55 0.254 3.94 2 2.30 0.24 4.14
3 2.81 0.267 3.75 3 2.56 0.26 3.92

P 84 Ramón Acevedo
Master Thesis developed at West Pomeranian University of Technology, Szczecin
Small differences are found regarding to the location of the center of mass and moments of
inertia in the main directions. Additionally, a significant reduction of the computational time
for the modal analysis is reached, with differences up to 5% between the surge, sway and yaw
natural periods. Heave, pitch and roll motions are not in the same range of natural frequencies
as it’s commented in the previous sections and in DNV GL- RP – C104. In table 9 you can find
the values to which it’s making reference.
Table 9. Modal comparison between detailed and simplified models.
Difference # of elements Reduction 74.3%
Difference # of Nodes Reduction 78.0%
Difference CPU time (hr) - LANCZOS Reduction 95.9%
Eigen Value Frequency Period
% % %
-5.98 -2.94 2.86
-10.71 -5.39 4.96
-9.81 -4.71 4.57
Finally, structural natural response is characterized for every geometrical configuration. Wave
induced loads are excluded but stationary and gravity loads as well as legs and hull
hydrodynamic added mass are accounted for the calculation of the natural periods for each
degree of freedom (DOF). It is known that natural periods will vary depending on the wave
incoming frequency since the added mass will change nonetheless, to account such variations
the added mass computed by 3D potential flow theory is represented as concentrated masses
distributed in the respective nodes, in the areas where the structure is in contact with the fluid.
This procedure is automatically performed by the software HydroD - Wadam (explained in
section 4.5) and transmitted to Sesam GeniE for the Eigen value calculation of every DOF at
each incident wave frequency. These values are used for the dynamic response characterization.
Finally, the structural natural oscillations periods are determined and since no significant
variation is found between frequencies, a representative value is given for each NP linked to a
DOF and reported in the table 10. This parameter is determined with the representative damping
of the structure. Some special comments regarding this aspect are now given:

Global Response Analysis of Wind Turbine Installation Vessels in Semi-submerged Condition. A
Modified Quasi-Static Approach
85
“EMSHIP” Erasmus Mundus Master Course, period of study September 2014 – February 2016
Cross section of legs generates coefficients of added mass between 1.08 and 0.86
according to Morison formulation, valid for the range of incoming wave periods
considered. For the elevated and semi submerged condition, the added mass linked to
the legs of the vessel won’t affect significantly the total mass matrix since the major
contribution is coming from the vessel weight. Thus the added mass of the legs can be
neglected as a conservative assumption, and resonance range can be define with an error
bar of +/- 10% of the mean value.
Table 10. Structure natural periods for different geometrical configurations.
Operational
Condition
WD Surge NP Sway NP NF Heave NP
[m] [s] [s] [s]
Semi-
submerged
Loaded
50 4.20 4.14 3.92
40 2.74 2.70 2.12
30 1.98 1.94 1.52
Elevated -
Loaded
50 5.28 5.24 4.16
40 4.21 4.16 3.30
30 3.23 3.18 2.52
A representation is now given with figure 49 to show the body displacements for every DOF through a
color code comparison. The red color characterize higher displacements, while blue represents nodes
with zero displacement.

P 86 Ramón Acevedo
Master Thesis developed at West Pomeranian University of Technology, Szczecin
Fig
ure
49. G
rap
hic
al c
om
par
ison o
f m
odal
res
po
nse
for
Sem
i-su
bm
erg
ed a
nd E
levat
ed c
ondit
ion
Su
rge
Sw
ayY
aw
Sem
i-S
ub
mer
ged
Ele
vat
ed (
Su
rviv
al
con
dit
ion
)
OP
ER
AT
ION
AL
CO
ND
ITIO
N
DE
GR
EE
OF
FR
EE
DO
M
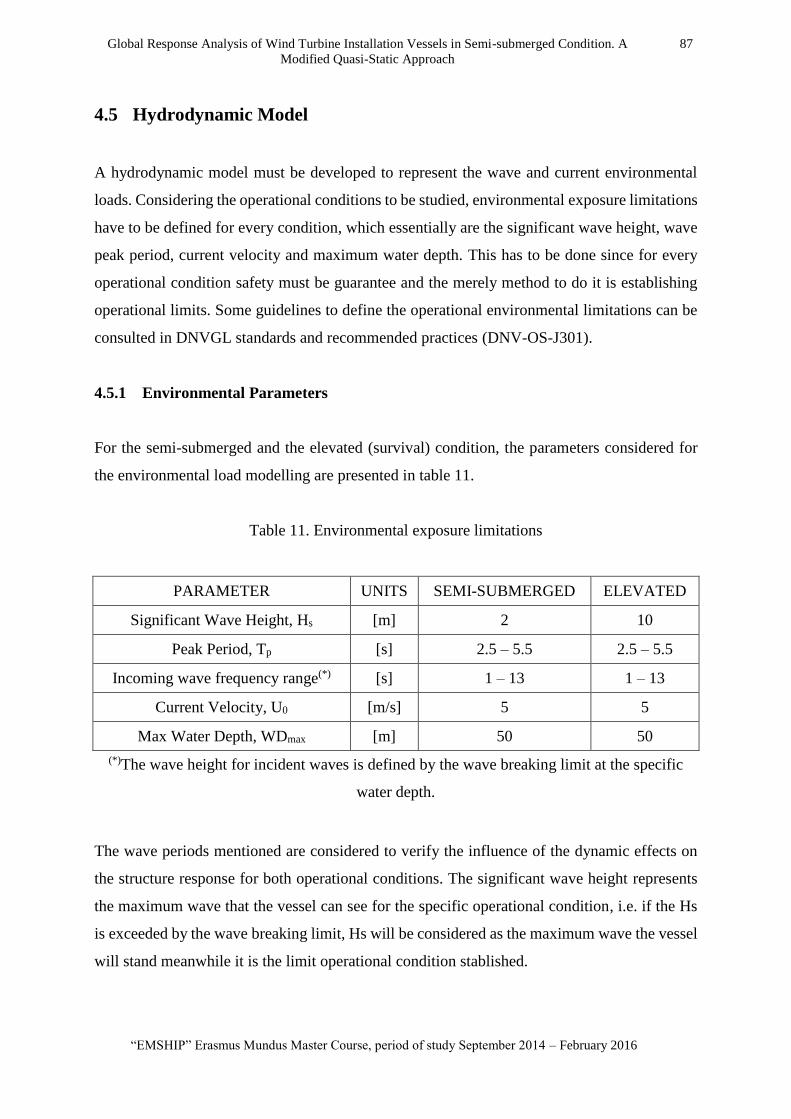
Global Response Analysis of Wind Turbine Installation Vessels in Semi-submerged Condition. A
Modified Quasi-Static Approach
87
“EMSHIP” Erasmus Mundus Master Course, period of study September 2014 – February 2016
4.5 Hydrodynamic Model
A hydrodynamic model must be developed to represent the wave and current environmental
loads. Considering the operational conditions to be studied, environmental exposure limitations
have to be defined for every condition, which essentially are the significant wave height, wave
peak period, current velocity and maximum water depth. This has to be done since for every
operational condition safety must be guarantee and the merely method to do it is establishing
operational limits. Some guidelines to define the operational environmental limitations can be
consulted in DNVGL standards and recommended practices (DNV-OS-J301).
4.5.1 Environmental Parameters
For the semi-submerged and the elevated (survival) condition, the parameters considered for
the environmental load modelling are presented in table 11.
Table 11. Environmental exposure limitations
PARAMETER UNITS SEMI-SUBMERGED ELEVATED
Significant Wave Height, Hs [m] 2 10
Peak Period, Tp [s] 2.5 – 5.5 2.5 – 5.5
Incoming wave frequency range(*) [s] 1 – 13 1 – 13
Current Velocity, U0 [m/s] 5 5
Max Water Depth, WDmax [m] 50 50
(*)The wave height for incident waves is defined by the wave breaking limit at the specific
water depth.
The wave periods mentioned are considered to verify the influence of the dynamic effects on
the structure response for both operational conditions. The significant wave height represents
the maximum wave that the vessel can see for the specific operational condition, i.e. if the Hs
is exceeded by the wave breaking limit, Hs will be considered as the maximum wave the vessel
will stand meanwhile it is the limit operational condition stablished.

P 88 Ramón Acevedo
Master Thesis developed at West Pomeranian University of Technology, Szczecin
4.5.2 Hydrodynamic Software and Wave Theory.
The software used for the hydrodynamic calculations was a DNV GL software tool called
HydroD WADAM. It is an interactive tool developed for computation of hydrostatics and
stability, as well as wave loads and motion response for ships and offshore structures.
The software is a 3D potential flow solver able to determine the wave kinematics with either
incident or diffractive wave, for hydrodynamic load calculations on irregular bodies. This
software is capable to embrace the following parameters:
Hydrostatic data and inertial properties
Response amplitude operator calculation comprising:
o First and second order wave exciting forces and moments (incident and
diffractive wave)
o Hydrodynamic added mass and damping
o First and second order rigid body motions
o Sectional forces and moments
o Steady drift forces and moments
o Wave drift damping coefficients
o Internal tank pressures
Calculation of selected global responses of a multi-body system
Automatic load transfer to a finite element model for subsequent structural analysis
including:
o Inertia loads
o Line loads for structural beam element analysis
o Pressure loads for structural shell/solid element analysis
o Pressure loads up to the free surface
Since our interest is characterize the global structure response and not a site specific assessment,
regular waves are considered for the modeling, wave non-linearity’s are neglected since output
of the analysis will be just the structure RAO’s, and a constant current profile is considered
with a velocity of 5 [m/s] for drag linearization of Morison equation. The following assumptions
are considered for wave and current loads on the legs and hull of the case of study.

Global Response Analysis of Wind Turbine Installation Vessels in Semi-submerged Condition. A
Modified Quasi-Static Approach
89
“EMSHIP” Erasmus Mundus Master Course, period of study September 2014 – February 2016
Regarding to the regular wave theory applied the following aspects are considered
3D potential flow theory in combination with diffractive wave is used to solve the wave
kinematics and pressure field on the hull. Direct numerical integration in frequency
domain is performed to determine the pressure distribution on the hull surface
considering the hydrostatic condition and linear wave loading. This procedure is valid
just for large bodies since Potential flow theory is not considering the flow detachment
thus it neglect the drag forces
First order velocity potential is used to determine the wave kinematics and no further
orders are considered in this study, thus wave harmonics are not accounted in the
structure response.
4.5.3 Wave Propagation and Wave Breaking Limit
The wave propagation and current directions are collinear. Wave headings considered
for the study are head sea (180 degrees) and beam sea (90 degrees). The objective is to
identify separately the surge and the sway motion of the structure. Besides no further
headings are investigated, it is assumed and expected that beam sea heading will be the
critical heading since a more hull area is exposed to hydrodynamic wave loading.
The design wave height considered for a given wave period (wave length) satisfies the
largest wave steepness condition determined with the procedure stablish in the point
3.4.6.1 form the standard DNV – RP – C205 (Maximum wave height and breaking
waves in shallow water).
𝐻𝑏
𝜆= 0.142 tanh
2𝜋𝑑
𝜆
(15)
Where,
Hb: Wave breaking limit
𝜆: Wave length
d: Water depth
Figure 50 represents the wave breaking limit for different water depths as well as the
maximum wave height exposure for each operational condition.

P 90 Ramón Acevedo
Master Thesis developed at West Pomeranian University of Technology, Szczecin
Figure 50. Wave Breaking Limit at Specific Water Depth
4.5.4 Morison Equation
For the modelling of the drag forces for small body components the Morison equation
is used to solve the wave kinematics determined with the diffractive potential (this since
structure is fixed). Drag and added mass coefficients are assumed depending on the leg
cross section to determine the slender bodies contribution. The parameters assumed for
the 4[m] leg diameter were: Morison properties considered are presented in table 12.
Table 12. Morison properties for Vessel Leg. Added mass and drag coefficients for
hydrodynamic calculations.
PARAMETER VALUE UNIT
Diameter 4 [m]
Thickness 0.1 [m]
Cd 0.7 [-]
Ca 1 [1]
In the case of bodies presenting non-negligible drag and inertial effect (i.e. a non-negligible
combination of inertial and drag loads), the following procedure is applied:
0
5
10
15
20
25
30
0 2 4 6 8 10 12 14
Wa
ve B
rea
kin
g l
imit
[m
]
Wave Period [s}
30m WD
40m WD
50m WD
Semisub Hs design Limit
Survival Hs design limit

Global Response Analysis of Wind Turbine Installation Vessels in Semi-submerged Condition. A
Modified Quasi-Static Approach
91
“EMSHIP” Erasmus Mundus Master Course, period of study September 2014 – February 2016
For large bodies where drag forces cannot be neglected, inertial loads may not be
sufficient to describe the loads acting on the body and either the added mass and
damping. For such cases a better approach for such parameters can be obtained
correcting the added mass and potential damping with the contribution of mass and
damping due to viscous drag. This can be determined applying the Morison formulation.
Morison formulation will consider the characteristic length of the geometry (Leg
diameter) and wave kinematics obtained from recognized numerical methods that don’t
consider viscous effects (In first instance Potential Flow Theory). Drag coefficients used
are taken from tables reporting such parameters, or eventually from similar or equivalent
cross sections. Later, superposition of both effects (Inertial + Viscous loads) is
performed to correct the loads acting on the bodies, and to correct the total added mass
and hydrodynamic damping.
The WTIV is analyzed in HydroD Wadam defining a “Panel” model, considering the mesh
generated for Hull FE model. The pressure distribution around the hull is determined with the
diffractive potential and applying direct numerical integration. Since the panel match with the
hull mesh of the FE model, hydrodynamic pressure can be transmitted directly to the FE model
and equations of motions can be solved under the dynamic wave loading.
Afterwards, a “Morison” model is defined now which comprise the elements where
hydrodynamic loads will be determined with the application of the Morison Equation. This
applies to the vessel legs since these are consider slender bodies thus the procedure can be
applied… Using the properties defined earlier for the legs (added mass and drag force
coefficients) and in combination with the wave kinematics, forces are determined and
transmitted to the FE model in the same wave is performed with the “Panel” model.
Figure 51 and 52 represents the components of the hydrodynamic model developed in HydroD
Wadam.

P 92 Ramón Acevedo
Master Thesis developed at West Pomeranian University of Technology, Szczecin
Figure 51. Hydrodynamic model components.
Figure 52. Hydrodynamic model representation in HydroD Wadam.
4.6 Determining Dynamic Response. Data Post Processing
The characterization of the global response analysis implies the handling of a significant
amount of data. Thus a data post processing should be performed for which a custom script is
built in Visual Basic (VB) for Applications from Microsoft Excel for the handling and analysis
of the results obtained with the simulation model.

Global Response Analysis of Wind Turbine Installation Vessels in Semi-submerged Condition. A
Modified Quasi-Static Approach
93
“EMSHIP” Erasmus Mundus Master Course, period of study September 2014 – February 2016
As commented in other sections, model the dynamic response of the structure requires the study
of the FE model under dynamic load, here solved with a quasi-static approach to determine the
stress distribution of the condition considered. Later, a dynamic amplification factor is used to
account the dynamic effects due to the coincidence of wave frequencies and structural natural
frequencies (DAF’s are modeled as equivalent inertial forces acting on the body). Is a fact that
this statement comprise a single case of the entire analysis still, several cases must be analyzed
and the process carried for it, is presented below.
For one specific water depth, hydrodynamic simulations are performed for the range of
wave periods defined. A total of 20 periods are considered for every heading. (20
hydrodynamic simulations).
Headings considered for the analysis were 90 and 180 degrees. This gives a total of
20x2=40 simulations linked to one specific water depth and one operational condition.
Previous procedures should be performed considering 3 different water depths to verify
structure response at different depths. 30, 40 and 50 m depths were considered given a
total of 120 simulations at this point.
Two operational conditions should be analyzed. This document is limited to the study
of the semi-submerged and the elevated condition which defines a total of 120x2=240
hydrodynamic analysis.
Each of this hydrodynamic analysis gives 1 set of external loads acting on the vessel.
The structure is solved for every set of loads applying a quasi-static structural analysis
therefore a total of 240 structural analysis are executed.
To consider the dynamic effects, DAF’s are determined for every wave period and
heading to estimate the equivalent inertial force to be applied on the structure to include
the response amplification. This means that 240 inertial loads are determined (one for
every simulation) and the structure is solved for each load with a static analysis.
The data generated from both structural analysis (external loads and inertial loads) is
used to build a data base in VB, used to perform the load case combination since such
procedure have to be performed manually in the software Sesam GeniE. The data base
is built considering the base shear on the vessel legs, bending moments and hull
displacements in the range considered.
With the data base, one can emulate different load combinations to generate the dynamic
response of the structure for different geometrical configurations without performing
additional simulations. Since the analysis considered is a deterministic linear analysis

P 94 Ramón Acevedo
Master Thesis developed at West Pomeranian University of Technology, Szczecin
under linear wave loading, the theorem of superposition is applied for the load
combination.
Once the procedure is established and automatized, just rest to generate a set of load
combinations to investigate the influence of certain parameters in the structure dynamic
response for both operational conditions.

Global Response Analysis of Wind Turbine Installation Vessels in Semi-submerged Condition. A
Modified Quasi-Static Approach
95
“EMSHIP” Erasmus Mundus Master Course, period of study September 2014 – February 2016
5 CASES OF STUDY. GLOBAL RESPONSE OF WTIV IN FINITE
WATER DEPTHS DURING TRANSIENT PHASES.
In this chapter is presented a detailed explanation of the cases studied to characterize the global
response of a WTIV during semi-submerged and elevated condition. The objective is
summarize the risk exposure of the vessel when operating in semi-submerged condition
compared with the elevated condition. Dynamics had been quantified as well as the effect of
the of the water depth in the structure response. Results are presented in terms of reaction forces
as base shear and vertical forces, global overturning moment and hull displacements. With the
comparative analysis, a risk table is built showing the governing operational condition.
5.1 Case 1. Quasi-Static vs Dynamic Response
To uncover the influence of the dynamic effects on the structure response, a comparison is done
between a pure quasi-static analysis vs the dynamic response analysis method proposed in this
document. Since Martin S. and Richard S.G demonstrate the importance of dynamic effects in
an elevated platform (section 3.1), our task is summarized to demonstrate the importance of
dynamic effects in the semi-submerged operational condition. For this, information in table 13
and 14 is considered as input for the analysis.
Considering the given input, quasi-static and dynamic analysis are applied and the RAO’s of
the structure are determined for a 1 [m] wave. The response is described in terms of total base
shear, total vertical force, global overturning moment, hull surge and sway drift. Results are
now presented and commented.
In the figures 53 and 54 it is presented the DAF of the structure response for incident waves of
90° and 180° (DAF is calculated with equation 8, section 2.7), exciting the sway and surge
motion respectively. It’s observed that larger amplification is found for the surge motion since
its representative damping is lower than the one for the sway motion. This can be justified since
when the hull moves, major amount of water is displaced by the hull with the sway motion than
for the surge due to additional hull area contribution.

P 96 Ramón Acevedo
Master Thesis developed at West Pomeranian University of Technology, Szczecin
Table 13. Input conditions. Design Parameters Case 1.
Water Depth 50 [m]
Range of wave period 1-13 [s]
Wave Height 1 [m]
Elevated Hull Weight 14.8 [Ton]
Leg Effective Length Factor 2 -
Number of legs 4 -
Leg OD 4 [m]
Leg Thickness 0.1 [m]
Leg ID 3.97 [m]
ϒf,D Load factor for deformation loads 1 -
ϒf,E Load factor for environmental loads 1.3 -
Representative Damping. Semi-submerged
-Sway 25 [%]
-Surge 15 [%]
Surge NP (T0) Semi-submerged 4.20 [s]
Sway NP (T1) Semi-submerged 4.14 [s]
Yaw NP (T2) Semi-submerged 3.92 [s]
Table 14. Jack-up system geometrical features. Case 1.
Distance between upper to lower guide 24000 [mm]
L.G to base line 2250 [mm]
Air Gap 0 [mm]
Sea bed penetration 5000 [mm]
Clearance of guides 20 [mm]
Fabrication Tolerances (e1) 10.00 [mm]
Hull Leg Clearances (e2) 41.46 [mm]
Heel of Platform (e3) 0.00 [mm]
Total Horizontal Offset (e0) 51 [mm]

Global Response Analysis of Wind Turbine Installation Vessels in Semi-submerged Condition. A
Modified Quasi-Static Approach
97
“EMSHIP” Erasmus Mundus Master Course, period of study September 2014 – February 2016
Figure 53. DAF for 180° incident waves. Semisubmerged. Case 1
Figure 54. DAF for 90° incident waves. Semisubmerged. Case 1
This higher damping for the 90° incident waves is traduced in lower load increments in the
resonance range for the dynamic response. At resonance, it is distinguished that surge motion
can be amplified up 3 ½ times regarding to the static response, and 2 times for the sway motion.
When verifying the shear response in figure 55-a, a curve with peaks and troughs on the
frequency domain is found. The presence of troughs along the frequency domain is justified by
the wave cancelling effect, reliant on the relation between the wave length and leg spacing, and

P 98 Ramón Acevedo
Master Thesis developed at West Pomeranian University of Technology, Szczecin
so the relation between the length and breadth of the ship with the wave length. Figure 56 shows
how the wave forces act in in opposite way on each pair of legs which reduce the resultant wave
load. It is seen that such effect have significant consequences on the structure response. Similar
features are found for the vertical force and global overturning moment in the frequency
domain.
As regards to the base shear, among all the peaks the maximum values reported are about 10
and 3.7 [MN] for 90° and 180° incident waves respectively. As expected, the 90° heading was
the one to present larger base shear.
Figure 55. Quasi-static and Dynamic Respoonse for design waves -Case 1. (a) Quasi-static
Base Shear; (b) Dynamic Base Shear; (c) Quasi-static Vertical Force; (d) Dynamic Vertical
Force; (e)Quasi-static Global Overturning Moment; (f) Dynamic Global Overturning
Moment.

Global Response Analysis of Wind Turbine Installation Vessels in Semi-submerged Condition. A
Modified Quasi-Static Approach
99
“EMSHIP” Erasmus Mundus Master Course, period of study September 2014 – February 2016
The figure 55-b shows the dynamic base shear response of the structure in which load
increments are perceived. Maximum values are now registered close to the natural frequencies
attributable to resonance effect. Peak values registered are 8.9 and 3.8 [MN] for beam and head
seas respectively, revealing load increments of 79% and 107%. Such increments are produced
due to dynamic effects as well as P-Delta effect. This values correspond to a 1 m wave and are
presented in table 15.
Table 15. Max Base Shear Comparison. Case 1, Quasi-static vs dynamic.
Sea Heading Base Shear Static Base Shear Dynamic Dynamic / Static (DAF B.S)
[MN] [MN] [-]
90° 4.98 8.90 1.79
180° 1.84 3.80 2.07
Figure 56. Wave force cancelling representation.
For 180° heading, the total base shear load will increase proportional to the wave period after
waves of 9 seconds, taking place due to hull drift. Similar behave can be presented for the 90°,
both justified since for long periods the structure will try to follow the wave trajectory which is
traduced in Wave length/ Ship length (WL/SL) or Wave length/ Ship Beam (WL/SB) >1.
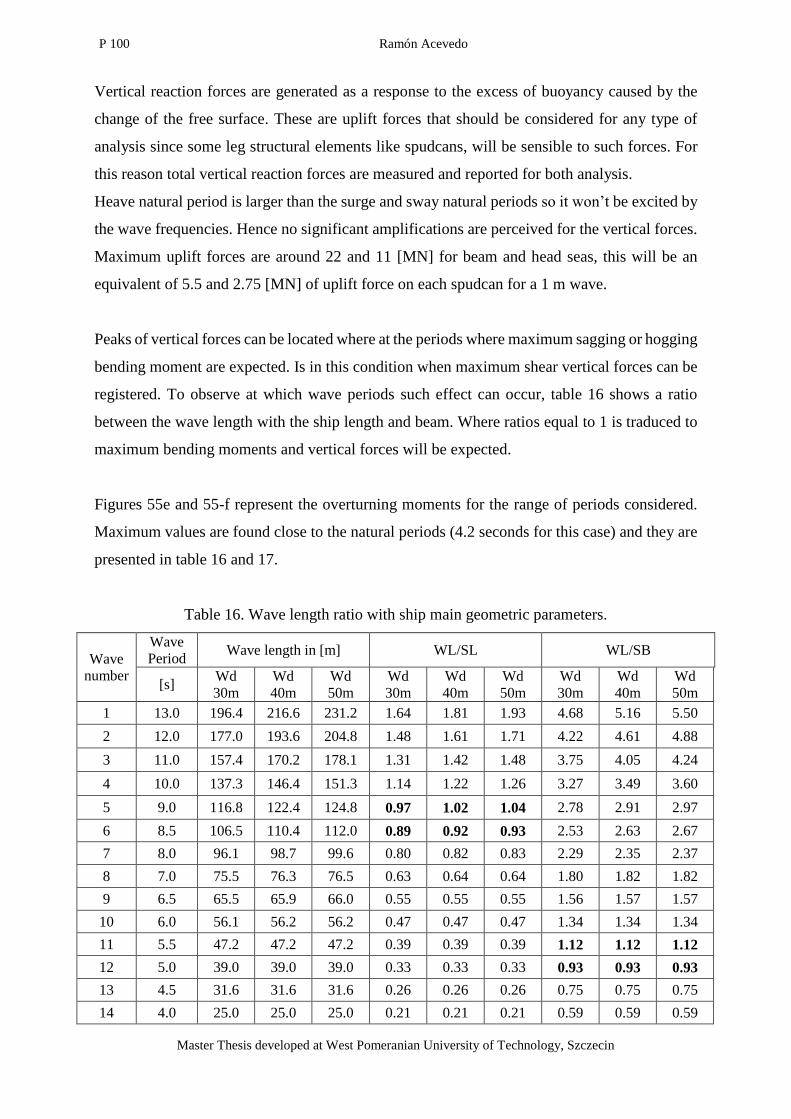
P 100 Ramón Acevedo
Master Thesis developed at West Pomeranian University of Technology, Szczecin
Vertical reaction forces are generated as a response to the excess of buoyancy caused by the
change of the free surface. These are uplift forces that should be considered for any type of
analysis since some leg structural elements like spudcans, will be sensible to such forces. For
this reason total vertical reaction forces are measured and reported for both analysis.
Heave natural period is larger than the surge and sway natural periods so it won’t be excited by
the wave frequencies. Hence no significant amplifications are perceived for the vertical forces.
Maximum uplift forces are around 22 and 11 [MN] for beam and head seas, this will be an
equivalent of 5.5 and 2.75 [MN] of uplift force on each spudcan for a 1 m wave.
Peaks of vertical forces can be located where at the periods where maximum sagging or hogging
bending moment are expected. Is in this condition when maximum shear vertical forces can be
registered. To observe at which wave periods such effect can occur, table 16 shows a ratio
between the wave length with the ship length and beam. Where ratios equal to 1 is traduced to
maximum bending moments and vertical forces will be expected.
Figures 55e and 55-f represent the overturning moments for the range of periods considered.
Maximum values are found close to the natural periods (4.2 seconds for this case) and they are
presented in table 16 and 17.
Table 16. Wave length ratio with ship main geometric parameters.
Wave
number
Wave
Period Wave length in [m] WL/SL WL/SB
[s] Wd
30m
Wd
40m
Wd
50m
Wd
30m
Wd
40m
Wd
50m
Wd
30m
Wd
40m
Wd
50m
1 13.0 196.4 216.6 231.2 1.64 1.81 1.93 4.68 5.16 5.50
2 12.0 177.0 193.6 204.8 1.48 1.61 1.71 4.22 4.61 4.88
3 11.0 157.4 170.2 178.1 1.31 1.42 1.48 3.75 4.05 4.24
4 10.0 137.3 146.4 151.3 1.14 1.22 1.26 3.27 3.49 3.60
5 9.0 116.8 122.4 124.8 0.97 1.02 1.04 2.78 2.91 2.97
6 8.5 106.5 110.4 112.0 0.89 0.92 0.93 2.53 2.63 2.67
7 8.0 96.1 98.7 99.6 0.80 0.82 0.83 2.29 2.35 2.37
8 7.0 75.5 76.3 76.5 0.63 0.64 0.64 1.80 1.82 1.82
9 6.5 65.5 65.9 66.0 0.55 0.55 0.55 1.56 1.57 1.57
10 6.0 56.1 56.2 56.2 0.47 0.47 0.47 1.34 1.34 1.34
11 5.5 47.2 47.2 47.2 0.39 0.39 0.39 1.12 1.12 1.12
12 5.0 39.0 39.0 39.0 0.33 0.33 0.33 0.93 0.93 0.93
13 4.5 31.6 31.6 31.6 0.26 0.26 0.26 0.75 0.75 0.75
14 4.0 25.0 25.0 25.0 0.21 0.21 0.21 0.59 0.59 0.59

Global Response Analysis of Wind Turbine Installation Vessels in Semi-submerged Condition. A
Modified Quasi-Static Approach
101
“EMSHIP” Erasmus Mundus Master Course, period of study September 2014 – February 2016
Wave
number
Wave
Period Wave length in [m] WL/SL WL/SB
[s] Wd
30m
Wd
40m
Wd
50m
Wd
30m
Wd
40m
Wd
50m
Wd
30m
Wd
40m
Wd
50m
15 3.0 14.1 14.1 14.1 0.12 0.12 0.12 0.33 0.33 0.33
16 2.5 9.8 9.8 9.8 0.08 0.08 0.08 0.23 0.23 0.23
17 2.0 6.2 6.2 6.2 0.05 0.05 0.05 0.15 0.15 0.15
18 1.5 3.5 3.5 3.5 0.03 0.03 0.03 0.08 0.08 0.08
19 1.3 2.6 2.6 2.6 0.02 0.02 0.02 0.06 0.06 0.06
20 1.0 1.6 1.6 1.6 0.01 0.01 0.01 0.04 0.04 0.04
Figure 57. Wave length – Ship length ratio for different Water depths. Head Seas
Figure 58. Wave length – Ship Besm ratio for different Water depths. Beam Seas

P 102 Ramón Acevedo
Master Thesis developed at West Pomeranian University of Technology, Szczecin
Table 17. Max Global Overturning Moment Comparison. Case 1, Quasi-static vs dynamic.
Sea Heading Max GOM-Static Max GOM-Dynamic Dynamic / Static (DAF GOM)
[MNm] [MNm] [-]
90° 286.34 511.78 1.79
180° 105.64 218.31 2.07
Significant magnitudes are also found close to the 9[s] and 5 [s] for Head and Beam sea
respectively, due to sagging or hogging effect. This reveals that it will be important to verify
the periods where dynamic effects will be significant and so the periods where maximum
sagging and hogging condition will be expected.
To conclude the Case 1, hull drift and heave motion are compared for both headings applying
quasi-static and dynamic analysis. Figure 59-a and 59-b shows the hull motions for 180°
incident waves. Sway amplitudes are negligible since there is no source of excitation for this
heading. Regarding to the structure response under 90° incident waves, figures 59-c and 59-d
presents the hull motions for both quasi-static and dynamic analysis. Large amplification of the
hull motions are found. Amplification for the surge and sway motion is notice in table 18.
Table 18. Max Hull motions for 180° incident waves. Case 1, Quasi-static vs dynamic.
Sea Heading DOF Static Dynamic Dynamic / Static (DAF )
[m] [m] [-]
180° Surge 0.085 0.179 2.11
90° Sway 0.225 0.447 1.99
It ca be mentioned that when using quasi-static approach either surge or sway motion are
described as proportional to the wave period since structure will tend to follow the wave pattern.
When considering the dynamic analysis, surge and sway motion for head and beam seas
respectively, achieve their maximum close to the natural frequency because of resonance and
P-delta effects.

Global Response Analysis of Wind Turbine Installation Vessels in Semi-submerged Condition. A
Modified Quasi-Static Approach
103
“EMSHIP” Erasmus Mundus Master Course, period of study September 2014 – February 2016
Finally, maximum hull surge and sway drift registered for head and beam seas were 0.23 m and
0.5 m. This is valid for the input waves mentioned, without any contribution of other source of
external loading as it can be the wind and other relevant sources.
Figure 59. Hull motions by Quasi-static and Dynamic Response Case 1. (a) Quasi-static 180°
heading; (b) Dynamic 180° heading; (c) Quasi-static 90° heading; (d) Dynamic 90° heading.

P 104 Ramón Acevedo
Master Thesis developed at West Pomeranian University of Technology, Szczecin
5.2 Case 2. Semi-Submerged vs Elevated Condition
With the results of the case 1, it is understood that dynamic effects must be considered when
evaluating the structure response of a WTIV in semi-submerged and elevated operational
condition. Furthermore the elevated condition commonly serves as design load case for the
major leg and jack-up structural element design however, industry had seen many structural
failures during transient phases. Thus is proposed to quantify and compare the loads perceived
by the structure in both operational conditions and verify the risk of operating in transient
phases.
Different inputs are defined according to each operational condition and further analysis is
performed varying the water depth in which the vessel is operating. The objective is to verify
how the structure response varies with the water depth since every change of geometry will
modify the structural dynamic response for both operational conditions. It is believe that for a
certain set of input parameters, the semi-submerged condition will represent a more critical case
than the elevated condition. Under this hypothesis, analysis are performed and results are given
in terms of total base shear, global overturning moment and hull displacements. Natural periods
of the structure are presented in the table 19 and 20, section 4.4.5.
Table 19. Input conditions. Design Parameters Case 2.
Water Depth 50 [m]
Max Hs Semi-submerged 2 [m]
Max Hs Survival 10 [m]
Elevated Hull Weight 14796600 [kg]
Leg Effective Length Factor 2.0 -
Number of legs 4.0
Leg OD 4.0 [m]
Leg Thickness 0.1 [m]
Leg ID 3.97 [m]
ϒf,D Load factor for deformation loads 1 -
ϒf,E Load factor for environmental loads 1.3 -
Representative Damping. Semi-submerged
-Sway 25 [%]
-Surge 15 [%]
Representative Damping. Survival
-Surge 7 [%]
-Sway 7 [%]

Global Response Analysis of Wind Turbine Installation Vessels in Semi-submerged Condition. A
Modified Quasi-Static Approach
105
“EMSHIP” Erasmus Mundus Master Course, period of study September 2014 – February 2016
Table 20. Jack-up system geometrical features. Case 1.
PARAMETERS SEMI-SUBMERGED ELEVATED UNIT
Distance between upper to lower guide 24000 24000 [mm]
L.G to base line 2250 2250 [mm]
Air Gap 0 10000 [mm]
Sea bed penetration 5000 5000 [mm]
Clearance of guides 20 20 [mm]
Fabrication Tolerances (e1) 10.00 10.00 [mm]
Hull Leg Clearances (e2) 41.46 41.46 [mm]
Heel of Platform (e3) 0.00 0.00 [mm]
Total Horizontal Offset (e0) 51 51 [mm]
To simulate a realistic case, the response of the structure is built considering the wave breaking
limit and the environmental wave limit exposure (Hs). In this way, structure response is
obtained for the maximum wave amplitudes and wave lengths that the vessel can face for each
operational condition and at a specific water depth. Table 21 list all the waves considered the
range of periods considered
Table 21. Waves considered for Simulation Model.
Wave Period
SEMI-SUBMERGED CONDITION SURVIVAL CONDITION
Wave Heights Wave Heights
30m WD 40m WD 50m WD 30m WD 40m WD 50m WD
[s] [m] [m] [m] [m] [m] [m]
1.0 0.20 0.20 0.20 0.20 0.20 0.20
1.3 0.40 0.40 0.40 0.40 0.40 0.40
1.5 0.50 0.50 0.50 0.50 0.50 0.50
2.0 0.90 0.90 0.90 0.90 0.90 0.90
2.5 1.40 1.40 1.40 1.40 1.40 1.40
3.0 2.00 2.00 2.00 2.00 2.00 2.00
4.0 2.00 2.00 2.00 3.50 3.50 3.50
4.5 2.00 2.00 2.00 4.50 4.50 4.50
5.0 2.00 2.00 2.00 5.50 5.50 5.50
5.5 2.00 2.00 2.00 6.70 6.70 6.70
6.0 2.00 2.00 2.00 7.90 8.00 8.00
6.5 2.00 2.00 2.00 9.20 9.30 9.40
7.0 2.00 2.00 2.00 10.00 10.00 10.00
8.0 2.00 2.00 2.00 10.00 10.00 10.00
8.5 2.00 2.00 2.00 10.00 10.00 10.00
9.0 2.00 2.00 2.00 10.00 10.00 10.00

P 106 Ramón Acevedo
Master Thesis developed at West Pomeranian University of Technology, Szczecin
Wave Period
SEMI-SUBMERGED CONDITION SURVIVAL CONDITION
Wave Heights Wave Heights
30m WD 40m WD 50m WD 30m WD 40m WD 50m WD
10.0 2.00 2.00 2.00 10.00 10.00 10.00
11.0 2.00 2.00 2.00 10.00 10.00 10.00
12.0 2.00 2.00 2.00 10.00 10.00 10.00
13.0 2.00 2.00 2.00 10.00 10.00 10.00
Calculations are performed and response of the structure is determined for both conditions.
Since the elevated condition is usually the design load case, our analysis will be focus to
compare the structure response in semi-submerged condition against the maximum values
reported for the base shear, vertical reaction forces, overturning moment and hull displacements
for the elevated condition. In this way if the response of the structure during the semi-
submerged condition results in larger loads and displacements, it will uncovered the importance
to study this condition since loads are expected to be bigger than the common design operational
condition. Input waves are the ones defined with the information given in table 10, section 4.5.1
and 4.5.3. Now, Results are now presented and discussed.
Figure 60 shows the structure base shear response for the waves considered for the 180° and
90° degrees heading of the semi-submerged condition. Additionally the structure is evaluated
at 30 m, 40 m and 50 m of water depth due to the significant differences of inertia. The dynamic
response of the elevated condition is evaluated and the maximum values for the base shear for
both headings are plotted as horizontal asymptotes to verify if the semi-submerged conditions
exceeds this load limits. A color code is used to identify easily the respective curves.
The figure 60-a corresponds to the total base shear response for 180° headings. In this case the
elevated condition governs in all the range of water depth considered. On the other hand, figure
62-b represents the response at 90° heading. It is observed that at 30m of water depth the semi-
submerged condition will prenset siginificant larger base shear than the elevated condition since
lowest inertias are reported at 30 m.
Waves for the semi-submerged condition are lower in amplitude due the design limit exposure
defined for each operational condition, but the effective force applied on the structure is larger
due to the hull area exposed to hydrodynamic loads.

Global Response Analysis of Wind Turbine Installation Vessels in Semi-submerged Condition. A
Modified Quasi-Static Approach
107
“EMSHIP” Erasmus Mundus Master Course, period of study September 2014 – February 2016
Figure 60. Total Base Shear – Case 2. (a) 180° heading; (b) 90° heading.
In both cases, loads on the cylindrical legs will tend to be the same in magnitude as long as the
wave amplitude is identical for both cases nonetheless, if the hull is exposed to hydrodynamic
pressures caused by wave loads, structure will percieve a substantial increment of the horizontal
load proportional to the projection of the hull wet area perpendicular to the wave heading. To
this will be added a uplift force coming from the wave buoyance.
As general comment, it is observed that with the increment of the water depth, either for head
or beam seas, the base shear will tends to increase which is expected due to the contirbution of
the P-Δ effect. This is attributable since leg deflections appear as a consequence of axial
compressive loads affecting the leg stability causing higher hull drift and so shear increments.

P 108 Ramón Acevedo
Master Thesis developed at West Pomeranian University of Technology, Szczecin
For 40m and 50m water, large base shear are also reported but the gap with the elevated
condition is reduced. However it is shown that besides the semi-submerged condition is
submitted to lower wave amplitudes than the elevated condition (wave heights of 10 m) shear
forces exceed the typical governing case.
Figure 61. Global Overturning Moment – Case 2. (a) 180° heading; (b) 90° heading.
Corning to the global overturning moment figure 61-a and 61-b display the response the semi-
submerged condition for head and beam seas respectively. Maximum moments registered for
the elevated condition are determined and represented as well as horizontal asymptotes. For
180° headings, the overturning stability limit is never ixceded the water dpeths considered.

Global Response Analysis of Wind Turbine Installation Vessels in Semi-submerged Condition. A
Modified Quasi-Static Approach
109
“EMSHIP” Erasmus Mundus Master Course, period of study September 2014 – February 2016
Contrary for 90° headings the overturning limit is exceded at 30 m water depth while for 40 m
and 50 m a safer gap is reported so elevated condition governs in terms of overturning moment.
Figure 62. Hull Surge and Sway motion – Case 2. (a) 180° heading; (b) 90° heading.
The influence of the water depth in the hull motions for the semi-submerged condition is now
studied. Figure 62-a and 62-b presents how the surge and sway motion varies with the excitation
of head and beam seas. It is observed that for both degrees of freedom, hull drift displacements
willl increase with larger water depths.

P 110 Ramón Acevedo
Master Thesis developed at West Pomeranian University of Technology, Szczecin
The maximum displacements are reported close to the respecive sructural natural periods of
each geometrical configuration. Furthermore the maximum values will be registered at large
wave incident periods, acreditable to the decrease of the structure stiffness when increasing the
water depth. Finally sway motion is always larger than the surge displacements where
maximum values where about 0.5 m, and for the surge motion around 0.2 m. When comparing
the hull displacements with the elevated condition, hull amplitudes are never exceeded.
Particularly for the Semi-submerged condition, eventought the inertia of the structure increases
with the water depth, this behave can be explained due to load in the legs simply since more
area is exposed to current loads and dynamic pressure.
To close this case of analysis, the table 22 summarize the findings of this study.
Table 22. Summary of limits exceeded. Semi-sub. Vs Elevated. Case 2.
PARAMETER HEADING 30m WD 40m WD 50m WD
Semi-Sub. Elevated Semi-Sub. Elevated Semi-Sub. Elevated
Base Shear 180° - x - x - x
90° x - x - x -
Overturning
Moment
180° - X - x - x
90° x - - x - x
Surge Drift 180° - x - x - x
90° NA NA NA NA NA NA
Sway Drift 180° NA NA NA NA NA NA
90° x - - x - x

Global Response Analysis of Wind Turbine Installation Vessels in Semi-submerged Condition. A
Modified Quasi-Static Approach
111
“EMSHIP” Erasmus Mundus Master Course, period of study September 2014 – February 2016
5.3 Case 3. Effect of Wet Hull Area on Lateral and Vertical Loading.
When the hydrostatic equilibrium is lost due to the jacking-up of the hull, the loading condition
of the vessel will change significantly. This study will verify the loading of a WTIV in transient
condition before the desired elevation for installation is achieved. This condition stills involve
the hull partly subgmerged.
During this transient condition, the wet hull area will decrease reducing the net wave loading
from the specific wave heading however, vertial compressive loads will increase significantly
since hydrostaic equilibrium is lost, and the weight of the structure will be dominant against the
buoyancy given by the displaced volume. Compresive loads legs are a source of lateral
isntability and they may increase base shear and overtutning moment if horizontal forces are
important.
It is proposed to verify how the net horizontal loads and the vertical loads change when varying
the hull wet area. For this four water lines are considered including the hydrostatic equilibrium
condition. These are 2.52 [m], 2[m], 1,5 [m] and 1[m] and just 1 water depth is analized.
Simulations are prepared applying waves of 1 [m] waves under and the site conditions
stablished in the table 13 for the Case 1. All simulations are run at 50 m water depth.
The table 23 shows how the changes of draft modifies the leg preloading based on the hull
elevated weight. Variations up to 50% are reached with the draft lines evaluated.
Table 23. Leg Preloading. Case 3.
Draft Immersed Volume Hull Elevated Weight Leg Pre-loading
[m] [m3] [MN]
2.52 13044 0.0 0.00%
2 9430 50.0 34.52%
1.5 9256 51.7 35.72%
1 6869 75.7 52.30%

P 112 Ramón Acevedo
Master Thesis developed at West Pomeranian University of Technology, Szczecin
The different drafts considered will modify the effective hull wet area exposed to hydrodynamic
loads produced by the incoming waves. In the table 24 and 25 its exposed the changes of hull
exposed area and maximum net drift forces acting on the vessel.
Its observed that a change of 1 [m] would mean a reduction between 30% and 40% of the area
which also means a reduction around 50% of the horizontal loading. This results will depend
on the hull shape though, since most of the WTIV have a barge-type hull significant reductions
as the ones found would be expected. Major reduction on the effective hull area is expected for
headings of 90°. Table 24 and 25 shows the changes of the hull projected wet area and the
changes of net pressure and net drift force.
Table 24. Changes of hull projected wet area. Case 3.
Draft Hull Projected Area Hull Area Reduction
90° 180° 90° 180°
[m] [m2] [m2] [%] [%]
2.52 311 106 0.0% 0.0%
2 225 84 27.7% 20.6%
1.5 220 63 29.0% 40.5%
1 164 42 47.3% 60.3%
Table 25. Changes of Net Pressure and Net drift force. Case 3.
Draf
t
Maximum Net Drift
Force
Drift Force
Reduction
Net Hydrodynamic Horizontal
Pressure
90° 180° 90° 180° 90° 180°
[m] [kN] [kN] [%] [%] [kPa] [kPa]
2.52 4982 1838 0.0% 0.0% 16.0 17.4
2 3616 1570 27.4% 14.6% 16.1 18.7
1.5 2713 1018 45.5% 44.6% 12.3 16.2
1 1936 938 61.1% 48.9% 11.8 22.3
The table 26 shows how the vertical forces will change for every loading condition, passing
from a harmonic load with a magnitude not higher than 20 [MN] in total, to 85 [MN]
compressive loads for the preloading considering. This compressive loads reported are the ones
causing the lateral instability and so the base shear and global overturning moment increments.
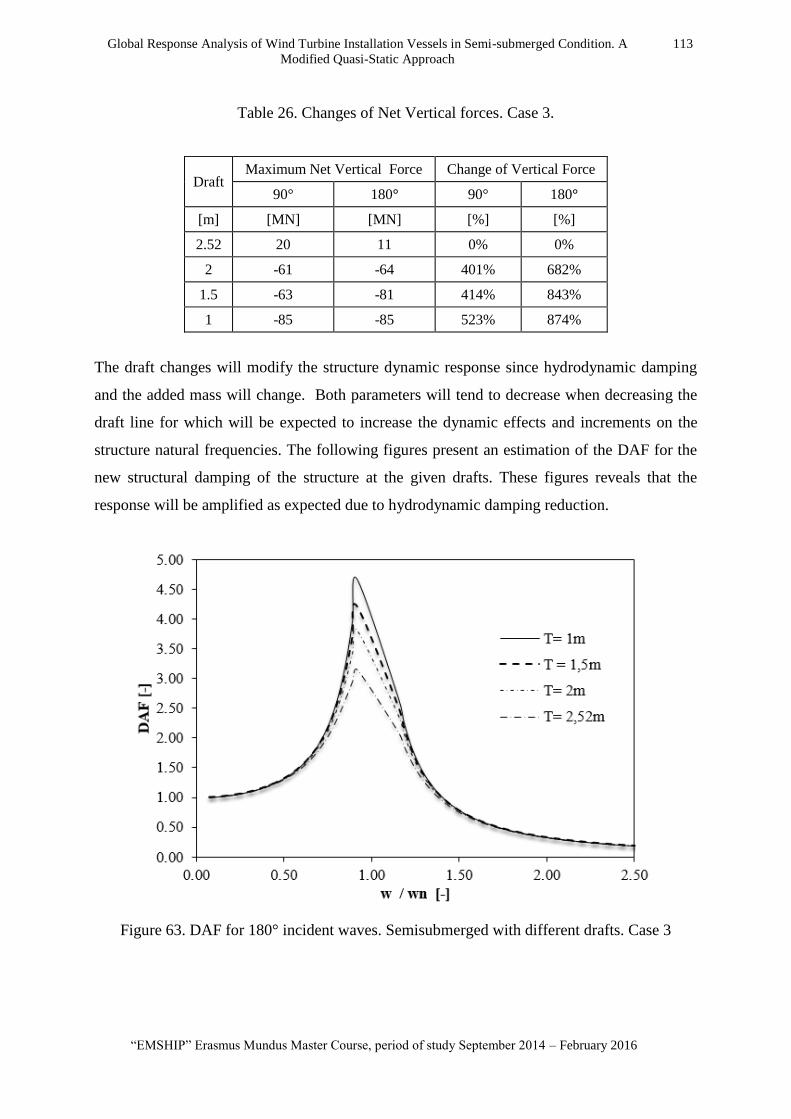
Global Response Analysis of Wind Turbine Installation Vessels in Semi-submerged Condition. A
Modified Quasi-Static Approach
113
“EMSHIP” Erasmus Mundus Master Course, period of study September 2014 – February 2016
Table 26. Changes of Net Vertical forces. Case 3.
Draft Maximum Net Vertical Force Change of Vertical Force
90° 180° 90° 180°
[m] [MN] [MN] [%] [%]
2.52 20 11 0% 0%
2 -61 -64 401% 682%
1.5 -63 -81 414% 843%
1 -85 -85 523% 874%
The draft changes will modify the structure dynamic response since hydrodynamic damping
and the added mass will change. Both parameters will tend to decrease when decreasing the
draft line for which will be expected to increase the dynamic effects and increments on the
structure natural frequencies. The following figures present an estimation of the DAF for the
new structural damping of the structure at the given drafts. These figures reveals that the
response will be amplified as expected due to hydrodynamic damping reduction.
Figure 63. DAF for 180° incident waves. Semisubmerged with different drafts. Case 3

P 114 Ramón Acevedo
Master Thesis developed at West Pomeranian University of Technology, Szczecin
Figure 64. DAF for 90° incident waves. Semisubmerged with different drafts. Case 3
Figure 65 shows the RAO for the base shear, global overturning moment and surge and sway
displacements for every condition evaluated. This calculations are made with the representative
damping of the structure for the conditions evaluated.
Here is observed that maximum values will slightly move to large periods. Far from resonance,
loads will decrease with decreaments of draft. However, amplifications are registered close to
the resonance generating hiegher amplitudes than for the hydrostatic equilibrium condition.
The findings of this analysis bring to the light the importance of accounting dynamic effects in
the semi-submerged condition since they can change drastically the structure response.

Global Response Analysis of Wind Turbine Installation Vessels in Semi-submerged Condition. A
Modified Quasi-Static Approach
115
“EMSHIP” Erasmus Mundus Master Course, period of study September 2014 – February 2016
Figure 65. DAF for 90° incident waves. Semisubmerged with different drafts. Case 3

P 116 Ramón Acevedo
Master Thesis developed at West Pomeranian University of Technology, Szczecin

Global Response Analysis of Wind Turbine Installation Vessels in Semi-submerged Condition. A
Modified Quasi-Static Approach
117
“EMSHIP” Erasmus Mundus Master Course, period of study September 2014 – February 2016
6 CONCLUSIONS
6.1 SUMMARY
A summary and relevant information is given product of the previous analysis, where are
discussed some considerations of the process for the global response analysis of Wind Turbine
Installation Vessels during semi-submerged and survival operational condition. Additional
comments regarding to the structural response of the structure in the semi-submerged condition
are also provided to describe the operational risk and safety related to it.
The analysis of the global response of a Wind Turbine Installation Vessel is a multi-physics
problem where high structural non-linearity’s and non-linearity’s of the external loading take
part at the same time. For this, big emphasis in the modelling techniques and considerations
should carefully and delicately prepared when performing such analysis. This since validation
of the simulations become a difficult task in the reality.
The information given in this document is considered to be very valuable since it has been
determined that operating in semi-submerged condition can compromise the vessel integrity
and safety during operation. The evidence of this work can be useful for design stages since its
compulsory the global understanding of the vessel operation and the physics behind it.
Thought it is not intended to evaluate a specific design, the author considers as significant
contribution to the field the following set of comments as result of the studies mentioned in this
document.
For the Hydrodynamic Modelling:
Methodologies for wave induced loads should be correctly defined to generate a good
representation of the loading acting on the structure studied. Linear Potential flow
solvers are well known in the industry for hydrodynamic load calculation when no
significant flow velocities or flow separation are expected. However, due to the presence
of high non-linear structural effects, non-linear wave loading should be considered
when evaluating the response of the structure in specific site conditions. I.e. second or
third order approximation should be used to determine the wave kinematics since
dynamic effects are expected.

P 118 Ramón Acevedo
Master Thesis developed at West Pomeranian University of Technology, Szczecin
Fifth order Stokes theory can be used for wave load calculation to account the wave non
linearity’s. However if irregular surfaces are to be considered, it is preferred to consider
CFD solvers to accurate describe the wave kinematics around the structure solid
boundaries.
For elements where the Morison Formulation is applicable, approximation will be
accurate enough when considering the wave kinematics determined from potential flow
theory. Previous studies had demonstrated that usage of RANS simulation with direct
numerical integration of the pressure around the surface won’t present meaningful
differences for this type of elements. Morison formulation will be enough to catch the
majority of effects without being conservative. (O. Moctar, 2009)
Methodologies for added mass estimation for multibody motion must be consider and
special attention should be given if the operating condition to be analyzed is semi
submerged jack-up condition.
For the Structural Modelling.
Geometry modelling will be an issue of special concern since the correct representation
of the structure stiffness, mass distribution and inertial properties will contribute on the
definition of the dynamic response of the structure. This will allow a realistic
representation of the non-uniform stress distribution and the global understanding of the
vessel respond to the considered loading.
Soil-Leg connection modeling will be an important aspect for the dynamic response
analysis of the structure. As commented by (M. Williams, 1999) it had been proved
applying non-linear modelling to the legs and spudcan footings that significant effect
on the rig dynamics are found when applying different leg-soil connections. The author
concludes affirming that the widespread practice of modelling the footings as simple
pinned supports may be non-conservative for some sea states.
Had been proved according to DNV OS C-104 that with the application of a
deterministic linear quasi-static approach the accuracy of the results won’t be
significantly reduced in comparison a deterministic non-linear dynamic analysis. This
information is valid even for large detailed models however, if specific site assessment
is requested it will be recommended to perform a deterministic non-linear dynamic
analysis in time domain due to the large non-linear effects of the problem.
Regarding to the semi-submerged condition.

Global Response Analysis of Wind Turbine Installation Vessels in Semi-submerged Condition. A
Modified Quasi-Static Approach
119
“EMSHIP” Erasmus Mundus Master Course, period of study September 2014 – February 2016
Changes in the geometrical configuration produced operating in lower or larger water
depths will significantly change the main inertial properties of the structure when
considering the seabed as point of rotation. It is found that at lower water depths and
when legs are attached to the seabed, the structure will be more susceptible to suffer
large surge or sway deformations under the same loading when comparing to larger
water depths.
Relevant differences are found for the structure response when using quasi-static and
dynamic analysis. It is known that for the elevated condition, dynamic effects are to be
significant if resonance effect is expected. Calculations demonstrate that dynamic
effects cannot be neglected when analyzing the semi-submerged condition since the
total base shear, global overturning bending moment, vertical reaction forces and hull
motions can present substantial increments.
Base shear can be also amplified by P-delta effects caused by large hull drift, Fabrication
tolerances as out-of-straightness, hull leg clearances and heel of platform. This
deformations combined with vertical load on each leg (hull elevated weight) will
generate additional overturning moments that increase the base reactions in the plane.
The amplification will depend on the ratio between the vertical axial load and the Euler
limit which define the leg lateral stability under axial loads.
When hydrostatic equilibrium is lost and hull continues partly submerged, structure
response will continue being critical since besides wave loading presents a decrease of
30% or 40% of horizontal loading, global damping of the structure will reduce causing
larger amplifications due to resonance effect.
Depending on the location where the vessel will operate, the structure response under
dynamic loading can vary meaningfully. It has been registered for a set of water depths
that the elevated condition will mostly govern in terms of base shear, global overturning
moment and hull drift. However, for a given water depth it is found that the semi-
submerged condition exceed the limits registered during the elevated condition. This
reveals a high risk condition that many vessels can be exposed since for smaller
deformations of the structure, the response can be dramatically affected compromising
the structural integrity. I.e. operation in lower water depths can compromise the vessel
integrity and safety of his operators.

P 120 Ramón Acevedo
Master Thesis developed at West Pomeranian University of Technology, Szczecin
6.2 Recommendations for Further Work
The investigation performed resulted in a comprehensive analysis on the dynamic response of
WTIV under the conditions established. Additionally it is crucial to remark that simulations
performed were not focus for the evaluation of a specific rig design and since simplifications
where considered for the simulation model, still remain activities that must be performed for
the validation the results found.
For Hydrodynamic simulations, it is known that usage of CFD techniques by potential flow
solvers will offer reliable results however, due to the presence of non-linear effects and for the
better representation of the hydrodynamic effects, more detailed analysis should be done:
Potential flow theory should consider higher orders when determining the velocity
potential to account the influence of frequency harmonics in the structure response.
Constant current velocity profile is considered for drag linearization purposes however,
this might be a conservative assumption, useful for early design stages. If detailed site
assessment is requested, drag forces should not be linearized and irregular velocity
profiles should be considered with information provided from a professional study of
the site where the platform will operate.
Vortex induced vibrations will be a phenomena that might affect the structure response.
Dynamic response of the structure in semi-submerged condition should be evaluated
under this condition meanwhile besides low wave heights will be expected, load
amplification can appear due to resonance effect.
For the structural analysis, a detailed structural model will always offer a better representation
of the vessel stiffness, mass, and inertial properties. Nonetheless solving the structural model
with a quasi-static approach will neglect the majority of the effects on the structure offering
non-realistic results. Usage of DAF will be a feasible solution in terms time consuming without
compromising significantly the accuracy of the results. It is proposed that DAF methods for
dynamic response analysis should be used just for early design stages since many non-linear
effects take part at the same time. Thus non-linear dynamic forced response analysis should be
considered.

Global Response Analysis of Wind Turbine Installation Vessels in Semi-submerged Condition. A
Modified Quasi-Static Approach
121
“EMSHIP” Erasmus Mundus Master Course, period of study September 2014 – February 2016
Boundary conditions defined at the soil leg connection are commonly modelled as pinned
boundary conditions. However this will modify the dynamic response of the structure resulting
in non-conservative results for some sea states (M. Williams, 1999). Thus recognized modelling
techniques for soil-structure interaction should considered for the correct representation of the
structure capacity. This will lead to a correct representation the leg fixation and realistic
representation of the stress distribution on the legs and its components (V. Daun, 2014).
Regarding to the type of simulation, deterministic approach can be used if interested in the non-
uniform stress distribution on the structure under the specified loading. Frequency domain
analysis will be useful to represent the structure response under linear regular waves at specific
headings. Nonetheless vessel will face in the reality the exposure to non-linear waves and
irregular sea states so it will be recommended to perform a time domain analysis and study

P 122 Ramón Acevedo
Master Thesis developed at West Pomeranian University of Technology, Szczecin

Global Response Analysis of Wind Turbine Installation Vessels in Semi-submerged Condition. A
Modified Quasi-Static Approach
123
“EMSHIP” Erasmus Mundus Master Course, period of study September 2014 – February 2016
7 REFERENCES
[1] Allistair Walter, KW Ltd. (2004). Review of structural modelling of deep water jack
up structures. Health and Safety Executive.
[2] Det Norske Veritas OS-C101. (2011, April). Design of Offshore Steel Structure
General (LRFD Method).
[3] Det Norske Veritas OS-C104 . (2014, October). Structural Design of Self-Elevating
Units (LRFD Method).
[4] Det Norske Veritas OS-J301. (2013, April). "Wind Turbine Installation Untis".
[5] Det Norske Veritas RP-104. (2012, November). Self Elevating Units.
[6] Det Norske Veritras OS-C201. (2004, July). Structural Design of Offshore Untis
(WSD Method).
[7] Det Norske Vertias RP-C205. (2007, April). Environmental conditions and
Environmental loads.
[8] E.J. Greeves, B. J. (1995). Evaluating Jack-up Dynamic Response Using Frequency
Domain Methods and the Inertial Load Set Technique. ELSEVIER, 102-128.
[9] Fatilsen, O. (1993). Sea Loads on Ships and Offshore Structures. Cambridge: Press
Syndicate of the University of Cambridge.
[10] J. Juncher Jensen a, A. E. (1991). Reliability of Jack-up Platforms Against
Overturning. ELIEVES.
[11] J.Y. Lu, G. M. (2011). Jackup Leg and Jacking System Design Loads in Transient
Phases. City University Jackup Conference.
[12] Knude hansen. (n.d.). knude Hansen. Retrieved from
http://www.knudehansen.com/news/news-from-knud-e-hansen-as/2012/2012-10-25-
record-breaking-wind-turbine-installation-vessels-%E2%80%9Dpacific-
orca%E2%80%9D-%E2%80%9Dpacific-osprey%E2%80%9D/
[13] M. Howarth, A. D. (2004). Jack-up response to wave-in-deck loads during extreme
storms. ELSEVIER, 275–290.
[14] M. Williams, R. G. (1999). A parametric study of the non-linear dynamic behaviour of
an offshore jack-up unit. Engineering Structures 21, 383–394.
[15] Maritime-Connector. (n.d.). Maritime-Connector. Retrieved 06 16, 2015, from
http://maritime-connector.com/wiki/offshore-industry/

P 124 Ramón Acevedo
Master Thesis developed at West Pomeranian University of Technology, Szczecin
[16] Mateja, A. (2014). Procedure of environmental loads determination for Self-Elevating
Wind Turbine Installation Unit in elevated condition. Gdansk University of
Technology.
[17] MODEC. (n.d.). MODEC. Retrieved 06 15, 2015, from
http://www.modec.com/about/industry/oil_gas.html
[18] O. Moctar, T. S. (2009). Wave Load and Structural Analysis for a Jack-Up Platform in
Freak Waves. Journal of Offshore Mechanics and Arctic Engineering.
[19] S.E. Hirdaris, W. D. (2013). Loads foruseinthedesignofshipsandoffshorestructures.
ELSEVIER.
[20] V. Daun, F. O. (2014). Impact loads on a self-elevating unit. Master’s thesis 2014:X-
14/299. Göteborg, Sweden: Chalmers University of Technology.
[21] Williams MS, T. R. (1997). Non-linear Dynamic Analysis of Offshore Jack-up Units.
University of Oxford, Department of Engineering Science.
[22] X.M. Tan, J. L. (2003). Structural behavior prediction for jack-up units during jacking
operations. ELSEVIER, 2409-2416.
[23] X.M. Wang, C. K. (2013). Subbstructural identification of jack-up platform in time
and frequency domains. ELSEVIER, 53-62.

Global Response Analysis of Wind Turbine Installation Vessels in Semi-submerged Condition. A
Modified Quasi-Static Approach
125
“EMSHIP” Erasmus Mundus Master Course, period of study September 2014 – February 2016
AKNOWLEDGEMENT
I would like to thank Professors Maciej Taczała, Lionel Gentaz, and Pierre Ferrant
for the support given during the internship and for the guidance during the process
for the preparation of this work. I extend my gratitude to Professor Dario Boote
to review my project, and so to Professor Philippe Rigo and Zbigniew Sekulski
who always dedicated their time to follow our activities to guarantee the highest
quality of our work; to all the professors and lecturers who taught and encouraged
me and my colleagues; to all staffs in ULG, ECN and ZUT, specially to Christine
Reynders for her patience and dedication to help me with all administrative affairs
and other issues till the last days of the Master, thank you very much.
Specials thanks to my mentor in in DNV GL – Gdynia, Domink Krupa, due to his
willingness to attend my doubts and for the constructive discussions an insights
regarding the project. The learning that I got from his person – both personal and
professional, is something that I will always appreciate. To all the colleagues from
the Approval Office, many thanks for the moments shared which made my stay
more enjoyable.
To all my colleagues form the EMSHIP program, because you became part of my
family. I can’t imagine go through this incredible experience without meeting you
all. Our adventures and moments shared will always remain in my mind and
hopefully, I will meet all of you many times again in the future. Special thanks to
Rodrigo, Marcos and Alessandro, my partners, my friends, you are now part of
my family, my 3 new brothers. Many thanks to Adrian, Dogukan and Atakan, for
all the moments we shared during our stay in Poland, you were the best partners
I could had. I look forward to meet you soon again.

P 126 Ramón Acevedo
Master Thesis developed at West Pomeranian University of Technology, Szczecin
To all my new friends spread all over the world, who kindly open their arms and
with whom I shared unforgettable memories. To Juliette Clement and her family,
especially Philippe, Isabelle and Marc, to receive my brother and me in your house
and treat us like family. For all the moments and laughs we shared, and the many
ones to come, thank you.
To my friends Carlos Davila, Carlos Aponte, Julio Roa, Jonathan Melian, Pablo
Gutierrez, Luis Iñaki, Gonzalo Silva, Joaquin Ortega, Marcel Casas, Carolina
Rodrigues, Marie Branquart, Patricia Granados, Maria Gabriela Jimenez and
Adriana Goncalves. Our friendship can overcome the longest distances. Thanks
for the long conversations and laughs. You made my days different when I can be
or talk with you.
Finally to my family, for their unconditional love and support. You are the ones
that push me to overcome my limits. You are the ones that made all my
achievements possible. You made me the person I am today.