Embed Size (px)
Citation preview

1092 VOLUME 14J O U R N A L O F C L I M A T E
q 2001 American Meteorological Society
Global Precipitation and Thunderstorm Frequencies.Part I: Seasonal and Interannual Variations
AIGUO DAI
National Center for Atmospheric Research,* Boulder, Colorado
(Manuscript received 24 January 2000, in final form 8 May 2000)
ABSTRACT
Present and past weather reports from ;15 000 stations around the globe and from the Comprehensive Ocean–Atmosphere Data Set from 1975 to 1997 were analyzed for the frequency of occurrence for and the percentage ofthe days with various types of precipitation (drizzle, nondrizzle, showery, nonshowery, and snow) and thunderstorms.In this paper, the mean geographical, seasonal, and interannual variations in the frequencies are documented. Drizzlesoccur most frequently (;5%–15% of the time) over mid- and high-latitude oceans. Nonshowery precipitation isthe preferred form of precipitation over the storm-track regions at northern mid- and high latitudes in boreal winterand over the Antarctic Circumpolar Current in all seasons. Showery precipitation occurs ;5%–20% of the timeover the oceans, as compared with , 10% over land areas except in boreal summer over Northern Hemisphereland areas, where showery precipitation and thunderstorms occur in over 20% of the days. Inferred mean precipitationintensity is generally , 1.0 mm h21 at mid- and high latitudes and ;1.5–3.0 mm h21 in the Tropics. The intertropicalconvergence zone and the South Pacific convergence zone are clearly defined in the frequency maps but not inthe intensity maps. Nonshowery precipitation at low latitudes is associated with showery precipitation, consistentwith observations of stratiform precipitation accompanying mesoscale convective systems in the Tropics. Theseasonal cycles of the showery precipitation and thunderstorm frequencies exhibit a coherent land–ocean patternin that land areas peak in summer and the oceans peak in winter. The leading EOFs in the nondrizzle and nonshoweryprecipitation frequencies are an ENSO-related mode that confirms the ENSO-induced precipitation anomalies overthe open oceans previously derived from satellite estimates.
1. Introduction
Precipitation has many characteristics, such asamount, frequency of occurrence,1 intensity, phase, andtype or form (e.g., drizzle, showery, nonshowery, rain,snow, etc.). Documentation of precipitation has tradi-tionally focused on precipitation amounts (e.g., Jaeger1983; Legates and Willmott 1990; New et al. 1999).This is partly because most observations (e.g., raingauge records) only measure the total amount of pre-cipitation accumulated within a certain period of time.Global climatologies of monthly precipitation amountshave been improved considerably during the last decadebecause of improvements in satellite-based estimates ofprecipitation over the oceans (e.g., Xie and Arkin 1997).Our knowledge of the other characteristics of precipi-
1 The frequency of occurrence is defined here as the number ofreports of a precipitation type or thunderstorms divided by the numberof total weather reports expressed in a fraction or percentage. It isalso referred to as precipitation frequency in this paper.
* The National Center for Atmospheric Research is sponsored bythe National Science Foundation.
Corresponding author address: A. Dai, National Center for At-mospheric Research, P.O. Box 3000, Boulder, CO 80307-3000.E-mail: [email protected]
tation is, however, still very poor on a global scale. Forexample, there are no global climatologies of frequencyof occurrence for all-form precipitation or precipitationtypes. Such climatologies are needed for evaluatingmodel-simulated precipitation, which tends to havehigher-than-observed precipitation frequency (Chen etal. 1996; Dai et al. 1999). Information of precipitationtypes (e.g., showery precipitation) can be applied tostudy precipitation processes such as moist convection.
Observational data of precipitation frequency, inten-sity and type are sparse on a global scale. Global cli-matologies of thunderstorm days based on station andshipboard data before 1975 were summarized by Courtand Griffins (1983) and Sanders and Freeman (1983).Over the United States, spatial (Court and Griffins 1983;Easterling 1991) and diurnal (Wallace 1975; Easterlingand Robinson 1985) variations of thunderstorm activityhave been investigated. Climatologies of precipitationfrequency (Higgins et al. 1996), its diurnal variation(Wallace 1975; Dai et al. 1999), and recent changes inthe diurnal cycle of precipitation (Dai 1999) over theUnited States have also been documented. Outside theUnited States, Petty (1995) analyzed shipboard present-weather reports and showed seasonal maps of precipi-tation frequencies at various intensities over the oceans.

15 MARCH 2001 1093D A I
Present and (recent) past weather reports from landstations and ships provide valuable information aboutprecipitation frequency, intensity, phase, and type. Al-though these reports potentially contain various biases(discussed below; also see Petty 1995), they representone of the best available observations of precipitationcharacteristics on a global scale.
In this study, we derive global climatologies of thefrequency of occurrence for various types of precipi-tation by analyzing present and past weather reportsfrom about 15 000 weather stations around the globeand from the Comprehensive Ocean–Atmosphere DataSet (COADS) from 1975 to 1997. Mean precipitationintensity is also inferred from the frequency and pre-cipitation amounts (from Xie and Arkin 1997). Thetypes of precipitation analyzed include drizzle, non-drizzle precipitation (including all types of precipitationexcept drizzle), showery precipitation, nonshowery pre-cipitation, thunderstorms, and snow. Here we focus onthe geographical, seasonal, and interannual variations inthe frequencies for these types of precipitation and thun-derstorms. In Part II of this study (Dai 2001a), we shallinvestigate their diurnal variations. To the best of ourknowledge, this study represents the first attempt to doc-ument the frequency of occurrence for various types ofprecipitation and thunderstorms on a truly global scale.
2. Data and analysis method
a. Datasets
The present2 (WMO code ‘‘ww’’) and past3 (WMO code‘‘W1’’) weather code data were extracted from the GlobalTelecommunication System (GTS) synoptic weather re-ports archived at the National Center for Atmospheric Re-search (NCAR) (DS464.0, http://www.scd.ucar.edu/dss/datasets/ds464.0.html). This surface dataset, which coversthe time period from February 1975 to present and has avolume of about 2.5 GB per year, contains 3-hourly [0000,0300, 0600 Coordinated Universal Time (UTC), etc.] ob-servations of all the major meteorological variables, in-cluding present and past weather information in codedformats. The total number of fixed land and island stationsexceeds 15 000 in the dataset, but there are only about4000–7000 stations having weather reports at any giventime. The weather codes are defined specifically by theWorld Meteorological Organization (WMO; WMO 1988).Tables 1 and 2 list the possible values of ww and W1 andtheir corresponding weather phenomena for manned sta-tions or ship observations. Since 1 January 1982, weatherreports from certain automatic stations use slightly differ-ent code tables (WMO 1988).
2 At the time of observation or during the preceding hour.3 The past 6 h for observations at 0000, 0600, 1200, and 1800
UTC, and the past 3 h for observations at 0300, 0900, 1500, and2100 UTC; see WMO (1988).
Although there are shipboard weather reports in theabove data set, the coverage is poor over the oceans.We therefore extracted the 3-hourly shipboard presentand past weather reports from the COADS (Woodruffet al. 1993; the 1999 release was used) for the 1975–97 period (COADS data after 1997 had not been re-leased).
Because of their near-global coverage and relativelyhigh temporal resolution, the surface synoptic data havebeen used to study diurnal and semidiurnal variations inglobal surface pressure (Dai and Wang 1999) and surfacewinds and divergence (Dai and Deser 1999), and vari-ations in cloudiness (Warren et al. 1988; Norris 1998).
The weather codes, like cloud reports, are made bya trained human observer (except for a still relativelysmall number of automatic stations where sophisticatedsensors and other schemes are used to derive weathercondition reports). Although the guidelines on ww andW1 are fairly specific (WMO 1988), these observationscontain only qualitative information about precipitationcharacteristics (intensity, phase, and type). Quantitativemeasurements of precipitation are not available in thesedatasets. The quality of the weather code data is affectedby changes in the WMO guidelines and coding prac-tices, observer biases (such as preference to certainweather codes), ships’ tendency to avoid bad weather,poor sampling over the oceans, and other problems (Pet-ty 1995). The major inhomogeneities in these data arediscussed below. Despite these problems, the weathercodes contain valuable information about precipitationfrequency, intensity, phase, and type. Here we used themto document the geographical, seasonal, and interannualvariations in the frequency of occurrence for varioustypes of precipitation and thunderstorms.
Figure 1 shows the temporal evolution of annualcount of ww reports from all stations and ships (solidcurves), together with the count of ww reports made byhuman observers (short-broken curves, overlays the sol-id curve for COADS reports). The COADS data after1997 were not available (marine reports after 1997 inFig. 1 are from DS464.0). In 1997, a change in thearchiving format of DS464.0 was also introduced. Wetherefore did not use the data after 1997. During the1975–97 period (except for 1975 and 1997), the numberof reports from land stations is relatively stable, whilethe count of marine reports decreases gradually. A mod-erate drop in the number of reports occurs around 1981/82, when a new coding practice4 was introduced.
Figure 1 also shows the annual count of Ix (long-
4 The major changes in coding practice around 1 January 1982include: a) nonsignificant phenomena (e.g., ww 5 01–03) can beomitted; b) Ix, an indicator for type of station operation (manned orautomatic) and for present and past weather codes, is added [codetable 1860, WMO (1988)]; and c) new code tables for certain au-tomatic stations [code Table 4680 for ww and 4531 for W1, WMO(1988)] were introduced.

1094 VOLUME 14J O U R N A L O F C L I M A T E
TABLE 1. WMO present weather codes.
Codefigureww Weather description
ww 5 00–49 No precipitation at the station at the time of observation
ww 5 00–19 No precipitation, fog, ice fog (except for 11 and 12), duststorm, sandstorm, drifting or blowing snow at the station at thetime of observation or, except for 09 and 17, during the preceding hour
No meteorsexceptphotometeors
00010203
Cloud development not observed or not observableClouds generally dissolving or becoming less developedState of sky on the whole unchangedClouds generally forming or developing
Characteristic changeof the state of skyduring the pasthour
Haze, dust, sandor smoke
04
05
06
07
08
09
Visibility reduced by smoke, e.g., veldt or forest fires, industrial smoke, or volcanicashes
HazeWidespread dust in suspension in the air, not raised by wind at or near the station at
the time of observationDust or sand raised by wind at or near the station at the time of observation, but no
well-developed dust whirl(s) or sand whirl(s), and no duststorm or sandstorm seen;or, in the case of ships, blowing spray at the station
Well-developed dust whirl(s) or sand whirl(s) seen at or near the station during the pre-ceding hour or at the time of observation, but no duststorm or sandstorm
Duststorm or sandstorm within sight at the time of observation, or at the station duringthe preceding hour
10 Mist1112
PatchesMore or less contin-
uous
shallow fog or ice fog at the station, whether on land orsea, not deeper than about 2 meters on land or 10 me-ters at sea
13 Lightning visible, no thunder heard
14 Precipitation within sight, not reaching the ground or the surface of the sea15 Precipitation within sight, reaching the ground or the surface of the sea, but distant,
i.e., estimated to be more than 5 km from the station16 Precipitation within sight, reaching the ground or the surface of the sea, near to, but
not at the station17 Thunderstorm, but no precipitation at the time of observation1819
SquallsFunnel cloud(s)
at or within sight of the station during the precedinghour or at the time of observation
ww 5 20–29 Precipitation, fog, ice fog, or thunderstorm at the station during the preceding hour but not at the time of observation2021222324
Drizzle (not freezing) or snow grainsRain (not freezing)SnowRain and snow or ice pelletsFreezing drizzle or freezing rain
not falling as show-er(s)
2526272829
Shower(s) of rainShower(s) of snow, or of rain and snowShower(s) of hail**, or of rain and hailFog or ice fogThunderstorm (with or without precipitation)
ww 5 30–39 Duststorm, sandstorm, drifting or blow snow
30
31
32
Slight or moderateduststorm or sand-storm
—has decreased during the preceding hour—no appreciable change during the preceding hour—has begun or has increased during the preceding hour
33
34
35
Severe duststorm orsandstorm
—has decreased during the preceding hour—no appreciable change during the preceding hour—has begun or has increased during the preceding hour

15 MARCH 2001 1095D A I
TABLE 1. (Continued )
Codefigureww Weather description
ww 5 30–39 Duststorm, sandstorm, drifting or blow snow3637
Slight or moderate drifting snowHeavy drifting snow
generally low (beloweye level)
3839
Slight or moderate blowing snowHeavy blowing snow
generally high(above eye level)
ww 5 40–49 Fog or ice fog at the time of observation
40Fog or ice fog at a distance at the time of observation, but not at the station during the
preceding hour, the fog or ice fog extending to a level above that of the observer41 Fog or ice fog in patches4243
Fog or ice fog, sky visibleFog or ice fog, sky invisible
has become thinner during the precedinghour
4445
Fog or ice fog, sky visibleFog or ice fog, sky invisible
no appreciable change during the preced-ing hour
4647
Fog or ice fog, sky visibleFog or ice fog, sky invisible
has begun or has become thicker duringthe preceding hour
4849
Fog, depositing rime, sky visibleFog, depositing rime, sky invisible
ww 5 50–99 Precipitation at the station at the time of observationww 5 50–59 Drizzle
5051
Drizzle, not freezing, intermittentDrizzle, not freezing, continuous
slight at time of observation
5253
Drizzle, not freezing, intermittentDrizzle, not freezing, continuous
moderate at time of observation
5455
Drizzle, not freezing, intermittentDrizzle, not freezing, continuous
heavy (dense) at time of observation
56575859
Drizzle, freezing, slightDrizzle, freezing, moderate or heavy (dense)Drizzle and rain, slightDrizzle and rain, moderate or heavy
ww 5 60–69 Rain6061
Rain, not freezing, intermittentRain, not freezing, continuous
slight at time of observation
6263
Rain, not freezing, intermittentRain, not freezing, continuous
moderate at time of observation
6465
Rain, not freezing, intermittentRain, not freezing, continuous
heavy at time of observation
66676869
Rain, freezing, slightRain, freezing, moderate or heavyRain or drizzle and snow, slightRain or drizzle and snow, moderate or heavy
ww 5 70–79 Solid precipitation not in showers7071
Intermittent fall of snowflakesContinuous fall of snowflakes
slight at time of observation
7273
Intermittent fall of snowflakesContinuous fall of snowflakes
moderate at time of observation
7475
Intermittent fall of snowflakesContinuous fall of snowflakes
heavy at time of observation
76777879
Diamond dust (with or without fog)Snow grains (with or without fog)Isolated star-like snow crystals (with or without fog)Ice pellets
ww 5 80–99 Showery precipitation, or precipitation with current or recent thunderstorm808182838485
Rain shower(s), slightRain shower(s), moderate or heavyRain shower(s), violentShower(s) of rain and snow mixed, slightShower(s) of rain and snow mixed, moderate or heavySnow shower(s), slight

1096 VOLUME 14J O U R N A L O F C L I M A T E
TABLE 1. (Continued )
Codefigureww Weather description
ww 5 80–99 Showery precipitation, or precipitation with current or recent thunderstorm86 Snow shower(s), moderate or heavy87
88
Shower(s) of snow pellets or small hail, with or withoutrain or rain and snow mixed
—slight
—moderate or heavy
89
90
Shower(s) of hail*, with or without rain or rain andsnow mixed, not associated with thunder
—slight
—moderate or heavy
9192
93
94
Slight rain at time of observationModerate or heavy rain at time of observa-
tionSlight snow, or rain and snow mixed, or
hail** at time of observationModerate or heavy snow, or rain and snow
mixed, or hail** at time of observation
thunderstorm during the precedinghour but not at time of observa-tion
95
96
97
98
99
Thunderstorm, slight or moderate, withouthail**, but with rain and/or snow at timeof observation
Thunderstorm, slight or moderate, withhail** at time of observation
Thunderstorm, heavy, without hail**, butwith rain and/or snow at time of obser-vation
Thunderstorm combined with duststorm orsandstorm at time of observation
Thunderstorm, heavy, with hail** at timeof observation
thunderstorm at time of observation
* French: grele.** Hail, small hail, snow pellets. French: grele, gresil ou neige roulee.
TABLE 2. WMO past weather codes.
W—Weather during past hour
W1
W2
Past weather
Codefigure Weather description
0 Cloud covering ½ or less of the sky throughoutthe appropriate period
1 Cloud covering more than ½ of the sky duringpart of the appropriate period and covering ½or less during part of the period
2 Cloud covering more than ½ of the skythroughout the appropriate period
3456789
Sandstorm, duststorm, or blowing snowFog or ice fog or thick hazeDrizzleRainSnow, or rain and snow mixedShower(s)Thunderstorm(s) with or without precipitation
broken curves), an indicator for type of station operationand for present and past weather codes. The Ix is neededfor determining whether ww and W1 are omitted becauseof no significant phenomenon to report (Ix 5 2 or 5),or because of no observations (Ix 5 3 or 6). Figure 1
shows that the count of Ix in marine reports increasesfrom January 1982 to December 1984, indicating thatthe new coding practice took a few years to becomefully implemented for ship observations. To minimizethe effect of missing Ix, we set ww 5 03 when ww andIx are both missing and total cloud cover is #7 octas.This was found to have only a minor effect on the results.
Figure 2 shows the geographical distribution of thecount of ww reports within each 28 lat 3 28 long gridbox during 1975–97 for December–February (DJF; sim-ilar for the other seasons). It can be seen that the numberof ww reports is very large (up to 2 3 105) over mostland boxes at northern middle and low latitudes (exceptthe Saharan desert and the Himalaya mountains). Thecount is also large (103–104) over the North Atlantic,the North Pacific, and the ship routes at low latitudes.The number of ww reports is ,100 over the southernoceans (south of ;458S), the polar regions, and thesparsely populated land areas (such as central Australia,central Africa, and northern Canada), where our resultsare less reliable and should be interpreted with caution.
b. Analysis method
Petty (1995) classified the precipitating weather codeslisted in Table 1 into 31 groups based on the intensity,

15 MARCH 2001 1097D A I
FIG. 1. Time series of annual counts of present weather (ww) reportsfrom fixed stations (thin curves) and ships (thick curves). The solidcurves are counts from both manned and automatic station operations,and the short-broken curves (overlying the solid curve for the marinereports before 1998) are counts from manned station operation only.The long-broken curves are counts of all Ix (an indicator for stationoperation and weather codes) reports, which are available only after1 Jan 1982.
FIG. 2. Geographical distribution of the number of present weather reports within each 28 lat 328 long grid box for DJF during 1975–97. Blank areas have no or fewer than 10 reports. Plots forthe other seasons are similar.
phase, and character of precipitation. In this study, weshall focus on those precipitation types that have dif-ferent underlying physics, such as drizzle, nonshowery,and showery precipitation. Precipitation events includ-ing all forms but drizzle (referred to as nondrizzle pre-cipitation hereinafter) are a class that closely resemblesprecipitation events recorded by rain gauges and thuscan be compared with rain gauge data. Thunderstormsand snow are also of interest to many applications andwill be analyzed as well. The present weather codeswere used to compute the frequency of occurrence fordrizzle, nondrizzle precipitation (AllPrc), nonshoweryprecipitation (NonShw), showery precipitation (Shw-
Prc), thunderstorms (including nonprecipitating ones),and snow. The corresponding code values of ww forthese types of precipitation/thunderstorm events are list-ed in Table 3. In most cases, the ww code table formanned station operation (Table 1) is specific enoughfor categorizing the precipitation types using ww.5 In afew cases, the code description is ambiguous regardingthe occurrence of precipitation (ww 5 29) or precipi-tation types (ww 5 24). We had to make a choice inthese cases (e.g., we counted ww 5 24 and 29 as AllPrcevents). For ww 5 93–94, snow is assumed if the stationair temperature is less than 0.58C. Tests showed that theresults are insensitive to these choices.
For the very small number of automatic stations (Fig.1), the code table [WMO (1988) code table 4680] isless specific than Table 1. For the present weather codefrom these stations (wawa), we counted the observationas missing or not available if the code is too genericfor determining a specific precipitation type. For ex-ample, for wawa 5 21 (precipitation) there is no infor-mation regarding precipitation type and thus no obser-vation is available for all the precipitation types exceptfor AllPrc. The automatic weather codes have only mi-nor effects on the results due to the relatively smallnumber of automatic stations (see Fig. 1).
To derive the frequency of occurrence for the six typesof precipitation/thunderstorm events, we counted all thepresent weather reports by season for each 28 lat 3 28
5 According to the WMO manual on codes (WMO 1988), the high-est possible code value should be assigned to a weather phenomenon.Therefore, showery precipitation is assigned code values 80–99whereas rain (60–69) is nonshowery precipitation.
1098 VOLUME 14J O U R N A L O F C L I M A T E
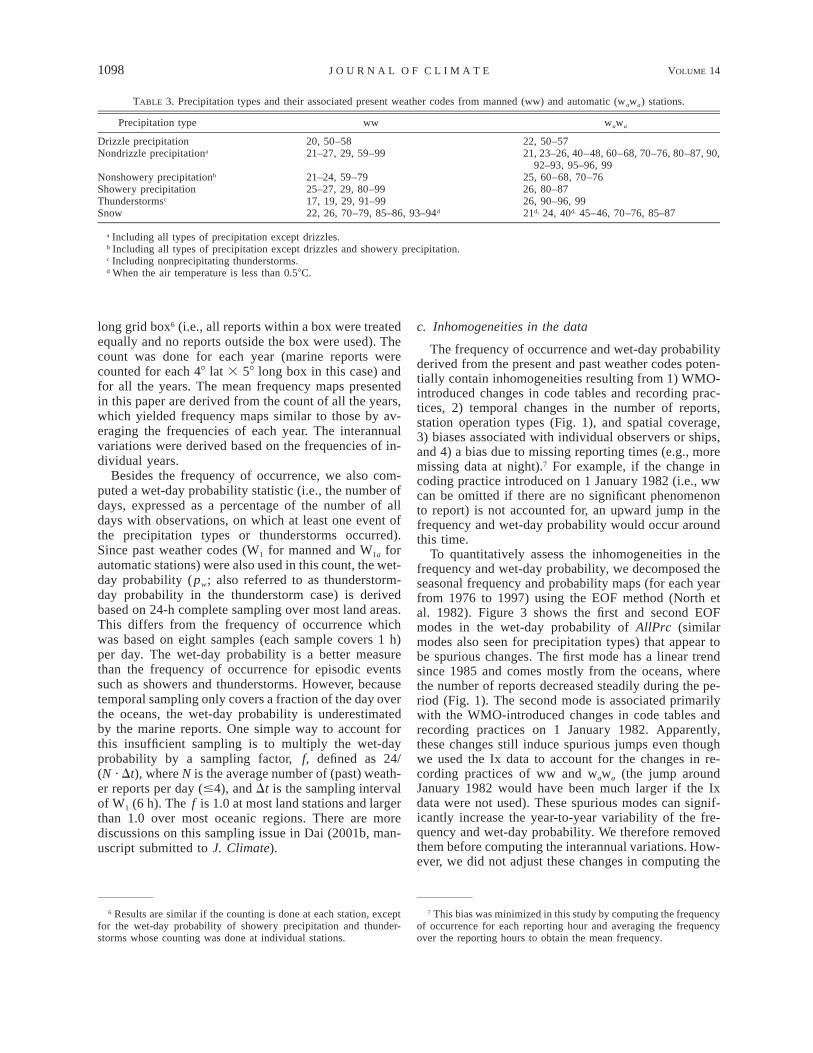
TABLE 3. Precipitation types and their associated present weather codes from manned (ww) and automatic (wawa) stations.
Precipitation type ww wawa
Drizzle precipitation 20, 50–58 22, 50–57Nondrizzle precipitationa 21–27, 29, 59–99 21, 23–26, 40–48, 60–68, 70–76, 80–87, 90,
92–93, 95–96, 99Nonshowery precipitationb 21–24, 59–79 25, 60–68, 70–76Showery precipitation 25–27, 29, 80–99 26, 80–87Thunderstormsc 17, 19, 29, 91–99 26, 90–96, 99Snow 22, 26, 70–79, 85–86, 93–94d 21d, 24, 40d, 45–46, 70–76, 85–87
a Including all types of precipitation except drizzles.b Including all types of precipitation except drizzles and showery precipitation.c Including nonprecipitating thunderstorms.d When the air temperature is less than 0.58C.
long grid box6 (i.e., all reports within a box were treatedequally and no reports outside the box were used). Thecount was done for each year (marine reports werecounted for each 48 lat 3 58 long box in this case) andfor all the years. The mean frequency maps presentedin this paper are derived from the count of all the years,which yielded frequency maps similar to those by av-eraging the frequencies of each year. The interannualvariations were derived based on the frequencies of in-dividual years.
Besides the frequency of occurrence, we also com-puted a wet-day probability statistic (i.e., the number ofdays, expressed as a percentage of the number of alldays with observations, on which at least one event ofthe precipitation types or thunderstorms occurred).Since past weather codes (W1 for manned and W1a forautomatic stations) were also used in this count, the wet-day probability (pw; also referred to as thunderstorm-day probability in the thunderstorm case) is derivedbased on 24-h complete sampling over most land areas.This differs from the frequency of occurrence whichwas based on eight samples (each sample covers 1 h)per day. The wet-day probability is a better measurethan the frequency of occurrence for episodic eventssuch as showers and thunderstorms. However, becausetemporal sampling only covers a fraction of the day overthe oceans, the wet-day probability is underestimatedby the marine reports. One simple way to account forthis insufficient sampling is to multiply the wet-dayprobability by a sampling factor, f, defined as 24/(N · Dt), where N is the average number of (past) weath-er reports per day (#4), and Dt is the sampling intervalof W1 (6 h). The f is 1.0 at most land stations and largerthan 1.0 over most oceanic regions. There are morediscussions on this sampling issue in Dai (2001b, man-uscript submitted to J. Climate).
6 Results are similar if the counting is done at each station, exceptfor the wet-day probability of showery precipitation and thunder-storms whose counting was done at individual stations.
c. Inhomogeneities in the data
The frequency of occurrence and wet-day probabilityderived from the present and past weather codes poten-tially contain inhomogeneities resulting from 1) WMO-introduced changes in code tables and recording prac-tices, 2) temporal changes in the number of reports,station operation types (Fig. 1), and spatial coverage,3) biases associated with individual observers or ships,and 4) a bias due to missing reporting times (e.g., moremissing data at night).7 For example, if the change incoding practice introduced on 1 January 1982 (i.e., wwcan be omitted if there are no significant phenomenonto report) is not accounted for, an upward jump in thefrequency and wet-day probability would occur aroundthis time.
To quantitatively assess the inhomogeneities in thefrequency and wet-day probability, we decomposed theseasonal frequency and probability maps (for each yearfrom 1976 to 1997) using the EOF method (North etal. 1982). Figure 3 shows the first and second EOFmodes in the wet-day probability of AllPrc (similarmodes also seen for precipitation types) that appear tobe spurious changes. The first mode has a linear trendsince 1985 and comes mostly from the oceans, wherethe number of reports decreased steadily during the pe-riod (Fig. 1). The second mode is associated primarilywith the WMO-introduced changes in code tables andrecording practices on 1 January 1982. Apparently,these changes still induce spurious jumps even thoughwe used the Ix data to account for the changes in re-cording practices of ww and wawa (the jump aroundJanuary 1982 would have been much larger if the Ixdata were not used). These spurious modes can signif-icantly increase the year-to-year variability of the fre-quency and wet-day probability. We therefore removedthem before computing the interannual variations. How-ever, we did not adjust these changes in computing the
7 This bias was minimized in this study by computing the frequencyof occurrence for each reporting hour and averaging the frequencyover the reporting hours to obtain the mean frequency.

15 MARCH 2001 1099D A I
FIG. 3. The first and second EOF modes of the seasonal mean wet-day probability for nondrizzle precipitation derived from present andpast weather codes. The seasonal cycle was removed before the EOF analysis.
mean frequencies because we do not know which periodhas the smallest bias. Instead, we shall present the meanfrequency and wet-day probability maps derived usingthe count of all reports from 1975 to 1997. These meanmaps may contain some systematic biases that are likelyto be within about 610% based on the magnitudes ofthe spurious modes.
3. Results
a. Geographical and seasonal variations
Figure 4 shows the geographical distribution of DJFand June–August (JJA) mean frequency of occurrencefor drizzle, AllPrc, NonShw, ShwPrc, and snow. Thecorresponding wet-day probability (after being multi-plied by the sampling factor f ) is shown in Fig. 5 (notethat the bottom row is for thunderstorms). The fre-quencies for March–May (MAM) and September–No-vember (SON) do not differ greatly from the DJF fre-quency and will be shown only for the zonal means.Differences in the spatial patterns of the frequency ofoccurrence and wet-day probability result primarilyfrom spatial variations in the diurnal cycle of precipi-tation events (Dai et al. 1999; Dai 2001a). If there wereno diurnal variations in the frequency of occurrence, the
frequency and wet-day probability would differ only bya constant.
1) DRIZZLE
Drizzles occur more frequently (up to 15% of thetime) over mid- and high-latitude oceans than over landareas and the low-latitude oceans in both DJF and JJA(Fig. 4, and in MAM and SON, not shown). Drizzlesare observed less than 1% of the time over most landareas, except for some coastal areas (e.g., coastal west-ern Europe in DJF, southeastern North America in DJF,and Indian subcontinent in JJA) where the frequencycan reach 5%. Over the marine stratus-cloud regionswest off South America and Africa, the frequency is notparticularly high when compared with the surroundingareas. This may be due to poor sampling over theseregions (Fig. 2). Petty (1995) found generally muchhigher frequencies (up to 50% of all ww reports) forlight-intensity precipitation (including drizzle). Thismay be partly due to the fact that Petty (1995) includedww reports outside a 2.58 grid box in computing thefrequency for the grid box and did not have the Ix datato account for the changes in coding practices intro-duced on 1 January 1982 (which could result in a largeupward jump in the frequency of occurrence).

1100 VOLUME 14J O U R N A L O F C L I M A T E
FIG. 4. Geographical distributions of frequency of occurrence (in %) for (top row) drizzle precipitation, (2d row) nondrizzle precipitation, (3drow) nonshowery precipitation (excluding drizzle), (4th row) showery precipitation, and (bottom row) snow for (left) DJF and (right) JJA.

15 MARCH 2001 1101D A I
FIG. 5. Same as Fig. 4 but for the wet-day probability and (bottom row) thunderstorm-day probability.

1102 VOLUME 14J O U R N A L O F C L I M A T E
FIG. 6. (top) Latitudinal distributions of seasonal zonal mean fre-quency of occurrence (%) and (bottom) wet-day probability (%) fordrizzle precipitation.
The wet-day probability for drizzle is much higher(around 40%–70%) over the midlatitude oceans thanmost other areas (#15%) (Fig. 5). Over most inner-landareas, drizzles occur in less than 5% of the days. Figure6 shows that drizzles occur most frequently at mid-latitudes in both hemispheres, whereas they happen onlyabout 1.5% of the time at low latitudes (308S–308N).Drizzles are also infrequent at high (.;708) latitudesexcept for JJA at northern high latitudes where theyoccur as often as at northern midlatitudes (;3%–4% ofthe time). The largest percentage of the days with driz-zles (;40%) occurs at southern middle latitudes (mostlyover the oceans, cf. Fig. 5).
2) NONDRIZZLE PRECIPITATION
Nondrizzle precipitation, which includes precipitationof all forms other than drizzle, occurs more than 20%of the time over the storm-track regions (Dai et al. 2001)at middle and high latitudes (in DJF only at the northernlatitudes) (Fig. 4). In particular, nondrizzle precipitationis most frequent (40%–60% of the time) from easternCanada to northern Europe and in the western NorthPacific in DJF. This high-frequency band at northernlatitudes disappears in JJA and is weaker in MAM and
SON (not shown) as the synoptic activity weakens. Therelatively high frequency band (evident in all the sea-sons) over the Antarctic Circumpolar Current is con-sistent with the strong activity of synoptic storms overthe region 508–708S (Trenberth 1991; Dai et al. 2000).In the Tropics, a narrow (;68–108 lat) band of relativelyhigh frequency (15%–30%) over the equatorial centraland eastern Pacific and the Atlantic sharply depicts theintertropical convergence zone (ITCZ). This bandspreads to much wider areas and becomes less well de-fined from the western tropical Pacific to the IndianOcean, especially in JJA. A southeast-oriented band ofrelatively high frequency (;15%) is evident over thewestern and central South Pacific in DJF (less clear inthe other seasons), which is a depiction of the SouthPacific Convergence Zone (SPCZ). Outside the tropicalconvergence zones, precipitation occurs less frequently(#10%) at low latitudes than at mid- and high latitudes.It rains less than a few percent of the time over thesubtropical divergence regions such as northern Africa,the Middle East, southern Africa in JJA, central SouthAmerica in JJA, and northern Australia in JJA. Duringthe summer monsoon season over southeastern Asia, itrains about 20%–40% of the time, which is much higherthan ;10%–15% over northern midlatitudes.
Because drizzle contributes little to precipitationamounts over most areas, the frequency for nondrizzleprecipitation events is probably the most relevant fre-quency for rain gauge recorded precipitation events.Current climatologies of monthly precipitation amountshave large discrepancies over the oceans because of thelack of direct measurements (Xie and Arkin 1997). Thefrequency of occurrence for nondrizzle precipitation(Fig. 4) provides one of the two constraints (the otherone is intensity, i.e., the precipitation rate over the pre-cipitating time period) on precipitation amounts overthe oceans. The location and width of the ITCZ in thefrequency for nondrizzle precipitation (Fig. 4) and inthe Xie–Arkin precipitation climatology (Xie and Arkin1997) are fairly similar over the central and easternPacific and the Atlantic. For example, a weak ITCZ inDJF and a strong ITCZ extending northward in JJA overthe eastern Pacific and eastern Atlantic are evident inboth the frequency maps and the Xie–Arkin climatol-ogy, which is derived from satellite observations ofhigh-level cloudiness over the oceans. In contrast, theITCZ in earlier precipitation climatologies (e.g., Jaeger1983; Legates and Willmott 1990), whose oceanic pre-cipitation was derived from a limited number of ship-board rain gauge records, differs substantially from thatin the frequency maps.
The wet-day probability for nondrizzle precipitation(Fig. 5) is . 50% over most oceans and mid- and high-latitude land areas. Figure 7 shows the frequency ofoccurrence for nondrizzle precipitation is about 2–3times higher at high latitudes than at low latitudes (ex-cept for JJA in the Northern Hemisphere). As shownbelow, this is largely a feature of the nonshowery pre-

15 MARCH 2001 1103D A I
FIG. 7. Same as Fig. 6 but for nondrizzle precipitation.
cipitation. The zonal mean position of the ITCZ (cen-tered at ;88N in JJA and SON and ;48N in DJF andMAM) is well defined in both the frequency of occur-rence and the wet-day probability and is in good agree-ment with that defined by surface wind convergence(Dai and Deser 1999).
Over the oceans, the spatial patterns of the frequencyof occurrence for nondrizzle precipitation are compa-rable to those for ‘‘moderate to heavy’’ intensity pre-cipitation from Petty (1995), although Petty’s frequencyis slightly higher (which could result from the differ-ences in the analyzing methods mentioned above). Thereare few frequency maps derived using high-resolutionrain gauge records. Higgins et al. (1996) computed thepercentage of the days with various precipitationamounts over the United States using gridded hourlyrain gauge records. Our wet-day probability for non-drizzle precipitation is comparable to Higgins’ frequen-cy maps (with .1 mm day21 cut-off ) over the UnitedStates. In addition, the diurnal cycle of the frequencyof occurrence for nondrizzle precipitation (Dai 2001a)is in good agreement with that based on hourly raingauge records over the United States and other regionswhere data are available (Dai et al. 1999).
3) PRECIPITATION INTENSITY
The frequency of occurrence and the Xie–Arkin cli-matology of precipitation amounts (based on rain gaugerecords, satellite observations, and numerical model es-timates) are derived from independent records. A cli-matology of precipitation intensity can therefore be in-ferred from the frequency and amount (recall thatamount 5 frequency 3 intensity). Figure 8 shows theseasonal mean precipitation intensity8 (mm h21). It canbe seen that the mean precipitation intensity is generallyless than 1.0 mm h21 at mid- and high latitudes, wherestratiform nonshowery precipitation predominates (ex-cept for JJA in the Northern Hemisphere, cf. Fig. 4);whereas the intensity is about 1.5–3.0 mm h21 in theTropics, where convective showery rainfall is frequent(cf. Fig. 4). The seasonal cycle of the intensity is largestover land areas, especially at low latitudes such as south-eastern Asia, the Sahel, southern North America, andnorthern Australia. This seasonal cycle is induced bystrong moist convection that follows the zone of sea-sonal maximum solar heating. The most intense rainfallis located in northern South America where the meanintensity can be as high as 10 mm h21. The intensityover the tropical oceans is about 2.0 mm h21, which issubstantially lower than the largest intensity over trop-ical land areas. This suggests that moist convection canbe more vigorous over certain land areas where moistureis abundant (such as the Amazon) than over the oceans(due to large warming of the land surface by solar heat-ing). Another feature is that the mean intensity is notparticularly high inside the ITCZ and the SPCZ whencompared with other parts of the Tropics, in contrast tothe frequency and amount patterns. From this we con-clude that the large amount of precipitation inside theITCZ (and the Indonesia region) results primarily fromrelatively high frequencies of precipitation events ratherthan from enhanced strength of moist convection.
4) NONSHOWERY PRECIPITATION
Figure 4 shows that nonshowery precipitation is thepreferred form of precipitation at northern mid- and highlatitudes in DJF (and in MAM and SON also, not shown)and over southern high latitudes (south of ;608S) in allseasons. Over northern mid- and high latitudes, non-showery precipitation occurs in 50%–90% of the daysin DJF (Fig. 5, and in MAM and SON also, not shown).
8 Precipitation intensity is defined here as total precipitation amountfrom Xie–Arkin seasonal climatology divided by the seasonal meanfrequency of occurrence for nondrizzle precipitation. The contributionof drizzle to Xie–Arkin’s climatology is small and thus the intensityis essentially for nondrizzle precipitation. Also note that the intensityis likely at the lower limit of the range since the frequency overes-timates the precipitating time for showery precipitation. This is be-cause present weather reports of showery precipitation include thoseshowers lasting less than 1 h.

1104 VOLUME 14J O U R N A L O F C L I M A T E
FIG. 8. Seasonal mean precipitation intensity (mm h21) derived by dividing the seasonal precipitation amount from Xie and Arkin (1997)by the frequency of occurrence for nondrizzle precipitation. Values over 2.0 mm h21 are hatched.
As shown by the bottom row of Fig. 4, snow consistsof a large portion of the nonshowery precipitation eventsat high latitudes for DJF (and MAM and SON). Duringthe boreal summer, nonshowery precipitation at northernmid- and high latitudes occurs only about 5%–15% ofthe time, much less frequently than the other seasons.
At low latitudes and southern midlatitudes, the fre-quency of nonshowery precipitation events seems to becorrelated spatially with that for showery precipitation(Figs. 4 and 5). For example, nonshowery precipitationevents inside the ITCZ, which has been thought to bea zone of convergence and moist convection, are morefrequent than in other parts of the Tropics. Dai (2001a)also found similar diurnal phase patterns for showeryand nonshowery precipitation over the oceans at theselatitudes. These results suggest that nonshowery pre-cipitation at these latitudes may be physically related tomoist convection (e.g., stratiform rainfall may occurfrom anvil clouds that result from strong moist con-vection) (Houze 1997). This differs from high and north-ern midlatitudes where nonshowery precipitation usu-ally results from the passing of synoptic systems.
5) SHOWERY PRECIPITATION AND THUNDERSTORMS
In general, the frequency for showery precipitationover the oceans (;5%–20%) is higher than over landareas (;0%–10%), except for JJA over Northern Hemi-sphere land areas where showery precipitation becomes
as frequent as over oceanic areas (Fig. 4). Showeryprecipitation is more frequent than nonshowery precip-itation over the low-latitude oceans, whereas it is gen-erally the opposite over the land areas (except for JJA).
Figure 5 shows that showery precipitation occurs over40% of the days over most low-latitude oceans. DuringJJA showery precipitation occurs very frequently($50% of the days) in southern China and frequently(30%–50% of the days) over Europe, central Asia, andCanada. Showery precipitation (including snow) is alsovery frequent over the northern North Atlantic Oceanin all but JJA season. JJA is also the season with min-imum showery precipitation events over the North Pa-cific Ocean, where there is a strong high pressure centerin JJA. The land–ocean difference in the phase of theseasonal cycle will be discussed in more detail below.
Thunderstorms (including nonprecipitating ones) areobserved in less than 10% of the days over most oceans(Fig. 5). They occur primarily over the land areas in thesummer hemisphere. For example, during the borealsummer, thunderstorms occur in 30%–50% of the daysover southeastern Asia, the southeastern United States,Central America, and the western part of Africa from08 to 158N. Summer thunderstorms are also frequent(10%–30% of the days) over other parts of the UnitedStates except California and the Northwest. During theaustral summer, there are thunderstorms in about 30%–50% of the days in Africa south of the equator, and20%–40% of the days in central South America.

15 MARCH 2001 1105D A I
FIG. 9. Same as Fig. 6 but for snow. Also shown are DJF (thin-solid curve) and JJA (thin-broken curve) zonal mean surface air tem-peratures from surface observations.
During MAM and SON (not shown), the percentageof the days with thunderstorms is about 20%–50% overequatorial Africa, 20%–30% in southeastern Asia andcentral South America, 10%–20% over the southeasternUnited States and Central America.
The global patterns of thunderstorm days9 inferredfrom the thunderstorm-day probability are comparableto those based on the data before the mid-1950s (WMO1956), although Fig. 5 reveals much more detail.
6) SNOW
Over the Northern Hemisphere, snow occurs mostlyat high latitudes (in all but JJA season) and over landareas at midlatitudes (in DJF only; Fig. 4). It snows40%–60% of the time in DJF over eastern Canada,northern Europe and the adjacent Barents Sea, and thenorthwestern North Pacific. Snowing is observed 5%–20% of the time in DJF over much of the United Statesexcept for the very southern part of the country (e.g.,Florida) where it seldom occurs. Snow is also not com-mon (#5% of the time) in southern Asia (south of458N). Figure 9 shows that the starting latitude withsubstantial snow in the Northern Hemisphere varies sea-sonally (;358N in DJF, 408N in MAM, 438N in SON,and 678N in JJA), in phase with the seasonal cycle ofzonal mean temperature (;108C at these latitudes).
Over the Southern Hemisphere, significant snow oc-curs only south of about 508S in all the seasons (Figs.4 and 9). From the equator to ;508S, zonal mean tem-peratures have relatively small seasonal variations anddo not fall below ;108C (Fig. 9). It should be pointedout that snow over mountains such as the Andes andthe Himalaya is not well sampled (cf. Fig. 2).
7) SPATIAL PATTERNS OF THE SEASONAL CYCLE
As mentioned above, the seasonal cycle of the show-ery precipitation frequency may be out of phase betweenthe land and oceanic areas. To investigate this in moredetail, we analyzed the seasonal frequencies of each yearusing the EOF method (with the seasonal cycle includedin the data). Figure 10 shows the time series and spatialpatterns of the seasonal EOF mode of the wet-day prob-ability (similar EOFs for the frequency of occurrence)for drizzle, nonshowery, and showery precipitation. Thepositive (negative) contours correspond to a DJF (JJA)maximum of the seasonal cycle. The seasonal cycle ex-plains about 20%–30% of the total variance of the sea-sonal probability (frequency) for nondrizzle, nonshow-ery, and showery precipitation. This percentage is lowerfor thunderstorms and snow (;16% for both) and driz-zle (;12%). The EOF for nondrizzle precipitation is
9 A thunderstorm day is a local calender day on which thunder isheard (WMO 1956).
similar to that for nonshowery precipitation, whereasthe EOF for thunderstorms is comparable to that forshowery precipitation.
Figure 10b shows that for drizzle the seasonal cycleoccurs primarily in the Northern Hemisphere, where thefrequency peaks in JJA over the subtropical North At-lantic, Europe, northern Africa, and the subtropicalNorth Pacific, while it reaches a maximum in DJF overother regions. For nonshowery (and nondrizzle) precip-itation, the seasonal cycle is generally larger over landareas (especially at northern mid- and high latitudes)than over the oceans (Fig. 10c). Nonshowery precipi-tation is most frequent in DJF north of about 258N andover the land areas between 08 and 308S, while the max-imum is in JJA between about 58 and 208N and overmany of the oceanic areas between 108 and 508S. TheDJF maximum at the northern latitudes is consistentwith increased winter synoptic activities at northernmid- and high latitudes. The JJA maximum over the 58–208N zone is related to the increased moist convectionaround the ITCZ. Over the low and midlatitudes in theSouthern Hemisphere, the pattern resembles that forshowery precipitation (Fig. 10d). This is consistent withthe hypothesis stated above that nonshowery precipi-tation results from physical processes that are associatedwith moist convection at low latitudes and southern mid-latitudes.

1106 VOLUME 14J O U R N A L O F C L I M A T E
FIG. 10. EOF (a) temporal coefficient and (b) spatial patterns for drizzle, (c) nonshowery and (d) showery precipitation for the seasonalcycle. For (b)–(d) the percentage variance explained by the EOF is indicated at the top.
The seasonal cycle for showery precipitation (Fig.10d) (and thunderstorms) exhibits a coherent land–ocean pattern, in which the land areas peak in summerand the oceans peak in winter. Similar land–ocean pat-terns are seen in the seasonal and diurnal cycles of sur-face wind convergence and have been attributed to thedifferential surface temperature responses (larger warm-ing over the land than the ocean during summer and theday) to seasonal and diurnal solar heating over the landand oceanic areas (Dai and Deser 1999). The seasonalcycle pattern for showery precipitation, which resultsfrom moist convection and is therefore closely relatedto surface convergence, is in good agreement with theconvergence data of Dai and Deser (1999). It is also inbroad agreement with the land–ocean pattern of the di-urnal cycle of showery precipitation (Dai 2001a).
b. Interannual variations
In this subsection, we first describe the year-to-yearstandard deviation (s.d.) of the precipitation frequencyand wet-day probability and then their leading EOFmodes. Although distributions of short-time (e.g., hour-ly) precipitation rates are heavily skewed (with a longtail of large precipitation rates), seasonal and annualprecipitation are fairly close to normal distributions andtherefore the s.d. is a reasonable measure of the year-
to-year variability. Although the records are relativelyshort, the leading EOFs of the seasonal wet-day prob-ability (similar EOFs for the frequency of occurrence)still provide some insights into the physical processesunderlying the year-to-year variability.
Figures 11 and 12 show the s.d. of DJF and JJA meanwet-day probability (similar patterns with smaller mag-nitudes for the frequency of occurrence) for the six typesof precipitation and thunderstorms. It can be seen thatspatial patterns of the s.d. generally follow those of themean probability (cf. Figs. 4 and 5; note that many ofthe small-scale features seen in Figs. 4 and 5 weresmoothed out in Figs. 11 and 12). The magnitude of thes.d., which ranges from a few percent to ;20% of thedays, is about 10%–20% of the mean over most areasexcept for the regions with small mean probability (e.g.,northern Africa and the Middle East) where the s.d. isas large as the mean. The southern oceans (south of;508S) have relatively large s.d. This partly reflects thelarge sampling errors over these regions. The seasonalcycle in the s.d. also follows that of the mean probability(e.g., larger over the land areas of the summer hemi-sphere for convective precipitation and thunderstorms).
Figure 13 shows the first and second EOFs of thewet-day probability for nondrizzle precipitation, and thefirst EOFs for nonshowery and showery precipitation.It can be seen that the first EOFs for nondrizzle and

15 MARCH 2001 1107D A I
FIG. 11. Standard deviation of the wet-day probability for various types of precipitation and of the thunderstorm-day probability. Contourlevels are 1%, 2%, 3%, 5%, 7%, 10%, 15%, 20%, and 25%. Values over 15% are hatched.
nonshowery precipitation, which explain about 4.3% ofthe total variance, are significantly correlated withENSO in both time and space. The spatial patterns matchthe ENSO EOFs of seasonal precipitation amounts (Daiet al. 1997; Dai and Wigley 2000). For example, duringEl Nino years, the wet-day probability for nondrizzleprecipitation is substantially (;1 s.d. or more) belownormal over the Indonesia region, Australia, and theeastern India Ocean. The probability is also below nor-mal over northern South America, and the equatorialAtlantic during El Nino years. On the other hand, duringEl Nino years nondrizzle precipitation is more frequentover the central and eastern equatorial Pacific, the south-ern United States, and the adjacent oceans. The patternsof the 1st EOFs over the open oceans (Fig. 13; top right)
are in situ observations of the ENSO-induced precipi-tation anomalies that confirm those derived previouslyfrom satellite estimates of rainfall (Dai and Wigley2000). In the frequency and wet-day probability for theother types (including showery, Fig. 13) of precipitationand thunderstorms, the ENSO mode was not well sep-arated from other variations, presumably because of therelatively short length of the record.
The second EOF of the wet-day probability for non-drizzle precipitation and the first EOF of the wet-dayprobability for showery precipitation exhibit decadal os-cillations with periods of ;10–12 yr and large weight-ing over North America. Although there is some cor-relation between the time series of the second EOF fornondrizzle precipitation and the seasonal mean sunspot

1108 VOLUME 14J O U R N A L O F C L I M A T E
FIG. 12. Same as Fig. 11 but for JJA.
number, this correlation is statistically insignificant be-cause of the short length of the record.
4. Summary
Global climatologies of the frequency of occurrencefor various types of precipitation are an important aspectof the climate and are needed for climate-model eval-uations. Here we analyzed 3-hourly present and pastweather reports from ;15 000 stations and from theCOADS ship observations from 1975 to 1997 for thefrequency of occurrence and wet-day probability fordrizzle, nondrizzle, showery, and nonshowery precipi-tation, thunderstorms, and snow. The 3-hourly samplingappears to be sufficient for computing the mean fre-quency of occurrence based on comparisons with hourly
rain gauge data over the United States. However, theweather report data were found to contain inhomoge-neities resulting from changes in recording practices,the number of reports, the spatial coverage, and otherbiases. The uncertainty of the mean frequencies asso-ciated with the inhomogeneities is likely to be withinabout 610%. Sampling errors are large (especially forthe wet-day probability) over the southern oceans (southof ;458S), the polar regions, and the sparsely populatedland areas (such as central Australia, central Africa, andnorthern Canada). Nevertheless, the weather reports stillprovide valuable information about the mean geograph-ical, seasonal and interannual variations in the precip-itation frequency and wet-day probability.
Drizzles occur 5%–15% of the time over mid- andhigh-latitude oceans. Over land areas and the low-lati-

15 MARCH 2001 1109D A I
FIG. 13. (left) Time series and (right) spatial patterns (negative values are hatched) of the leading EOFs of the wet-day probability for(top 2 rows) nondrizzle, (3d row) nonshowery, and (bottom row) showery precipitation. The seasonal cycle was removed before the EOFanalysis. The percentage variance explained by the EOF is indicated at the top of the left panels. The r is the correlation coefficient betweenthe solid and dashed curves, which are seasonal mean Southern Oscillation index (divided by 10) in the 1st and 3d panels of the left-handside and sunspot numbers in the 2d panel (read on right-side ordinate).

1110 VOLUME 14J O U R N A L O F C L I M A T E
tude oceans, drizzles occur less than a few percent ofthe time. Drizzles are observed in ;40%–70% of thedays over midlatitude oceans. The seasonal cycle in thedrizzle frequency is relatively weak and occurs mostlyin the Northern Hemisphere, where the frequency peaksin JJA over the subtropical North Atlantic, Europe,northern Africa, and subtropical North Pacific, whereasit reaches a maximum in DJF over other regions.
Nondrizzle precipitation occurs 20%–60% of the timeover the storm-track regions at northern mid- and highlatitudes (mostly in DJF) and over the Antarctic Cir-cumpolar Current (in all seasons). In the Tropics, a nar-row (;68–108 lat wide) band of relatively high fre-quency (15%–30%) of precipitation over the equatorialcentral and eastern Pacific and the Atlantic outlines thelocation of the ITCZ. The southeast-oriented SPCZ isalso evident in the frequency maps with ;15% of thetime having rainfall. Outside the convergence zones,nondrizzle precipitation occurs less than 10% of the timeat low latitudes, as compared with 10%–40% at mid-and high latitudes. Nondrizzle precipitation occurs lessthan 2% of the time over the subtropical divergenceregions such as northern Africa and the Middle East.
The locations and their seasonal variations of theITCZ and SPCZ shown in the frequency maps for non-drizzle precipitation are in good agreement with thoseseen in satellite-based estimates of precipitationamounts and in surface wind convergence fields. Theseasonal mean precipitation intensity inferred from thefrequency for nondrizzle precipitation and the Xie–Ar-kin climatology of precipitation amounts is generallyless than 1.0 mm h21 at mid- and high latitudes and;1.5–3.0 mm h21 in the Tropics. The mean intensityinside the ITCZ and the SPCZ is comparable to manyother parts of the Tropics, suggesting that it is mainlythe high frequency (rather than intensity) that contrib-utes to the large precipitation amounts inside the ITCZand the SPCZ (and the Indonesia region).
Nonshowery precipitation is the preferred form ofprecipitation at northern mid- and high latitudes in allbut JJA season (occurring in 50%–90% of the days) andover southern high latitudes in all seasons. At low lat-itudes and southern midlatitudes, where showery pre-cipitation is more frequent than nonshowery precipita-tion, the occurrence of nonshowery precipitation tendsto be correlated spatially with showery precipitation.The seasonal cycle at these latitudes is also similar forshowery and nonshowery precipitation. These resultssuggest that nonshowery precipitation at low latitudesand southern midlatitudes may result from physical pro-cesses that are associated with moist convection (e.g.,anvil clouds resulting from deep convection often pro-duce stratiform rainfall), in contrast to high latitudesand northern midlatitudes where nonshowery precipi-tation usually results from the passing of synoptic sys-tems.
Nondrizzle and nonshowery precipitation are mostfrequent in DJF north of ;258N and over the land areas
between 08 and 308S, while the seasonal maximum isin JJA between 58N and 208N and over many oceanicareas between 108S and 508S.
The frequency for showery precipitation is generallyhigher over the oceans (;5%–20%) than over land areas(;0%–10%), except for JJA over Northern Hemisphereland areas where showery precipitation becomes as fre-quent as over the oceans. In particular, summer showeryprecipitation occurs very frequently ($50% of the days)in southern China and frequently (30%–50% of thedays) over Europe, central Asia, and Canada.
Thunderstorms (including nonprecipitating ones) oc-cur in less than 10% of the days over the open oceansbut much more frequently over the land areas of thesummer hemisphere. During the boreal summer, thun-derstorms occur in 30%–50% of the days over south-eastern Asia, the southeastern United States, CentralAmerica, and the western part of Africa from 08 to 158N.During the austral summer, there are thunderstorms in;30%–50% of the days in Africa south of the equator,and 20%–40% of the days in central South America.During MAM and SON, the thunderstorm-day proba-bility is ;20%–50% over equatorial Africa, 20%–30%in southeastern Asia and central South America, 10%–20% over the southeastern United States and CentralAmerica.
The seasonal cycles of showery precipitation andthunderstorm frequency and wet-day probability exhibita coherent land–ocean pattern, in which the land areaspeak in summer and the oceans peak in winter. Thispattern is consistent with the land–ocean patterns seenin the diurnal cycle of showery precipitation and theseasonal and diurnal cycles of surface wind conver-gence, and results from the differential surface temper-ature responses to solar heating.
Substantial snow occurs poleward of the latitudewhere zonal mean surface air temperature is near 108Csuch as 508S, 358N in DJF, 408N in MAM, and 438Nin SON.
The spatial patterns of the standard deviation of year-to-year variations for the precipitation frequency andwet-day probability generally follow those of the mean,with a magnitude of ;10%–20% of the mean (exceptfor regions with small mean values). The first EOFs ofnondrizzle and nonshowery precipitation frequency andprobability are an ENSO-induced mode that confirmsthe ENSO-induced precipitation anomalies over theoceans derived previously from satellite estimates.There are also decadal modes in nondrizzle and showeryprecipitation frequency and probability with periods of;10–12 yr, but these modes may contain large samplingerrors resulting from the short length of the record.
Acknowledgments. I am grateful to Steve Worley,Dennis Joseph, and Gregg Walters for sharing theirknowledge of surface observations. I also thank TomM. L. Wigley for helpful comments. This study wassupported by the ACACIA Consortium (CRIEPI, Japan;
15 MARCH 2001 1111D A I
EPRI, California; KEMA Nederland B.V., Netherlands;and the National Center for Atmospheric Research).
REFERENCES
Chen, M., R. E. Dickinson, X. Zeng, and A. N. Hahmann 1996:Comparison of precipitation observed over the continental Unit-ed States to that simulated by a climate model. J. Climate, 9,2233–2249.
Court, A., and J. F. Griffins, 1983: Thunderstorm climatology. Thun-derstorm Morphology and Dynamics, E. Kessler, Ed., Univ. ofOklahoma Press, 9–39.
Dai, A., 1999: Recent changes in the diurnal cycle of precipitationover the United States. Geophys. Res. Lett., 26, 341–344., 2001a: Global precipitation and thunderstorm frequencies. PartII: Diurnal variations. J. Climate, 14, 1112–1128., and C. Deser, 1999: Diurnal and semidiurnal variations in globalsurface wind and divergence fields. J. Geophys. Res., 104,31 109–31 125., and J. Wang, 1999: Diurnal and semidiurnal tides in globalsurface pressure fields. J. Atmos. Sci., 56, 3874–3891., and T. M. L. Wigley, 2000: Global patterns of ENSO-inducedprecipitation. Geophys. Res. Lett., 27, 1283–1286., I. Y. Fung, and A. D. Del Genio, 1997: Surface observed globalland precipitation variations during 1900–1988. J. Climate, 10,2943–2962., F. Giorgi, and K. E. Trenberth, 1999: Observed and modelsimulated precipitation diurnal cycle over the contiguous UnitedStates. J. Geophys. Res., 104, 6377–6402., T. M. L. Wigley, B. A. Boville, J. T. Kiehl, and L. Buja, 2001:Climates of the twentieth and twenty-first centuries simulatedby the NCAR Climate System Model. J. Climate, 14, 485–519.
Easterling, D. R., 1991: Climatological patterns of thunderstorm ac-tivity in southeastern USA. Int. J. Climatol., 11, 213–221., and P. J. Robinson, 1985: The diurnal variations of thunderstormactivity in the United States. J. Climate Appl. Meteor., 24, 1048–1058.
Higgins, R. W., J. E. Janowiak, and Y.-P. Yao, 1996: A gridded hourlyprecipitation database for the United States (1963–1993). NCEP/Climate Prediction Center Atlas No. 1, U.S. Dept. of Commerce,47 pp.
Houze, R. A., Jr., 1997: Stratiform precipitation in regions of con-
vection: A meteorological paradox? Bull. Amer. Meteor. Soc.,78, 2178–2196.
Jaeger, L., 1983: Monthly and areal patterns of mean global precip-itation. Variation in the Global Water Budget, A. Street-Perotet al., Eds., D. Reidel, 129–140.
Legates, D. R., and C. J. Willmott, 1990: Mean seasonal and spatialvariability in gauge-corrected, global precipitation. Int. J. Cli-matol., 10, 111–127.
New, M., M. Hulme, and P. Jones, 1999: Representing twentieth-century space-time climate variability. Part I: Development ofa 1961–90 mean monthly terrestrial climatology. J. Climate, 12,829–856.
Norris, J. R., 1998: Low cloud type over the ocean from surfaceobservations. Part II: Geographical and seasonal variations. J.Climate, 11, 383–403.
North, G. R., T. L. Bell, R. F. Cahalan, and F. J. Moeng, 1982: Sam-pling errors in the estimation of empirical orthogonal functions.Mon. Wea. Rev., 110, 699–706.
Petty, G. W., 1995: Frequencies and characteristics of global oceanicprecipitation from shipboard present-weather reports. Bull.Amer. Meteor. Soc., 76, 1593–1616.
Sanders, F., and J. C. Freeman, 1983: Thunderstorms at sea. Thun-derstorm Morphology and Dynamics, E. Kessler, Ed., Univ. ofOklahoma Press, 41–58.
Trenberth, K. E., 1991: Storm tracks in the Southern Hemisphere. J.Atmos. Sci., 48, 2159–2178.
Wallace, J. M., 1975: Diurnal variations in precipitation and thun-derstorm frequency over the conterminous United States. Mon.Wea. Rev., 103, 406–419.
Warren, S. G., C. J. Hahn, J. London, R. M. Chervin, and R. L. Jenne,1988: Global distribution of total cloud cover and cloud typeamounts over the ocean. NCAR Tech. Note, NCAR/TN-317 1STR, 42 pp., plus 170 maps. [Available from UCAR, P.O. Box3000, Boulder, CO 80307.]
Woodruff, S. D., S. J. Lubker, K. Wolter, S. J. Worley, and J. D.Elms, 1993: Comprehensive ocean–atmosphere data set(COADS) release 1a: 1980–1992. Earth Syst. Monit., 4, 1–8.
WMO (World Meteorological Organization), 1956: World Distribu-tion of Thunderstorm Days. WMO Publ. No. 21, TP. 21, 71 pp., 1988: Manual on Codes. Vol. 1, WMO Publ. 306, 203 pp.
Xie, P., and P. A. Arkin, 1997: Global precipitation: A 17-year month-ly analysis based on gauge observations, satellite estimates, andnumerical model outputs. Bull. Amer. Meteor. Soc., 78, 2539–2558.