Embed Size (px)
Citation preview

Global Overview of CFC Phase-out in the Chiller Sector
Ray Phillips
ICF Consulting
Financial Agent Workshop
April 15, 2004
Washington, DC

Presentation Outline
w Worldwide chiller background
w Chillers in developing countries
w Chiller energy efficiency
w MLF funded chiller projects
w Lessons learned
w Design possibilities for a global revolving fund.
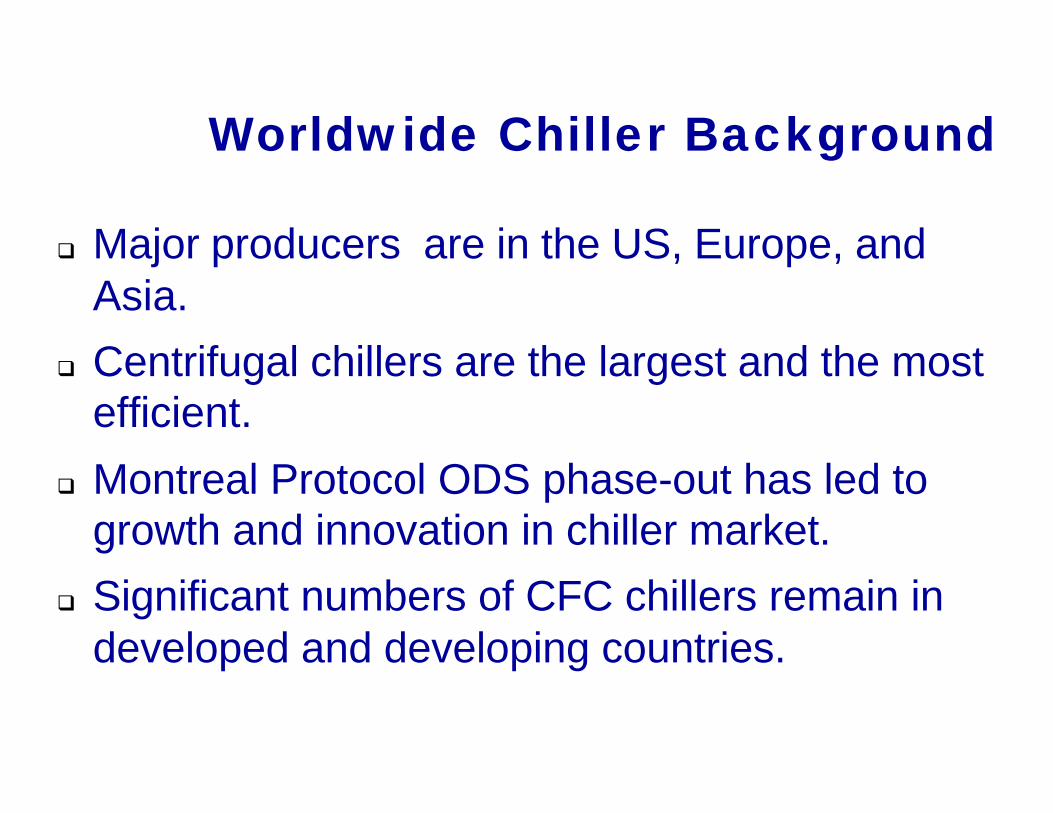
Worldwide Chiller Background
q Major producers are in the US, Europe, and Asia.
q Centrifugal chillers are the largest and the most efficient.
q Montreal Protocol ODS phase-out has led to growth and innovation in chiller market.
q Significant numbers of CFC chillers remain in developed and developing countries.
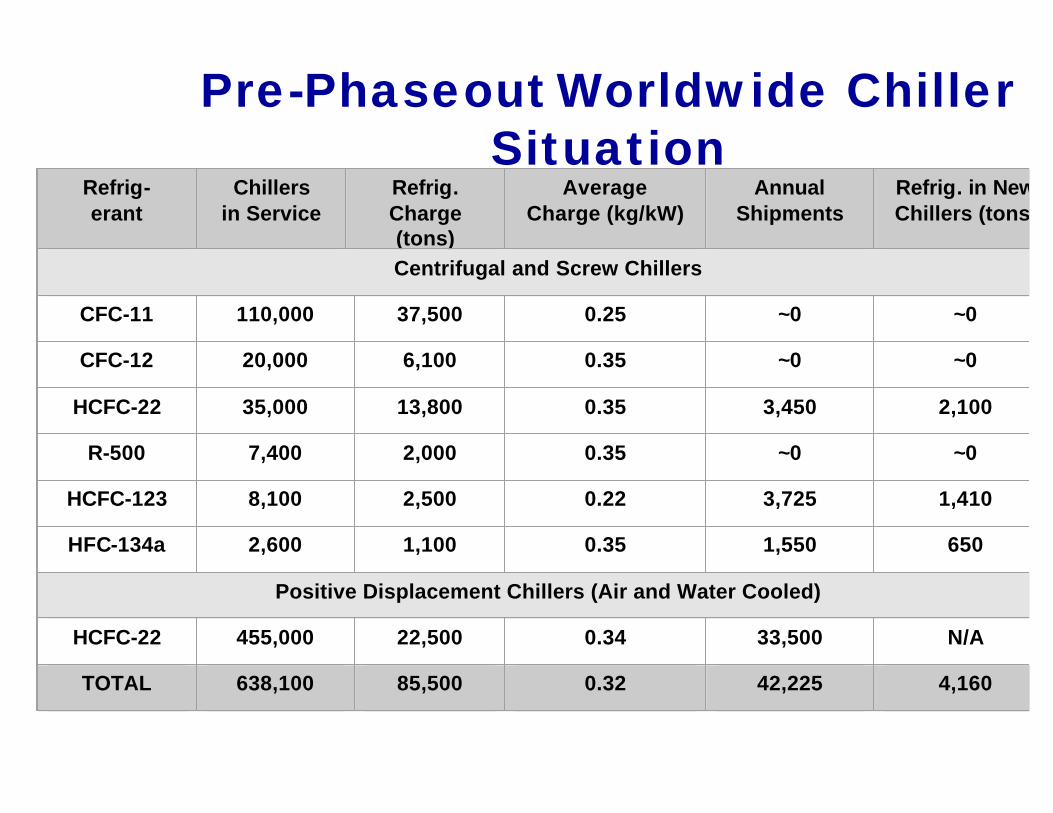
Pre-PhaseoutWorldwide Chiller Situation
Refrig-erant
Chillersin Service
Refrig. Charge (tons)
Average Charge (kg/kW)
Annual Shipments
Refrig. in New Chillers (tons)
Centrifugal and Screw Chillers
CFC-11 110,000 37,500 0.25 ~0 ~0
CFC-12 20,000 6,100 0.35 ~0 ~0
HCFC-22 35,000 13,800 0.35 3,450 2,100
R-500 7,400 2,000 0.35 ~0 ~0
HCFC-123 8,100 2,500 0.22 3,725 1,410
HFC-134a 2,600 1,100 0.35 1,550 650
Positive Displacement Chillers (Air and Water Cooled)
HCFC-22 455,000 22,500 0.34 33,500 N/A
TOTAL 638,100 85,500 0.32 42,225 4,160

CFC Chiller Replacement Progress
q The US has seen a retirement of over half of all CFC chillers (~80,000 in the early 1990s) over the last ten years, but significant numbers remain.
q HCFCs dominate as the refrigerant of choice in the US,HFCs dominate in Europe, and developing countries use a variety of refrigerants (HCFCs, HFCs, and ammonia).
q US is largest market and is illustrative of developing country markets, so will use that as an example.
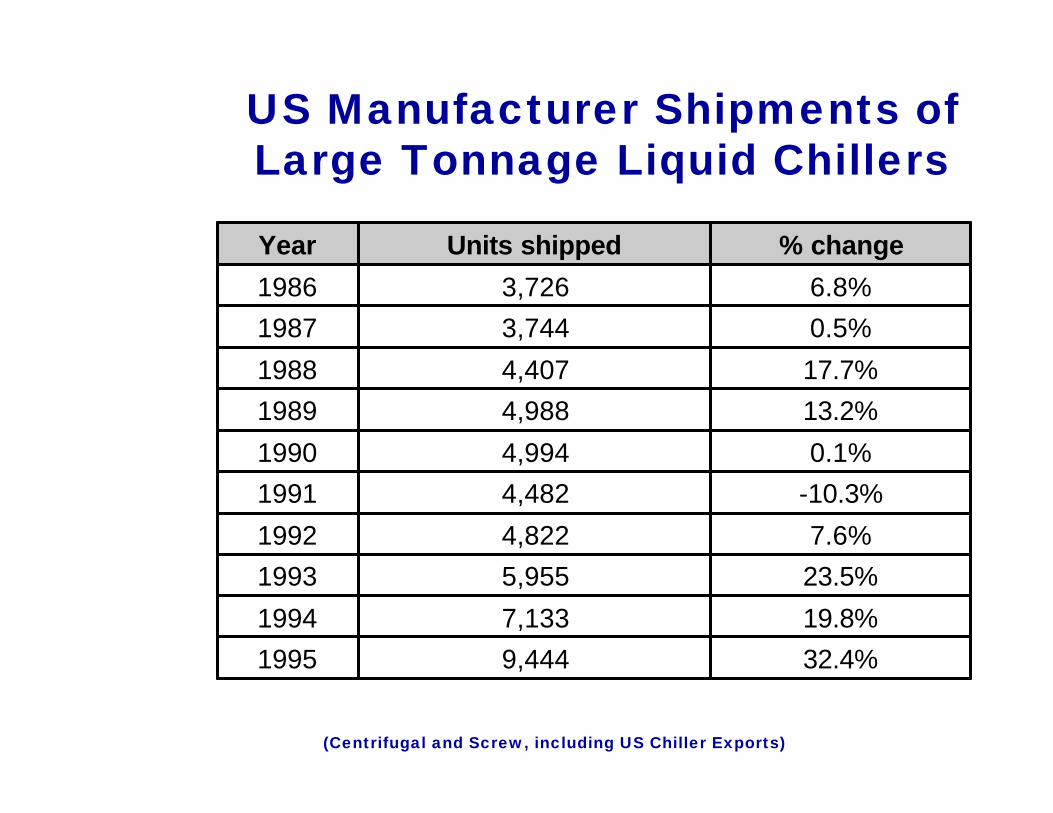
US Manufacturer Shipments of Large Tonnage Liquid Chillers
32.4%9,4441995
19.8%7,1331994
23.5%5,9551993
7.6%4,8221992
-10.3%4,4821991
0.1%4,9941990
13.2%4,9881989
17.7%4,4071988
0.5%3,7441987
6.8%3,7261986
% changeUnits shippedYear
(Centrifugal and Screw, including US Chiller Exports)
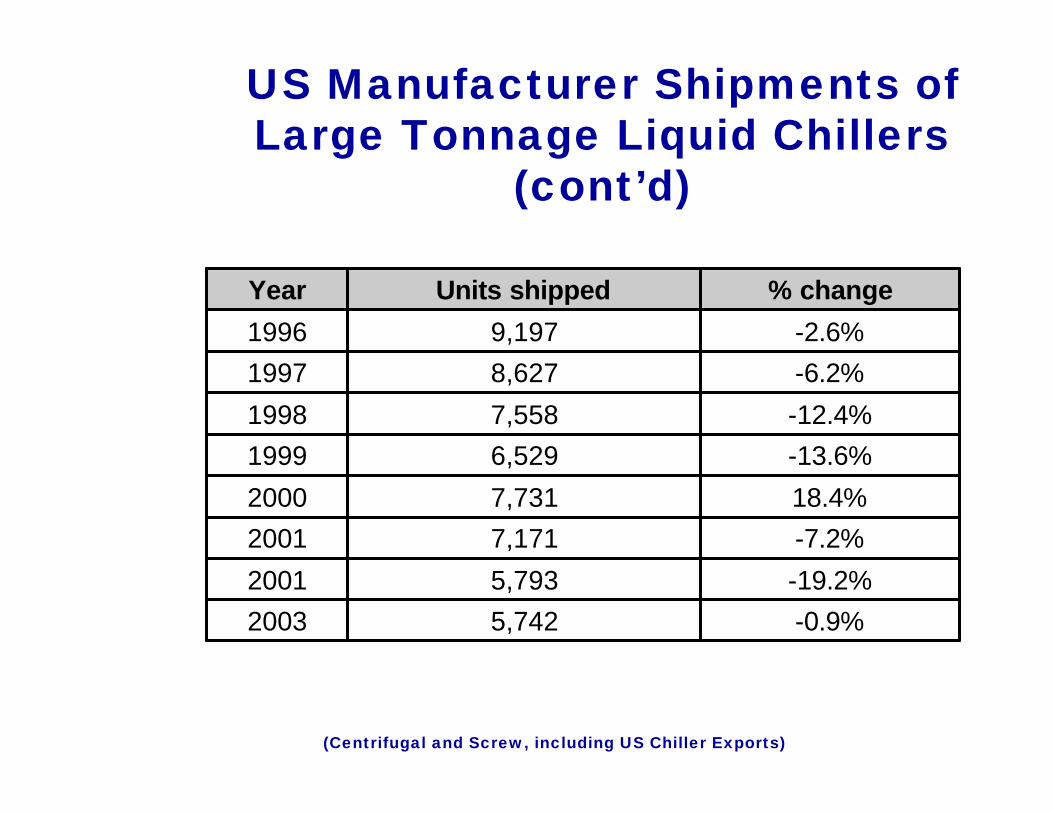
US Manufacturer Shipments of Large Tonnage Liquid Chillers
(cont’d)
-0.9%5,7422003
-19.2%5,7932001
-7.2%7,1712001
18.4%7,7312000
-13.6%6,5291999
-12.4%7,5581998
-6.2%8,6271997
-2.6%9,1971996
% changeUnits shippedYear
(Centrifugal and Screw, including US Chiller Exports)

CFC Chiller Replacements in US
Source: ARI press releases
4.0%67%53,2403,0641252006
4.0%63%50,0513,0841452005
3.8%59%46,8222,8831652004
3.2%55%43,7742,3981872003
3.2%51%41,1892,2153792002
3.7%52%41,5262,5503812001
5.2%45%35,6643,2359132000
4.5%39%31,5163,0854911999
5.3%34%27,285#N/A#N/A1998
7.2% 29%23,054#N/A#N/AThru 1997
% per year% of 80,000
Cum. TotalReplace-ments
Conver-sions

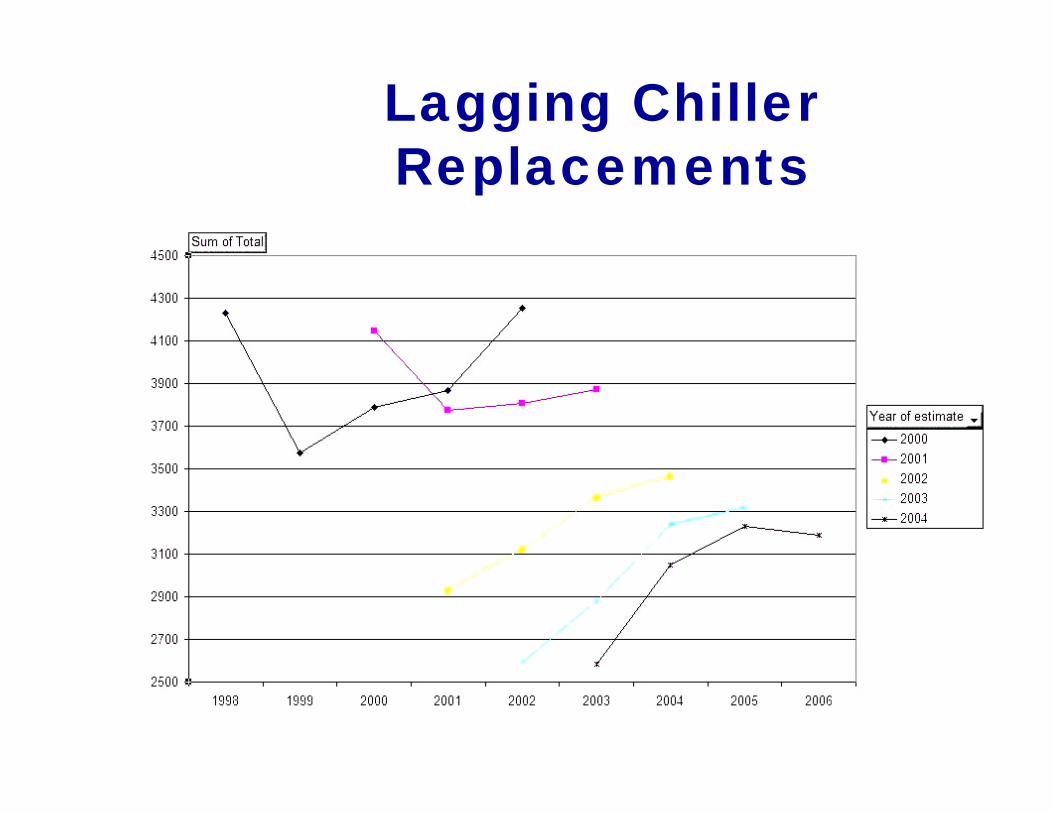
Lagging Chiller Replacements
Sum of % of 80,000 Year of estimateYear 2000 2001 2002 2003 2004
1998 34%1999 39%2000 44% 45%2001 49% 49% 52%2002 54% 54% 56% 51%2003 59% 60% 55% 55%2004 64% 59% 59%2005 63% 63%2006 67%

Lagging Chiller Replacements
Sum of Cum. Total Year of estimateYear 2000 2001 2002 2003 2004
1998 27,285 1999 31,516 2000 35,304 35,664 2001 39,170 39,440 41,526 2002 43,423 43,245 44,650 41,189 2003 47,115 48,018 44,072 43,774 2004 51,486 47,313 46,822 2005 50,633 50,051 2006 53,240
Lagging Chiller Replacements
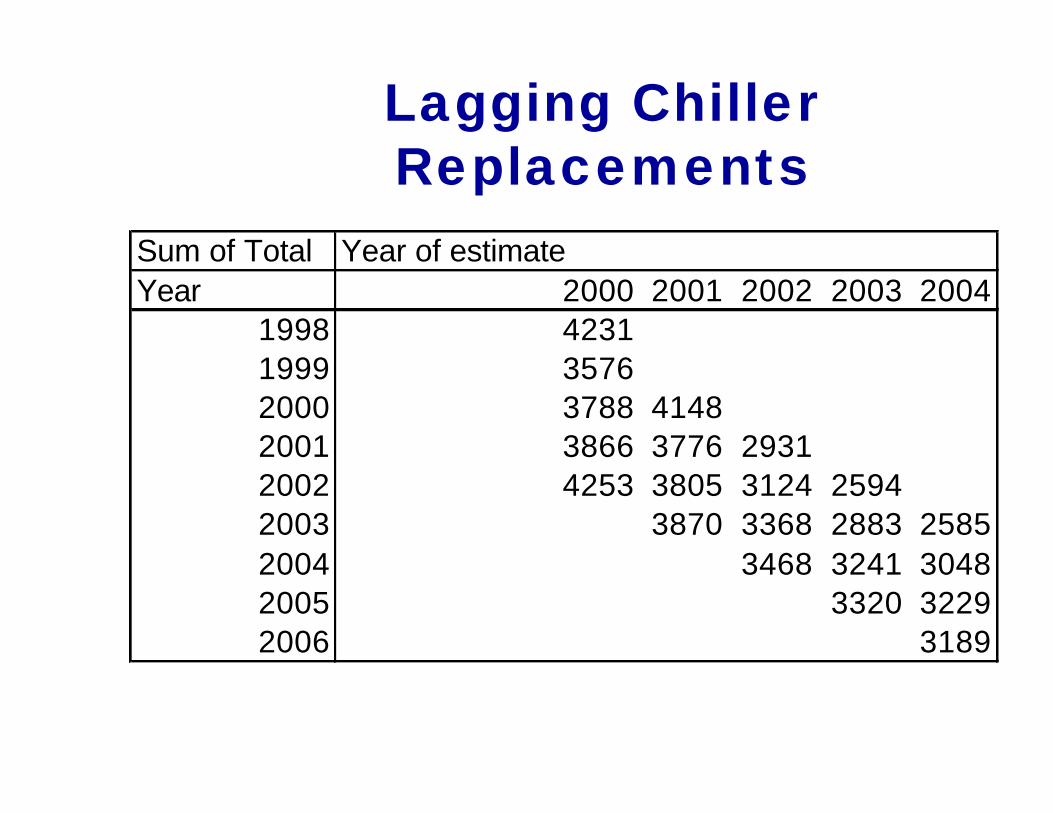
Sum of Total Year of estimateYear 2000 2001 2002 2003 2004
1998 42311999 35762000 3788 41482001 3866 3776 29312002 4253 3805 3124 25942003 3870 3368 2883 25852004 3468 3241 30482005 3320 32292006 3189
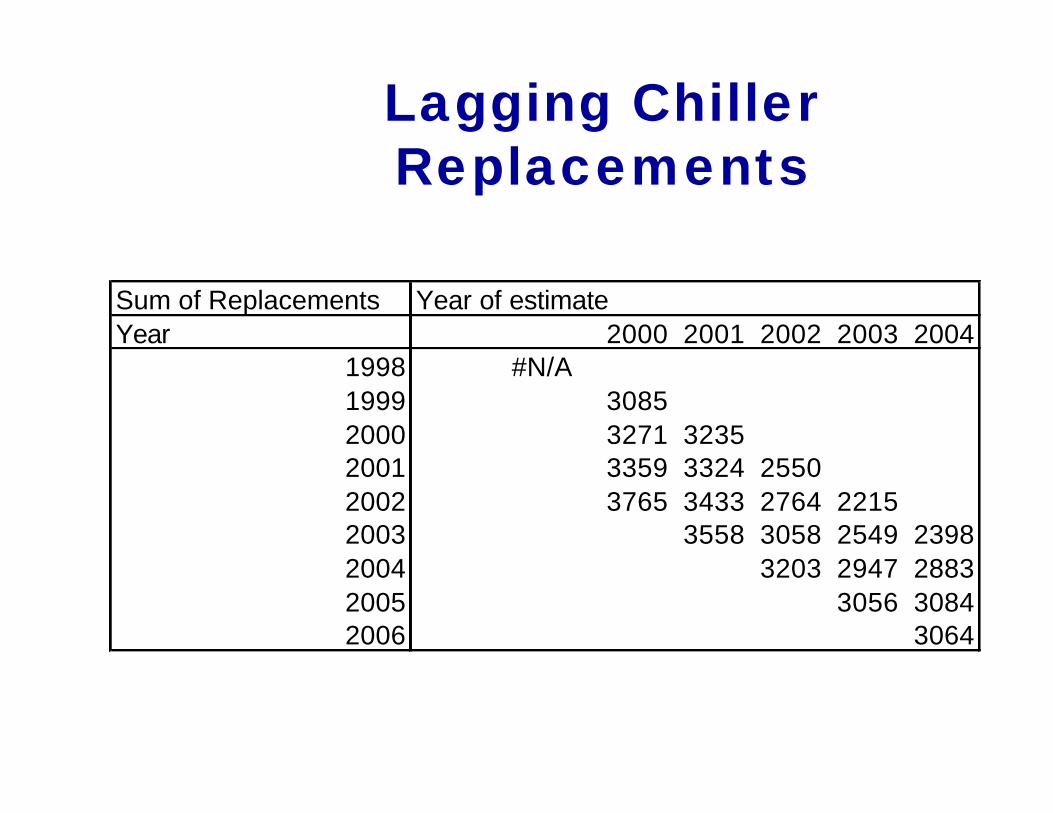
Lagging Chiller Replacements
Sum of Replacements Year of estimateYear 2000 2001 2002 2003 2004
1998 #N/A1999 30852000 3271 32352001 3359 3324 25502002 3765 3433 2764 22152003 3558 3058 2549 23982004 3203 2947 28832005 3056 30842006 3064

Lagging Chiller Replacements
Sum of Conversions Year of estimateYear 2000 2001 2002 2003 2004
1998 #N/A1999 491 2000 517 913 2001 507 452 381 2002 488 372 360 379 2003 312 310 334 187 2004 265 294 165 2005 264 145 2006 125

Lagging Chiller Replacements
Lagging Chiller Replacements

Lagging Chiller Replacements

Lagging Chiller Replacements

Chillers in Developing Countries
Country Total CFC Chiller Stock
Total CFC Use (tons)
Total Charge (tons)
Argentina 300 60 120 Botswana 80 12 32 Chile 170 25 68 China 1,750 460 1,225 Columbia 450 68 180 Croatia 54 3 14 Egypt 670 100 268 Fiji 5 3 2 Guatemala 100 15 40 India 1,100 171 596 Indonesia 1,300 195 520 Malaysia 1,500 225 600 Mexico 1,500 225 600 Philippines 800 120 320 South Africa 250 14 38 Syria 32 13 13 Thailand 1,500 225 600 Turkey 2,500 188 500 Venezuela 500 100 200 Total 14,561 2,222 5,935

Notes on Developing Country Chiller Situation
w As this table shows, CFC chillers in developing countries may bealmost 15,000 units containing almost 6,000 tons of CFCs and emitting over 2,000 tons per year (provisional numbers based on data and estimates from a variety of sources).
w In 1994, UNEP estimated there were approximately 8,000 CFC-11 and 2,000 CFC-12 chillers (or 10,000 total) in service in Article 5 countries,containing approximately 4,000 tons of CFC.
w A midpoint estimate therefore yields 12,500 chillers containing approximately 5,000 tons of CFCs.

Chiller Energy Efficiency Gains (kW Per Ton of Refrigeration
Capacity)Year Average Best 1979 0.8 0.72 1980 0.72 0.68 1990 0.65 0.62 1991 0.64 0.6 1993 0.63 0.55 1995 0.61 0.52 1997 0.6 0.49 1999 0.59 0.48
Progress since 1999?
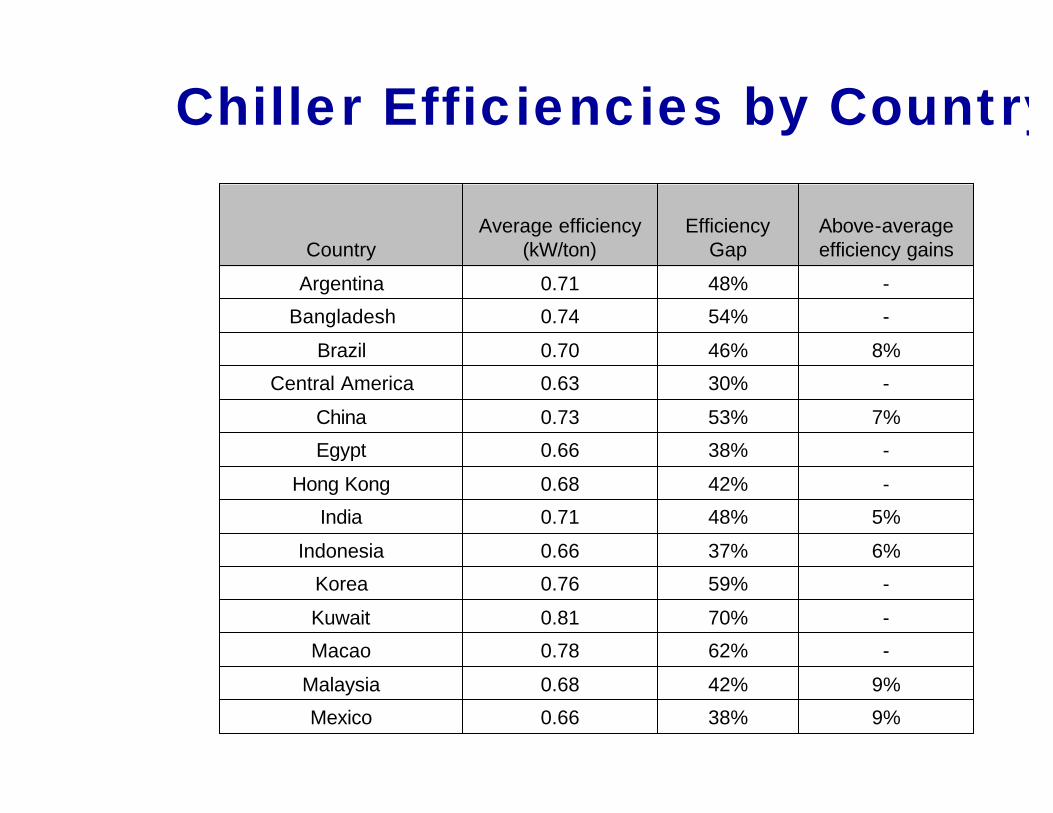
Chiller Efficiencies by Country
9%38%0.66Mexico
9%42%0.68Malaysia
-62%0.78Macao
-70%0.81Kuwait
-59%0.76Korea
6%37%0.66Indonesia
5%48%0.71India
-42%0.68Hong Kong
-38%0.66Egypt
7%53%0.73China
-30%0.63Central America
8%46%0.70Brazil
-54%0.74Bangladesh
-48%0.71Argentina
Above-average efficiency gains
Efficiency Gap
Average efficiency (kW/ton)Country

Chiller Efficiencies by Country (cont’d)
7%-0.48Best efficiency
3%25%0.60Worldwide average
4%48%0.71Average
-34%0.64Dominican Republic
-49%0.71Vietnam
-40%0.67Venezuela
-55%0.74United Arab Emirates
14%47%0.70Turkey
-61%0.77Trinidad
7%48%0.71Thailand
11%36%0.65Singapore
-57%0.75Saudi Arabia
-43%0.69Russia
5%47%0.71Philippines
Above-average
efficiency gains
Efficiency Gap
Average efficiency (kW/ton)Country
Notes on Chiller Efficiencies by Country
w Average efficiency is calculated from energy efficiency, chillers sales, and market share data provided by Ozone Protection Units and chillermanufacturers for 1996-2001. Breakdowns by manufacturer and year are not shown in order to protect data confidentiality.
w The “efficiency gap” is calculated as the percentage difference between average efficiency and the best efficiency level. Since the highest efficiency levels may not be technically available or economically feasible for all applications, this should not be taken as an accurate indicator of absolute energy savings potential. It is however a good indicator of relative potential for increased sales of energy-efficient chillers.
w “Above average efficiency gains” shows improvement in average efficiency during 1996-2001. Calculated decreases in efficiency are not shown, since these are believed to be largely due to lack of full sales and efficiency data.
World Bank Pilot Chiller Replacement
Projects
wThailand
wMexico
wTurkey
wIndia

Thailand Pilot Projectw Background
– An estimated 1500 CFC chillers (95% using CFC-12) are in operation in Thailand, more than 80% in Bangkok. Chillers are supplied by seven manufacturers, with five (Carrier, Daikin, McQuay, Trane, and York) accounting for the majority of production. All of these chillers were installed prior to 1994, since CFC-based chillers have not been available in Thailand since 1993, and chillers now in operation are therefore at least 10 years old. Average cooling capacity is between 400 and 500 tons.
w Primary Project Objectives– Reduce GHG emissions: To achieve the highest energy savings possible, the chiller project is also intended
to address the replacement of CFC chillers that are older than 9 years. While newer centrifugal chillers consume less energy, those installed before 1993 were found to consume significantly more: approximately 0.8 - 1.0 kW per refrigerated ton.
– Reduce consumption of ODSw Secondary Objectives
– Learn lessons for projects in other countries– Reduce the stress on the electrical system in Thailand– Lessen the need for new generation capacity in Thailand
w Scope– $5 million grant funding split between Global Environment Facility (GEF) for energy efficiency component
and Montreal Protocol Multilateral Fund (MLF) for ozone component.– Planned 20-24 chiller pilot (results have exceeded this, including chillers replaced by owners on their own
with technical assistance from the program).– Funds loans to chiller owners to finance replacements.– Potential additional 420 chillers financed with US$25 million loan in second phase.
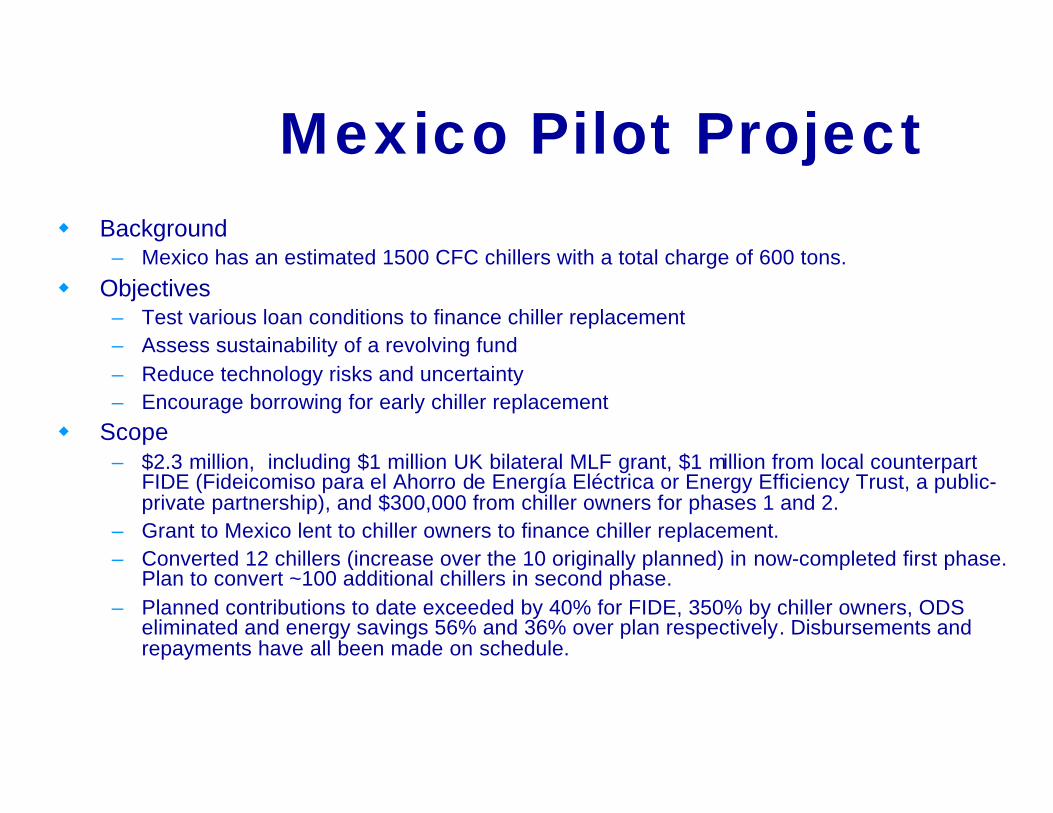
Mexico Pilot Projectw Background
– Mexico has an estimated 1500 CFC chillers with a total charge of 600 tons.
w Objectives– Test various loan conditions to finance chiller replacement– Assess sustainability of a revolving fund– Reduce technology risks and uncertainty– Encourage borrowing for early chiller replacement
w Scope– $2.3 million, including $1 million UK bilateral MLF grant, $1 million from local counterpart
FIDE (Fideicomiso para el Ahorro de Energía Eléctrica or Energy Efficiency Trust, a public-private partnership), and $300,000 from chiller owners for phases 1 and 2.
– Grant to Mexico lent to chiller owners to finance chiller replacement.– Converted 12 chillers (increase over the 10 originally planned) in now-completed first phase.
Plan to convert ~100 additional chillers in second phase.– Planned contributions to date exceeded by 40% for FIDE, 350% by chiller owners, ODS
eliminated and energy savings 56% and 36% over plan respectively. Disbursements and repayments have all been made on schedule.

Turkey Chiller Projectw Project approved December 2001, work started 2002.
w In addition to Recovery/Recycling/Reclamation, training, and other refrigeration sector activities, the project will also replace 65 CFC chillers in 2 phases (25 in phase 1 and 40 in phase 2) containing approximately 11 metric tons of CFCs.
w The stock of CFC chillers in Turkey is about 2,500 units containing a total charge of 375-500 tons (150+ kg/unit). A revolving fund will provide interest free loans covering up to 80% of chiller replacement costs, with a payback period of 4 years.
w After Phase I, the cash flow for the revolving fund will be analyzed and payback terms adjusted as needed.

India Chiller Studyw Purpose:
– collect and analyze data on India’s chiller sector– determine whether 2010 phaseout target can be met– calculate incremental costs;– develop project strategy to support phaseout.
w Findings:– There are over 1100 CFC chillers still in use in India with total charge of
approximately 600 tons.– Many of these chillers are already beyond their useful economic lifetimes.– Given current regulations and trends in the chiller sector, it is projected that India
will not meet the 2010 phaseout requirement unless additional action is taken.– There is a positive incremental cost for chiller replacement. Current and projected
chiller replacement trends and an implied discount rate of over 30% for chiller replacement suggests the existence of significant barriers.
w A chiller replacement project is being developed based on these results.
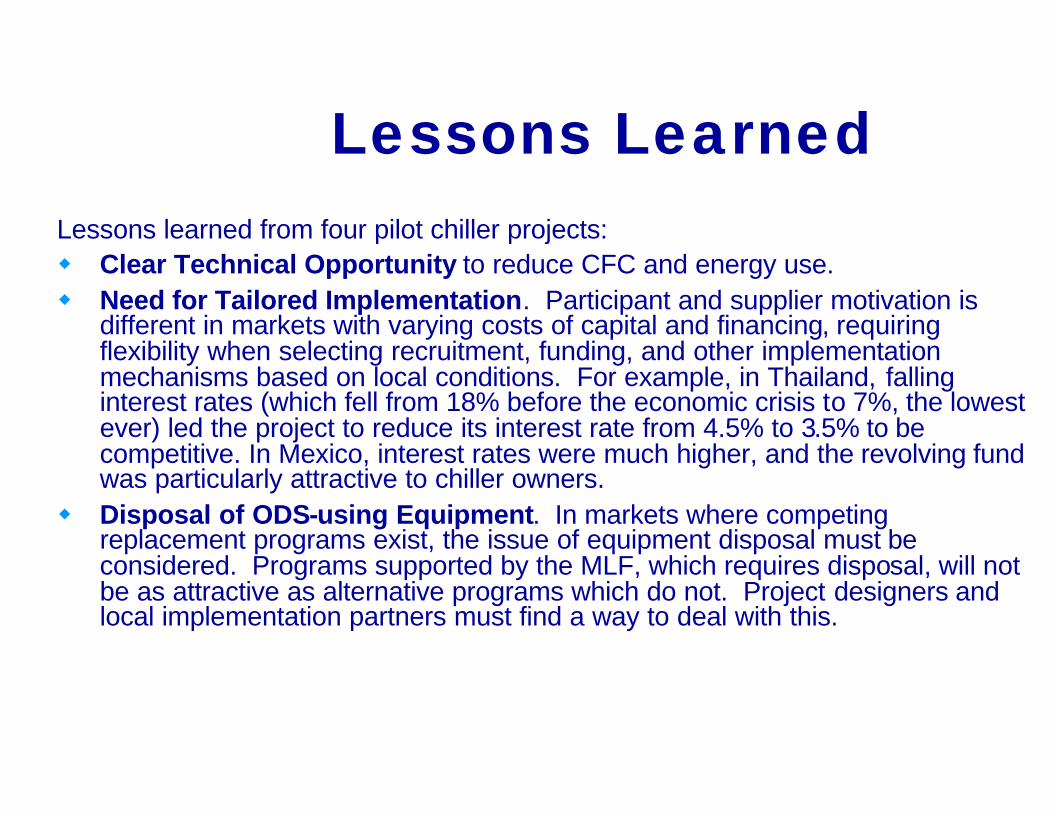
Lessons LearnedLessons learned from four pilot chiller projects:w Clear Technical Opportunity to reduce CFC and energy use.w Need for Tailored Implementation. Participant and supplier motivation is
different in markets with varying costs of capital and financing, requiring flexibility when selecting recruitment, funding, and other implementation mechanisms based on local conditions. For example, in Thailand, falling interest rates (which fell from 18% before the economic crisis to 7%, the lowest ever) led the project to reduce its interest rate from 4.5% to 3.5% to be competitive. In Mexico, interest rates were much higher, and the revolving fund was particularly attractive to chiller owners.
w Disposal of ODS-using Equipment. In markets where competing replacement programs exist, the issue of equipment disposal must be considered. Programs supported by the MLF, which requires disposal, will not be as attractive as alternative programs which do not. Project designers and local implementation partners must find a way to deal with this.

Lessons Learned(continued)
w Communicating Benefits to Chiller Owners. Project experience suggests that initial skepticism among chiller owners requires effective communication of the benefits of chiller replacement early in the recruitment process. Once these benefits are understood, chiller owners have been very motivated to participate, particularly in combination with improved access to financing, and technical assistance.
w Support for Existing Policies. In countries where existing or new regulations promote replacement of inefficient chillers (e.g., ODS phase-outs, building energy use codes), a chiller replacement program can facilitate and/or speed their implementation. A chiller replacement program gives owners a powerful incentive to replace chillers before mandatory compliance.

Lessons Learned(continued)
w Supplier Motivation. Suppliers have been very motivated to collaborate with chiller programs. However, project experience shows that service contracts with local service providers may need to be strengthened to ensure that projects succeed during the critical first two years of a replacement project. Poor service during this period can jeopardize the commissioning of replacement chillers. Clear requirements and guidelines may need to be incorporated into sales agreements for suppliers wishing to participate in programs that access concessional financing.
w Chiller Owner Recruitment. Program designers should streamline the participation process to the maximum extent possible to capture and retain participants.
w Premium Properties. Project experience indicates that premium properties with high interest in customer comfort (e.g., hotels, shopping malls, etc.) have the highest initial interest in chiller replacement programs. These owners may be effective first targets for future programs.

Lessons Learned(continued)
w Technical Assistance. Technical Assistance is a critical part of successful chiller programs. It can include both organizational effort required to select participants and evaluate program performance, as well as technical assistance of the type normally provided by a supplier. Since intensive technical assistance may not be in line with existing business practices of suppliers, it is important to design programs carefully to either provide certain types of technical assistance outside of the supplier-owner relationship, or require additional support from the supplier as part of program participation guidelines.
w Variability in Energy Savings. Energy savings does not depend only on cooling capacity size, but on power consumption and operating hours as well. Energy saving also depends on the chiller being appropriately size to operate at its maximum efficiency. These considerations should be taken into account when analyzing potential project impacts.

Lessons Learned(continued)
w Operation and Management. During the preparation stage, the concept of preventative maintenance has been successfully promoted among chiller owners. Providing technical assistance in this area can help increase the benefits of a program, by improving practices among chiller owners who would not otherwise participate in the program of replacement.
w Selection Criteria. Proper selection criteria should be evaluated for each program. Since criteria can either shrink or expand the potential pool of participants, criteria need to be calibrated with program goals. Early or initial phases may need to be more stringent with the use of criteria, while later phases may require the easing of criteria in order to reach additional participants.
w Over Capacity of Existing Chillers. Many building owners have more installed chiller capacity than they need, providing additional savings opportunity.

Chiller Industry Views: Barriers to Chiller
Replacement in Developing Countries
q First costq Technical skills (in particular, tendency to mis-specify chiller capacity)q Opportunity Awarenessq Trustq Building codesq Manufacturer/vendor issuesq Data issuesq Subsidies/policy issues

Chiller Industry Views: Promoting Chiller
Replacement in DCsq Rebatesq Revolving loan fundsq Performance contractingq Technical assistance and training q Building codes and design standard supportq Policy supportq Energy efficient buildings promotionq Leverage existing funding programsq Project design and execution

Revolving Loan Fundw A revolving loan fund would make loans to chiller owners and
purchasers. Repayments from borrowers are then recycled to allow issuance of new loans, allowing the number of loans to be increased. Due to the fund’s specialization and programmatic focus, administrative costs can also be reduced.
w Both the Thai and Mexico chiller projects made use of revolving loan funds.
w Chiller manufacturers surveyed were highly supportive of the idea of a revolving fund, and felt that it could significantly reduce the first cost and financing barriers.
w A revolving fund could potentially be organized on a country-by-country basis, a regional basis, as a single global fund operating simultaneously in multiple countries, or as a combination of interlocking global/regional and country funds.
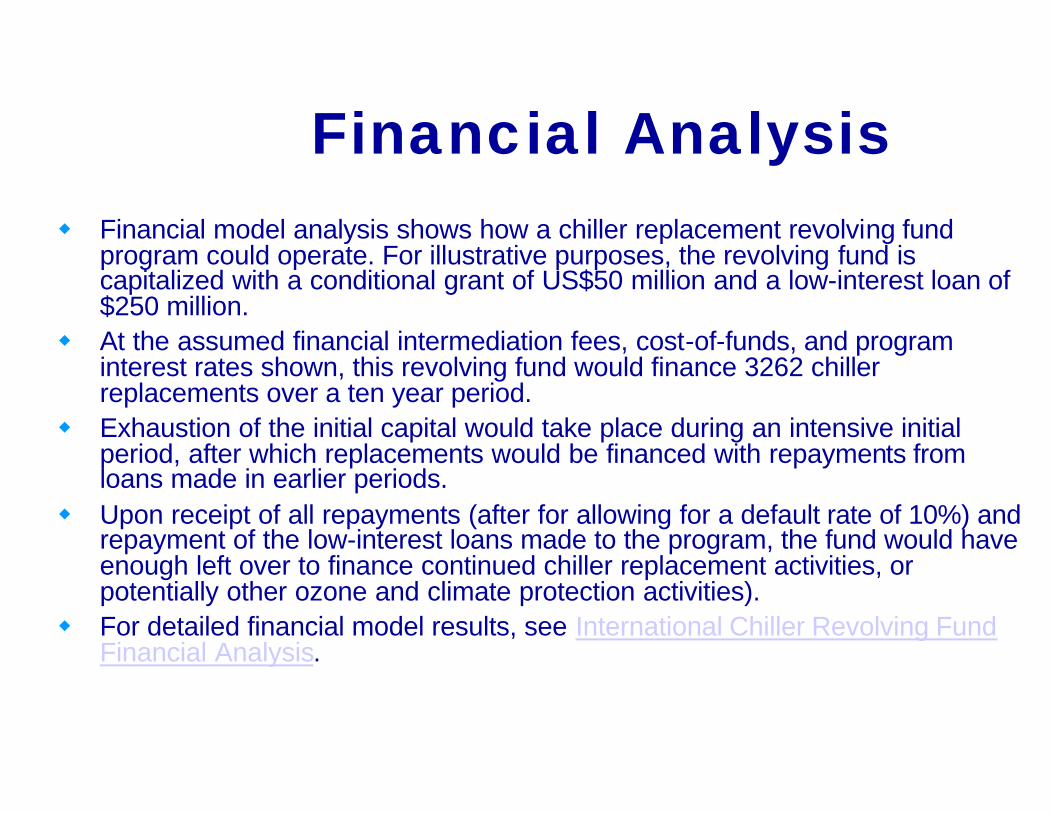
Financial Analysisw Financial model analysis shows how a chiller replacement revolving fund
program could operate. For illustrative purposes, the revolving fund is capitalized with a conditional grant of US$50 million and a low-interest loan of $250 million.
w At the assumed financial intermediation fees, cost-of-funds, and program interest rates shown, this revolving fund would finance 3262 chiller replacements over a ten year period.
w Exhaustion of the initial capital would take place during an intensive initial period, after which replacements would be financed with repayments from loans made in earlier periods.
w Upon receipt of all repayments (after for allowing for a default rate of 10%) and repayment of the low-interest loans made to the program, the fund would have enough left over to finance continued chiller replacement activities, or potentially other ozone and climate protection activities).
w For detailed financial model results, see International Chiller Revolving Fund Financial Analysis.

Which Chillers to Replacew In designing a chiller replacement program, should one target
“old” or “young” chillers?w Assuming that chillers ranging from 20-30 years old are being
targeted and a normal distribution, if you target the old half, then at the end of 10 years the same chillers are left that would have been left anyway.
w If you target the younger half, then at the end of 10 years all of them will be gone (because the older half only has at most 10 years to live anyway).
w That's the simple answer, but what if you calculate the expectedemissions of each approach? A spreadsheet model of the impact says you should take the middle half.

Which Chillers to Replacew Conversion will tend to be a preferred option for younger chillers,
which have longer remaining lifetimes, much lower refrigerant leakage rates, and generally higher efficiency levels than oldermachines. Replacements should therefore target neither the youngest chillers nor the oldest ones (which have much higher refrigerant leakage rates and lower efficiency levels, but short remaining lifetimes and are therefore more likely to be retired on their own), but the middle cohort.
w This approach does in fact maximize ODS emissions reductions (and similarly, energy efficiency gains). Based on equal distribution of a total of 12,500 chillers (595 chillers per agegroup) and a per chiller charge of ~500 kg, the middle 3,500 chillers (aged 17-22) are those which are most effectively targeted in order to maximize ODS phaseout per chiller.

Chiller Age Distribution Analysis
Chiller age Cum.
number
Average Leak Rate
Average annual
emissions per chiller (kg ODP)
Annual emissions
(ODP tons)
Remaining life (chiller-
years)
Emissions over
remaining life (ODP tons)
Cum. emissions
over remaining life (ODP tons)
Total ODS
impact (ODP tons)
Cum. ODS
impact (ODP tons)
Phase-out per chiller
(kg ODP) CE-based subsidy
10 595 1% 5 3 11,905 60 60 357 357 100 $152 11 1,190 3% 15 9 11,310 167 226 464 822 280 $426 12 1,786 5% 25 15 10,714 263 489 560 1,382 441 $671 13 2,381 7% 34 20 10,119 347 835 644 2,026 582 $886 14 2,976 9% 44 26 9,524 419 1,254 717 2,743 704 $1,071 15 3,571 11% 54 32 8,929 480 1,734 778 3,520 806 $1,226 16 4,167 13% 64 38 8,333 529 2,264 827 4,347 889 $1,352 17 4,762 15% 73 44 7,738 567 2,830 864 5,211 952 $1,448 18 5,357 17% 83 49 7,143 593 3,423 890 6,102 996 $1,515 19 5,952 19% 93 55 6,548 607 4,031 905 7,007 1,020 $1,552 20 6,548 21% 103 61 5,952 610 4,641 908 7,914 1,025 $1,559 21 7,143 22% 112 67 5,357 601 5,242 899 8,813 1,010 $1,537 22 7,738 24% 122 73 4,762 581 5,823 879 9,692 976 $1,484 23 8,333 26% 132 78 4,167 549 6,372 847 10,539 922 $1,403 24 8,929 28% 142 84 3,571 505 6,877 803 11,342 849 $1,291 25 9,524 30% 151 90 2,976 450 7,327 748 12,089 756 $1,150 26 10,119 32% 161 96 2,381 383 7,711 681 12,770 644 $980 27 10,714 34% 171 102 1,786 305 8,016 603 13,373 512 $779 28 11,310 36% 181 107 1,190 215 8,231 513 13,885 361 $549 29 11,905 38% 190 113 595 113 8,344 411 14,296 190 $289 30 12,500 40% 200 119 - - 8,344 298 14,594 - $-
Total 12,500 20.5% 103 1,281 125,000 8,344 8,344 14,594 14,594 668 $10,153
Years 17-22
3,571 23.4% 98 349 37,500 3,559 3,559 5,345 5,345 997 $15,159
Other years
8,929 19.6% 104 933 87,500 4,784 4,784 9,249 9,249 536 $8,150

Conclusion
If 3,300 inefficient CFC chillers could be replaced with efficient non-CFC chillers:
w Emission of over 5,000 ODP tons total would be eliminated;w Peak demand would be reduced by approximately 0.4 GW
(avoiding US$.4 billion in new generation investment); w Save $0.4 billion (Net Present Value) in operating costs.w Over 50 thousand tons per year of local air pollution would be
avoided; andw 0.8 billion metric tons of carbon dioxide emissions would be
avoided.

Ray Phillips
ICF Consulting
1725 Eye Street, NW, Suite 1000
Washington, DC 20006
tel. 202/862-1554, fax 202/862-1144
email [email protected]
Contact Information