Embed Size (px)
Citation preview

8/23/2019 Global Oil Dashboard - Q1 2013 - Will Martin - Peakoilproof.com
http://slidepdf.com/reader/full/global-oil-dashboard-q1-2013-will-martin-peakoilproofcom 1/13
Global Oil Productionyear-over-year growth
Real World GDP Growth
Crude Oil PriceBrent yoy change
The global rate of oil production is up slightly year-over-year.
However, during the same period global net exports of oil
declined. Global supermajor production continues to fall.
Global supermajor operating profits also fell as the cost of
drilling remained at record highs. Based on this data, we are
likely still on the "bumpy plateau" of peak oil and have likely
passed "peak oil exports."
Global oil consumption was up slightly year-over-year.
Consumption fell in the US & EU, while consumption rose in Asia
and most of the developing world. The economies of the
developed world are shrinking on a relative basis to the global
economy. Europe is officially in a double-dip recession. GDPgrowth remains strong in Asia and the developing world. In Q1
2013 China overtook the US as the world's largest oil importer -
the first time the top spot has changed hands in 41 years.
The price of crude oil fell nearly 10% year-over-year, but
remained well above historical averages. Prices in futures and
options markets seem to indicate a belief that oil prices will
continue to fall, possibly due to slowing global economic growth.
The global money supply rose 6% year-over-year as central
banks pumped more money into their economies, but a falling
velocity of money kept inflation from pushing up oil prices in real
terms.
Demand
Price
Supply
Peak Oil Dashboard: Page 1
Q1 2013Created by Will Martin - Peakoilproof.com
Global Peak Oil Summary
This dashboard is designed to quickly summarize the global oil market over the past quarter. By keeping track of key
quantitative indicators on a quarterly basis, this dashboard can help monitor the onset of peak oil.
-10%
-8%
-6%
-4%
-2%0%
2%
4%
6%
8%
10%
-10%
-8%
-6%
-4%
-2%0%
2%
4%
6%
8%
10%
<-25%
-20%
-15%
-10%
-5%0%
5%
10%
15%
20%
>25%

8/23/2019 Global Oil Dashboard - Q1 2013 - Will Martin - Peakoilproof.com
http://slidepdf.com/reader/full/global-oil-dashboard-q1-2013-will-martin-peakoilproofcom 2/13

8/23/2019 Global Oil Dashboard - Q1 2013 - Will Martin - Peakoilproof.com
http://slidepdf.com/reader/full/global-oil-dashboard-q1-2013-will-martin-peakoilproofcom 3/13
Russia5-Year Net Oil Export CAGR
Saudi Arabia5-Year Net Oil Export CAGR
Iraq5-Year Net Oil Export CAGR
United Arab Emirates5-Year Net Oil Export CAGR
Kuwait5-Year Net Oil Export CAGR
Nigeria5-Year Net Oil Export CAGR
Venezuela5-Year Net Oil Export CAGR
Norway5-Year Net Oil Export CAGR
Libya5-Year Net Oil Export CAGR
Canada5-Year Net Oil Export CAGR
Oil Supply: Export SupplyThe Top 10 Oil Exporting Countries Represent 81% of World Oil Export Supply - Net Exports Estimated Using Jeffrey Brown's Export Land Model
Summary: Global oil exports remain relatively flat year-on-year but are still down about 3 MMBPD from their peak in 2004. Half of the top 10 oil exporting nations, which tog ether represent
81% of global oil exports, are now experiencing 5-year net export rate declines. Saudi Arabia, Nigeria, Venezuela, Norway and Libya are all seeing lower rates of net exports. This decline has
been somewhat offset by huge increases in oil exports from Iraq and Canada. Total liquid production rates continue to decline for the Supermajors. Overall, global net oil exports do not
appear to be responding to record-high oil prices, signaling that we may be on the "bumpy plateau" of peak oil.
Global Net Oil ExportsFor Top 19 Oil Exporting Nations
Supermajor Production RateBP, Chevron, ExxonMobil, Shell, & Total
Peak Oil Dashboard: Page 3
Q1 2013Created by Will Martin - Peakoilproof.com
Peak Oil
Sooner
Russia
Saudi Arabia
0
5,000
10,000
15,000
20,000
25,000
30,000
35,000
40,000
A p r - 0 3
O c t - 0 3
A p r - 0 4
O c t - 0 4
A p r - 0 5
O c t - 0 5
A p r - 0 6
O c t - 0 6
A p r - 0 7
O c t - 0 7
A p r - 0 8
O c t - 0 8
A p r - 0 9
O c t - 0 9
A p r - 1 0
O c t - 1 0
A p r - 1 1
O c t - 1 1
A p r - 1 2
O c t - 1 2
A p r - 1 3
T h o u s a n d B P D
ExxonMobil
Chevron
Shell
Total
BP
0
2,000
4,000
6,000
8,000
10,000
12,000
2 0 0 0
2 0 0 1
2 0 0 2
2 0 0 3
2 0 0 4
2 0 0 5
2 0 0 6
2 0 0 7
2 0 0 8
2 0 0 9
2 0 1 0
2 0 1 1
2 0 1 2
T o t a l L i q u i d s P r o d u c t i o n
R a t e ( T h o u s a n d
B P D )
-10%
-8%
-6%
-4%
-2%0%
2%
4%
6%
8%
10%
Peak Oil
Sooner
Peak Oil
Sooner
Peak Oil
Sooner
Peak Oil
Sooner
-10%
-8%
-6%
-4%
-2%0%
2%
4%
6%
8%
10% -10%
-8%
-6%
-4%
-2%0%
2%
4%
6%
8%
10% -10%
-8%
-6%
-4%
-2%0%
2%
4%
6%
8%
10% -10%
-8%
-6%
-4%
-2%0%
2%
4%
6%
8%
10%
Peak Oil
Sooner
Peak Oil
Sooner
Peak Oil
Sooner
Peak Oil
Sooner
Peak Oil
Sooner
-10%
-8%
-6%
-4%
-2%0%
2%
4%
6%
8%
10% -10%
-8%
-6%
-4%
-2%0%
2%
4%
6%
8%
10% -10%
-8%
-6%
-4%
-2%0%
2%
4%
6%
8%
10% -10%
-8%
-6%
-4%
-2%0%
2%
4%
6%
8%
10% -10%
-8%
-6%
-4%
-2%0%
2%
4%
6%
8%
10%

8/23/2019 Global Oil Dashboard - Q1 2013 - Will Martin - Peakoilproof.com
http://slidepdf.com/reader/full/global-oil-dashboard-q1-2013-will-martin-peakoilproofcom 4/13
Russia Russia Q1 2013 News Saudi Arabia Saudi Arabia Q1 2013 News
Russian oil production reached a post-Soviet recordlevel in Q1 2013. However, the ratings agency Fitch
announced that Russian oil production would probably
peak in the next few years.
China passed Europe to become Russia’s number one
oil market. The Russian government announced that
Rosneft and Gazprom will receive licenses to drill
offshore in the Russian Arctic.
Export cannibalization continues to grow in SaudiArabia. The Saudis have 3 new refineries under
construction that will net exports by 1.2 million BPD in
2017.
Saudi Arabia's Oil Minister Ali Al-Naimi said that $100 a
barrel oil was a “reasonable” rice and that "prices will
stay at these current levels in the foreseeable future."
Prince Muqrin bin Abdulaziz was placed second in line
to the throne. Based on actuarial tables, the 88-year
old King Abdullah has about a 15% chance of dying in
the next year.
Iraq Iraq Q1 2013 News United Arab Emirates United Arab Emirates Q1 2013 NewsChaos continued in many parts of the country with car
bombs going off on an almost daily basis. Sunni
protests grew in intensity, with many analysts believing
that Southern Iraq is on the verge of a Sunni-Shiite civil
war.
A standoff between the main government and theautonomous Kurdish Northern government continued.
Kurdistan began exporting oil directly to Turkey,
bypassing the federal Iraqi government completely.
Announced plans to raise oil production capacity by
200,000 bpd.
Meanwhile the UAE opened the world’s largest solar
plant, named Shams 1.
Kuwait Kuwait Q1 2013 News Nigeria Nigeria Q1 2013 NewsKuwait also announced that it plans to spend $56
billion over the next 5 years to raise production by
650,000 bpd by 2020.
The Kuwaiti central bank announced that its economy
would likely grow at just 1.9% in 2013 – slowing oil
export cannibalization.
Nigeria’s oil production fell precipitously year-over-
year, mostly as the result of vandalism and oil theft.
Shell and other oil companies had to declare force
majeure four times in Q1 as the result of oil theft.
Crude oil theft is now such a serious problem in Nigeria
that it costs the country $7 billion annually.
Nigeria’s four main opposition parties formed a
coalition, threatening President Goodluck Jonathan's
hold on power.
Venezuela Venezuela Q1 2013 News Norway Norway Q1 2013 NewsPresident Hugo Chávez died on March 5th, 2013. His
successor, Nicolas Maduro, announced that he will
maintain the oil industry policies of Chávez.
Venezuela announced a major currency devaluation in
Q1, stoking fears of higher inflation to come.
Imports of gasoline from the United States hit a record
high in Q1.
Oil production fell to a 25-year low. The state of Texas
now produces more oil than the country of Norway.
The oil ministry announced that it expects production
to continue to decline in 2013.
Libya Libya Q1 2013 News Canada Canada Q1 2013 NewsOil production hit 70% of its pre-Arab Spring levels.
Bombings, kidnappings and assassinations continue tomake the prospects of stability uncertain.
Canadian oil production is up dramatically year-over-
year.
Peak Oil Dashboard: Page 4
Q1 2013Created by Will Martin - Peakoilproof.com
Oil Supply: Export Supply: News SummariesThe Top 10 Oil Exporting Countries Represent 81% of World Oil Export Supply - Net Exports Estimated Using Jeffrey Brown's Export Land Model - Summaries Come From Tom Whipple's Weekly "Peak Oil Review"
0
2000
4000
6000
8000
10000
12000
A p r - 0 3
M a y - 0 4
J u n - 0 5
J u l - 0 6
A u g - 0 7
S e p - 0 8
O c t - 0 9
N o v - 1 0
D e c - 1 1
J a n - 1 3
T h o u s a n d B a r r e l s P e r D a y
P rodu ct ion Net E xport s
Consumption
0
2000
4000
6000
8000
10000
12000
A p r - 0 3
M a y - 0 4
J u n - 0 5
J u l - 0 6
A u g - 0 7
S e p - 0 8
O c t - 0 9
N o v - 1 0
D e c - 1 1
J a n - 1 3
T h o u s a n d B a r r e l s P e r D a y
P rodu ct ion Net E xpor ts
Consumption
-500
0
500
1000
1500
2000
2500
3000
3500
A p r - 0 3
M a r - 0 4
F e b - 0 5
J a n - 0 6
D e c - 0 6
N o v - 0 7
O c t - 0 8
S e p - 0 9
A u g - 1 0
J u l - 1 1
J u n - 1 2
T h o u s a n d B a r r e l s P e r D a y
P rodu ct ion Net E xpor ts
Consumption
0
5001000
1500
2000
2500
3000
3500
A p r - 0 3
M a r - 0 4
F e b - 0 5
J a n - 0 6
D e c - 0 6
N o v - 0 7
O c t - 0 8
S e p - 0 9
A u g - 1 0
J u l - 1 1
J u n - 1 2
T h o u s a
n d B a r r e l s P e r D a y
P rodu ct ion Net E xpor ts
Consumption
0
500
1000
1500
2000
2500
3000
A p r - 0 3
M a r - 0 4
F e b - 0 5
J a n - 0 6
D e c - 0 6
N o v - 0 7
O c t - 0 8
S e p - 0 9
A u g - 1 0
J u l - 1 1
J u n - 1 2
T h o u s a n d B a r r e l s P e r D a y
P rodu ct ion Net E xpor ts
Consumption
0
500
1000
1500
2000
2500
3000
A p r - 0 3
M a r - 0 4
F e b - 0 5
J a n - 0 6
D e c - 0 6
N o v - 0 7
O c t - 0 8
S e p - 0 9
A u g - 1 0
J u l - 1 1
J u n - 1 2
T h o u s a n d B a r r e l s P e r D a y
P rodu ct ion Net E xpor ts
Consumption
0
500
1000
1500
2000
2500
3000
3500
A p r - 0 3
M a r - 0 4
F e b - 0 5
J a n - 0 6
D e c - 0 6
N o v - 0 7
O c t - 0 8
S e p - 0 9
A u g - 1 0
J u l - 1 1
J u n - 1 2
T h o u s a n d B a r r e l s P e r D a y
P rodu ct ion Net E xpor ts
Consumption
0
500
1000
1500
2000
2500
3000
3500
A p r - 0 3
M a r - 0 4
F e b - 0 5
J a n - 0 6
D e c - 0 6
N o v - 0 7
O c t - 0 8
S e p - 0 9
A u g - 1 0
J u l - 1 1
J u n - 1 2
T h o u s a n d B a r r e l s P e r D a y
P rodu ct ion Net E xpor ts
Consumption
-500
0
500
1000
1500
2000
A p r - 0 3
M a r - 0 4
F e b - 0 5
J a n - 0 6
D e c - 0 6
N o v - 0 7
O c t - 0 8
S e p - 0 9
A u g - 1 0
J u l - 1 1
J u n - 1 2
T h o u s a n d B a r r e l s P e r D a y
P rodu ct ion Net E xpor ts
Consumption
-500
0
500
1000
1500
2000
2500
3000
3500
4000
A p r - 0 3
M a r - 0 4
F e b - 0 5
J a n - 0 6
D e c - 0 6
N o v - 0 7
O c t - 0 8
S e p - 0 9
A u g - 1 0
J u l - 1 1
J u n - 1 2
T h o u s a n d B a r r e l s P e r D a y
P rodu ct ion Net E xpor ts
Consumption

8/23/2019 Global Oil Dashboard - Q1 2013 - Will Martin - Peakoilproof.com
http://slidepdf.com/reader/full/global-oil-dashboard-q1-2013-will-martin-peakoilproofcom 5/13
US and Canada Total Drilling Rig Count Supermajor Quarterly Operating Profits
US Capital Expenditure Spending per Barrel of Oil Produced US Cost Per Well Drilled
Peak Oil Dashboard: Page 5
Q1 2013Created by Will Martin - Peakoilproof.com
Oil Supply: Production Costs and Operating Profits
Summary: Production costs continue to increase for oil drilling. Despite record-high oil prices, these increasing costs are resulting in decl ining profits for oil majors
$0
$500,000
$1,000,000
$1,500,000
$2,000,000
$2,500,000
$3,000,000
$3,500,000
$4,000,000
$4,500,000
2002 2003 2004 2005 2006 2007
US Nominal Cost per Crude Oil Well Drilled
US Real Cost per Crude Oil/Natural Gas/Dry Well Drilled
$0
$10,000,000,000
$20,000,000,000
$30,000,000,000
$40,000,000,000
$50,000,000,000
$60,000,000,000
$70,000,000,000
Q1-2012 Q2-2012 Q3-2012 Q4-2012
ExxonMobi l Chevron Shell Total BP
$0
$20
$40
$60
$80
$100
$120
$140
$160
2002 2003 2004 2005 2006 2007 2008 2009 2010 2011
0
500
1,000
1,500
2,000
2,500
3,000
A p r - 0 3
N o v - 0 3
J u n - 0 4
J a n - 0 5
A u g - 0 5
M a r - 0 6
O c t - 0 6
M a y - 0 7
D e c - 0 7
J u l - 0 8
F e b - 0 9
S e p - 0 9
A p r - 1 0
N o v - 1 0
J u n - 1 1
J a n - 1 2
A u g - 1 2
M a r - 1 3

8/23/2019 Global Oil Dashboard - Q1 2013 - Will Martin - Peakoilproof.com
http://slidepdf.com/reader/full/global-oil-dashboard-q1-2013-will-martin-peakoilproofcom 6/13

8/23/2019 Global Oil Dashboard - Q1 2013 - Will Martin - Peakoilproof.com
http://slidepdf.com/reader/full/global-oil-dashboard-q1-2013-will-martin-peakoilproofcom 7/13
8/23/2019 Global Oil Dashboard - Q1 2013 - Will Martin - Peakoilproof.com
http://slidepdf.com/reader/full/global-oil-dashboard-q1-2013-will-martin-peakoilproofcom 8/13
China (#1 Oil Importer)Real GDP Growth
United States (#2)Real GDP Growth
European Union (#3)Real GDP Growth
Japan (#4)Real GDP Growth
India (#5)Real GDP Growth
China (#1 Oil Importer)Real GDP Growth Relative to World
United States (#2)Real GDP Growth Relative to World
European Union (#3)Real GDP Growth Relative to World
Japan (#4)Real GDP Growth Relative to World
India (#5)Real GDP Growth Relative to World
Peak Oil Dashboard: Page 8Q1 2013
Created by Will Martin - Peakoilproof.com
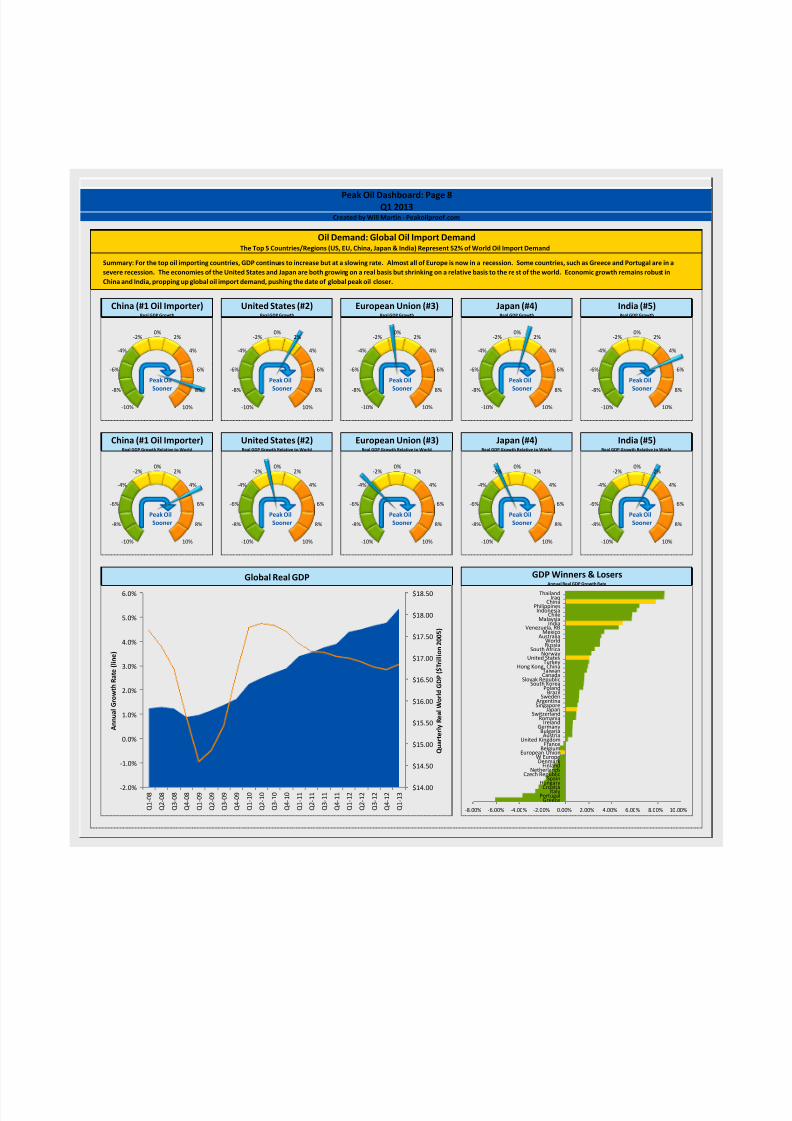
Oil Demand: Global Oil Import DemandThe Top 5 Countries/Regions (US, EU, China, Japan & India) Represent 52% of World Oil Import Demand
Summary: For the top oil importing countries, GDP continues to increase but at a slowing rate. Almost all of Europe is now in a recession. Some countries, such as Greece and Portugal are in a
severe recession. The economies of the United States and Japan are both growing on a real basis but shrinking on a relative basis to the re st of the world. Economic growth remains robust in
China and India, propping up global oil import demand, pushing the date of global peak oil closer.
Global Real GDP GDP Winners & LosersAnnual Real GDP Growth Rate
Peak Oil
Sooner
Peak Oil
Sooner
Peak Oil
Sooner
Peak Oil
Sooner
Peak Oil
Sooner
Peak Oil
Sooner
Peak Oil
Sooner
Peak Oil
Sooner
Peak Oil
Sooner
Peak Oil
Sooner
-10%
-8%
-6%
-4%
-2%0%
2%
4%
6%
8%
10%
-10%
-8%
-6%
-4%
-2%0%
2%
4%
6%
8%
10%
-10%
-8%
-6%
-4%
-2%0%
2%
4%
6%
8%
10%
-10%
-8%
-6%
-4%
-2%0%
2%
4%
6%
8%
10%
-10%
-8%
-6%
-4%
-2%0%
2%
4%
6%
8%
10%
-10%
-8%
-6%
-4%
-2%0%
2%
4%
6%
8%
10%
-10%
-8%
-6%
-4%
-2%0%
2%
4%
6%
8%
10%
-10%
-8%
-6%
-4%
-2%0%
2%
4%
6%
8%
10%
-10%
-8%
-6%
-4%
-2%0%
2%
4%
6%
8%
10%
-10%
-8%
-6%
-4%
-2%0%
2%
4%
6%
8%
10%
-2.0%
-1.0%
0.0%
1.0%
2.0%
3.0%
4.0%
5.0%
6.0%
Q 1 - 0 8
Q 2 - 0 8
Q 3 - 0 8
Q 4 - 0 8
Q 1 - 0 9
Q 2 - 0 9
Q 3 - 0 9
Q 4 - 0 9
Q 1 - 1 0
Q 2 - 1 0
Q 3 - 1 0
Q 4 - 1 0
Q 1 - 1 1
Q 2 - 1 1
Q 3 - 1 1
Q 4 - 1 1
Q 1 - 1 2
Q 2 - 1 2
Q 3 - 1 2
Q 4 - 1 2
Q 1 - 1 3
$14.00
$14.50
$15.00
$15.50
$16.00
$16.50
$17.00
$17.50
$18.00
$18.50
A n n u a l G r o w t h R a t e ( l i n e )
Q u a r t e r l y R e a l W o r l d G D P ( $ T r i l l i o n 2 0 0 5 )
-8.00% -6.00% -4.00% -2.00% 0.00% 2.00% 4.00% 6.00% 8.00% 10.00%
GreecePortugal
ItalyCroatia
HungarySpain
Czech RepublicNetherlands
FinlandDenmark
W EuropeEuropean Union
BelgiumFrance
United KingdomAustria
BulgariaGermany
IrelandRomania
SwitzerlandJapan
SingaporeArgentina
SwedenBrazil
PolandSouth Korea
Slovak RepublicCanadaTaiwan
Hong Kong, ChinaTurkey
United StatesNorway
South AfricaRussiaWorld
AustraliaMexico
Venezuela, RBIndia
MalaysiaChile
IndonesiaPhilippines
ChinaIraq
Thailand

8/23/2019 Global Oil Dashboard - Q1 2013 - Will Martin - Peakoilproof.com
http://slidepdf.com/reader/full/global-oil-dashboard-q1-2013-will-martin-peakoilproofcom 9/13
China Q1 2013 NewsChina overtook the US as the world’s largest net oil importer. The US had been the largest net oil importer since 1972. Car sales rose 20% year-over-year, but China’s economy grew
at its slowest rate in 13 years as exports fell.
China signed a major gas deal with Russia to import natural gas from Russian fields. Russia also announced that it would double its exports of oil to China. China awarded contracts
to 16 companies to drill in China’s shale gas reserves, but not a single one has ever drilled a gas well before.
Air pollution levels in Beijing went literally off the scale in Q1 2013. Chinese Premier Wen Jiabao called for action to alleviate the pollution and tax minister Jia Chen announced that
China would introduce a carbon tax. Not coincidentally, China’s coal consumption levels reached a record high. China now burns as much coal as the rest of the world combined.
China continued to pull ahead as the world leader in renewable energy. Wind power overtook nuclear power in China, producing 2% more electricity overall. For 2013, China
announced it will install more than 5 times more wind power than nuclear power a nd more than 3 times more solar power than nuclear power. China now installs three times more
solar each year as the United States – accounting for a t hird of the total world solar panels installed each year.
United States Q1 2013 NewsUS oil production reached a 20-year high, hitting 7 million bpd for the first time since March 1993. Meanwhile, the US has almost certainly passed “peak oil demand.” US oil demand
dropped to an 18-year low and us oil imports fell to their lowest level in 25 years. Gasoline consumption is at its lowest level since 2004. Obama’s State of the Union addressspecifically endorsed the McCain/Lieberman cap and trade bill; If climate change legislation is enacted, US oil demand would drop further.
While shale oil production rose dramatically, all other forms of US oil fell. US Gulf of Mexico oil production continued to decline off its 2009 peak. Production from Alaska’s North
Slope continues to fall from its 2002 peak and was down 8% year-over-year. Shell Oil gave up on the 2013 Arctic drilling season after its oil rig, the Kulluk, ran aground in Alaska.
Worryingly, the Bakken shale oil boom in North Dakota may be slowing down, with the initial productivity of new wells dropping. Companies are shifting their focus to California’s
Monterey shale, where they may face heavy environmentalist opposition.
The Federal Reserve has keep interest rates near 0% for four years and has tripled its balance sheet by continuing pump $85 billion each month into the economy.
European Union Q1 2013 NewsEurope was officially in a double-dip recession in Q1 2013, shrinking by 0.6%. Greece’s economy shrunk by 6.4% year-over-year. Unemployment in the Eurozone rose to 11.8% - the
highest level since the Eurozone was created in 1999. Europe has passed “peak oil demand”, with oil demand now down 2 million BPD from 7 years ago.
Cyprus announced a one-time bank levy on all Cypriot bank accounts on March 15th as part of a € 10 billion bailout. A panicked bank run ensued and the government was forced to
close all banks for 12 days. The government reopened its banks after it promised not to confiscate money from accounts smaller than €100,000.
In Italy, the government will likely remain in political gridlock after parliamentary elections split three ways, leaving no party in a p osition to govern.
Japan Q1 2013 NewsJapan remained in a recession, with its economy contracting for the third straight quarter. The escalating rhetoric between Japan and China over the Senkaku islands cooled when
Japan’s new prime minister Shinzō Abe send a letter to Chinese president Xi Jinping, expressing his interest in a peaceful resolution. The new prime minister also announced he would
approve the construction of new nuclear reactors – a complete 180 from former Prime Minister Yoshihiko Noda, who planned to shut down all Japanese nuclear power plants by
2040. Japan announced it would begin restarting its idled nuclear power plants by the end of 2013.
In Q1 2013 Japanese scientists announced that they had successfully extracted natural gas from subsea methane hydrates.
India Q1 2013 NewsIndia became the 4th largest oil consumer after China, the US and Russia. Meanwhile, India’s oil production rate fell 4% year-over-year. Amidst continued electricity shortages,
Indian coal imports fell 11% year-over-year. In Q1 the Indian government announced that it would raise gasoline and diesel prices as it continues to slowly phase out fuel subsidies.
Peak Oil Dashboard: Page 9
Q1 2013Created by Will Martin - Peakoilproof.com
Oil Demand: Global Oil Import DemandTop 5 Countries/Regions (US, EU, China, Japan & India) Represent 52% of World Oil Import Demand - Summaries From Tom Whipple's Weekly "Peak Oil Review"

8/23/2019 Global Oil Dashboard - Q1 2013 - Will Martin - Peakoilproof.com
http://slidepdf.com/reader/full/global-oil-dashboard-q1-2013-will-martin-peakoilproofcom 10/13
Global Crude Oil PriceBrent year-over-year % change
US Gasoline PriceUS Mogas year-over-year % change
Brent Put Option PayoffsCAGR of Returns
Brent Call PayoffsCAGR of Returns
Brent Straddle PayoffsCAGR of Returns
-9.7% -3.1%
Brent Futures WTI Futures
Backwardation Backwardation
WTI Crude Oil Implied Volatility SurfaceBrent Crude Oil Price
Oil Prices
Summary: Global oil pries are down about 10% year-over-year. This 1-year and 2-year trend of declining oil prices has reversed the 5-year and 10-year trends of rising oil prices. Both Brent
and WTI crude oil futures are in backwardation, indicating that traders expect the price of oil to fall in the future. This backwardation benefits investors who take long positions in futures
ETFs (like DBO & OIL), as there is no negative “roll yield," like when oil is in congtango. The difference in expected payoffs from put and call options contracts also tell us that traders believe
that a price drop is more likely than a price rise over t he near term.
Peak Oil Dashboard: Page 10
Q1 2013Created by Will Martin - Peakoilproof.com
$80
$85
$90
$95
$100
$80
$85
$90
$95
$100
1.01.5
2.53.5
4.5
6.00%
8.00%
10.00%
12.00%
14.00%
16.00%
$ 8 0 $
8 5 $
9 0 $
9 5
$ 1 0 0
$ 1 0 5
$ 1 1 0
I m p l i e d V o l a t i l i t y ( % )
Strike Prices
$0.00
$10.00
$20.00
$30.00
$40.00
$50.00
$60.00
$70.00
$80.00
$90.00
$100.00
$110.00
$120.00
$130.00
$140.00
$150.00
A p r - 0 3
A u g - 0 3
D e c - 0 3
A p r - 0 4
A u g - 0 4
D e c - 0 4
A p r - 0 5
A u g - 0 5
D e c - 0 5
A p r - 0 6
A u g - 0 6
D e c - 0 6
A p r - 0 7
A u g - 0 7
D e c - 0 7
A p r - 0 8
A u g - 0 8
D e c - 0 8
A p r - 0 9
A u g - 0 9
D e c - 0 9
A p r - 1 0
A u g - 1 0
D e c - 1 0
A p r - 1 1
A u g - 1 1
D e c - 1 1
A p r - 1 2
A u g - 1 2
D e c - 1 2
A p r - 1 3
A u g - 1 3
D e c - 1 3
A p r - 1 4
10-Year Linear (10-Year) Linear (5-Year) Linear (1-Year)
-10%
0%
10%
20%
30%
40%
50%
60%
70%
80%
90%
100%
$ 5 0 . 0
0
$ 6 0 . 0
0
$ 7 0 . 0
0
$ 8 0 . 0
0
$ 9 0 . 0
0
$ 1 0 0 . 0
0
Jun-14 Dec-14
Dec-15 Dec-16
-10%
0%
10%
20%
30%
40%
50%
60%
70%
80%
90%
100%
$ 1 0 0 . 0
0
$ 1 1 0 . 0
0
$ 1 2 0 . 0
0
$ 1 3 0 . 0
0
$ 1 4 0 . 0
0
$ 1 5 0 . 0
0
Jun-14 Dec-14
Dec-15 Dec-16
-10%
0%
10%
20%
30%
40%
50%
60%
70%
80%
90%
100%
$ 5 0 . 0
0
$ 7 5 . 0
0
$ 1 0 0 . 0
0
$ 1 2 5 . 0
0
$ 1 5 0 . 0
0
Jun-14 Dec-14
Dec-15 Dec-16
<-25%
-20%
-15%
-10%
-5%0%
5%
10%
15%
20%
>25% <-25%
-20%
-15%
-10%
-5%0%
5%
10%
15%
20%
>25%

8/23/2019 Global Oil Dashboard - Q1 2013 - Will Martin - Peakoilproof.com
http://slidepdf.com/reader/full/global-oil-dashboard-q1-2013-will-martin-peakoilproofcom 11/13
8/23/2019 Global Oil Dashboard - Q1 2013 - Will Martin - Peakoilproof.com
http://slidepdf.com/reader/full/global-oil-dashboard-q1-2013-will-martin-peakoilproofcom 12/13

8/23/2019 Global Oil Dashboard - Q1 2013 - Will Martin - Peakoilproof.com
http://slidepdf.com/reader/full/global-oil-dashboard-q1-2013-will-martin-peakoilproofcom 13/13
Page 11 Notes: Data for the money supply of each country comes from Haver Analytics. M3 money supply was used wherever possible. In countries that do not publish M3 data (such as the
United States) M2 money supply is used instead. A ll money supplies are converted to USD using current exchange rates. Velocity of money comes from the US Federal Reserve.
Page 11 Notes: Stock price data comes from Yahoo Finance. All data is adjusted for dividends and splits.
Page 8 Notes: "Real GDP" is country/regi on Gross Domestic Product at 2005 US Dollar prices and current Purchasing Power Parity exchange rates. Data comes from Oxford Economics and was
pulled into Microsoft Excel using Haver Analytics Data Link Express (DLX).
Page 9 Notes: Summaries come from Tom Whipple's "Peak Oil Review" published weekly by the Association for the Study of Peak Oil and Gas USA (ASPO-USA): http://aspous a.org/categ ory/peak-
oil-review/
Page 10 Notes: Data for crude oil prices and US gasoline prices comes from the Oil & Gas Journal. Data for Brent and WTI crude oil futures comes from Intercontinental Exchange and the Chicago
Mercantile Exchange, respecti vly. Data for Brent call and put options comes from barchart.com. Data for the WTI implied volitility surface comes from the Chicago Mercantile Exchange.
Page 1 Notes: This is simply a summary of the other pages
Page 2 Notes: "Oil Production" is the monthly total wellhead oil production rate. Wellhead production data comes from the Oil Market Intelligence report published by Energy Intelligence Group.
Data was pulled into Microsoft Excel using Haver Analytics Data Link Express (DLX).
Page 3 Notes: "Net Oil Exports" is the monthly total wellhead oil production rate minus the monthly petroleum consumption rate for each country/region. Wellhead production data comes from
the Oil Market Intelligence report published by Energy Intelligence Group. Country/reg ion petroleum consumption data comes from the annual Oil & Gas Journal from Pennwell Publishing. The
annual oil consumption rate is extrapolated forward using the prior 5-Year compound annual growth rate of consumption (CAGR) and converted into a monthly rate. D ata was pulled into
Microsoft Excel using Haver Anal ytics Data Link Express (DLX). Supermajor oil production rate data comes from 10-K annual reports published on the Securities and Exchange Commission
Electronic Data Gathering, Analysis, and Retrieval (EDGAR) system.
Page 4 Notes: Thank you to Jeffrey Brown for creati ng the "Export Land Model" that allows us to estimate current net exports of oil producing nations instead of waiti ng for the EIA to release
their estimates 2 years after they happen. "Net Oil Exports" is the monthly total wellhead oil production rate minus the monthly petroleum consumption rate for each country/region. Wellhead
production data comes from the Oil Market Intelligence report published by Energy Intelligence Group. Country/reg ion petroleum consumption data comes from the annual Oil & Gas Journal
from Pennwell Publishing . The annual oil consumption rate is extrapolated forward using the prior 5-Year compound annual growth rate of consumption (CAGR) and converted into a monthly
rate. Data was pulled into Microsoft Excel using Haver Analytics Data Link Express (DLX).
Page 5 Notes: Drilling rig count data comes from Baker Hughes. Sumermajor quaterly operating prof its come from comes from 10-Q quarterly reports published on the Securities and Exchange
Commission Electronic Data Gatheri ng, Analysis, and Retrieval (EDGAR) sys tem. US capital expenditure per barrel is derived from total US capital expenditure in the petrolium industry divided by
the total US crude oil production. Data for capital expenditure, oil production, nominal cost per well and real cost per well come from the Oil & Gas Journal Annual Forecast & Review. Data was
pulled into Microsoft Excel using Haver Analytics Data Link Express (DLX).
Page 6 Notes: "Oil Production" is the monthly total "Oil Product Demand" for each country. Demand data comes from the Oil Market Intelligence report publis hed by Energy Intelligence Group.
Data was pulled into Microsoft Excel using Haver Analytics Data Link Express (DLX).
Peak Oil Dashboard: Data Notes
Q1 2013Created by Will Martin - Peakoilproof.com
Page 7 Notes: Quarterly GDP data comes from Oxford Economics' global macroecono mic database. Relative GDP growth of each country is caculated as the change in the real (2005 US$ Prices &
PPP Exchange Rate) GDP of a country as a percentage of total GDP. Data was pulled into Microsoft Excel using Haver Analytics Data Link Express (DLX) . Thank you to Mark McHug
(http://acrossthestreetnet.wordpress.com/) for giving me the idea to measure GDP growth of countries relative to one another as well as measuring global GDP growth USD as well as in oil
barrels and ounces of gold.
About: I created this dashboard to keep track of the key quantitative indicators of peak oil. Oil is a finite resource and peak oil will happen eventually. Because some experts, such as the Energy
Watch Group, believe that peak oil is happening ri ght now, I want to keep track of these indicators on a real-time basis. I designed this dashboard to be mostly automated, in order to allow me to
easily update it on a quarterly basis. All of the information contained herein is publically available; I use no private data.