Embed Size (px)
Citation preview

and
present:
Global Mobile Data Traffic Forecast, 2012 – 2017
White Paper
Published First Quarter, 2013 Version 1.0
iGR Inc. 12400 W. Hwy 71 Suite 350 PMB 341 Austin TX 78738

Quoting information from an iGillottResearch publication: external — any iGillottResearch information that is to be used in press releases, sales presentations, marketing materials, advertising, or promotional materials requires prior written approval from iGillottResearch. iGillottResearch
reserves the right to deny approval of external usage for any reason. Internal-quoting individual sentences and paragraphs for use in your company’s internal communications activities does not require permission from iGillottResearch. The use of large portions or the reproduction of
any iGillottResearch document in its entirety does require prior written approval and may have some financial implications. Copyright © 2013 iGillottResearch, Inc. Reproduction is forbidden unless authorized.
FOR INFORMATION PLEASE CONTACT IAIN GILLOTT (512) 263-5682.
Table of Contents
Executive Summary..................................................................................................... 1 Figure A: Global Mobile Data per Month (Petabytes), 2012-2017 ......................................... 1
Methodology .............................................................................................................. 3 Key Data on Worldwide Connections ..................................................................................3 Setting the Context ............................................................................................................5 Estimating per User Data Use .............................................................................................7
Mobile Data Traffic: Assumptions ............................................................................... 9 User Categories ..................................................................................................................9 Increasing Mobile Device Penetration ............................................................................... 11 Drivers of Mobile Data Demand ........................................................................................ 12 Mobile Data Traffic: Limiting Factors ................................................................................. 16 Data Prices and Data Usage Caps ...................................................................................... 16
Europe ................................................................................................................................... 17 Asia-Pacific ............................................................................................................................. 18 Latin America ......................................................................................................................... 18 Middle East and Africa ........................................................................................................... 18 Device Penetration ................................................................................................................ 18
Global Mobile Data Traffic Forecast .......................................................................... 21 Table 1: Mobile data traffic per month per region, 2012-2017 (TB per month) ................... 21 Figure 1: Mobile data traffic per month per region, 2012-2017 (TB per month) ................. 22 Table 2: Changing Mobile Data Traffic by Region, 2012-2017 .............................................. 23 Figure 2: Changing Mobile Data Traffic by Region, 2012-2017 ............................................ 24
Definitions ................................................................................................................ 25 General ............................................................................................................................ 25 Device Types .................................................................................................................... 25 Services ........................................................................................................................... 26 Network Technology ........................................................................................................ 27 Regions ............................................................................................................................ 31
About iGR ................................................................................................................. 32 Disclaimer ........................................................................................................................ 32
Distribution of this report outside of your company or organization is strictly prohibited. Copyright © 2013 iGillottResearch Inc.
1
Executive Summary
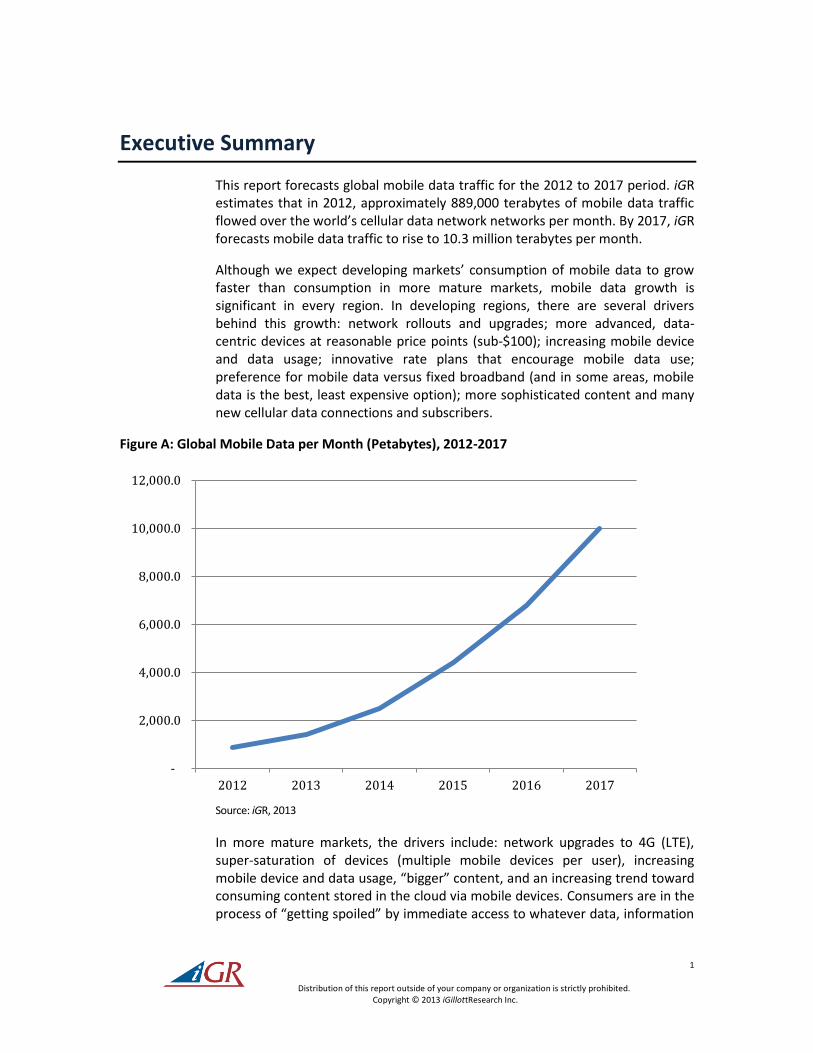
This report forecasts global mobile data traffic for the 2012 to 2017 period. iGR estimates that in 2012, approximately 889,000 terabytes of mobile data traffic flowed over the world’s cellular data network networks per month. By 2017, iGR forecasts mobile data traffic to rise to 10.3 million terabytes per month.
Although we expect developing markets’ consumption of mobile data to grow faster than consumption in more mature markets, mobile data growth is significant in every region. In developing regions, there are several drivers behind this growth: network rollouts and upgrades; more advanced, data-centric devices at reasonable price points (sub-$100); increasing mobile device and data usage; innovative rate plans that encourage mobile data use; preference for mobile data versus fixed broadband (and in some areas, mobile data is the best, least expensive option); more sophisticated content and many new cellular data connections and subscribers.
Figure A: Global Mobile Data per Month (Petabytes), 2012-2017
Source: iGR, 2013
In more mature markets, the drivers include: network upgrades to 4G (LTE), super-saturation of devices (multiple mobile devices per user), increasing mobile device and data usage, “bigger” content, and an increasing trend toward consuming content stored in the cloud via mobile devices. Consumers are in the process of “getting spoiled” by immediate access to whatever data, information
-
2,000.0
4,000.0
6,000.0
8,000.0
10,000.0
12,000.0
2012 2013 2014 2015 2016 2017

Distribution of this report outside of your company or organization is strictly prohibited. Copyright © 2013 iGillottResearch Inc.
2
or other content they might want. These drivers, as well as the hindrances to greater consumption, will be discussed in greater detail later in this report.
Our mobile data traffic sizing and forecast is based on average usage profiles, the penetration of cellular data technologies by generation (2G, 3G, 4G) and iGR’s forecast for the number of connections in the given regions (to be found in iGR’s Global Mobile Connections report). Further detail on how the mobile data traffic demand model was constructed will be provided in the Methodology and Bandwidth Estimate sections of this report.

Distribution of this report outside of your company or organization is strictly prohibited. Copyright © 2013 iGillottResearch Inc.
3
Methodology
This report provides an overview of mobile data demand and forecasted mobile data traffic in the worldwide cellular market. This report will use “traffic” to refer to the mobile data flowing over cellular carriers’ networks.
For this report, the population and demographic data used in formulating the forecast were primarily drawn from various census bureaus, the World Bank, and the United Nations – as per iGR’s Global Mobile Connections forecast report published separately.
Additionally, iGR used other publicly available information: wireless operators’ Internet sites, regulatory filings, annual and quarterly results, whitepapers and reports from operators and vendors serving the wireless space. In addition, information was gathered from various industry organizations including the CTIA, the GSM Association, Google’s International Broadband Pricing Study, the CDMA Development Group and 4G Americas. When available, data from relevant government agencies around the globe was used.
iGR has also conducted extensive primary research surveys in North America, Europe, Latin America and Asia Pacific. These surveys have provided iGR with an understanding of how data is consumed in developed markets and how that consumption has evolved over the past 10 years. We expect developing markets to transform more rapidly than more mature markets as they typically benefit from the technology proven-out in developed markets.
Information was also gathered from respectable news sources, business information websites and websites related solely to wireless coverage. The estimates and forecasts generated in this report were compared to information published by various wireless vendors, carriers and infrastructure providers.
Key Data on Worldwide Connections
The following is a brief overview of the major network, subscriber and connection trends in each geographic region. (The countries included in each region are detailed in the Definitions section). These estimates are integral to the mobile data traffic model presented in this report.
North America: Will gain connections steadily, adding more than 26 million connections over the next 5 years and reaching 98 percent penetration in 2017. Currently, a majority of North American connections still use 3G technologies (EV-DO and UMTS/HSPA), but iGR expects LTE-based devices to rapidly penetrate the market with more than 66 million LTE connections by year-end 2013. North America is a forerunner of 4G technologies, but that status will fade as LTE rollouts continue across the globe.

Distribution of this report outside of your company or organization is strictly prohibited. Copyright © 2013 iGillottResearch Inc.
4
Latin America: Expanding coverage, escalating wireless competition, and increased device adoption will propel net connection growth of 56 million over the forecast period in the region. While 2G connections currently account for the majority of all mobile connections in Latin America, this share will dramatically decrease as 3G connections increase at a compounded annual rate of 25 percent between 2012 and 2017. LTE in Latin America is off to a slow start relative to other regions, but growth will accelerate in the 2015 timeframe as more LTE networks are available and the cost of devices has dropped because of the fast pace of adoption in other regions.
Europe: Mobile connections are likely to experience low growth, increasing by about 16 million over the next 5 years to nearly 1.1 billion in 2017. Europe currently has exceptionally high penetration, 143 percent at the end of 2012, that will rise to 145 percent in 2017. The bulk of Europe’s connections are currently 2G, but 3G connections will experience significant growth over the forecast period. Europe substantially lags in LTE deployments relative to the U.S., Asia-Pacific and Japan. iGR does anticipate substantial LTE growth in Europe, but a great deal depends on the macroeconomic environment in that region.
Middle East and Africa: Currently this region has the lowest wireless penetration of all, but is also the world’s fastest growing wireless region. The Middle East and Africa will surpass Europe in 2014 to become the world’s second largest region by connections (behind Asia-Pacific). Though the region’s wireless market will be dominated by 2G connections throughout the forecast period, 3G-market share will begin to grow during 2014. Total 3G connections in this region will exceed 2G connections in 2016. 4G adoption will be low and largely limited to the Arabian Peninsula and South Africa, though there are some other deployments in other African countries.
Asia-Pacific: Mobile connections in this region will swell at a compounded annual rate of 5.4 percent over the forecast period, increasing to 3.73 billion in 2017. The abundance of emerging markets in the region will allow mobile penetration in Asia-Pacific to increase by 19 percent over the next 5 years. The market share of 2G mobile technologies will fall over the period as 3G connections rise sharply to 2.3 billion connections in 2016. The majority of the Asia-Pacific region will not begin significant 4G deployment until late 2013 – and more likely later.
Japan: The population of Japan will shrink by nearly 1 million between 2012 and the end of 2017, but mobile connections will grow by 12 million during the period, driving Japan to a 112 percent penetration rate in 2017. The large appetite for mobile web and media among Japanese consumers quickly promoted the adoption of 3G technologies that dominate the region. Second generation connections will lose share through 2013 and will disappear completely by the end of 2014. Fourth generation connections
Distribution of this report outside of your company or organization is strictly prohibited. Copyright © 2013 iGillottResearch Inc.
5
will increase to nearly 54 million in 2017, claiming a 38 percent market share (LTE and WiMax).
Finally, iGR believes that Mobile WiMax has largely been occluded by LTE deployments. Most of the major WiMax proponents (Yota, Clearwire, Sprint) shifted to LTE in the last several years. That said, WiMax technology is likely to remain a niche solution in many markets (particularly the emerging regions) and, in the aggregate, will steadily wane throughout the forecast period.
Setting the Context
In this report, subscribers are the number of people with an active cellular phone subscription. Penetration is the percentage of a country or region’s population that has a cellular device subscription. (Again, note that iGR’S mobile data traffic forecast is based in large part on our worldwide connections forecast.)
A “connection” can be for many types of mobile devices such as mobile phones (feature & texting), smartphones, tablets, mobile hotspots, portable modems and embedded modems. There are more connections than there are subscribers because many people have more than one mobile device and/or more than one SIM card. Note that this tendency varies by region.
iGR’s connections forecast deals exclusively with mobile connections, not fixed wireless connections. As a result, 802.16d WiMax connections are not included in the estimates, but 802.16e WiMax connections that are fixed (e.g., stationary home modems) are counted since the device makes use of mobile air interface technology. Note that our connections forecast also does not include machine-to-machine (M2M) connections. As a result, the mobile data forecast in this report also does not include the data generated by M2M connections.
The monthly estimates of usage in this report are in megabytes of data consumed. So, a given user might consume 40 megabytes (MB) of data in a month, but did so over a network that transmits at 1.5 megabits per second (Mbps). This was done because it is (perhaps arguably) easier to understand a MB number due to its everyday applicability/familiarity. Many consumers are more accustomed to seeing megabytes – in email, Microsoft PowerPoint slides Word documents, MP3 files, or photos and video files. By default, an iPhone will, for example, prompt the user to select which size of photo to email / MMS off the device both in words (small, medium, large, actual) and in megabytes.
Other key considerations that were explicitly and implicitly factored into our mobile data traffic model include:
The mobile data traffic itself is measured in megabits per second, but file sizes and data caps are typically measured in bytes. This report uses 1024 (and the larger variations) for its traffic conversions and calculations. iGR’s model factors in the conversions between bit rates and file sizes.

Distribution of this report outside of your company or organization is strictly prohibited. Copyright © 2013 iGillottResearch Inc.
6
The transmission speed of the network is, of course, relevant to how much could possibly be consumed in a month. Networks with slower overall throughput (e.g., EDGE or CDMA 1X) limit how much a given user can consume as compared to faster networks (CDMA EV-DO, HSPA+, LTE). Indeed, one key assumption in this model is that network upgrades play into higher mobile data consumption. This is why the ongoing transition from 2G to 3G to 4G is foundational to this traffic model. Regions that have a comparatively higher percentage penetration of 2G technologies – if all else is equal – cannot consume as much mobile data per person in the same amount of time as regions with more prevalent 3G or 4G networks. Put another way, the same end user on an EDGE network will likely consume less data in an hour than they might on an LTE network. The speed of the connection simply enables more browsing – and the consumption of richer content – in the same amount of time.
High network latency can reduce mobile data consumption. For example, a long delay before seeing one’s content can frustrate users and can cause them to delay consumption until a faster connection is available. Now, this delay may be related to actual latency (hops) or it may be related to other factors (network congestion, etc.). In either case, the ultimate effect is the same: the end user does not use the mobile data network. Note that latency is not entirely within the control of the mobile network owner; it could also be caused by the content owners’ insufficient and/or over-taxed resources. However, the mobile network owner is likely to bear the lion’s share of the blame for the perceived poor service.
From a device perspective, the more advanced the device (processing speed, screen size and resolution, touch, battery capability, etc.) the better the mobile Internet experience. And, the better the device, the more likely the end user is to consume mobile data – and then more mobile data. The key assumption here is that the “better” mobile experience, the more comparable it is to the desktop/laptop experience. Mobile users will tolerate and adapt to the mobile experience, but if there is too sharp a drop off, the user will likely defer their usage until they are able to use a computing platform that does not force them to make excessive compromises. That said, there are emerging paradigms for how end users prefer to interact with their device: multi-clicking a button on a headphone; using voice (Siri, Google Now, Samsung’s S-Voice, etc.); widgets on a home screen; wrist-worn devices that interact with the smartphone (e.g., Pebble, FitBit Flex, M-basis), etc. There is also growing interest in augmented reality applications that use capabilities in the device (GPS, camera, etc.) to somehow augment the user’s interaction with the virtual and/or the real. It is entirely likely that many of the emerging – or as yet unimagined – ways of using a mobile device will rely upon an always-available mobile data connection.
iGR’s mobile data traffic forecast does not account for the signaling traffic due to “chatty” applications. Most (if not all) applications (and the smartphone operating systems themselves to an extent) communicate with servers in the

Distribution of this report outside of your company or organization is strictly prohibited. Copyright © 2013 iGillottResearch Inc.
7
Internet cloud – i.e., signaling traffic or small, background messages exchanged between a handset and a network that enable a data connection to be set up or ended. Devices that tend to be connected to a network for longer, more continuous periods tend to generate comparatively little signaling traffic. Devices that are on briefly or intermittently for short periods tend to generate comparatively more signaling traffic. Laptops are a good example of the former; smartphones are a good example of the latter.
Smartphone users often check their phones for social network updates, weather, sports scores, instant messages, etc. All of this activity results not only in the actual information being delivered but also in increased signaling traffic since the smartphone is being intermittently turned on and off. In most cases, these apps wake the device on their own in order to pull/push new data or updates.
Estimating per User Data Use
iGR’s mobile data traffic model estimates the amount of bandwidth (in MBs) consumed by a given activity – e.g., checking email, listening to streaming music or watching streaming video, checking social sites, etc. iGR has estimated the traffic generated on a per application/use basis and that necessarily means a reliance on average values for how much bandwidth these various activities consume along with an average for how many times in a given time period an end user engages in the given activity.
Those averages do not explicitly include the “extra” traffic associated with a given application’s “chattiness.” Rather, the estimate is for an average “file” size – e.g., an email, video or audio stream (in which case the bit rate and duration are important variables).
iGR’s traffic forecast also only includes downlink (or downstream) traffic – i.e., data transmitted from the base station to the user terminal. It excludes uplink (or upstream) traffic. Typically, total uplink traffic is assumed to be about 30 percent of total downlink traffic. So, if a given end user consumes an average of 70 megabytes (MBs) per month on the downlink, then their total uplink traffic would be about 21 MBs per month. Mobile operators’ cellular data are typically constrained on the downlink, not the uplink. This is why our forecast focuses on traffic passing over that downlink connection.
However, given that LTE provides much greater uplink capacity – and preliminary reports from both operators and infrastructure vendors suggest – uplink usage may begin to be as big a concern as downlink traffic. A good recent example of this disparity was published by AT&T Wireless. At the BCS National Championship football game held at the Sun Life stadium in Miami, Fla., AT&T stated that their customers downloaded and uploaded more than 360 GB of data while inside the stadium. Hourly upload traffic peaked at 50 GB; hourly download traffic peaked at 35 GB. There were about 80,000 people in attendance at the event, according to an ESPN article.

Distribution of this report outside of your company or organization is strictly prohibited. Copyright © 2013 iGillottResearch Inc.
8
Finally, this report does not address mobile-originated traffic on Wi-Fi networks. This is commonly referred to as WiFi Offload – i.e., traffic that would have flowed over 3G/4G, but instead went over a WiFi network. iGR estimates this traffic in a separate report.

Distribution of this report outside of your company or organization is strictly prohibited. Copyright © 2013 iGillottResearch Inc.
9
Mobile Data Traffic: Assumptions
To create its traffic forecast, iGR built usage profiles based on its primary and secondary consumer and enterprise research over the past several years. iGR then divided connections into four different categories: light, medium, heavy and extreme. As noted earlier, a connection corresponds to a device and connections can exceed subscribers. For example, a mobile worker in North America might have three devices – a smartphone, laptop and a tablet. A consumer might have two (a smartphone and a tablet) or a mix of non-smartphone, smartphone, tablet, laptop and/or mobile hotspot.
These devices will not always connect over a 3G/4G network; WiFi might be used, instead. At home and at the office, for example, these devices are more likely to connect over WiFi. In some cases, an end user may also use WiFi in more public areas – libraries, coffee shops, at school, etc.
iGR’s traffic model attempts to isolate and estimate the traffic that traverses the carrier’s 3G/4G network. iGR attempts to focus on this portion of the traffic because it’s that cellular network load that is driving HSPA, HSPA+ and LTE migration, as well as the ongoing need to upgrade backhaul to Ethernet and fiber.
WiFi offload is, of course, a viable solution to mitigating the impact of stationary users on 3G/4G cell capacity, but other solutions may also work – distributed antenna systems and small cells (as a broad category) are two examples. Note that some cellular carriers, both in the U.S. and abroad, have built out metro WiFi “hotzones” in which their mobile broadband subscribers’ data traffic is offloaded to that WiFi hotzone. AT&T has several such hotzones in major U.S. cities – New York City, Chicago, San Francisco and others.
User Categories
As stated above, iGR’s traffic model splits mobile end user connections up into four different categories: light, medium, heavy and extreme. These categories are defined as much by the activities and/or applications that tend to be used, as by their frequency of use, duration of use and the relative mobility of the connection (which has an impact on usage frequency).
Generally speaking, the larger the device, the more bandwidth is consumed on it. That is, a laptop connection will likely generate far more mobile data traffic than a smartphone. This is primarily because a laptop is more conducive to heavy usage than a smartphone and is typically used in a place where the user is stationary and disposed toward consuming/generating a great deal of data traffic.
That said, streaming video and audio applications (Pandora, Netflix, HBO Go, Amazon Cloud Player, etc.), not to mention YouTube, makes consuming

Distribution of this report outside of your company or organization is strictly prohibited. Copyright © 2013 iGillottResearch Inc.
10
hundreds of megabytes on a smartphone quite easy. One key difference, of course, is that the laptop user could be multitasking among several different high-traffic applications whereas the smartphone user is typically only engaged in one, maybe two different activities. And, often, those activities are completely different – listening to streaming music on a smartphone while running outdoors versus sitting at a café and using a laptop to listen to music while browsing the Web.
The following, then, describes some of the characteristics of each connection category:
Light Connections: Casual, infrequent data use; a minimal amount of web browsing, social networking, photo sending, email, mapping, etc.
Medium Connections: Less casual, more frequent data use than a Light connection; perhaps includes the addition of some usage of audio/video streaming and application downloading. Generally speaking, Medium and Light connections comprise the majority of all connections.
Heavy Connections: Significant and frequent use of the mobile device and a variety of applications – audio and video streaming, application downloads, social networking, email, etc. This type of connection might represent a mobile worker who travels several days per week.
Extreme Connections: These are connections that look a great deal like a wired Internet connection – i.e., several gigabytes (GB) of usage per month. This type of connection is likely to be a laptop / tablet tethered to a smartphone or a connection via a USB/embedded modem. The person behind the device(s) might be a mobile worker who’s always out of the office or a consumer running a BitTorrent client, constantly checking Facebook, or downloading music or podcasts.
Users might even shift in and out of the various categories on a month-by-month basis. That is, a mobile worker with varying travel patterns might be a Medium user one month but a Heavy or Extreme user the following month – or maybe one week they are in a hotel with free WiFi, but the next week they rely exclusively on their 3G/4G connection. Or perhaps the user just turns off WiFi on their smartphone because if they are paying for 10 GB of cellular data per month then they intend to use it.
The advent of free tethering with the new mobile data share plans released by AT&T and Verizon Wireless has also made it less prohibitive from a cost-perspective to attach a tablet or other device (anything with a WiFi radio, really) to the 3G/4G mobile data connection. An Apple TV or Roku (or similar device) tethered to a smartphone could generate a great deal of LTE traffic in a short period of time – and consume a great deal of network capacity.
It should also be noted – and perhaps this is obvious – that seemingly minor changes in per day, week or month mobile data consumption can greatly impact average bandwidth consumption. For example, starting to watch a single

Distribution of this report outside of your company or organization is strictly prohibited. Copyright © 2013 iGillottResearch Inc.
11
streamed episode of a TV show per week on a smartphone could easily equate to an additional 350-500 MB of usage per month. Or, using FaceTime (or Google+, Skype or other video chat app) on a smartphone could also generate a great deal of new video traffic.
Finally, these bandwidth numbers and usage profiles were used as the baseline for the bandwidth model and forecast. North America, and the U.S. in particular, is one of the most penetrated mobile data markets in the world. It is also where much of the innovation in mobile devices, applications, and services occurs.
That is not to say that innovation does not occur in other markets – it most certainly does – but North America is often the proving ground for many new products and companies and the graveyard for others. This is especially true in the case of LTE rollouts. Examples of the former include iPhone, iPad, Android-based smartphones and tablets. Examples of the latter include: Nokia (prior to Windows Phone, at least), Palm/HP and, perhaps in the next several years, RIM.
Increasing Mobile Device Penetration
Globally, mobile device penetration is on the rise. Our research suggests that smartphones will grow to more than 45 percent of global usage by 2017. In the U.S. and other developed markets (Europe and Japan), smartphone penetration is already much higher – in the U.S., for example, about 40-45 percent of all cellular handsets are smartphones. Smartphones as a percentage of monthly device sales is much higher – in the 75-80 percent range.
Indeed, monthly smartphone sales in developed markets dwarf the sale of feature and messaging devices – they are easily anywhere from 65 to 75 percent of monthly sales depending on the month (it fluctuates due to the launch of iconic and “hero” devices) and the country/region.
More generally, there is an ongoing collision between phones and computing devices. By phones, we mean non-smartphones and smartphones. By computing devices, we mean desktop PCs, notebooks, sub-notebooks, netbooks, tablets, “phablets,” e-readers and even personal navigation devices. Essentially the capabilities of all of these devices are increasing while the lines are blurring between many of the previous differentiated form factors (e.g., e-reader versus tablet versus netbook versus laptop). The phablet (phone-tablet) exemplifies the blurred line between smartphones and tablets.
In practical terms, this means that within a few years all phones will be smart(er). Most will probably run Android, as is the case today. Data usage will increase, applications which inherently leverage connectivity will increase, and the computing power in the handset will increase, as well. The 1 GHz processor is already almost obsolete with many OEMs moving to dual core and, even, quad core processors in smartphones.
Tablets are, of course, another issue altogether. Currently, iGR believes that tablets are still in the early stages of having a unique, discernible impact on the overall level of bandwidth usage due to:

Distribution of this report outside of your company or organization is strictly prohibited. Copyright © 2013 iGillottResearch Inc.
12
Low install base: Compared to the number of smartphones and laptop computers, tablets have a long way to go (but they are growing very quickly). The Apple iPad still dominates the niche it created. Samsung’s Galaxy series and Amazon’s Fire series are probably the best examples of successful Android tablets.
Limited, but increasing utility: Tablets do not support cellular telephony, but many do support Voice over IP (VoIP) either through a proprietary application (FaceTime, Google+) or via a (proprietary) third-party such as Skype. Most tablets are used primarily for entertainment-related purposes and secondarily for productivity-related reasons. Tablet usage is increasing among enterprises and in the education sector, however, so the use cases will continue to evolve.
High price limits uptake: Tablet buyers tend to be affluent and live in developed markets. Typically, these individuals comprise a small percentage of the population and their increase in data consumption due to a tablet will be so small as to be hardly noticeable in a region with billions – or even several hundred million – people.
Moderate increase in total bandwidth consumed: Our smartphone and tablet research to date has suggested that tablets are currently contributing an average 30-40 percent increase in mobile bandwidth consumed among those end users who also have a smartphone. Note, further, that about 80 percent of tablets sold (in the U.S.) are WiFi only – i.e., they do not have an embedded 3G/4G cellular data modem. Now that U.S. subscribers on mobile share plans have “free” access to tethering, iGR expects that even more of the usage that might have happened on smartphones will now be shifted to tablets. So, the net impact on total bandwidth consumer per user might be a smaller percentage. (iGR is planning some primary survey research on this topic.) Tethering aside, a great deal of tablet usage happens on WiFi networks. And, since end users with multiple devices tend to choose the one that best fits their present need, mobile data traffic is starting to shift between devices – i.e., they use a smartphone for quick things, a tablet for consuming video and a laptop for sitting down and getting some work done.
Drivers of Mobile Data Demand
Today, consumption of mobile data is driven by many factors:
Device availability and penetration:
o Data-capable smartphones, feature phones and messaging devices and their increasing penetration/adoption worldwide.
o PC cards (although they have greatly declined in usage).
o USB dongles. Their take-rate depends on geographic region. They are increasingly rare in North America, especially given that the user

Distribution of this report outside of your company or organization is strictly prohibited. Copyright © 2013 iGillottResearch Inc.
13
base who would have used a dongle are probably now tethering via a smartphone – for free.
o Embedded modules in a range of devices: tablets, e-readers, gaming devices, notebooks, netbooks.
o Mobile hotspots, which are a niche product, like PC cards and USB dongles. Mobile hotspots are better suited to enterprise use cases where the cost of having one can be borne by the enterprise and the actual device shared among those who need it – either as “hub” for point of sale applications, a way to provide access in an area without other options, etc.
o Smartphone tethering.
Network availability and price:
o If a 4G data network does not exist in one’s area, then obviously it can’t be used. If the smartphone’s connection defaults down to 3G – or even 2.5G (EDGE, CDMA 1XRTT) – then the subscriber might choose to postpone their consumption until they are in an area where access to content would be faster (either on a mobile or WiFi/fixed network).
o All else being equal, the lower a rate plan’s price is, the higher the likely adoption rate. High per month pricing and contracts obviously limits the operator’s addressable market. That said, operators are trying to balance demand against their ability to match data consumption (within reason) at any given time.
o LTE pricing varies considerably around the world. Some operators charge a premium for it; others charge the same or, (sometimes) less than they charge for 3G access. In many countries (Europe, primarily), throttling back the connection speed is the primary way operators control access when a user exceeds their monthly allotment. Other operators charge hefty overage fees. In general, operators want heavy data users off of their 3G networks and onto 4G.
o Fast cellular data networks – HSPA+ and LTE – are quickly being rolled out in the U.S. and internationally. LTE Advanced will begin rollout in the U.S. in the next 12 to 18 months.
o Data share plans: Both Verizon Wireless and AT&T Wireless have reported good uptake of their data share plans. AT&T in 4Q12 reported that they ended the quarter with 6.6 mobile data share subscribers. More than 25 percent of those were on a 10 GB or higher plan. AT&T also stated that about two-thirds of smartphone subscribers are on a usage-based plan.

Distribution of this report outside of your company or organization is strictly prohibited. Copyright © 2013 iGillottResearch Inc.
14
o Generally speaking, wireless operators want to encourage their subscribers to move to their LTE networks where they are (in the short- to medium-term) less spectrum constrained (due to the increased efficiency of LTE as compared to HSPA or CDMA).
Content:
o Types: Content comprises a wide range of “things” people consume – music, video, photos, information (news, weather, etc.), social networking, e-books, applications.
o Size: Just as there’s wide variety in content, so too does the megabyte size of content vary by type of content – but also within content types. Streaming video looks different to both the network and user than a one-time large download; same with audio/music. Applications vary in size from a few megabytes to gigabytes. The way in which content gets streamed across wireless networks also has an impact on the amount of mobile data traffic. Netflix, for example, adapts its video stream to the size of the “pipe” and the capabilities of the device – i.e., the bigger the pipe and the higher the capabilities, the more data gets sent.
o Repositories: Cloud-based repositories of content are beginning to become more prevalent (e.g., Amazon Cloud, Google Music, Netflix, Hulu, HBO Go, etc.). It may well be that streaming becomes how the majority of users consume their content – and that paves the way for more efficient methods of distributing the content via caching, transcoding, broadcasting and other optimizations.
Over the forecast period, new devices and applications will increasingly drive mobile bandwidth demand:
o Tablets: These devices provide a wide range of content consumption (and creation) capabilities – gaming, e-reading, music, audio books and podcasts, video, productivity, photo organization, email and Web, social networking, etc.
o E-readers: This category primarily includes the single-purpose devices currently on the market (Kindle, Nook, Sony Reader, etc.). E-books are not that big in terms of megabytes, but the potential is there for content publishers to leverage e-readers as a new distribution / consumption platform.
o Handheld gaming devices: As the cost of embedded modules fall and the hardware capabilities (including battery life) of gaming devices increases, it is possible that the OEMs will start bundling in data capabilities either for voice communication (via VoIP), multi-player connectivity, or both. Cross-over devices such as the Xperia Play have not seemed to be embraced by the market, at least in the

Distribution of this report outside of your company or organization is strictly prohibited. Copyright © 2013 iGillottResearch Inc.
15
U.S. It is perhaps more likely that existing smartphone platforms will grow to displace the current market for gaming-only devices.
Industry vertical applications, examples of which might include:
o Mobile Medical: This could include any number of applications, but one might be a doctor viewing X-rays on their mobile device. Other implementations might include basic alerting or prescription refills, neither of which would consume high levels of bandwidth. Some companies already offer these types of services via apps (Walgreens, etc.).
o Education: University campus populations using 3G-/4G-enabled tablets.
o Sales force automation; field force automation; etc.
o Tablets and smartphones as point of sale terminals: this use is increasingly common – and not just in Apple stores.
o General enterprise use for productivity – i.e., replacing and/or supplementing laptops.
In terms of particular applications that drive mobile data consumption, both now and down the road, the usual suspects are at work:
o Video: This category can include everything from YouTube and mobile TV, to TV shows and movies. Much of what is viewed and how much bandwidth is consumed depends on what technologies the device supports. This category includes mobile TV and streaming video (Hulu, Netflix, YouTube, etc.), as well as video files that are downloaded (e.g., from iTunes).
o Audio: This includes everything from music, to podcasts and streaming audio (e.g., Internet radio, Pandora, etc.). Note that with the addition of various accessories (mics, software apps, etc.), mobile devices can be turned into content creation platforms, as well (video, audio recording and/or editing).
o Photo sharing.
o File sharing: This could be files shared via bit torrents or simply files that are uploaded/downloaded to file servers or the cloud.
o Email, web browsing, instant messaging, and social networking.
o Application downloads and connected applications: Obviously downloading applications consumes mobile bandwidth, but many applications are designed to leverage the 3G data connection either explicitly (the user accessing information) or they simply run in the background pulling down data according to some protocol.

Distribution of this report outside of your company or organization is strictly prohibited. Copyright © 2013 iGillottResearch Inc.
16
Mobile Data Traffic: Limiting Factors
As has been discussed to a certain extent thus far, there are numerous factors that tend to limit mobile data consumption. These include:
Device hardware capabilities: Items such as screen size, screen resolution, processing power, RAM, memory storage, battery life, device thickness, device weight and overall size. All of these factors impact how potential users not only react to the device but the types of content they will consume. A heavy tablet, for example, might make it cumbersome to play a racing car game. Likewise, a small-screened smartphone might discourage video consumption.
Device software capabilities: This primarily revolves around the usability and extensibility (through third-party apps) of the smartphone OS itself. Most smartphone subscribers have also become accustomed to free functionality upgrades to the OS.
Network availability: As mentioned earlier, mobile data users cannot consume data if there is no network in their area. This is rarely an issue, but other issues such as network congestion because of over-loaded cell sites could cause higher levels of latency and/or lower levels of bandwidth delivered to each device. In either case, the subscriber experiences a poor quality of service that could lead to churn.
Operators work to overcome the availability issue by trying to stay ahead of data demand in heavy-usage markets (urban centers, etc.) by adding data channel cards, splitting cells, encouraging off-load to WiFi (either via on-device connection managers, metro WiFi hotzones and/or partnerships with WiFi network owners), deploying small cells (e.g., femtocells to residences) or moving to a distributed antenna system model for portions of its market (e.g., stadiums, etc., where a subscriber base tends to congregate).
Operators around the world are also upgrading from 2G to 3G and from 3G to 4G in order to realize the higher spectral efficiencies and total throughput/bandwidth gains that come with the more advanced technology. Generally speaking, operators also try to obtain more spectrum either through government auctions, trades with other companies, acquiring companies with spectrum holdings and/or purchasing spectrum from public/private corporations.
Data Prices and Data Usage Caps
High prices and caps on data usage also tend to limit the uptake of mobile broadband. Around the world, 3G/4G data is still relatively expensive. Typically, the lower-price plans also come with a minimal amount of bandwidth (250 MB/month is about average). Once the subsidized device cost is factored in, then users upgrading from feature-/messaging-devices can expect to pay considerably more for data access. Prepaid data plans, which are more

Distribution of this report outside of your company or organization is strictly prohibited. Copyright © 2013 iGillottResearch Inc.
17
prevalent internationally than in the U.S., often carry throughput restrictions in addition to providing low bandwidth caps.
With the launch of the 3G iPad in 2010 with AT&T in the U.S., both Apple and AT&T began a prepaid / no-contract mobile broadband experiment. Neither company have ever provided definitive statistics surrounding uptake of embedded 3G/4G mobile data on the iPad. Note that prepaid mobile broadband has been successful at Leap Wireless and in many regions around the world. It is our opinion that in the U.S., at least, no-contract mobile broadband will likely be the preferred method of 3G/4G data access on tablets. Note that the advent of Family Data Plans may encourage some users to add their tablet to their postpaid data plan.
Caps on total data usage are a common way for mobile operators to try to limit the amount of mobile bandwidth consumed. Typically the plan provides X amount of MB/GB and then has comparatively expensive penalties for each additional Y MB/GB consumed. In reality (and prior to 4G LTE), the existence of a data cap had little effect on behavior since the majority of mobile data users do not consume anywhere near their plan’s cap. But, the caps do help constrain a small percentage of mobile data users.
With the release of 4G LTE in the U.S., iGR has noted – anecdotally – that many users get a lot closer to their plan’s cap than they did on 3G HSPA+ or EV-DO. This is likely because LTE really is much faster than 3G and therefore enables users to do more – visit more sites, download more video or apps, stream more audio or video, etc.
Caps on throughput rates, which are increasingly common, are more about preserving the network’s integrity / ability to deliver service to all subscribers than about limiting a given user’s consumption. (A cell site’s total throughput is a shared resource; limiting each sub to 2 Mbps prevents a single subscriber from consuming all of the cell’s throughput.)
The following sections summarize some of the pricing practices iGR has observed in the various regions.
Europe
Some of the unlimited data plans in France, Portugal, Finland, Slovak Republic are capped at various data rates (2 Mbps, 5 Mbps, 14 Mbps, etc.). Note that these are not the only European countries with caps on data transfer rates. One EDGE plan provided by Megafon in Russia limits users to 512 Kbps on a 1.5 GB plan. 3 in Sweden has Unlimited data plans with no caps on rates while Tele2 has 4G data plans of varying size (from 2 to 80 GB) that do carry transfer caps. Telenor does, as well.
Interestingly, it is primarily the postpaid mobile data plans in Europe that carry restrictions – perhaps because the prepaid plans are already limited by price and that is a sufficient safeguard.

Distribution of this report outside of your company or organization is strictly prohibited. Copyright © 2013 iGillottResearch Inc.
18
Asia-Pacific
In Singapore, many of the unlimited data plans offered by StarHub are throughput restricted. So, the more one pays per month, the higher their permitted throughput (from 1 Mbps to 21 Mbps).
Indonesia’s Indosat has several prepaid 3.5G data plans that are per-day, per-week or per-month. These plans are limited to 2 Mbps throughput and have various caps: 5 MB, 10 MB, 50 MB and 500 MB, respectively.
Australia’s Optus appears to favor “Western-style” penalties on exceeding the data cap – i.e., high per megabyte fees to discourage over-use.
Latin America
Nextel Mexico’s 3G plans throttle subscribers down to 64 Kbps once they exceed their usage cap for the month (500 MB, 1 GB, etc.). Movistar in Chile has a similar protocol.
However, Nextel Chile employs two different types of limits. First, their plans are limited to 2 Mbps, but after the cap is reached the subscriber is limited to 128 Kbps. Also in Chile, Claro offers a higher data cap (ex: 2 GB) for the first 6 months of the contract. Once that time is up, the cap drops down to 1 GB and subscribers are directed to a portal where they have the option to upgrade back up to the 2 GB per month for the remainder of their contract.
In Brazil, many of Claro’s “Internet for Computer” data plans limit speeds to 128 Kbps once the usage cap is reached (2 GB up to 10 GB). But, the 5 GB and 10 GB have speed limits of 256 Kbps.
Middle East and Africa
Many of Vodacom South Africa’s data plans (HSDPA) provided a limited amount of daily usage (anywhere from 10 MB to 20 GB) for varying rates, but also offer 2 GB to 3 GB of “free” data between midnight and 5 AM daily.
Orange Kenya offers numerous postpaid data packages (from 100 MB to 20 GB) with the standard cost per extra MB fee for those who exceed their monthly limit.
In Egypt, Vodafone offers several mobile data packages that throttle throughput down to 64 Kbps once the cap is reached.
Device Penetration
One key refrain in the mobile bandwidth discussion concerns the increasing penetration of smart devices per person or per household. Taking the U.S. as one example, many households have multiple computers and each adult typically has one mobile device.

Distribution of this report outside of your company or organization is strictly prohibited. Copyright © 2013 iGillottResearch Inc.
19
As more mobile computing devices launch – tablets being one top-of-mind example – the expectation is that each individual (or household, at least) will have multiple mobile devices. An iPhone user would also become an iPad user; a Motorola DROID user would become a Xoom user; either smartphone user might also have a laptop computer (and possibly desktop computer, game console and/or Internet-enabled TV or Roku / Apple TV / etc.).
From a bandwidth demand perspective, it is important to note that iGR does not believe that a smartphone plus tablet user will suddenly begin consuming twice as much data as they had been on their smartphone. It is likely that they will consume more mobile data, but it is equally likely that such a user will offload usage and content consumption to the device(s) they feel are most appropriate to the task and/or their circumstance. So, iGR expects a net 30 to 40 percent increase in mobile data consumption (on average) – but not a doubling or tripling of consumption.
Another way to consider this is through an analogy: just because someone buys a third pair of shoes does not mean that they walk three times as far. Similarly, when iPod owners were buying the first iPhones, they did not suddenly begin buying/listening to twice the amount of music. They simply offloaded a percentage of their consumption from the iPod to the iPhone – and that percentage varied per person. Of course, there might have been an uptick in listening/buying since their phone might be with them more often than the iPod.
In developing markets, this dynamic is quite a bit different given that:
Smartphone penetration is relatively low, both due to handset prices and operator cost structures and market dynamics which might prohibit subsidies.
Prepaid tends to dominate. According to the OECD, Prepaid subscriptions account for 43 percent of all mobile subscriptions in the OECD, but the percentage is uneven across countries. In Japan and Korea, prepaid subscriptions account for less than 2 percent of all mobile subscriptions. In contrast, Mexico has the highest rate of prepaid subscriptions, with 88 percent of total mobile subscriptions, followed by Italy (85 percent) and Greece (77 percent).
Mobile broadband service plans can be expensive, but operators in some regions are innovating in how they charge for mobile broadband. In Brazil and in other countries, for example, one operator charges by the day and only when the service is used.
iGR’s own analysis suggests that while prepaid data plans do exist in all global regions, postpaid data plans are much more common. This may be due to the need for subsidies to lower the initial device cost – and then a contract to lock the subscriber in (and provide the operator with a reasonable chance to recoup its costs and/or generate net profit).

Distribution of this report outside of your company or organization is strictly prohibited. Copyright © 2013 iGillottResearch Inc.
20
For users in developing markets, wireless is likely to be the way that they first connect to the Internet. The likelihood of an individual owning/using more than a single device tends to be lower than in more developed regions.

Distribution of this report outside of your company or organization is strictly prohibited. Copyright © 2013 iGillottResearch Inc.
21
Global Mobile Data Traffic Forecast
The following table shows iGR’s forecast for global mobile data traffic. This is mobile data traffic flowing over cellular operators’ cellular data networks. The iGR estimate does not, however, include M2M nor does it estimate the signaling traffic associated with “chatty” applications (e.g., on smartphones and tablets). iGR’s estimate also excludes data traffic that flows over WiFi networks. The assumptions underlying this forecast are included in the preceding pages; the regional estimates are drawn from the subsequent sections of this report.
In 2012, mobile data traffic was highest in Europe, North America and Asia-Pacific. Note that the growth rates in the developing regions (Asia-Pac, MEA and Latin America) are considerably higher than in the developed regions (North America, Japan and Europe).
Table 1: Mobile data traffic per month per region, 2012-2017 (TB per month)
2012 2013 2014 2015 2016 2017 CAGR
North America 189,324 286,837 408,628 587,604 826,986 1,155,744 43.6%
Europe 310,607 490,168 749,097 1,140,898 1,592,712 2,328,580 49.6%
Japan 96,439 141,365 203,985 292,648 398,196 560,823 42.2%
Asia-Pac 221,290 404,343 924,175 1,927,421 3,188,403 4,664,429 84.0%
Latin America 40,769 74,959 129,084 224,304 362,597 525,658 66.8%
MEA 30,551 76,427 158,815 357,308 603,935 1,049,630 102.9%
Total, TB 888,979 1,474,099 2,573,783 4,530,182 6,972,829 10,284,864 63.2%
Total, in Petabytes (PB) 868.14 1,439.55 2,513.46 4,424.01 6,809.40 10,043.81
Source: iGR, 2013
This is not to suggest that the level of mobile data traffic demand does not heavily grow in the developed market; it does. Developing regions grow quickly primarily due to the “catch up” effect which is driven by numerous factors: the ongoing rollout of 3G (and 4G) networks, the likelihood that mobile broadband networks will be the primary vehicle for broadband data access, the sheer number of new subscribers (not to mention the number of subscribers

Distribution of this report outside of your company or organization is strictly prohibited. Copyright © 2013 iGillottResearch Inc.
22
upgrading to smartphones and other data devices (tablets) as those ASPs fall), the increasing consumption of varied content over cellular data networks, the increasing sophistication and “bit-size” of content delivered over cellular data networks, and the increasing (and pent-up) demand for data / Internet access.
The following chart illustrates just how massive the growth in mobile data traffic is expected to be. In short, the world’s mobile data traffic in 2012 (as iGR defines it) is less almost half of what North America’s mobile data traffic will be in 2017 – and only about 14 percent of what Asia-Pacific’s mobile data traffic is expected to be in 2017.
Figure 1: Mobile data traffic per month per region, 2012-2017 (TB per month)
Source: iGR, 2013
189,324 286,837 408,628 587,604 826,986 1,155,744
310,607 490,168
749,097
1,140,898
1,592,712
2,328,580
141,365
203,985
292,648
398,196
560,823
404,343
924,175
1,927,421
3,188,403
4,664,429
129,084
224,304
362,597
525,658
158,815
357,308
603,935
1,049,630
-
2,000,000
4,000,000
6,000,000
8,000,000
10,000,000
12,000,000
2012 2013 2014 2015 2016 2017
North America Europe Japan Asia-Pac Latin America MEA

Distribution of this report outside of your company or organization is strictly prohibited. Copyright © 2013 iGillottResearch Inc.
23
The following table and figure shows how the percentage of total bandwidth per region changes over the forecast period. Essentially, Asia-Pacific grows to dominate bandwidth consumption by 2017 with the existing large players seeing their total share of bandwidth decrease even as the total amount of mobile data consumed across regions increases.
Table 2: Changing Mobile Data Traffic by Region, 2012-2017
2012 2013 2014 2015 2016 2017
North America 21.3% 19.5% 15.9% 13.0% 11.9% 11.2%
Europe 34.9% 33.3% 29.1% 25.2% 22.8% 22.6%
Japan 10.8% 9.6% 7.9% 6.5% 5.7% 5.5%
Asia-Pac 24.9% 27.4% 35.9% 42.5% 45.7% 45.4%
Latin America 4.6% 5.1% 5.0% 5.0% 5.2% 5.1%
MEA 3.4% 5.2% 6.2% 7.9% 8.7% 10.2%
Total 100.0% 100.0% 100.0% 100.0% 100.0% 100.0%
Source: iGR, 2013

Distribution of this report outside of your company or organization is strictly prohibited. Copyright © 2013 iGillottResearch Inc.
24
Figure 2: Changing Mobile Data Traffic by Region, 2012-2017
Source: iGR, 2013
21.3% 19.5% 15.9% 13.0% 11.9% 11.2%
34.9% 33.3%
29.1%
25.2% 22.8% 22.6%
10.8% 9.6%
7.9%
6.5% 5.7% 5.5%
24.9% 27.4%
35.9%
42.5% 45.7% 45.4%
4.6% 5.1% 5.0% 5.0% 5.2% 5.1%
3.4% 5.2% 6.2% 7.9% 8.7% 10.2%
0%
10%
20%
30%
40%
50%
60%
70%
80%
90%
100%
2012 2013 2014 2015 2016 2017
North America Europe Japan Asia-Pac Latin America MEA

Distribution of this report outside of your company or organization is strictly prohibited. Copyright © 2013 iGillottResearch Inc.
25
Definitions
General
ARPU (Average Revenue Per User): The average amount of money a subscriber spends each month on their wireless service.
CAGR (Compounded Annual Growth Rate): A formula used to calculate the growth rate over a period of time.
Churn: The percent of subscribers who discontinue wireless usage with the carrier in a given month.
CPGA (Cost Per Gross Addition): The average marketing, handset subsidy, and other costs incurred by an operator to acquire a new subscriber.
Penetration: The percentage of a country or region’s population that has adopted a given technology or service.
Postpaid: The traditional method of service billing where the customer receives a bill at the end of the month detailing what they owe for the month’s usage. Postpaid plans are generally packaged with service contracts that provide phone subsidies.
Prepaid: A method of paying for wireless service prior to use, either by purchasing a bucket of usage at the beginning of the month or drawing from an account with stored value on a per usage basis. Prepaid plans generally forgo service contracts or credit checks and are unlikely to provide phone subsidies.
Device Types
Embedded Modem: A modem that is internally embedded in a device to give the device mobile broadband access. Most laptops and netbooks can be configured to come with embedded modems.
Ereader: Ereaders are portable devices specifically designed for reading digital books, newspapers, magazines, and other literary content. Though ereaders may perform a variety of functions, their focus on reading differentiates them from other devices. Examples include the Amazon Kindle, the Sony Reader, and the Barnes & Noble Nook.
Feature Phone: A conventional cellular phone for calls, SMS, and other simple tasks with an ordinary, 10-digit keypad and, usually, a camera.
Netbook: A highly portable laptop that is generally smaller, lighter, cheaper, and more energy efficient than a laptop, at the expense of processing power. Resultantly, many netbooks use legacy or specialized operating systems, such as Windows XP, Windows 7 Starter Edition, or custom Linux distributions. Some netbooks are subsidized when sold in conjunction with 3G mobile broadband service contracts.

Distribution of this report outside of your company or organization is strictly prohibited. Copyright © 2013 iGillottResearch Inc.
26
Portable Modem: A modem packaged in a portable form such as a USB Dongle or ExpressCard that can be used to give compatible devices mobile broadband access.
Smartphone: A cellular phone that uses a recognizable operating system with an advanced web browser and the capability to install third-party applications. Common smartphone operating systems include Apple’s iOS, RIM’s BlackBerry OS, Palm’s webOS, Google’s Android, Microsoft’s Windows Mobile, and Nokia’s Symbian Platform.
Tablet: A portable computing device that, unlike laptops or netbooks, uses a touch screen as its primary method of input, not a mouse and keyboard. Tablets are generally larger than smartphones, but smaller than laptops. One examples of a tablet is Apple’s iPad.
Texting Phone: Similar to a feature phone, except has a full QWERTY keyboard, virtual or physical, for convenient messaging. Texting phones often have support for email, some form of web access, and playing music.
Services
IM (Instant Messaging): a form of live, text based communication between two or more users. A plethora of IM services exist and two users generally must be using the same service in order to chat. Popular IM services include AOL IM (AIM), Yahoo! Messenger, Google Talk (GTalk/GChat), and MSN Messenger.
IMS (IP Multimedia Subsystem): a framework originally developed by the 3GPP for delivering multimedia services over an all-IP network, such as voice calling, messaging, video calling, IP TV, or IP radio.
MMS (Multimedia Messaging Service): an improved version of the popular SMS that allows for the inclusion of larger amounts of text, images, audio, and even video.
NFC (Near Field Communications): a high frequency wireless technology used at extremely short range. NFC is often implemented in wallet style cards (such as credit, identification, or mass transit cards) as an alternative to magnetic strips, allowing users to make so called “blink” transactions where their card is held in front of a card reader instead of being slid through it. NFC chips can also be embedded in mobile devices to allow the device to make blink transactions.
SMS (Short Message Service): often referred to as text messaging or simply “texting,” SMS is a text based communication service used to send short messages (generally under 160 characters in length) between mobile phones.
VoIP (Voice over IP): a term used to describe any service that provides voice communications over a network with IP-based architecture. This could refer to services such as Skype, which provide voice calling over the Internet’s IP network, or a voice service for a carrier that is being delivered over an all-IP mobile network.

Distribution of this report outside of your company or organization is strictly prohibited. Copyright © 2013 iGillottResearch Inc.
27
Network Technology
1G (First Generation): a generic term to describe analog mobile telecommunications technologies, such as AMPS (Advanced Mobile Phone System) and TACS (Total Access Communication System).
1X: shorthand for CDMA2000 1X (also known as IS-2000), a 2.5G, CDMA based technology developed by Qualcomm that builds on cdmaOne and is capable of peak data rates of 153 Kbit/s. 1X can be upgraded to 1X Advanced, which increases voice and data capacity.
2.5G: a term used to describe to mobile communications technologies evolved from 2G technologies that served as a transitional step to 3G networks, such as EDGE and 1X, which achieved higher voice and data capacity than their 2G counterparts.
2G (Second Generation): a generic term to describe early digital mobile communications technologies, such as cdmaOne, GSM, and iDEN.
3G (Third Generation): technically used to describe technologies that fulfill the ITU’s IMT-2000 requirement, but in practice a generic term to describe advanced wireless technologies that are capable of high data rates, such as UMTS and EV-DO.
3GPP: Third Generation Partnership Project is a collaboration between multiple telecommunications associations, known as the Organizational Partners, with the principle goal of making a globally applicable 3G mobile phone system specification based on evolved GSM specifications. The 3GPP is designed to work within the scope of the IMT-2000 specs. Today, 3GPP is principally tasked with development of LTE and LTE-A specifications.
4G (Fourth Generation): used to describe technologies that fulfill the ITU’s IMT-Advanced specifications, such as WiMax 2 and LTE Advanced. 4G technologies have flexible channel bandwidths; peak speeds of 100 Mbit/s when mobile and 1.5 Gbit/s when fixed; high spectral efficiency; smooth handoff between different network types; and a flat, all-IP network architecture. In practice, 4G is also used to describe technologies that nearly meet these requirements such Mobile WiMAX and LTE.
CDMA (Code Division Multiple Access): an FDD approach to wireless communications where each transmission is digitized and then tagged with a code. The mobile phone is then instructed to decipher only a particular code to pluck the right conversation off the air. The process can be compared in some ways to an English-speaking person picking out in a crowded room of French speakers the only other person speaking English.
cdmaOne: a CDMA based 2G network technology developed by Qualcomm that is also known by its technical name, IS-95, or just CDMA for short.
DAS: Distributed Antenna System is a network of spatially separated antenna nodes connected to a common radio that provides wireless service within a geographic area or structure.

Distribution of this report outside of your company or organization is strictly prohibited. Copyright © 2013 iGillottResearch Inc.
28
E-UTRAN: Evolved UMTS Terrestrial Radio Access Network is the air interface for LTE.
EDGE (Enhanced Data rates for Global Evolution): a 2.5G technology for GSM and TDMA networks that offers peak mobile data downlinks speeds of up to 384 Kbit/s in end-user devices.
EMS: Element Management System are the systems and applications used to manage network elements on the network element management layer (NEL) of the Telecommunication Management Network (TMN) model.
eNode B: E-UTRAN Node B is the base transceiver station hardware in LTE networks. Node B uses the WCDMA/TD-SCDMA as the air interface technology. eNode B is therefore the enhanced version of Node B.
EPC: Evolved Packet Core is the core IP processing functionality for LTE and beyond, as defined by the SAE.
EV-DO: shorthand for CDMA2000 1xEV-DO (also known as IS-856), a CDMA based 3G technology developed by Qualcomm and supported by the 3GPP2 that builds on 1X and supports entirely packet based networks. The first iteration of the technology, Rel. 0, can be upgraded to Rev. A, Rev. B, Rev. B Multi-Carrier with a hardware upgrade, and even EV-DO Advanced. Rev A, the most deployed version of the technology, is capable of peak rates of 3.1 Mbit/s in a 1.25 MHz channel.
FDD (Frequency Division Duplex): segregates uplink and downlink operations into two spectrum bands of equal width (paired spectrum bands), which are separated by one or more other bands to avoid interference.
Fixed WiMax: the common name for 802.16d, since it does not support client or terminal mobility.
GPRS (General Packet Radio Service): a technology for data transmission on GSM networks.
GSM (Global System for Mobile Communications): a TDMA based 2G air interface technology used throughout the world.
HETNET: Heterogeneous Network is a network connecting computers and other devices with different operating systems and/or protocols. In wireless, HetNet indicates the use of multiple types of access nodes, including macrocells, picocells, femtocells and/or Wi-Fi, in order to offer wireless coverage in an environment with a wide variety of wireless coverage zones.
HSPA: High Speed Packet Access is an amalgamation of High Speed Downlink Packet Access (HSDPA) and High Speed Uplink Packet Access (HSUPA) that supports increased peak data rates of up to 14 Mbit/s in the downlink and 5.76 Mbit/s in the uplink. Evolved HSPA (also known as HSPA+) is a wireless broadband standard defined in 3GPP release 7 and 8 of the WCDMA specification that provides data rates up to 84 Mbit/s in the downlink and 22 Mbit/s in the uplink (per 5 MHz carrier) with MIM) technologies and higher order modulation.

Distribution of this report outside of your company or organization is strictly prohibited. Copyright © 2013 iGillottResearch Inc.
29
HSS: Home Subscriber Server is the central network database that contains user-related and subscription-related information. The HSS provides mobility management, call and session establishment support, user authentication and access authorization. The HSS is based on pre-Rel-4 Home Location Register (HLR) and Authentication Center (AuC).
iDEN (Integrated Digital Enhanced Network) is a 2G TDMA based mobile communications technology developed by Motorola that provides users with the benefit of Push To Talk (walkie talkie style) communication.
IMS: IP Multimedia Subsystem is an architectural framework for delivering Internet Protocol (IP) multimedia services, originally designed by the 3GPP as a part of the vision for evolving mobile networks beyond GSM.
LTE (Long Term Evolution): a OFDMA based 3GPP standard, generally branded as 4G, that uses an all-IP flat network architecture and is capable of peak downlink speeds 100 Mbit/s and uplink speeds of 50 Mbit/s when deployed in a 20 MHz channel, and even higher rates if used with MIMO to deploy LTE in multiple channels. LTE is generally FDD, but also has an TDD implementation, TD-LTE.
LTE-Advanced: a 3GPP standard that builds off LTE, offering even greater channel flexibility and peak data rates of more than 1 Gbit/s.
MIMO (Multiple Input Multiple Output): the use of multiple antennas at both the transmitter and receiver to increase spectral efficiency and link reliability.
MME: Mobile Managed Entity is the key control-node for the LTE access-network. It is responsible for idle mode UE (User Equipment) tracking and paging procedure including retransmissions.
Mobile WiMax: the common name for 802.16e, since the technology includes support for high-speed client mobility. Mobile WiMax networks are not backwards compatible with Fixed WiMax networks and offer peak speeds of up to 40 Mbit/s in a single 20 MHz channel.
NGMN: Next Generation Mobile Networks Alliance is an industry association founded to develop a common solutions view of next generation wireless networks.
OFDMA (Orthogonal Frequency Division Multiple Access): and advanced method of wireless communications that uses complex channel division methods to achieve minimal interference, high spectral efficiency, and efficient use of MIMO.
PGW (PDN Gateway): PDN Gateway provides connectivity from the user equipment (UE) to external packet data networks by being the point of exit and entry of traffic for the device. A UE may have simultaneous connectivity with more than one PGW for accessing multiple PDNs. The PGW performs policy enforcement, packet filtering for each user, charging support, lawful interception and packet screening. PGW also provides for mobility between 3GPP and non-3GPP technologies such as WiMAX, CDMA 1X and EvDO.

Distribution of this report outside of your company or organization is strictly prohibited. Copyright © 2013 iGillottResearch Inc.
30
RAN: Radio Access Network – the physical radio layer at the front of each wireless network. Provides the RF connection to the end user device.
S-GW: Serving Gateway routes and forwards user data packets and acts as the mobility anchor for the user plane during inter-eNodeB handovers. The S-GW also manages mobility between LTE and other 3GPP technologies (terminating S4 interface and relaying the traffic between 2G/3G systems and PGW).
SAE: System Architecture Evolution is the core network architecture of 3GPP's LTE wireless communication standard.
SGSN: Service GPRS Support Node is responsible for the delivery of data packets from and to the 2G and 3G mobile base stations within its geographical service area. Its tasks include packet routing and transfer, mobility management (attach/detach and location management), logical link management, and authentication and charging functions.
SON: Self-Organizing Network has been defined by the 3GPP and NGMN as a framework for functions on future radio access networks that make it easier to plan, configure, manage, optimize and correct radio networks.
TDD (Time Division Duplex): a method of separating a channel’s uplink and downlink signals by assigning each unique time slots, allowing use of a single, unpaired block of spectrum.
TDMA (Time Division Multiple Access): a TDD method of wireless communications that allows many users to access a single radio frequency channel without interference by allocating unique time slots to each user within each channel.
UMTS (Universal Mobile Telecommunications System): the 3GPP’s standardized CDMA based approach to 3G cellular systems. UMTS includes technologies such as W-CDMA (Wideband CDMA), HSPA (High Speed Packet Access), and HSPA+. In a 5 MHz channel, HSPA+ can reach peak download speeds of 21 Mbit/s, or even higher if deployed with MIMO.
Wi-Fi: Wireless Fidelity is a wireless network for connecting computing devices, as defined by IEEE 802.11 in the 2.4 GHz, 3.6 GHz and 5 GHz frequency bands.
WiMax (Worldwide Interoperability for Microwave Access): refers to set of implementations of the IEEE’s 802.16 wireless network standards supported by the WiMax Forum, which certifies vendor equipment to ensure interoperability. WiMax requires an all-IP, network architecture, makes uses of OFDMA, and generally uses unpaired, TDD spectrum.
WiMax 2: the common name for 802.16m, which is expected to be the first truly 4G WiMax technology capable of mobile data speeds up to 120 Mbit/s in a single 20 MHz channel. 802.16m will succeed 802.16e, with which it is backwards compatible.

Distribution of this report outside of your company or organization is strictly prohibited. Copyright © 2013 iGillottResearch Inc.
31
Regions
All regions are roughly based on traditional geographic conventions. There are no countries that are divided between multiple regions or that are a member of multiple regions.
Asia-Pacific: All countries in East Asia, South Asia, Oceania, and the Pacific. Afghanistan and Pakistan, sometimes considered parts of the Middle East, are also part of the region. Other exceptions are Russia (which is part of Europe) and Japan (which is its own region).
Europe: All countries on the continent of Europe. Additionally the following transcontinental and Western Asia countries are part of the Europe region: Cyprus, Russia, Turkey, Georgia, Armenia, and Azerbaijan.
Japan: the nation of Japan.
Latin America: All countries in Central America (including Mexico), the Caribbean, and South America.
Middle East and Africa: All countries in Africa and the Middle East. Additionally, the following Central Asian countries are a part of the region: Kazakhstan, Kyrgyz Republic, Turkmenistan, Tajikistan, and Uzbekistan. Some countries traditionally considered to be part of the Middle East region are a categorized under other regions. Turkey, Armenia, Azerbaijan, and Georgia are a part of the Europe region. Afghanistan and Pakistan are a part of the Asia-Pacific region.
North America: The United States and Canada.

Distribution of this report outside of your company or organization is strictly prohibited. Copyright © 2013 iGillottResearch Inc.
32
About iGR
iGR is a market strategy consultancy focused on the wireless and mobile communications industry. Founded by Iain Gillott, one of the wireless industry’s leading analysts, we research and analyze the impact new wireless and mobile technologies will have on the industry, on vendors’ competitive positioning, and on our clients’ strategic business plans.
Our clients typically include service providers, equipment vendors, mobile Internet software providers, wireless ASPs, mobile commerce vendors, and billing, provisioning, and back office solution providers. We offer a range of services to help companies improve their position in the marketplace, clearly define their future direction, and, ultimately, improve their bottom line.
Note that Iain Gillott currently serves as an independent director for Wmode, Inc.
A more complete profile of the company can be found at http://www.igr-inc.com/.
Disclaimer
The opinions expressed in this report are those of iGR and do not reflect the opinions of the companies or organizations referenced in this study. All research was conducted exclusively and independently by iGR.


![P2P Offloading in Mobile Networks using SDNjmanbal/paper/p2p_slide.pdfSOURCE: [1] Cisco VNI Mobile, 2016 3 Mobile multimedia traffic on the rise. Cisco Forecast of mobile data traffic](https://img.dokumen.tips/doc/110x75/5f562376680a2d7e6f61393b/p2p-offloading-in-mobile-networks-using-jmanbalpaperp2pslidepdf-source-1.jpg)


