Embed Size (px)
Citation preview
United StatesDepartment ofAgriculture
ForeignAgriculturalService
Approved by the World Agricultural Outlook Board/USDA
Circular SeriesDL&P 2-01October 2001
Total meat (beef, pork, and poultry) exports by selected countries for 2002 are forecast at a record16.7 million tons, up 7 percent from the previous year. The U.S. market share of these exports hasbeen relatively flat for the past 7 years, taking about 29 percent of total meat exports. Russia, China,and Japan are projected to increase their imports. For 2002, total beef exports are forecast at a record 5.8 million tons, up 7 percent from last year as allmajor exporters are expected to show increases. However, the U.S. beef market share is expected tocontract slightly in the face of additional competition and reduced U.S. production.
For 2002, total pork exports are forecast at a record 3.8 million tons, up 7 percent from last year. Projected export increases by the European Union, Canada, and Brazil will more than offset a declineby the United States. United States pork exports are forecast to drop from the 2001 record level, thusits market share for total pork trade is projected to be down almost 3 percentage points.
For 2002, total poultry trade is forecast to increase 7 percent to a record 7.2 million tons. Demand forpoultry products has surged due to consumer fears of Bovine Spongiform Encephalopathy (BSE) andFoot and Mouth Disease (FMD). It is expected that all major exporters will continue to increaseproduction to meet this additional demand, but at a slower rate than in the previous year. The U.S.poultry market export share for 2002 is expected to fall about 2 percentage points as competitionincreases, mainly from Brazil.
Global Meat Exports Show Steady Rise, but U.S. Market Share Projected to Dip
1980
1990
2002 (f)
0
3
6
9
12
15
18
5
10
15
20
25
30
35
Million tons Percent
U. S.Market Share
TotalExports
For Information Contact:U.S. Department of Agriculture, Foreign Agricultural Service
Dairy, Livestock and Poultry DivisionAG Box 1044, South Agriculture Building, Washington, D.C. 20250-1044
Howard Wetzel, DirectorTEL: (202) 720-8031 FAX: (202) 720-0617
AnalysisDeputy Director for Analysis
Lee Schatz . . . . . . . . . . . . . . . . . . (202) 720-1350Head, Livestock Group
Scott Sindelar . . . . . . . . . . . . . . . . (202) 720-1319Head, Dairy and Poultry Group
Ralph Dutrow . . . . . . . . . . . . . . . . (202) 720-7400
BeefRoseanne Freese . . . . . . . . . . . . . . (202) 720-7285Michael Riedel . . . . . . . . . . . . . . . (202) 720-4185
Pork and SwineYoonhee Macke . . . . . . . . . . . . . . (202) 720-8252Tim Rocke . . . . . . . . . . . . . . . . . . (202) 720-7715
Lamb, Mutton, and GoatMichael Riedel . . . . . . . . . . . . . . . (202) 720-4185
Tallow, Lard, Meat and Bone MealMichael Riedel . . . . . . . . . . . . . . . (202) 720-4185
Hides, Skins, and LeatherMichael Riedel . . . . . . . . . . . . . . . (202) 720-4185
Poultry ProductsAlessandra Sartori-McCormack . . (202) 720-7066Susan Phillips . . . . . . . . . . . . . . . . (202) 720-1372
Dairy ProductsArthur Coffing . . . . . . . . . . . . . . . (202) 720-3761
Beef Cattle and HorsesRoseanne Freese . . . . . . . . . . . . . . (202) 720-7285
Dairy Breeding Cattle, Embryos, SemenRoseanne Freese . . . . . . . . . . . . . . (202) 720-7285
Mohair and Wool
MarketingDeputy Director for Marketing
Roger Wentzel . . . . . . . . . . . . . . . (202) 720-1353Sanitary/Phytosanitary Issues
Kathleen Wainio . . . . . . . . . . . . . . (202) 720-2461
Mary Ponomarenko . . . . . . . . . . . . . . . (202) 720-4455Barbara Wolff . . . . . . . . . . . . . . . . . . . . (202) 720-4456
Mary Ponomarenko . . . . . . . . . . . . . . . (202) 720-4455Barbara Wolff . . . . . . . . . . . . . . . . . . . . (202) 720-4456
Mary Ponomarenko . . . . . . . . . . . . . . . (202) 720-4455
Willie Brooks . . . . . . . . . . . . . . . . . . . . (202) 720-3690
Willie Brooks . . . . . . . . . . . . . . . . . . . . (202) 720-3690
Mary Ponomarenko . . . . . . . . . . . . . . . (202) 720-4455
Gary Fountain . . . . . . . . . . . . . . . . . . . . (202) 720-1352
Stephanie Riddick . . . . . . . . . . . . . . . . (202) 720-7571
Stephanie Riddick . . . . . . . . . . . . . . . . (202) 720-7571
Mary Ponomarenko . . . . . . . . . . . . . . . (202) 720-4455
SPECIAL AREASProgram Specialist Elaine Protzman . . . . . . . . . . . . . . . . . . . (202) 720-5588Market Promotion Programs Mary Ponomarenko . . . . . . . . . . . . . . . . (202) 720-4455
Barbara Wolff . . . . . . . . . . . . . . . . . . . . (202) 720-4456Dairy Export Incentive Program and Paul Kiendl . . . . . . . . . . . . . . . . . . . . . . (202) 720-8870 Export Enhancement Program
The United States Department of Agriculture (USDA) prohibits discrimination in all its programs and activities on the basis of race,color, national origin, gender, religion, age, disability, political beliefs, sexual orientation, and marital or family status. (Not allprohibited bases apply to all programs.) Persons with disabilities who require alternative means for communication of programinformation (Braille, large print, audiotape, etc.) should contact USDA's TARGET Center at 202-720-2600 (voice and TDD).
To file a complaint of discrimination, write USDA, Director, Office of Civil Rights, Room 326-W, Whitten Building, 14th andIndependence Avenue, S.W., Washington, DC 20250-9410, or call (202) 720-5964 (voice and TDD). USDA is an equal opportunityprovider and employer.
Contents
World Markets and Trade - 3
Livestock and Poultry: World Markets and Trade
Note to Readers........................................................................................................................ 4
Commodity and Market Analysis
Meat Situation in the European Union in 2002 .....................................................................5
Cattle and BeefBeef and Veal Summary Table ........................................................................................7Beef and Veal Export Overview ......................................................................................8Canada..............................................................................................................................9Japan ..............................................................................................................................10Korea ..............................................................................................................................11Mexico .............................................................................................................................12Russia ..............................................................................................................................13
Swine and PorkPork Summary Table .......................................................................................................14Pork Export Overview .....................................................................................................15Hong Kong.......................................................................................................................16Japan ..............................................................................................................................17Korea ..............................................................................................................................18Mexico .............................................................................................................................19Russia ..............................................................................................................................20
Poultry and EggsTotal Poultry Meat Summary Table.................................................................................21Total Poultry Meat Export Overview...............................................................................22Canada..............................................................................................................................23China ..............................................................................................................................24Japan ..............................................................................................................................25Mexico .............................................................................................................................26Russia ..............................................................................................................................27Egg Summary Table.........................................................................................................28
To view this information on the internet, please go to: http://www.fas.usda.gov/dlp/dlp.html

NOTE TO READERS
In order to reflect a more accurate global livestock and poultry trade picture, the U.S. Department ofAgriculture (USDA) made historical revisions in the trade data for most countries in its database basedon available country customs statistics. Russia, Mexico, EU, and China/Hong Kong are exampleswhere significant changes were made with respect to their meat supply and demand situation. ForRussia, USDA used major country exporter data supplemented by Russian import statistics to arrive atRussia=s historical meat imports. For Mexico, historical trade is now based on Mexican importstatistics. The EU is now accounted for as a single entity in the USDA production, supply, anddistribution (PSD) database for livestock, poultry, and meats, and individual member states supply anddemand tables have been discontinued. For beef and pork, pre-2000 EU historical imports andexports are based upon previous member state level data, and the 1997 forward poultry meat trade isbased on Eurostat data. From 2000 forward for beef and pork, and 1997 forward for poultry, thePSD is based on the new consolidated EU report. Specific for poultry, China and Hong Kong importsare adjusted to a retained imports basis which treats transshipments of poultry products from HongKong to China as imports into China, not Hong Kong.
The Livestock and Poultry: World Market and Trade circular format has changed from previouspublications in an attempt to better meet end-user needs. Beef, pork, and poultry country-level pagesare now added, with tables, graphs, and text describing the current animal/meat situation in thatparticular country. The Summary Tables with meat production, imports, exports, and consumption arestill presented in order to provide a quick overview of the world situation. The entire USDA PSDdatabase will be available on FAS Online in the near future for users to access and generate the full setof PSD data. In the meantime, the PSD is still available on the traditional USDA websitehttp://www.ers.usda.gov/data/psd/
Please refer to the USDA/FAS Dairy, Livestock, and Poultry Division (DLP) website at:http://www.fas.usda.gov/dlp/dlp.html for additional data and analysis, such as the InternationalAgricultural Trade Reports, Trade at a Glance, and Country Pages (under construction). Thesereports are posted regularly on the homepage covering analysis on current issues and topics, new tradedata, and market competition. In addition, more commodity country-level pages with additional details,such as trade matrices, will be published over the course of the next few months on the DLP homepage.
World Markets and Trade - 4
World Markets and Trade - 6
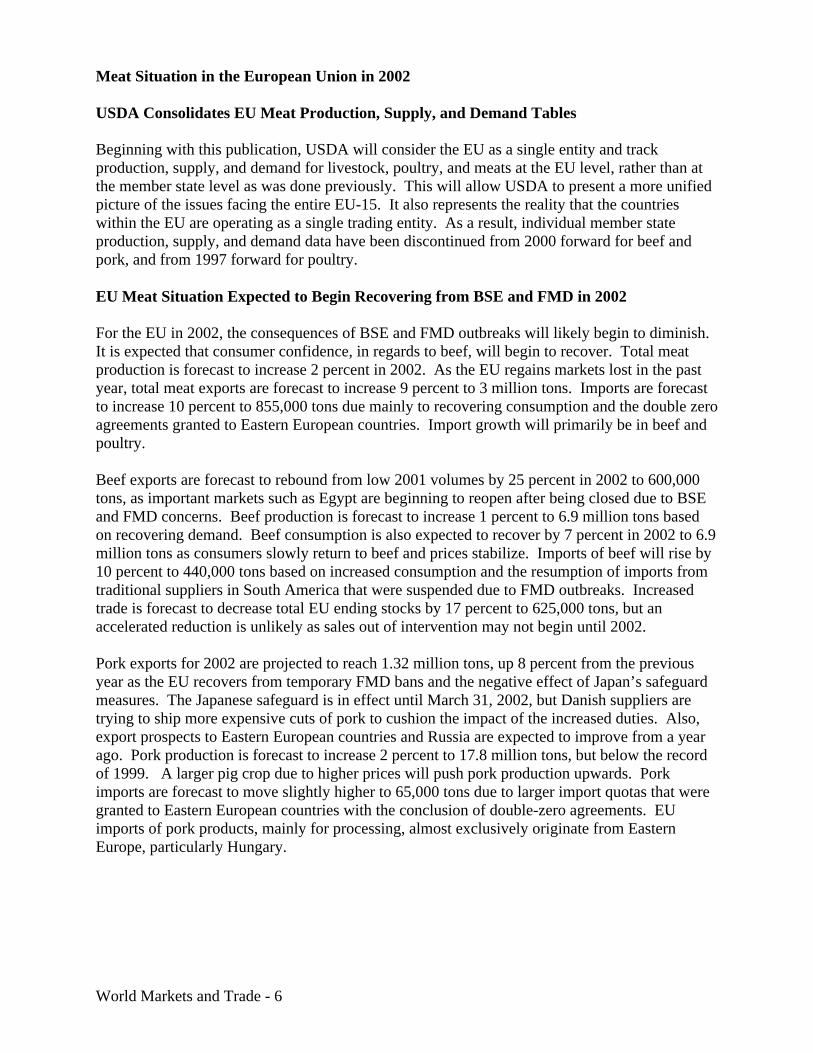
Meat Situation in the European Union in 2002
USDA Consolidates EU Meat Production, Supply, and Demand Tables
Beginning with this publication, USDA will consider the EU as a single entity and trackproduction, supply, and demand for livestock, poultry, and meats at the EU level, rather than atthe member state level as was done previously. This will allow USDA to present a more unifiedpicture of the issues facing the entire EU-15. It also represents the reality that the countrieswithin the EU are operating as a single trading entity. As a result, individual member stateproduction, supply, and demand data have been discontinued from 2000 forward for beef andpork, and from 1997 forward for poultry.
EU Meat Situation Expected to Begin Recovering from BSE and FMD in 2002
For the EU in 2002, the consequences of BSE and FMD outbreaks will likely begin to diminish.It is expected that consumer confidence, in regards to beef, will begin to recover. Total meatproduction is forecast to increase 2 percent in 2002. As the EU regains markets lost in the pastyear, total meat exports are forecast to increase 9 percent to 3 million tons. Imports are forecastto increase 10 percent to 855,000 tons due mainly to recovering consumption and the double zeroagreements granted to Eastern European countries. Import growth will primarily be in beef andpoultry.
Beef exports are forecast to rebound from low 2001 volumes by 25 percent in 2002 to 600,000tons, as important markets such as Egypt are beginning to reopen after being closed due to BSEand FMD concerns. Beef production is forecast to increase 1 percent to 6.9 million tons basedon recovering demand. Beef consumption is also expected to recover by 7 percent in 2002 to 6.9million tons as consumers slowly return to beef and prices stabilize. Imports of beef will rise by10 percent to 440,000 tons based on increased consumption and the resumption of imports fromtraditional suppliers in South America that were suspended due to FMD outbreaks. Increasedtrade is forecast to decrease total EU ending stocks by 17 percent to 625,000 tons, but anaccelerated reduction is unlikely as sales out of intervention may not begin until 2002.
Pork exports for 2002 are projected to reach 1.32 million tons, up 8 percent from the previousyear as the EU recovers from temporary FMD bans and the negative effect of Japan’s safeguardmeasures. The Japanese safeguard is in effect until March 31, 2002, but Danish suppliers aretrying to ship more expensive cuts of pork to cushion the impact of the increased duties. Also,export prospects to Eastern European countries and Russia are expected to improve from a yearago. Pork production is forecast to increase 2 percent to 17.8 million tons, but below the recordof 1999. A larger pig crop due to higher prices will push pork production upwards. Porkimports are forecast to move slightly higher to 65,000 tons due to larger import quotas that weregranted to Eastern European countries with the conclusion of double-zero agreements. EUimports of pork products, mainly for processing, almost exclusively originate from EasternEurope, particularly Hungary.

World Markets and Trade - 6
Poultry exports are forecast to increase 3 percent to slightly more than 1 million tons in 2002.Exports in 2001 dropped as a significant part of production was consumed domestically due tofood safety concerns of BSE and FMD. Poultry production is expected to increase again in 2002by 3 percent; however, it is anticipated that the rate of increase will begin to slow as consumersresume purchasing beef and pork products. Poultry imports will also increase due to the doublezero agreements with Eastern Europe and continued growth in Brazil and Thailand, thepredominant suppliers.
Production Exports Consumption ImportsEnding gStocksss
Beef 2000 7,462 643 7,300 448 3672001 6,896 480 6,433 400 7502002 6,932 600 6,897 440 625
Pork 2000 17,585 1,470 16,168 54 7372001 17,419 1,220 16,299 60 6972002 17,800 1,320 16,542 65 700
Poultry 2000 8,394 1,032 7,669 307 02001 8,599 1,018 7,898 317 02002 8,850 1,050 8,150 350 0
Total 2000 33,441 3,145 31,137 809 1,1042001 32,914 2,768 30,580 777 1,4472002 33,582 3,020 31,539 855 1,325
All data in thousand metric tons
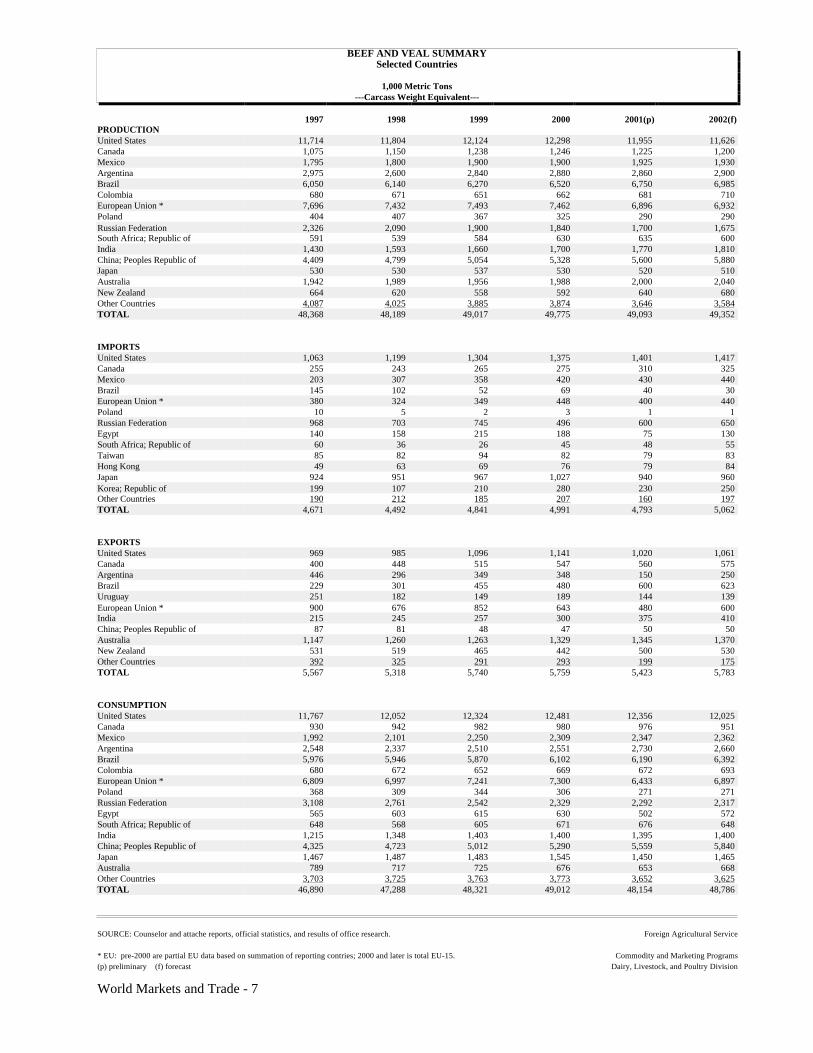
BEEF AND VEAL SUMMARYSelected Countries
1,000 Metric Tons---Carcass Weight Equivalent---
1997 1998 1999 2000 2001(p) 2002(f)PRODUCTIONUnited States 11,714 11,804 12,124 12,298 11,955 11,626Canada 1,075 1,150 1,238 1,246 1,225 1,200Mexico 1,795 1,800 1,900 1,900 1,925 1,930Argentina 2,975 2,600 2,840 2,880 2,860 2,900Brazil 6,050 6,140 6,270 6,520 6,750 6,985Colombia 680 671 651 662 681 710European Union * 7,696 7,432 7,493 7,462 6,896 6,932Poland 404 407 367 325 290 290Russian Federation 2,326 2,090 1,900 1,840 1,700 1,675South Africa; Republic of 591 539 584 630 635 600India 1,430 1,593 1,660 1,700 1,770 1,810China; Peoples Republic of 4,409 4,799 5,054 5,328 5,600 5,880Japan 530 530 537 530 520 510Australia 1,942 1,989 1,956 1,988 2,000 2,040New Zealand 664 620 558 592 640 680Other Countries 4,087 4,025 3,885 3,874 3,646 3,584TOTAL 48,368 48,189 49,017 49,775 49,093 49,352
IMPORTSUnited States 1,063 1,199 1,304 1,375 1,401 1,417Canada 255 243 265 275 310 325Mexico 203 307 358 420 430 440Brazil 145 102 52 69 40 30European Union * 380 324 349 448 400 440Poland 10 5 2 3 1 1Russian Federation 968 703 745 496 600 650Egypt 140 158 215 188 75 130South Africa; Republic of 60 36 26 45 48 55Taiwan 85 82 94 82 79 83Hong Kong 49 63 69 76 79 84Japan 924 951 967 1,027 940 960Korea; Republic of 199 107 210 280 230 250Other Countries 190 212 185 207 160 197TOTAL 4,671 4,492 4,841 4,991 4,793 5,062
EXPORTSUnited States 969 985 1,096 1,141 1,020 1,061Canada 400 448 515 547 560 575Argentina 446 296 349 348 150 250Brazil 229 301 455 480 600 623Uruguay 251 182 149 189 144 139European Union * 900 676 852 643 480 600India 215 245 257 300 375 410China; Peoples Republic of 87 81 48 47 50 50Australia 1,147 1,260 1,263 1,329 1,345 1,370New Zealand 531 519 465 442 500 530Other Countries 392 325 291 293 199 175TOTAL 5,567 5,318 5,740 5,759 5,423 5,783
CONSUMPTIONUnited States 11,767 12,052 12,324 12,481 12,356 12,025Canada 930 942 982 980 976 951Mexico 1,992 2,101 2,250 2,309 2,347 2,362Argentina 2,548 2,337 2,510 2,551 2,730 2,660Brazil 5,976 5,946 5,870 6,102 6,190 6,392Colombia 680 672 652 669 672 693European Union * 6,809 6,997 7,241 7,300 6,433 6,897Poland 368 309 344 306 271 271Russian Federation 3,108 2,761 2,542 2,329 2,292 2,317Egypt 565 603 615 630 502 572South Africa; Republic of 648 568 605 671 676 648India 1,215 1,348 1,403 1,400 1,395 1,400China; Peoples Republic of 4,325 4,723 5,012 5,290 5,559 5,840Japan 1,467 1,487 1,483 1,545 1,450 1,465Australia 789 717 725 676 653 668Other Countries 3,703 3,725 3,763 3,773 3,652 3,625TOTAL 46,890 47,288 48,321 49,012 48,154 48,786
SOURCE: Counselor and attache reports, official statistics, and results of office research. Foreign Agricultural Service
* EU: pre-2000 are partial EU data based on summation of reporting contries; 2000 and later is total EU-15. Commodity and Marketing Programs(p) preliminary (f) forecast Dairy, Livestock, and Poultry Division
World Markets and Trade - 7

World Markets and Trade - 8
Beef and Veal Export Overview
Total Beef Exports Forecast to Recover in 2002 and Reach Record 5.8 Million Tons
Total beef exports for selected countries of the world are forecast to rise by 360,000 tons in 2002to reach a record 5.8 million tons, up nearly 7 percent from the previous year. Beef exports byvirtually all the major players are expected to climb.
United States beef exports are forecast to rise by 4 percent to 1.06 million tons in 2002, a returnto a near record level, but not enough to keep pace with the competition. U.S. beef exports faceincreasing challenges from Australia and Canada, especially in Japan and Korea. High U.S.domestic prices, stemming from strong demand, and unfavorable exchange rates have alsocontributed to lower U.S. exports in 2001. With smaller beef supplies expected in 2002, upwardpressure on U.S. prices should remain.
World demand for beef is expected to recover as more countries, especially Russia, reopen theirmarkets as EU controls vis-à-vis FMD and BSE take effect. The occurrence of BSE in Japan inlate September of 2001, however, has raised consumer anxieties there and will dampen demandwell into the first part of 2002.
Australia, the world’s leading volume exporter of beef, is expected to continue expanding in2002, with more product entering the U.S. and East Asian markets. Although Canada’s beefproduction is expected to slow slightly in 2002, Canada’s exchange rate advantage is expected tolead to more Canadian beef in more overseas markets. New Zealand and India (mainly buffalomeat) are also moving more beef overseas, especially as their abundant supplies make theirproduct more attractive in increasingly price sensitive Southeast Asian and Middle Easternmarkets. EU export volumes are expected to rebound from their low 2001 levels by 25 percentas markets which had closed due to FMD concerns are expected to reopen in the latter half of2001 and throughout 2002. Exports from Argentina and Brazil will recover in 2002, while thosefrom Uruguay are expected to decline slightly as these countries undergo the stages of FMDoutbreak, control, and recovery.
U.S. Beef Export Market Share Slips As New Players Step Up to the Bat
USAustralia
BrazilEU
CanadaNew Zealand
India0
0.3
0.6
0.9
1.2
1.5
M illion tons
1980 1990 20020
1
2
3
4
5
6
7
0
10
20
M illion tons Percent
U.S.Market Share
WorldTrade
* 2000 - 2002 forecast
World Markets and Trade - 9
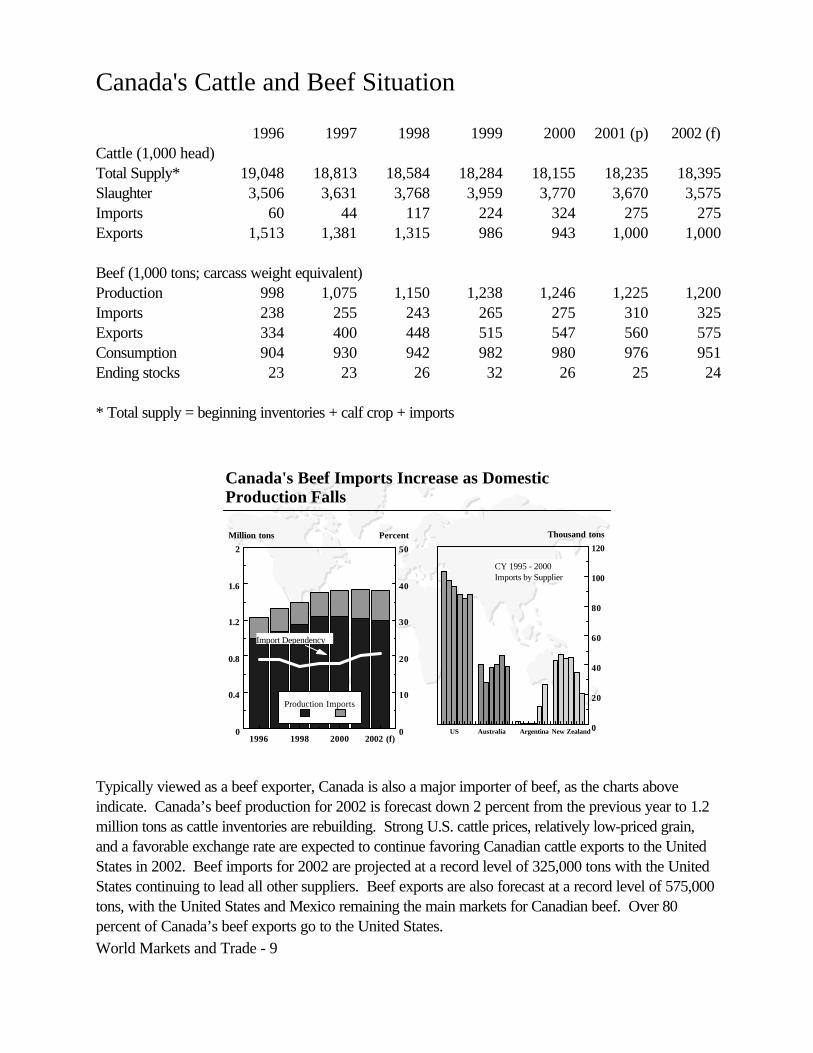
Canada's Cattle and Beef Situation
1996 1997 1998 1999 2000 2001 (p) 2002 (f)Cattle (1,000 head)Total Supply* 19,048 18,813 18,584 18,284 18,155 18,235 18,395Slaughter 3,506 3,631 3,768 3,959 3,770 3,670 3,575Imports 60 44 117 224 324 275 275Exports 1,513 1,381 1,315 986 943 1,000 1,000
Beef (1,000 tons; carcass weight equivalent)Production 998 1,075 1,150 1,238 1,246 1,225 1,200Imports 238 255 243 265 275 310 325Exports 334 400 448 515 547 560 575Consumption 904 930 942 982 980 976 951Ending stocks 23 23 26 32 26 25 24
* Total supply = beginning inventories + calf crop + imports
Typically viewed as a beef exporter, Canada is also a major importer of beef, as the charts aboveindicate. Canada’s beef production for 2002 is forecast down 2 percent from the previous year to 1.2million tons as cattle inventories are rebuilding. Strong U.S. cattle prices, relatively low-priced grain,and a favorable exchange rate are expected to continue favoring Canadian cattle exports to the UnitedStates in 2002. Beef imports for 2002 are projected at a record level of 325,000 tons with the UnitedStates continuing to lead all other suppliers. Beef exports are also forecast at a record level of 575,000tons, with the United States and Mexico remaining the main markets for Canadian beef. Over 80percent of Canada’s beef exports go to the United States.
Canada's Beef Imports Increase as Domestic Production Falls
US Australia Argentina New Zealand0
20
40
60
80
100
120
Thousand tons
1996 1998 2000 2002 (f)0
0.4
0.8
1.2
1.6
2
0
10
20
30
40
50
Million tons Percent
Production Imports
Import Dependency
CY 1995 - 2000 Imports by Supplier
World Markets and Trade - 10
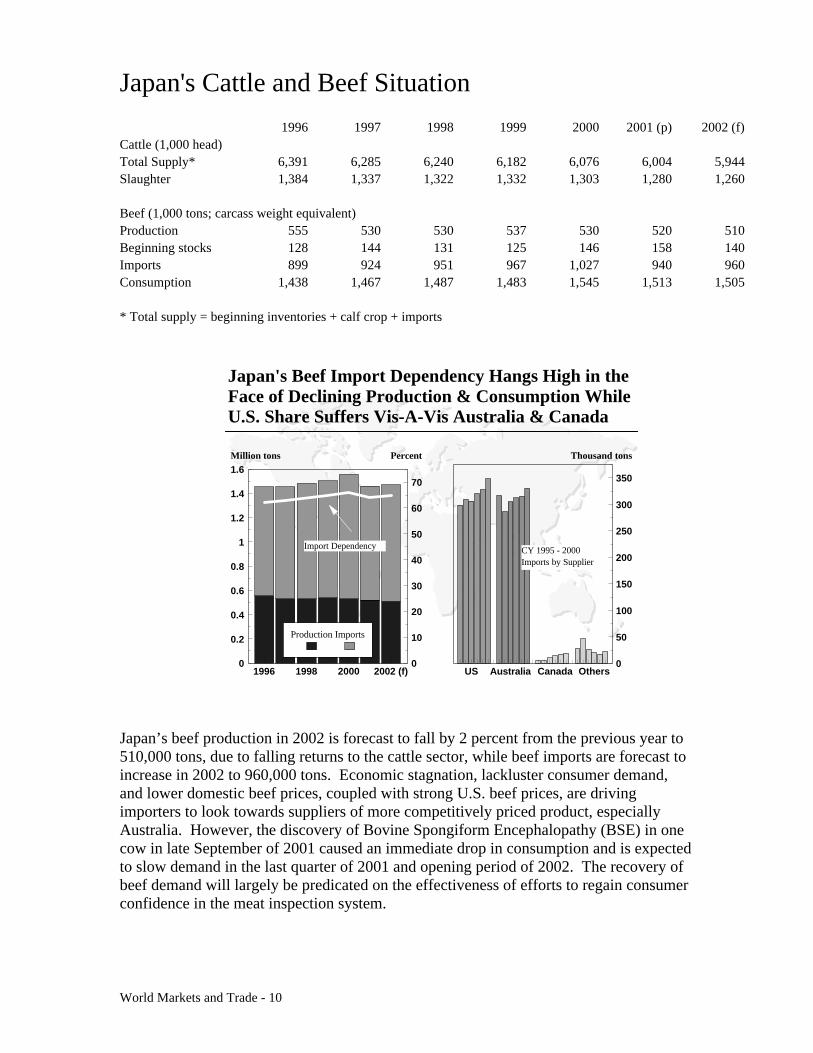
Japan's Cattle and Beef Situation
1996 1997 1998 1999 2000 2001 (p) 2002 (f)Cattle (1,000 head)Total Supply* 6,391 6,285 6,240 6,182 6,076 6,004 5,944Slaughter 1,384 1,337 1,322 1,332 1,303 1,280 1,260
Beef (1,000 tons; carcass weight equivalent)Production 555 530 530 537 530 520 510Beginning stocks 128 144 131 125 146 158 140Imports 899 924 951 967 1,027 940 960Consumption 1,438 1,467 1,487 1,483 1,545 1,513 1,505
* Total supply = beginning inventories + calf crop + imports
Japan’s beef production in 2002 is forecast to fall by 2 percent from the previous year to510,000 tons, due to falling returns to the cattle sector, while beef imports are forecast toincrease in 2002 to 960,000 tons. Economic stagnation, lackluster consumer demand,and lower domestic beef prices, coupled with strong U.S. beef prices, are drivingimporters to look towards suppliers of more competitively priced product, especiallyAustralia. However, the discovery of Bovine Spongiform Encephalopathy (BSE) in onecow in late September of 2001 caused an immediate drop in consumption and is expectedto slow demand in the last quarter of 2001 and opening period of 2002. The recovery ofbeef demand will largely be predicated on the effectiveness of efforts to regain consumerconfidence in the meat inspection system.
Japan's Beef Import Dependency Hangs High in the Face of Declining Production & Consumption While U.S. Share Suffers Vis-A-Vis Australia & Canada
1996 1998 2000 2002 (f)0
0.2
0.4
0.6
0.8
1
1.2
1.4
1.6
0
10
20
30
40
50
60
70
Million tons Percent
Production Imports
US Australia Canada Others0
50
100
150
200
250
300
350
Thousand tons
CY 1995 - 2000 Imports by Supplier
Import Dependency
World Markets and Trade - 11
Korea's Cattle and Beef Situation
1996 1997 1998 1999 2000 2001 (p) 2002 (f)Cattle (1,000) headTotal Supply* 4,258 4,417 4,229 3,593 3,144 2,800 2,615Slaughter 850 1,125 1,282 1,095 998 755 610
Beef (1,000 tons; carcass weight equivalent)Production 236 310 348 305 278 210 170Beginning stocks 7 5 33 61 66 79 40Imports 191 198 107 210 280 230 250Consumption 429 480 427 510 545 479 430
* Total supply = beginning inventories + calf crop + imports
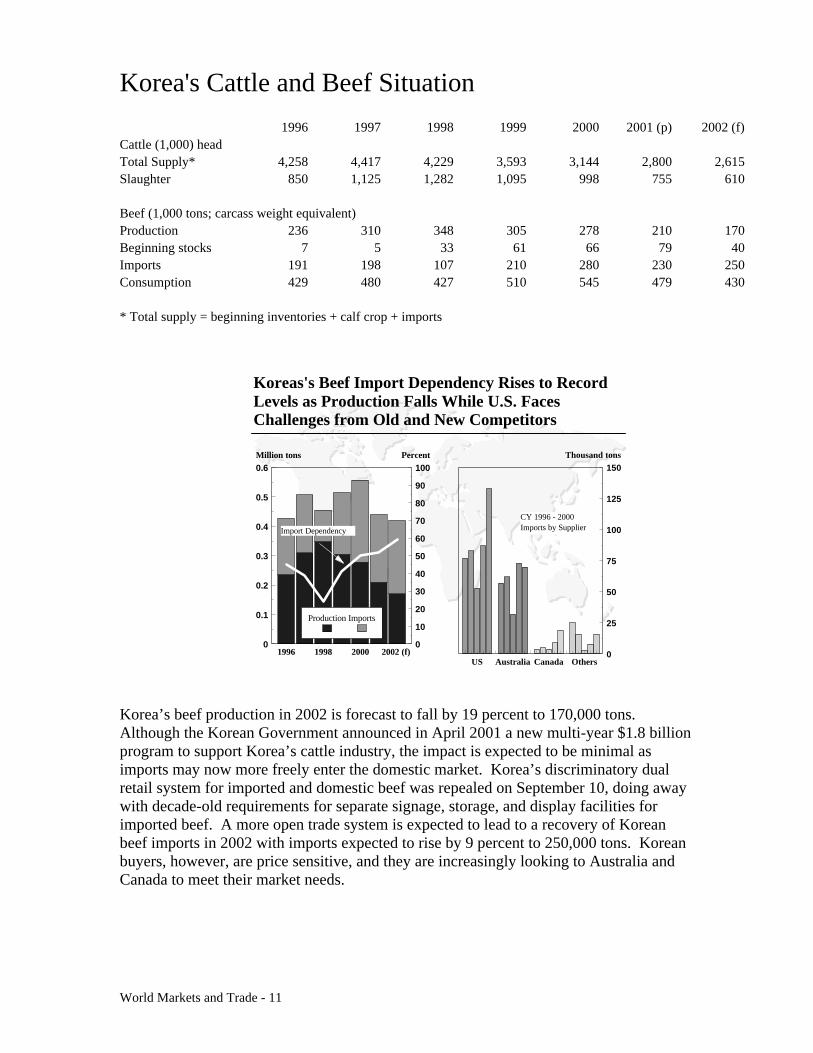
Korea’s beef production in 2002 is forecast to fall by 19 percent to 170,000 tons.Although the Korean Government announced in April 2001 a new multi-year $1.8 billionprogram to support Korea’s cattle industry, the impact is expected to be minimal asimports may now more freely enter the domestic market. Korea’s discriminatory dualretail system for imported and domestic beef was repealed on September 10, doing awaywith decade-old requirements for separate signage, storage, and display facilities forimported beef. A more open trade system is expected to lead to a recovery of Koreanbeef imports in 2002 with imports expected to rise by 9 percent to 250,000 tons. Koreanbuyers, however, are price sensitive, and they are increasingly looking to Australia andCanada to meet their market needs.
Koreas's Beef Import Dependency Rises to Record Levels as Production Falls While U.S. Faces Challenges from Old and New Competitors
1996 1998 2000 2002 (f) 0
0.1
0.2
0.3
0.4
0.5
0.6
0
10
20
30
40
50
60
70
80
90
100Million tons Percent
Production Imports
US Australia Canada Others0
25
50
75
100
125
150Thousand tons
CY 1996 - 2000 Imports by SupplierImport Dependency
World Markets and Trade - 12
Mexico's Cattle and Beef Situation
1996 1997 1998 1999 2000 2001 (p) 2002 (f)Cattle (1,000 head)Total Supply* 36,262 35,182 34,210 33,551 32,550 31,496 30,296Slaughter 8,180 8,200 8,000 8,150 8,200 8,300 8,310Imports 122 260 182 192 235 195 200Exports 460 670 721 970 1,224 1,280 1,300
Beef (1,000 tons; carcass weight equivalent)Production 1,800 1,795 1,800 1,900 1,900 1,925 1,930Imports 105 203 307 358 420 430 440Consumption 1,898 1,992 2,101 2,250 2,309 2,347 2,362
* Total supply = beginning inventories + calf crop + imports
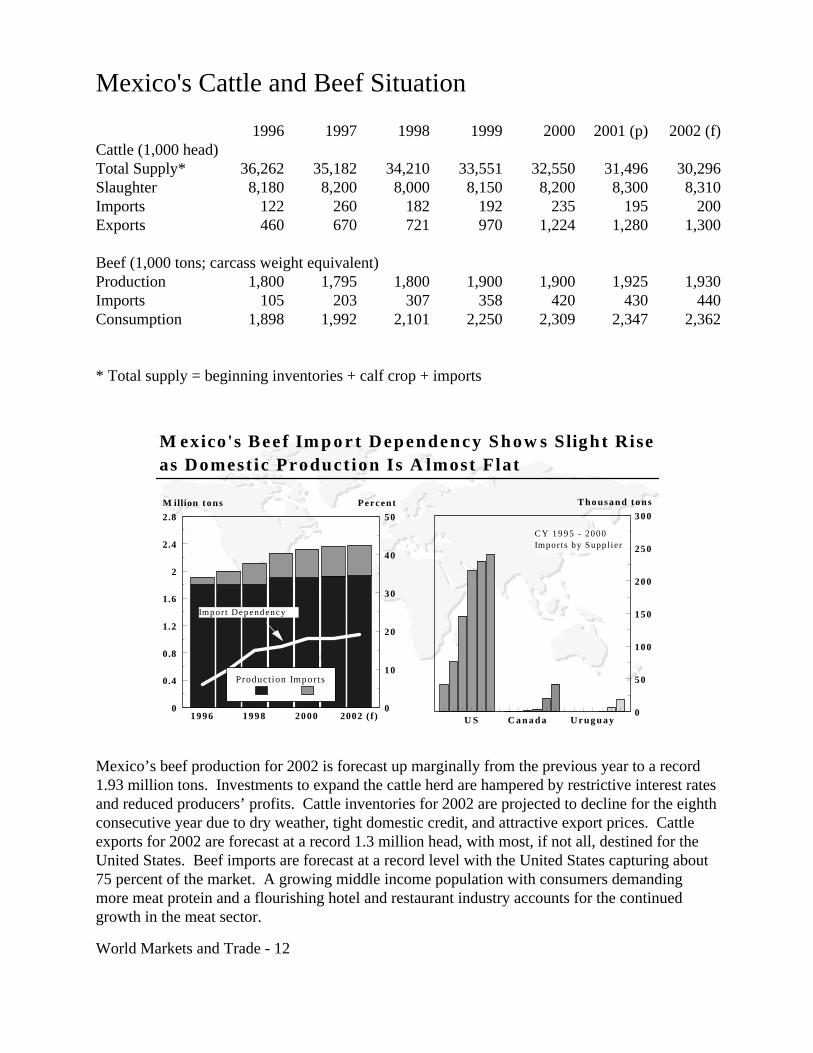
Mexico’s beef production for 2002 is forecast up marginally from the previous year to a record1.93 million tons. Investments to expand the cattle herd are hampered by restrictive interest ratesand reduced producers’ profits. Cattle inventories for 2002 are projected to decline for the eighthconsecutive year due to dry weather, tight domestic credit, and attractive export prices. Cattleexports for 2002 are forecast at a record 1.3 million head, with most, if not all, destined for theUnited States. Beef imports are forecast at a record level with the United States capturing about75 percent of the market. A growing middle income population with consumers demandingmore meat protein and a flourishing hotel and restaurant industry accounts for the continuedgrowth in the meat sector.
M exico's Bee f Im p o r t Dependency Show s Slight Riseas Domest ic Product ion Is A lmost Flat
U S C a n a d a U r u g u a y0
50
100
150
200
250
300
Thousand tons
1996 1998 2000 2002 (f)0
0.4
0.8
1.2
1.6
2
2.4
2.8
0
10
20
30
40
50
M illion tons Percent
Production Imports
Impor t Dependency
C Y 1 9 9 5 - 2000 Impor ts by Suppl ier
World Markets and Trade - 13
Russia's Cattle and Beef Situation
1996 1997 1998 1999 2000 2001 (p) 2002 (f)Cattle (1,000 head)Total Supply* 53,525 47,114 41,954 38,804 36,704 35,004 34,634Slaughter 15,315 13,500 12,300 10,860 10,515 9,200 9,100
Beef (1,000 tons; carcass weight equivalent)Production 2,570 2,326 2,090 1,900 1,840 1,700 1,675Beginning stocks 203 180 75 0 0 0 0Imports 704 968 703 745 496 600 650Exports 5 16 7 3 7 8 8Consumption 3,292 3,383 2,861 2,642 2,329 2,292 2,317
* Total supply = beginning inventories + calf crop + imports
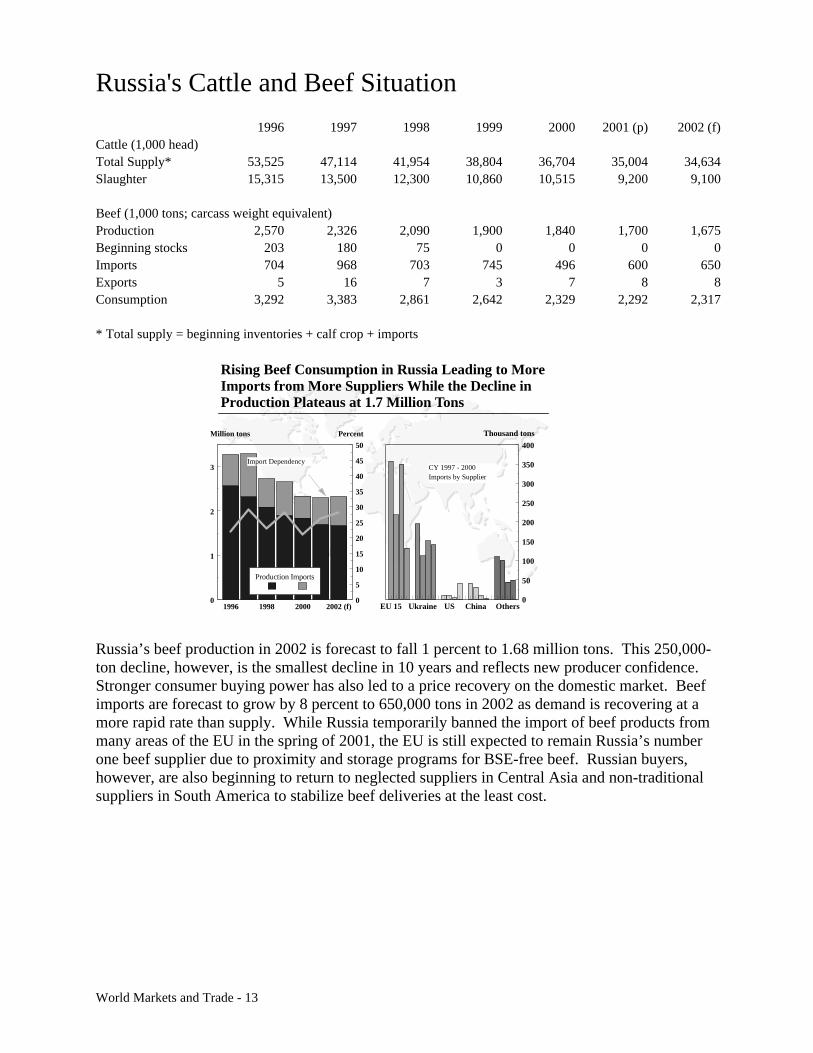
Russia’s beef production in 2002 is forecast to fall 1 percent to 1.68 million tons. This 250,000-ton decline, however, is the smallest decline in 10 years and reflects new producer confidence.Stronger consumer buying power has also led to a price recovery on the domestic market. Beefimports are forecast to grow by 8 percent to 650,000 tons in 2002 as demand is recovering at amore rapid rate than supply. While Russia temporarily banned the import of beef products frommany areas of the EU in the spring of 2001, the EU is still expected to remain Russia’s numberone beef supplier due to proximity and storage programs for BSE-free beef. Russian buyers,however, are also beginning to return to neglected suppliers in Central Asia and non-traditionalsuppliers in South America to stabilize beef deliveries at the least cost.
Rising Beef Consumption in Russia Leading to More Imports from More Suppliers While the Decline in Production Plateaus at 1.7 Million Tons
1996 1998 2000 2002 (f)0
1
2
3
0
5
10
15
20
25
30
35
40
45
50
Million tons Percent
Production Imports
EU 15 Ukraine US China Others0
50
100
150
200
250
300
350
400
Thousand tons
CY 1997 - 2000 Imports by Supplier
Import Dependency
PORK SUMMARYSelected Countries
1,000 METIC TONS---Carcass Weight Equivalent---
1997 1998 1999 2000 2001(p) 2002(f)PRODUCTIONUnited States 7,835 8,623 8,758 8,596 8,545 8,689Canada 1,257 1,337 1,561 1,636 1,720 1,750Mexico 940 950 994 1,035 1,065 1,085Brazil 1,540 1,690 1,835 1,970 2,117 2,240European Union * 15,906 17,248 17,914 17,585 17,419 17,800Hungary 485 408 500 470 470 480Poland 1,540 1,650 1,675 1,635 1,530 1,575Russian Federation 1,570 1,510 1,490 1,500 1,515 1,535China; Peoples Republic of 35,963 38,837 40,056 40,314 42,400 43,200Taiwan 1,030 892 822 921 910 890Japan 1,283 1,285 1,277 1,269 1,250 1,245Other Countries 4,374 4,472 4,396 4,341 4,279 4,439TOTAL 73,723 78,902 81,278 81,272 83,220 84,928
IMPORTSUnited States 287 319 375 439 415 435Canada 59 64 65 68 75 85Mexico 82 144 190 276 300 310Brazil 6 1 1 1 1 0European Union * 61 39 52 54 60 65Poland 41 72 54 48 33 45Romania 0 29 20 20 30 30Russian Federation 820 725 800 470 600 630Hong Kong 188 252 260 300 335 360Japan 786 777 919 995 920 945Korea; Republic of 77 66 156 173 120 140Taiwan 0 22 86 54 30 40Other Countries 104 139 191 322 248 235TOTAL 2,511 2,649 3,169 3,220 3,167 3,320
EXPORTSUnited States 474 558 580 592 699 649Canada 416 432 631 656 710 730Brazil 83 103 112 163 240 290European Union * 972 1,002 1,388 1,470 1,220 1,320Hungary 133 104 114 120 120 125Poland 284 232 241 164 110 130Romania 55 6 5 1 0 0China; Peoples Republic of 158 143 75 73 110 145Taiwan 70 3 0 0 0 0Other Countries 190 258 269 218 309 373TOTAL 2,835 2,841 3,415 3,457 3,518 3,762
CONSUMPTIONUnited States 7,629 8,304 8,596 8,449 8,274 8,453Canada 893 955 997 1,047 1,083 1,108Mexico 983 1,045 1,131 1,252 1,305 1,335Brazil 1,468 1,583 1,724 1,811 1,870 1,950European Union * 14,782 15,603 16,060 16,168 16,299 16,542Hungary 378 355 401 375 380 380Poland 1,334 1,448 1,490 1,548 1,457 1,487Romania 295 341 340 309 307 305Russian Federation 2,389 2,234 2,289 1,969 2,114 2,164China; Peoples Republic of 35,808 38,718 40,057 40,418 42,410 43,195Taiwan 860 971 948 975 940 930Japan 2,134 2,146 2,212 2,234 2,185 2,200Korea; Republic of 870 940 984 1,058 1,124 1,160Philippines 905 940 993 1,026 1,075 1,105Other Countries 2,452 2,457 2,441 2,340 2,126 2,180TOTAL 73,180 78,040 80,663 80,979 82,949 84,494
SOURCE: FAS post reports, official statistics, and inter-agency analysis. Foreign Agricultural ServiceCommodity and Marketing Programs
* EU: pre-2000 are partial EU data based on summation of reporting contries; 2000 and later is total EU-15.(p) preliminary (f) forecast Dairy, Livestock, and Poultry Division
World Markets and Trade - 14
World Markets and Trade - 15
Pork Export Overview
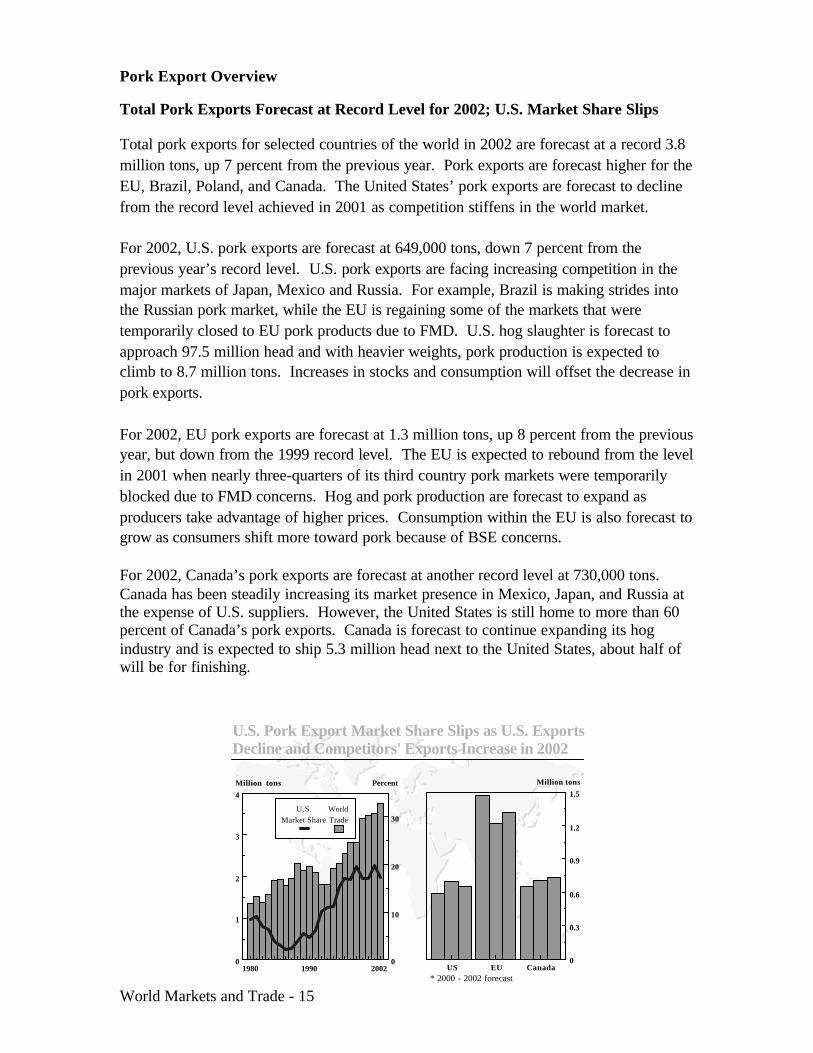
Total Pork Exports Forecast at Record Level for 2002; U.S. Market Share Slips
Total pork exports for selected countries of the world in 2002 are forecast at a record 3.8million tons, up 7 percent from the previous year. Pork exports are forecast higher for theEU, Brazil, Poland, and Canada. The United States’ pork exports are forecast to declinefrom the record level achieved in 2001 as competition stiffens in the world market.
For 2002, U.S. pork exports are forecast at 649,000 tons, down 7 percent from theprevious year’s record level. U.S. pork exports are facing increasing competition in themajor markets of Japan, Mexico and Russia. For example, Brazil is making strides intothe Russian pork market, while the EU is regaining some of the markets that weretemporarily closed to EU pork products due to FMD. U.S. hog slaughter is forecast toapproach 97.5 million head and with heavier weights, pork production is expected toclimb to 8.7 million tons. Increases in stocks and consumption will offset the decrease inpork exports.
For 2002, EU pork exports are forecast at 1.3 million tons, up 8 percent from the previousyear, but down from the 1999 record level. The EU is expected to rebound from the levelin 2001 when nearly three-quarters of its third country pork markets were temporarilyblocked due to FMD concerns. Hog and pork production are forecast to expand asproducers take advantage of higher prices. Consumption within the EU is also forecast togrow as consumers shift more toward pork because of BSE concerns.
For 2002, Canada’s pork exports are forecast at another record level at 730,000 tons.Canada has been steadily increasing its market presence in Mexico, Japan, and Russia atthe expense of U.S. suppliers. However, the United States is still home to more than 60percent of Canada’s pork exports. Canada is forecast to continue expanding its hogindustry and is expected to ship 5.3 million head next to the United States, about half ofwill be for finishing.
U.S. Pork Export Market Share Slips as U.S. Exports Decline and Competitors' Exports Increase in 2002
US EU Canada0
0.3
0.6
0.9
1.2
1.5
Million tons
1980 1990 20020
1
2
3
4
0
10
20
30
Million tons Percent
U.S.Market Share
WorldTrade
* 2000 - 2002 forecast
World Markets and Trade - 16
Hong Kong's Pork Situation
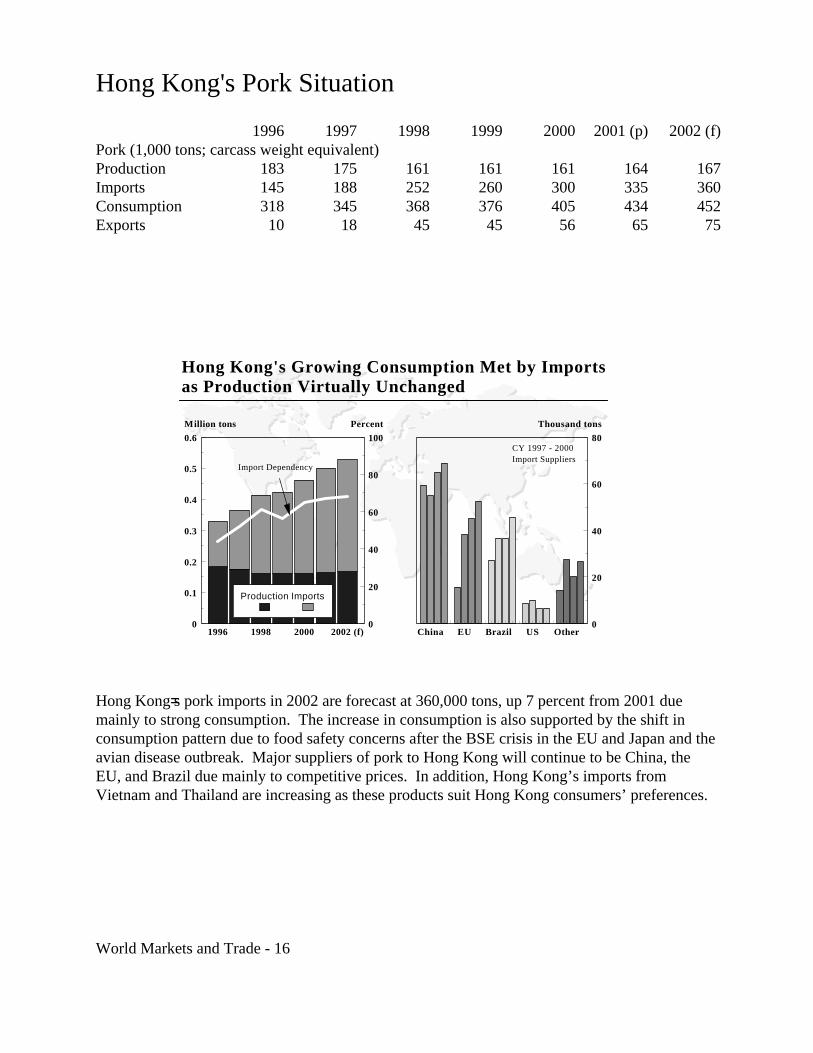
1996 1997 1998 1999 2000 2001 (p) 2002 (f)Pork (1,000 tons; carcass weight equivalent)Production 183 175 161 161 161 164 167Imports 145 188 252 260 300 335 360Consumption 318 345 368 376 405 434 452Exports 10 18 45 45 56 65 75
Hong Kong=s pork imports in 2002 are forecast at 360,000 tons, up 7 percent from 2001 duemainly to strong consumption. The increase in consumption is also supported by the shift inconsumption pattern due to food safety concerns after the BSE crisis in the EU and Japan and theavian disease outbreak. Major suppliers of pork to Hong Kong will continue to be China, theEU, and Brazil due mainly to competitive prices. In addition, Hong Kong’s imports fromVietnam and Thailand are increasing as these products suit Hong Kong consumers’ preferences.
Hong Kong's Growing Consumption Met by Imports as Production Virtually Unchanged
1996 1998 2000 2002 (f)0
0.1
0.2
0.3
0.4
0.5
0.6
0
20
40
60
80
100
Million tons Percent
Production Imports
China EU Brazil US Other0
20
40
60
80
Thousand tons
CY 1997 - 2000 Import Suppliers
Import Dependency

World Markets and Trade - 17
Japan's Swine and Pork Situation
1996 1997 1998 1999 2000 2001 (p) 2002 (f)Swine (1,000 head)Total Supply* 27,501 27,674 27,755 27,480 27,306 27,086 26,951Slaughter 16,852 17,021 17,067 16,871 16,717 16,530 16,500
Pork (1,000 tons; carcass weight equivalent)Production 1,266 1,283 1,285 1,277 1,269 1,250 1,245Imports 1,010 786 777 919 995 920 945Consumption 2,119 2,134 2,146 2,212 2,234 2,185 2,200Exports 0 0 0 0 0 0 0Ending stocks 255 190 106 90 120 105 95
* Total supply = beginning inventories + pig crop + imports
Japan=s pork imports in 2002 are forecast at 945,000 tons, up nearly 3 percent from 2001, asproduction stagnates while consumption moves upward. The increase in imports will likely beseen in the second quarter of 2002 after the current safeguard measure ends in March 2002. Japanese ham and sausage manufacturers are likely to increase pork imports as they secure stockswhen the gate price reverts from 653 yen/kg to 524 yen/kg in April 2002. The United States isexpected to remain the major supplier of fresh/chilled pork to Japan, while the EU mainlysupplies frozen cuts. The impact of the safeguard on pork prices has reportedly been minimal inthe Japanese market due mainly to stiff competition in the HRI sector. However, concerns overBSE have recently caused pork prices to soar.
Japan's Pork Consumption Met Through Growing Imports as Production Stagnates
1996 1998 2000 2002 (f)0
0.5
1
1.5
2
2.5
0
10
20
30
40
50
Million tons Percent
Production Imports
US EU Canada Other0
50
100
150
200
250
300
Thousand tons
CY 1995 - 2000 Import Suppliers
Import Dependency
World Markets and Trade - 18
Korea's Swine and Pork Situation
1996 1997 1998 1999 2000 2001 (p) 2002 (f)Swine (1,000 head)Total Supply* 17,500 18,204 16,522 19,755 20,843 21,801 22,257Slaughter 10,794 10,918 12,631 12,565 13,293 13,955 14,300
Pork (1,000 tons; carcass weight equivalent)Production 865 873 992 950 1,004 1,054 1,080Imports 50 77 66 156 173 120 140Consumption 872 870 940 984 1,058 1,124 1,160Exports 46 67 116 113 30 55 100Ending stocks 7 20 22 31 120 115 75
* Total supply = beginning inventories + pig crop + imports
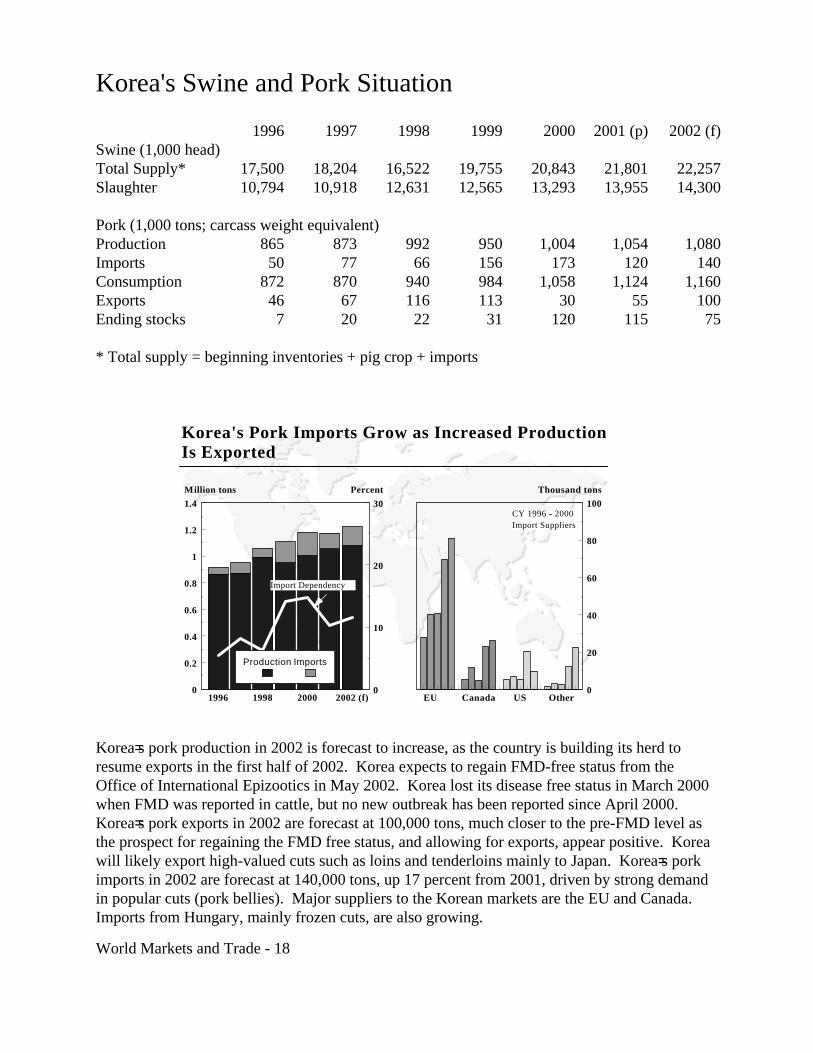
Korea=s pork production in 2002 is forecast to increase, as the country is building its herd toresume exports in the first half of 2002. Korea expects to regain FMD-free status from theOffice of International Epizootics in May 2002. Korea lost its disease free status in March 2000when FMD was reported in cattle, but no new outbreak has been reported since April 2000. Korea=s pork exports in 2002 are forecast at 100,000 tons, much closer to the pre-FMD level asthe prospect for regaining the FMD free status, and allowing for exports, appear positive. Koreawill likely export high-valued cuts such as loins and tenderloins mainly to Japan. Korea=s porkimports in 2002 are forecast at 140,000 tons, up 17 percent from 2001, driven by strong demandin popular cuts (pork bellies). Major suppliers to the Korean markets are the EU and Canada. Imports from Hungary, mainly frozen cuts, are also growing.
Korea's Pork Imports Grow as Increased Production Is Exported
1996 1998 2000 2002 (f)0
0.2
0.4
0.6
0.8
1
1.2
1.4
0
10
20
30
Million tons Percent
Production Imports
EU Canada US Other0
20
40
60
80
100
Thousand tons
CY 1996 - 2000 Import Suppliers
Import Dependency
World Markets and Trade - 19
Mexico's Swine and Pork Situation
1996 1997 1998 1999 2000 2001 (p) 2002 (f)Swine (1,000 head)Total Supply* 24,703 24,777 25,465 25,862 25,754 25,784 25,804Slaughter 12,453 12,770 13,105 13,575 13,615 13,765 13,840
Pork (1,000 tons; carcass weight equivalent)Production 895 940 950 994 1,035 1,065 1,085Imports 59 82 144 190 276 300 310Consumption 928 983 1,045 1,131 1,252 1,305 1,335Exports 26 39 49 53 59 60 60Ending stocks 0 0 0 0 0 0 0
* Total supply = beginning inventories + pig crop + imports
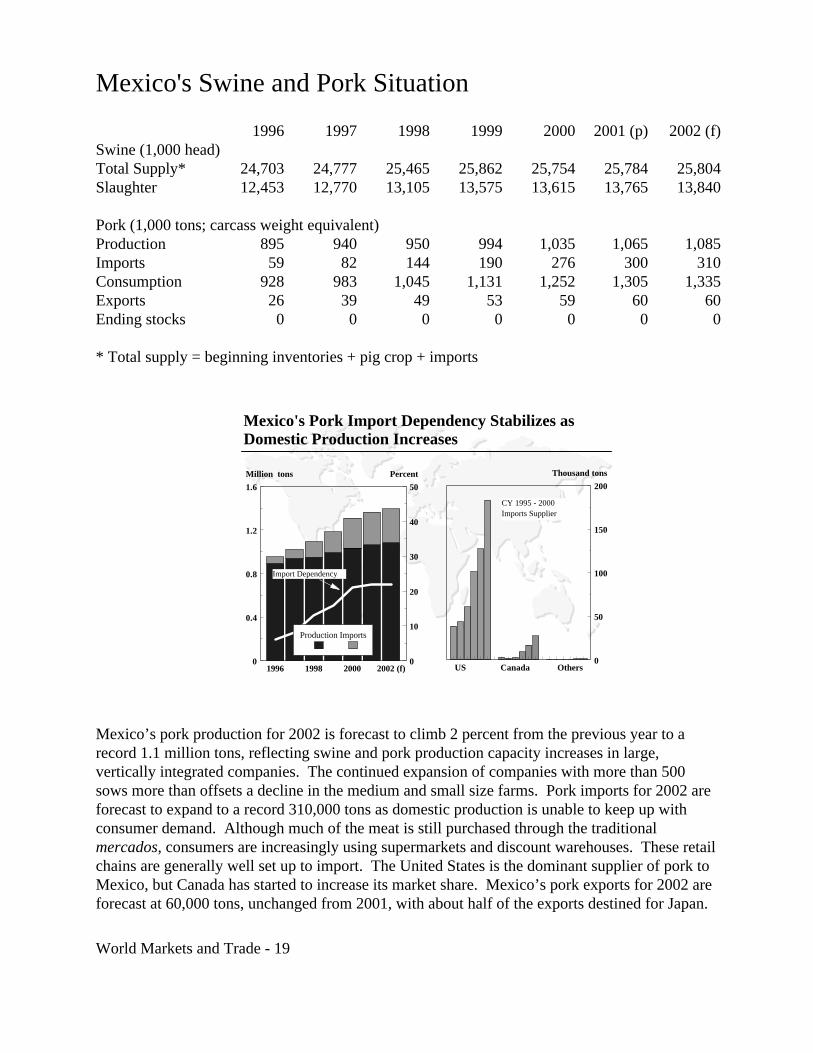
Mexico’s pork production for 2002 is forecast to climb 2 percent from the previous year to arecord 1.1 million tons, reflecting swine and pork production capacity increases in large,vertically integrated companies. The continued expansion of companies with more than 500sows more than offsets a decline in the medium and small size farms. Pork imports for 2002 areforecast to expand to a record 310,000 tons as domestic production is unable to keep up withconsumer demand. Although much of the meat is still purchased through the traditionalmercados, consumers are increasingly using supermarkets and discount warehouses. These retailchains are generally well set up to import. The United States is the dominant supplier of pork toMexico, but Canada has started to increase its market share. Mexico’s pork exports for 2002 areforecast at 60,000 tons, unchanged from 2001, with about half of the exports destined for Japan.
Mexico's Pork Import Dependency Stabilizes as Domestic Production Increases
US Canada Others0
50
100
150
200
Thousand tons
1996 1998 2000 2002 (f)0
0.4
0.8
1.2
1.6
0
10
20
30
40
50
Million tons Percent
Production Imports
Import Dependency
CY 1995 - 2000 Imports Supplier
World Markets and Trade - 20
Russia's Swine and Pork Situation
1996 1997 1998 1999 2000 2001 (p) 2002 (f)Swine (1,000 head)Total Supply* 51,971 49,910 47,614 47,135 46,835 46,865 47,105Slaughter 28,000 29,130 27,950 27,350 27,450 27,590 27,650
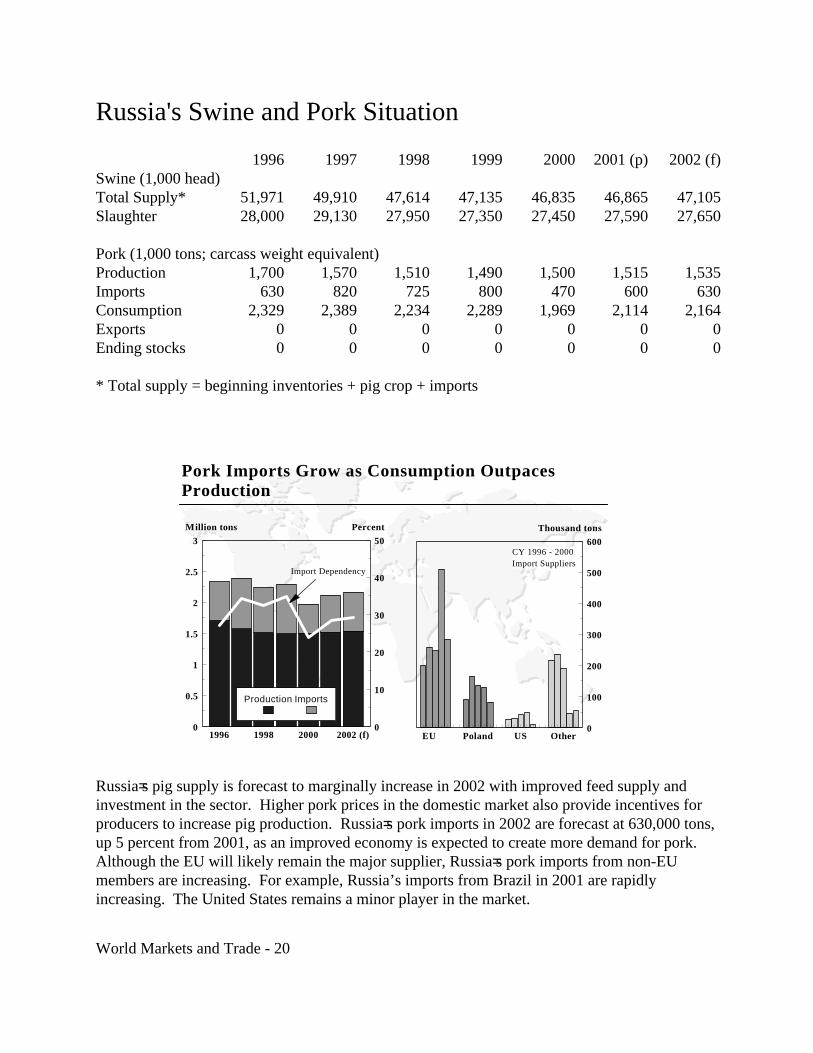
Pork (1,000 tons; carcass weight equivalent)Production 1,700 1,570 1,510 1,490 1,500 1,515 1,535Imports 630 820 725 800 470 600 630Consumption 2,329 2,389 2,234 2,289 1,969 2,114 2,164Exports 0 0 0 0 0 0 0Ending stocks 0 0 0 0 0 0 0
* Total supply = beginning inventories + pig crop + imports
Russia=s pig supply is forecast to marginally increase in 2002 with improved feed supply andinvestment in the sector. Higher pork prices in the domestic market also provide incentives forproducers to increase pig production. Russia=s pork imports in 2002 are forecast at 630,000 tons,up 5 percent from 2001, as an improved economy is expected to create more demand for pork. Although the EU will likely remain the major supplier, Russia=s pork imports from non-EUmembers are increasing. For example, Russia’s imports from Brazil in 2001 are rapidlyincreasing. The United States remains a minor player in the market.
Pork Imports Grow as Consumption Outpaces Production
1996 1998 2000 2002 (f)0
0.5
1
1.5
2
2.5
3
0
10
20
30
40
50
Million tons Percent
Production Imports
EU Poland US Other0
100
200
300
400
500
600
Thousand tons
CY 1996 - 2000 Import Suppliers
Import Dependency
POULTRY MEAT SUMMARYSelected Countries
1,000 Metric Tons---Ready to Cook Equivalent---
1997 1998 1999 2000 2001(p) 2002(f)PRODUCTION United States 14,952 15,128 15,990 16,362 16,611 17,048 Canada 916 962 1,012 1,053 1,085 1,102 Mexico 1,615 1,710 1,922 2,082 2,139 2,205 Brazil 4,562 4,627 5,641 6,117 6,445 6,835 Argentina 780 875 910 895 895 885 European Union * 8,177 8,489 8,444 8,394 8,599 8,850 Russian Federation 630 640 640 660 700 750 China, (PRC) # 10,400 10,700 11,150 11,960 12,285 12,545 Japan 1,234 1,221 1,189 1,196 1,180 1,185 India 630 665 690 710 735 755 Thailand 955 980 1,025 1,117 1,255 1,344 Other Countries 8,740 8,540 8,948 9,092 9,428 8,859TOTAL 53,591 54,537 57,561 59,638 61,357 62,363
IMPORTS United States 3 3 3 4 5 5 Canada 128 136 134 154 150 157 Mexico 210 295 312 357 375 405 European Union * 265 246 263 307 317 350 Russian Federation 1,444 1,165 1,080 1,151 1,300 1,325 Saudi Arabia 294 279 372 346 400 425 United Arab Emirates 112 119 117 110 112 110 South Africa, Rep. of 110 87 98 93 80 85 China, (PRC) # 758 755 946 1,041 950 950 Hong Kong # 289 307 448 280 270 280 Japan 590 605 683 740 684 710 Other Countries 384 446 501 512 550 558TOTAL 4,587 4,443 4,957 5,095 5,193 5,360
EXPORTS United States 2,565 2,515 2,582 2,825 3,079 3,141 Canada 94 115 107 124 127 127 Brazil 665 633 802 949 1,215 1,580 European Union * 944 1,029 1,032 1,032 1,018 1,050 Hungary 109 125 114 108 110 105 China # 367 354 404 504 520 530 Hong Kong # 11 7 8 9 8 9 Thailand 199 285 278 336 380 418 Other Countries 191 262 239 220 259 240TOTAL 5,145 5,325 5,566 6,107 6,716 7,200
CONSUMPTION United States 12,366 12,620 13,395 13,546 13,588 13,870 Canada 952 983 1,045 1,078 1,110 1,133 Mexico 1,825 2,005 2,234 2,439 2,514 2,610 Brazil 3,897 3,994 4,689 5,148 5,254 5,365 European Union * 7,498 7,706 7,675 7,669 7,893 8,150 Russian Federation 2,059 1,794 1,714 1,806 1,993 2,067 Poland 496 541 553 560 590 620 China, (PRC) # 10,791 11,101 11,692 12,497 12,715 12,965 Hong Kong # 366 358 510 341 326 341 Japan 1,843 1,836 1,853 1,912 1,884 1,890 Republic of Korea 494 442 519 530 566 575 India 630 665 690 709 734 753 Indonesia 901 448 624 831 876 926 Thailand 748 697 738 774 875 926 Other Countries 8,159 8,522 8,834 8,752 8,896 8,228TOTAL 53,025 53,712 56,765 58,592 59,814 60,419
SOURCE: FAS post reports, official statistics, and inter-agency analysis. Foreign Agricultural ServiceCommodity and Marketing Programs
* EU: Revised data series based on consolidated production, supply and demand, see p. 5 for details.# Hong Kong & China data series has been revised to more accurately reflect actual demand and not just transshippments.(p) preliminary (f) forecast
World Markets and Trade - 21

World Markets and Trade - 22
Total Poultry Meat Export Overview
Total Poultry Exports Projected to Increase in 2002, but U.S. Market Share Shrinks asBrazil’s Expands
Total poultry exports for selected countries of the world are projected to reach 7.2 million tons in2002, up 7 percent from the previous year. Poultry exports are forecast higher for the U.S.,Thailand, China, the EU, and Brazil. U.S. poultry exports are projected to grow at a slower ratein 2002 than in previous years because of increased competition from Brazil, which is one of thelowest cost poultry producers in the world, and a strong U.S. dollar.
U.S. poultry exports in 2002 are forecast at 3.1 million tons, up 2 percent from 2001. In 2001,Brazil increased its poultry exports to the EU as EU consumption of beef fell in response to BSEand FMD. These EU import levels are projected to remain steady into 2002. Although theUnited States does not ship large amounts of poultry into the EU because of import barriers, thisincrease in Brazilian exports to the EU represents a loss in global U.S. market share. U.S.poultry exports also face increasing competition from Brazil in the Russian market, although thisis not seen as a threat to the strong U.S. position. Through June of 2001, Brazil shipped morethan 28,000 tons of chicken to Russia compared to 21,000 in calendar year 2000. Brazil’spoultry exports are projected to continue increasing in 2002 as a large Brazilian meat processorhas already established itself in Russia.
For 2002, Brazil’s poultry exports are forecast at about 1.6 million tons, up nearly 30 percentfrom the previous year. Brazil has significantly increased its exports in the first half of 2001 tothe EU, Russia, Africa, and the Middle East. Among these regions, the EU, Africa, and theMiddle East are markets to which the U.S. traditionally does not export large volumes of poultry;Brazil is projected to increase its market activities in these regions in 2002.
World Trade in Poultry Exports; U.S. Shows Less Growth Than Brazil
1980 1990 20020
1
2
3
4
5
6
7
8
9
0
9
18
27
36
45
54
63
72
81
90
99
Million tons Percent
U.S. Market
Share
World
Trade
* 2000 - 2002 forecastUS Brazil
0
1
2
3
Million tons
World Markets and Trade - 23
Canada’s Poultry Situation1996 1997 1998 1999 2000 2001 (p) 2002 (f)
Production 893 916 962 1012 1053 1085 1102Imports 115 128 136 134 154 150 157Consumption 921 952 983 1045 1078 1110 1133Exports 75 94 115 107 124 127 127(All data in thousand metric tons)
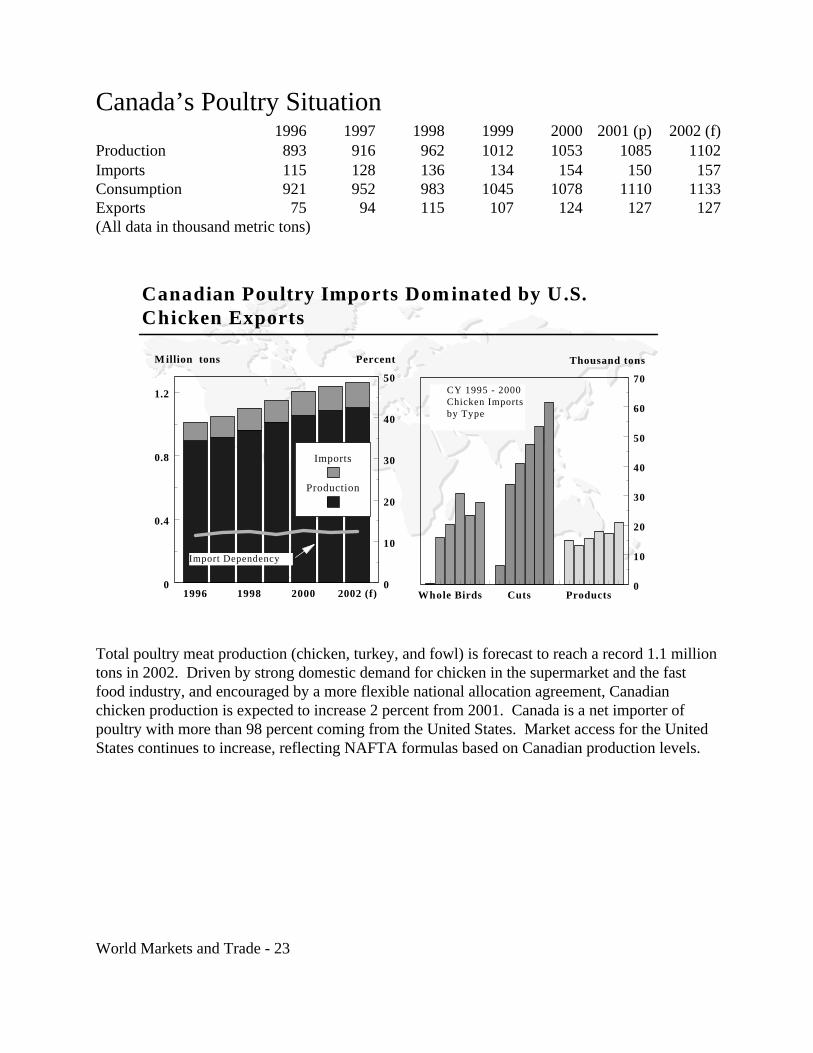
Total poultry meat production (chicken, turkey, and fowl) is forecast to reach a record 1.1 milliontons in 2002. Driven by strong domestic demand for chicken in the supermarket and the fastfood industry, and encouraged by a more flexible national allocation agreement, Canadianchicken production is expected to increase 2 percent from 2001. Canada is a net importer ofpoultry with more than 98 percent coming from the United States. Market access for the UnitedStates continues to increase, reflecting NAFTA formulas based on Canadian production levels.
Canadian Poultry Imports Dom inated by U.S. Chicken Exports
Whole Birds Cuts Products0
10
20
30
40
50
60
70
Thousand tons
1996 1998 2000 2002 (f)0
0.4
0.8
1.2
0
10
20
30
40
50
M illion tons Percent
Imports
Production
Import Dependency
CY 1995 - 2000 Chicken Imports by Type
World Markets and Trade - 24
China’s Poultry Situation1996 1997 1998 1999 2000 2001 (p) 2002 (f)
Production 9,630 10,400 10,700 11,150 11,960 12,285 12,545Imports 650 758 755 946 1041 950 950Consumption 9909 10791 11101 11692 12497 12715 12965Exports 371 367 354 404 504 520 530(All data in thousand metric tons)
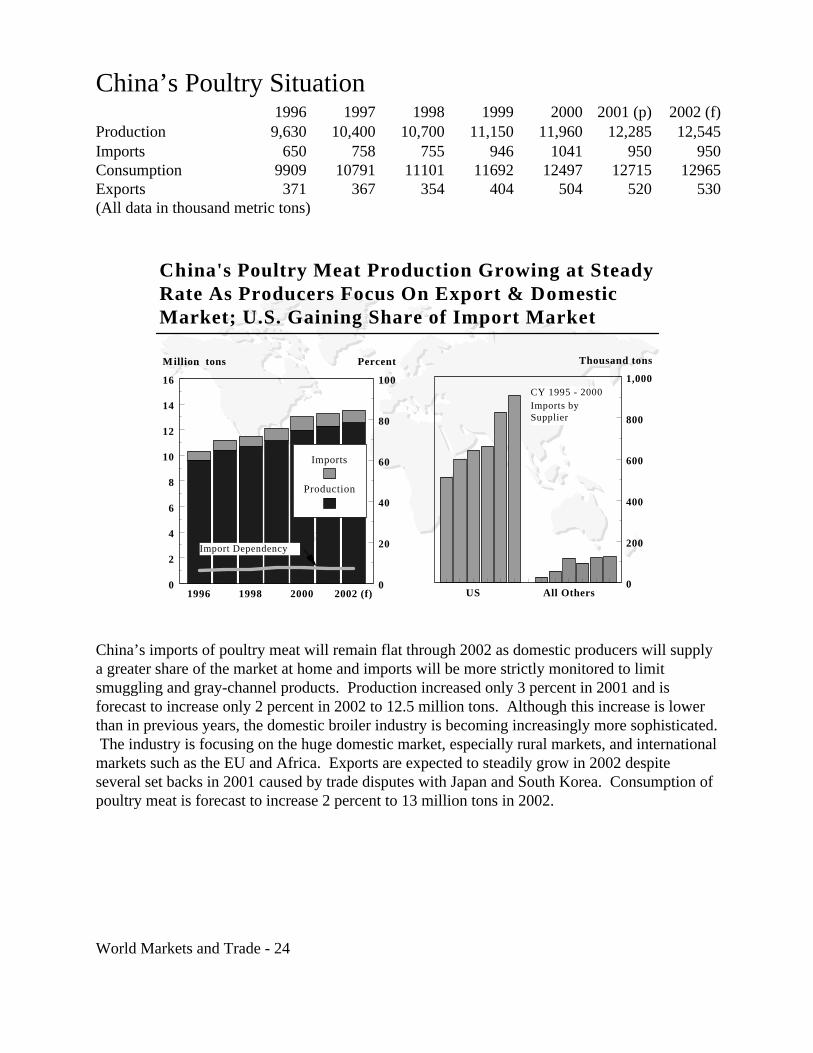
China’s imports of poultry meat will remain flat through 2002 as domestic producers will supplya greater share of the market at home and imports will be more strictly monitored to limitsmuggling and gray-channel products. Production increased only 3 percent in 2001 and isforecast to increase only 2 percent in 2002 to 12.5 million tons. Although this increase is lowerthan in previous years, the domestic broiler industry is becoming increasingly more sophisticated. The industry is focusing on the huge domestic market, especially rural markets, and internationalmarkets such as the EU and Africa. Exports are expected to steadily grow in 2002 despiteseveral set backs in 2001 caused by trade disputes with Japan and South Korea. Consumption ofpoultry meat is forecast to increase 2 percent to 13 million tons in 2002.
China's Poultry Meat Production Growing at Steady Rate As Producers Focus On Export & Domestic Market; U.S. Gaining Share of Import Market
US All Others0
200
400
600
800
1,000
Thousand tons
1996 1998 2000 2002 (f)0
2
4
6
8
10
12
14
16
0
20
40
60
80
100
Million tons Percent
Imports
Production
Import Dependency
CY 1995 - 2000 Imports by Supplier
World Markets and Trade - 25
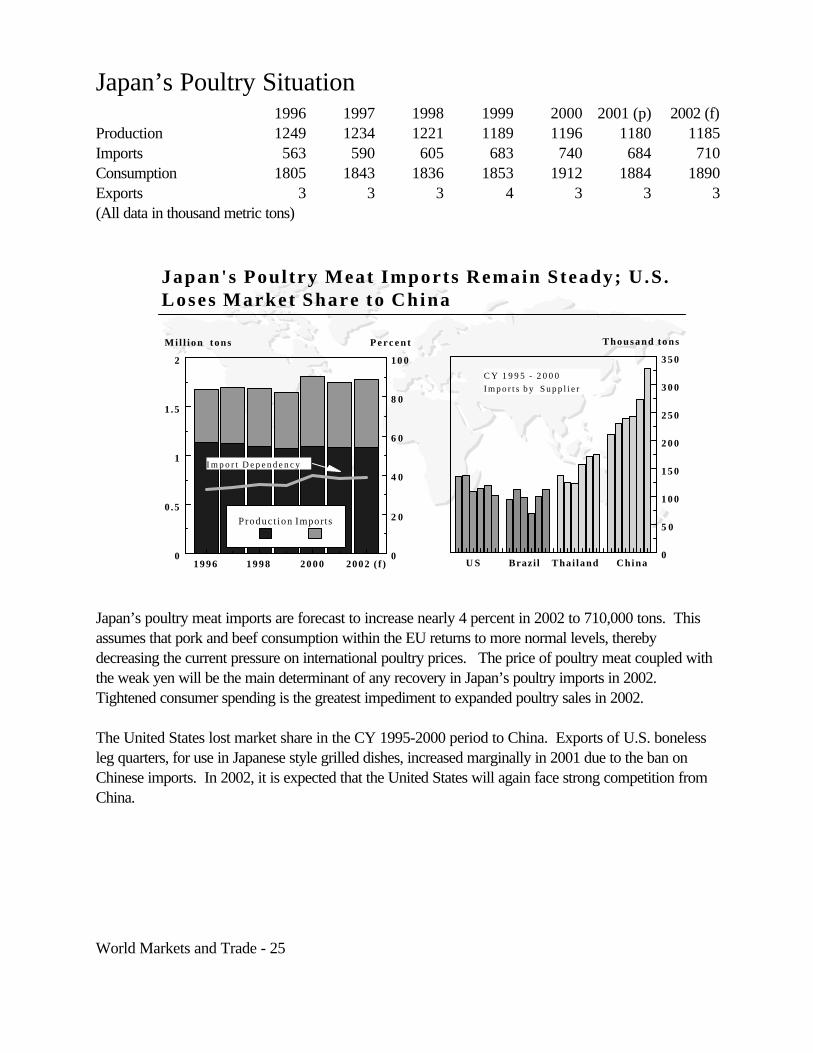
Japan’s Poultry Situation1996 1997 1998 1999 2000 2001 (p) 2002 (f)
Production 1249 1234 1221 1189 1196 1180 1185Imports 563 590 605 683 740 684 710Consumption 1805 1843 1836 1853 1912 1884 1890Exports 3 3 3 4 3 3 3(All data in thousand metric tons)
Japan’s poultry meat imports are forecast to increase nearly 4 percent in 2002 to 710,000 tons. Thisassumes that pork and beef consumption within the EU returns to more normal levels, therebydecreasing the current pressure on international poultry prices. The price of poultry meat coupled withthe weak yen will be the main determinant of any recovery in Japan’s poultry imports in 2002. Tightened consumer spending is the greatest impediment to expanded poultry sales in 2002.
The United States lost market share in the CY 1995-2000 period to China. Exports of U.S. bonelessleg quarters, for use in Japanese style grilled dishes, increased marginally in 2001 due to the ban onChinese imports. In 2002, it is expected that the United States will again face strong competition fromChina.
Japan's Poultry Meat Imports Remain Steady; U.S . Loses Market Share to China
U S Brazil Thai land China0
5 0
1 0 0
1 5 0
2 0 0
2 5 0
3 0 0
3 5 0
Thousand tons
1996 1998 2000 2002 ( f )0
0 .5
1
1 .5
2
0
2 0
4 0
6 0
8 0
1 0 0
Mi l l ion tons P e r c e n t
Product ion Imports
I m p o r t D e p e n d e n c y
C Y 1 9 9 5 - 2 0 0 0
I m p o r t s b y S u p p l i e r
World Markets and Trade - 26
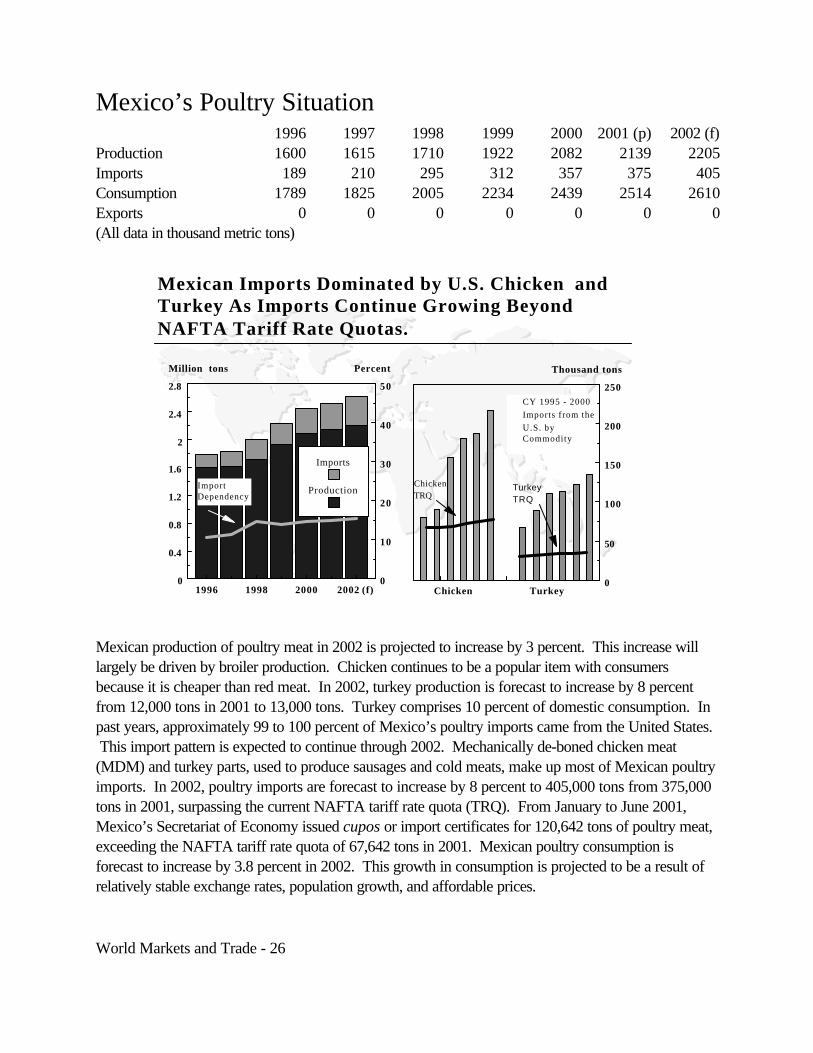
Mexico’s Poultry Situation1996 1997 1998 1999 2000 2001 (p) 2002 (f)
Production 1600 1615 1710 1922 2082 2139 2205Imports 189 210 295 312 357 375 405Consumption 1789 1825 2005 2234 2439 2514 2610Exports 0 0 0 0 0 0 0(All data in thousand metric tons)
Mexican production of poultry meat in 2002 is projected to increase by 3 percent. This increase willlargely be driven by broiler production. Chicken continues to be a popular item with consumersbecause it is cheaper than red meat. In 2002, turkey production is forecast to increase by 8 percentfrom 12,000 tons in 2001 to 13,000 tons. Turkey comprises 10 percent of domestic consumption. Inpast years, approximately 99 to 100 percent of Mexico’s poultry imports came from the United States. This import pattern is expected to continue through 2002. Mechanically de-boned chicken meat(MDM) and turkey parts, used to produce sausages and cold meats, make up most of Mexican poultryimports. In 2002, poultry imports are forecast to increase by 8 percent to 405,000 tons from 375,000tons in 2001, surpassing the current NAFTA tariff rate quota (TRQ). From January to June 2001,Mexico’s Secretariat of Economy issued cupos or import certificates for 120,642 tons of poultry meat,exceeding the NAFTA tariff rate quota of 67,642 tons in 2001. Mexican poultry consumption isforecast to increase by 3.8 percent in 2002. This growth in consumption is projected to be a result ofrelatively stable exchange rates, population growth, and affordable prices.
Mexican Imports Dominated by U.S. Chicken and Turkey As Imports Continue Growing Beyond NAFTA Tariff Rate Quotas.
Chicken Turkey0
50
100
150
200
250
Thousand tons
1996 1998 2000 2002 (f)0
0.4
0.8
1.2
1.6
2
2.4
2.8
0
10
20
30
40
50
Million tons Percent
Imports
ProductionImport Dependency
CY 1995 - 2000
Imports from the
U.S. by Commodity
ChickenTRQ
TurkeyTRQ
World Markets and Trade - 27
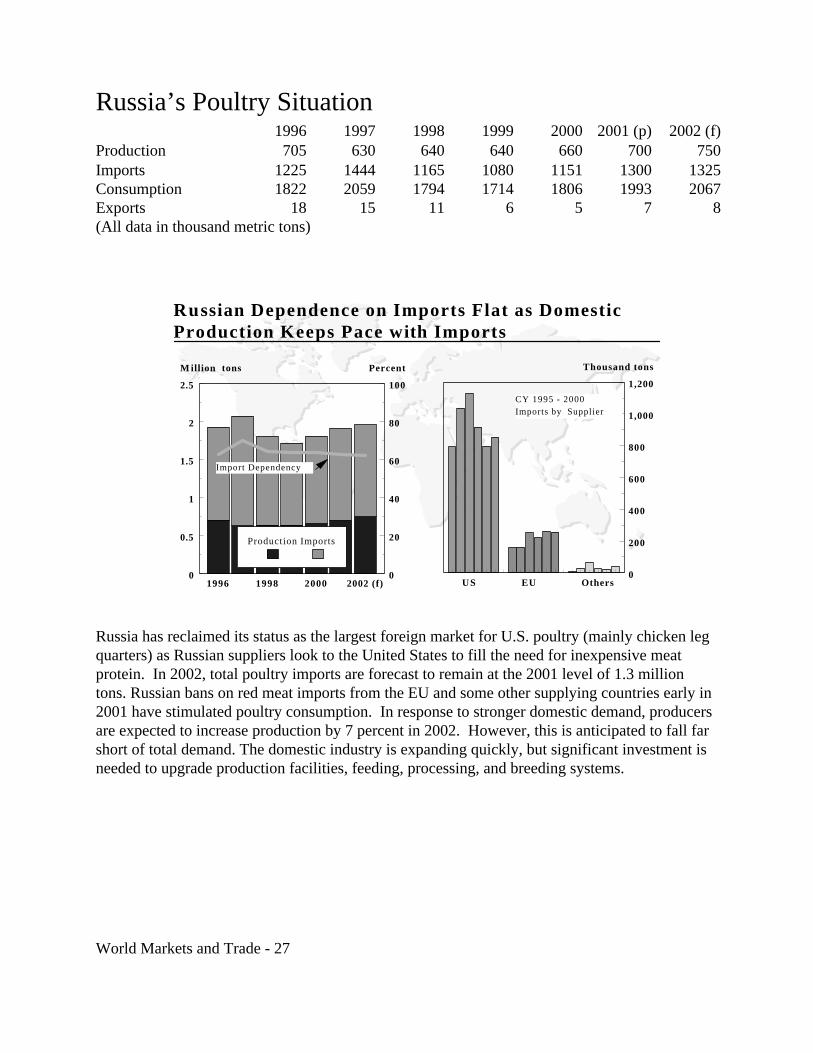
Russia’s Poultry Situation1996 1997 1998 1999 2000 2001 (p) 2002 (f)
Production 705 630 640 640 660 700 750Imports 1225 1444 1165 1080 1151 1300 1325Consumption 1822 2059 1794 1714 1806 1993 2067Exports 18 15 11 6 5 7 8(All data in thousand metric tons)
Russia has reclaimed its status as the largest foreign market for U.S. poultry (mainly chicken legquarters) as Russian suppliers look to the United States to fill the need for inexpensive meatprotein. In 2002, total poultry imports are forecast to remain at the 2001 level of 1.3 milliontons. Russian bans on red meat imports from the EU and some other supplying countries early in2001 have stimulated poultry consumption. In response to stronger domestic demand, producersare expected to increase production by 7 percent in 2002. However, this is anticipated to fall farshort of total demand. The domestic industry is expanding quickly, but significant investment isneeded to upgrade production facilities, feeding, processing, and breeding systems.
Russian Dependence on Imports Flat as Domestic Production Keeps Pace with Imports
US EU Others0
200
400
600
800
1,000
1,200
Thousand tons
1996 1998 2000 2002 (f)0
0.5
1
1.5
2
2.5
0
20
40
60
80
100
M illion tons Percent
Production Imports
Import Dependency
CY 1995 - 2000 Imports by Supplier
EGG SUMMARYSelected Countries
(Million Pieces)
1997 1998 1999 2000 2001(p) 2002(f)PRODUCTION United States 77,676 79,896 82,943 84,420 85,812 87,240 Canada 5,931 5,986 6,151 6,597 6,700 6,780 Mexico 28,170 29,898 32,428 35,155 36,034 36,935 Brazil 12,596 13,636 14,768 14,796 15,075 15,377 European Union 85,180 89,327 88,457 85,768 88,981 89,000 Russian Federation 31,900 33,000 33,000 33,900 34,200 34,400 China 282,350 307,760 365,300 381,340 387,500 395,200 Japan 42,588 42,117 41,975 42,041 42,100 41,900 Other Countries 112,836 108,995 110,680 117,764 118,499 112,989TOTAL 679,227 710,646 775,702 801,773 814,841 819,821
IMPORTS United States 83 70 89 101 110 96 Canada 666 791 735 577 585 650 Mexico 217 270 171 186 189 190 European Union 3,991 4,206 3,585 3,826 3,564 3,600 Poland 77 90 84 85 70 70 Russia 50 50 50 70 75 75 Hong Kong 1,489 1,498 1,506 1,434 1,482 1,492 Japan 1,741 1,700 1,976 1,988 1,800 1,850 Other Countries 220 480 388 456 391 319TOTAL 8,534 9,155 8,584 8,722 8,251 8,342
EXPORTS United States 2,734 2,626 1,942 2,063 2,105 1,980 Canada 323 367 454 553 560 570 Brazil 20 7 24 267 438 657 European Union 4,977 7,155 7,017 7,375 7,377 7,200 India 260 315 267 291 355 400 China 957 898 774 1,060 933 989 Other Countries 1,351 1,312 1,099 1,124 1,016 580TOTAL 10,622 12,680 11,577 12,733 12,784 12,376
CONSUMPTION United States 64,308 66,264 69,804 71,136 72,372 73,668 Canada 6,286 6,427 6,381 6,622 6,726 6,870 Mexico 28,387 30,168 32,599 35,341 36,223 37,125 Brazil 12,576 13,629 14,744 14,535 14,642 14,723 European Union 84,194 86,378 85,025 82,219 85,168 85,400 Russia 31,900 33,000 33,000 33,920 34,225 34,425 Poland 7,753 7,761 7,572 7,769 7,933 8,040 Hong Kong 1,484 1,494 1,504 1,432 1,480 1,490 China 281,407 206,869 364,533 380,285 386,569 394,214 India 31,740 33,685 34,733 35,709 38,145 39,100 Japan 44,329 43,817 43,951 44,029 43,900 43,750 Other Countries 69,221 63,813 63,744 67,781 68,992 64,148TOTAL 674,317 604,400 768,885 792,047 807,737 814,665
SOURCE: FAS post reports, official statistics, and inter-agency analysis. Foreign Agricultural ServiceCommodity and Marketing Programs
* EU: Revised data series based on consolidated production, supply and demand see p.5 for details. Dairy, Livestock and Poultry Division(p) preliminary (f) forecast
World Markets and Trade - 28