Embed Size (px)
Citation preview
©2014 American Geophysical Union. All rights reserved.
Global-mean radiative feedbacks and forcing in atmosphere-only and
coupled atmosphere-ocean climate change experiments
Mark A. Ringer1, Timothy Andrews and Mark J. Webb
Met Office Hadley Centre, Exeter, U.K.
(22 May 2014)
Submitted to Geophysical Research Letters
_______________________
1Corresponding author: Mark A. Ringer, Met Office Hadley Centre, FitzRoy Road, Exeter,
EX1 3PB, U.K. ([email protected])
This article has been accepted for publication and undergone full peer review but has not been through the copyediting, typesetting, pagination and proofreading process which may lead to differences between this version and the Version of Record. Please cite this article as doi: 10.1002/2014GL060347

©2014 American Geophysical Union. All rights reserved.
Abstract
Analysis of the available CMIP5 models suggests that SST-forced, atmosphere-only global
warming experiments (‘amip4K’, ‘amipFuture’, ‘aqua4K’) are a good guide to the global
cloud feedbacks determined from coupled atmosphere-ocean CO2-forced simulations,
including the inter-model spread. Differences in the total climate feedback parameter between
the experiments arise primarily from differences in the clear-sky feedbacks which can largely
be anticipated from the nature of the experimental design.
The effective CO2 radiative forcing is anti-correlated with the total feedback in the coupled
simulations. This anti-correlation strengthens as the experimental design becomes simpler,
the number of potential degrees of freedom of the system’s response reduces, and the relevant
physical processes can be identified. In the aquaplanet simulations the anti-correlation is
primarily driven by opposing changes in the rapid cloud adjustment to CO2 and the net cloud
response to increased surface warming. Establishing a physical explanation for this behavior
is important future work.

©2014 American Geophysical Union. All rights reserved.
1. Introduction
The climate feedback parameter, , relates the change in global-mean surface temperature,
ST , to the energetic response of the climate system to a radiative forcing. For small
perturbations to an initial equilibrium state this relationship is approximately linear [Gregory
et al., 2004],
SN F T ,
where F is the radiative forcing and N is the change in net downward radiative flux at the
top-of-atmosphere (TOA).
If the system is allowed to return to equilibrium (i.e. 0N ) then /EQT F is the
equilibrium surface warming. For the radiative forcing resulting from a doubling of
atmospheric CO2 concentration EQT is usually referred to as the equilibrium climate
sensitivity.
The feedback parameter provides a useful metric for comparing the responses of different
global climate models to any perturbation to the system. The CMIP5 experimental design
[Taylor et al., 2012] provides several types of simulation from which , F and ST can be
estimated. These include (i) increasing the atmospheric CO2 concentration in fully-coupled
atmosphere-ocean models and (ii) raising the sea-surface temperatures, either uniformly or
with geographical variation, in atmosphere-only models.

©2014 American Geophysical Union. All rights reserved.
The question we address here is whether these estimates of the climate feedback parameter
agree. In particular, does the spread in across the ensemble of atmosphere-only, SST
warming simulations provide a good guide to what we might expect in fully-coupled models
in response to increased atmospheric CO2?
This is an important question because SST-forced experiments have long been used to assess
climate feedbacks in models but it is unclear how the idealized experimental design relates to
more realistic coupled feedbacks. For the first time CMIP5 enables such a comparison.
Here we: (i) compare estimates of the global mean radiative feedbacks in the different CMIP5
experiments; (ii) explore the relationship between feedbacks derived from the ‘simplified’
experiments in CMIP5 (e.g. uniform SST warming) and those derived from the fully-coupled
experiments (abrupt CO2 quadrupling); and (iii) investigate if the spread of the feedbacks
across the ensemble of coupled models is captured by the simplified experiments.
In addition, we also examine the relationship between the cross-ensemble variations in CO2
radiative forcing and feedbacks in the models and its dependence upon the experimental
design.
2. Model simulations and methods
We use data from the following CMIP5 experiments (see Taylor et al., 2012 for the formal
definitions): piControl and abrupt4×CO2 (years 1 – 150); amip, amip4K, and amipFuture
(30-year means, 1979 – 2008); aquaControl and aqua4K (5-year means); amip4×CO2 (30-
year means, 1979 – 2008); aqua4×CO2 (5-year means); sstClim and sstClim4×CO2

©2014 American Geophysical Union. All rights reserved.
(“Hansen” experiment; 30-year means). The models used for the different experiments are
listed in Table S1 of the supporting information.
The radiative feedbacks are estimated as follows. For the abrupt4×CO2 simulations, the
feedbacks are estimated from the slopes of the linear regression of annual, global-mean
changes in top-of-atmosphere fluxes on global-mean changes in surface temperature
[Gregory et al., 2004]; note that the total radiative forcing and (if the stratospherically-
adjusted forcing is known) the rapid tropospheric adjustments can also be estimated as the
intercepts from these regressions. For the amip4K, amipFuture and aqua4K experiments, the
feedbacks are estimated using differences of the long-term mean fluxes and surface
temperatures from the appropriate control simulations. The forcings and adjustments are
estimated in the same manner using the amip4×CO2, aqua4×CO2 and sstClim4×CO2
experiments.
Cloud and non-cloud (clear-sky) feedbacks are separated using the cloud radiative effect
(CRE), i.e. the differences between all-sky and clear-sky TOA fluxes. Limitations of this
method and the possible impacts on our results are discussed in the text.
3 Results
3.1 Radiative feedbacks in the CMIP5 experiments
Figure 1 summarizes the different radiative feedbacks estimated from the aqua4K, amip4K,
amipFuture, and fully-coupled abrupt4×CO2 experiments for the CMIP5 models.

©2014 American Geophysical Union. All rights reserved.
The shortwave clear-sky feedback ( ,sw clr ) is robustly small and positive across the
aquaplanet models. In the amip experiments the sea-ice concentration is fixed (although sea-
ice albedo may depend on temperature), so over ocean this is essentially the SW water vapour
feedback; over land these experiments also include snow retreat. Consequently ,sw clr is larger
than in the aqua simulations but is generally still smaller than in the coupled models because
there is no reduction in sea-ice in response to the warming. In the abrupt4×CO2 experiments
the sea-ice retreat leads to a considerably larger positive feedback. Note the greater spread at
the lower end of range when we use the full ensemble, indicating the importance of the
sample size when assessing the sea-ice feedback. In general the differences between ,sw clr in
the experiments match our expectations given the different experimental designs.
The longwave clear-sky feedback ( ,lw clr ) differs little between aqua and amip experiments,
i.e. it is insensitive to either the presence of the land or the enhanced land warming. The
median, minimum, and maximum values all imply a weaker (negative) feedback in the
abrupt4×CO2 experiments. This could result from differences in the warming patterns but
might also be due to the effect of the increased opacity of the atmosphere due to the elevated
CO2 concentration [e.g. Good et al., 2012], which is not present in SST-forced experiments.
The end result is greater inter-model spread in the abrupt4×CO2 experiments.
The longwave CRE feedback ( ,lw cre ) is small – the median value is close to zero – with a
range of around ±0.5Wm-2
K-1
and this varies little with experimental design. There is a
suggestion that ,lw cre is more likely to be slightly positive in the abrupt4×CO2 experiments
and slightly negative in the amip experiments.

©2014 American Geophysical Union. All rights reserved.
The variation of the shortwave CRE feedback ( ,sw cre ) in the aqua experiments is dominated
by two models with large negative feedback (see also below); this dominates the net CRE
feedback in these models. In general ,sw cre is small and positive in the amip experiments; it is
more negative in the coupled simulations, with a larger inter-model spread.
Some of the differences between the experiments arise due to the so-called ‘cloud masking’
effect, which can lead to difficulties in interpreting changes in CRE [Soden et al., 2004]. In
particular, this will affect comparisons of the SW CRE feedbacks as the amip experiments do
not include reductions in sea-ice extent (although they do include snow retreat over land).
Soden et al. [2008] estimate the clear-sky albedo feedback cloud masking effect as 0.26 Wm-2
K-1
. Adding this offset to ,sw cre derived from the abrupt4×CO2 experiments – assuming that
the dominant contribution results from the sea-ice reduction and varies little between models
– leads to closer agreement with the amip experiments in the absolute value of the feedback
in most, but not all, of the models. This issue is less important for the LW CRE feedback as
the masking effect in this case will be much less dependent on the experimental design:
accounting for cloud masking would mean that the LW cloud feedback is likely to be positive
in all cases. Overall, the impact of cloud masking is to slightly alter our perspective on
comparisons between the absolute values of the feedbacks but not on their spread across the
respective ensembles.
In all of the experiments the median net CRE feedback ( ,net cre ) is close to zero but the spread
is large, especially towards positive feedbacks. Differences in the median total feedback
across the different types of experiment are thus primarily determined by differences in the
clear-sky feedbacks.

©2014 American Geophysical Union. All rights reserved.
3.2 Relationships between feedbacks in the amip and aquaplanet experiments and the
coupled models
We can also examine the relationship between the feedbacks in the different experiments
directly for models where all of the experiments have been performed. Although this reduces
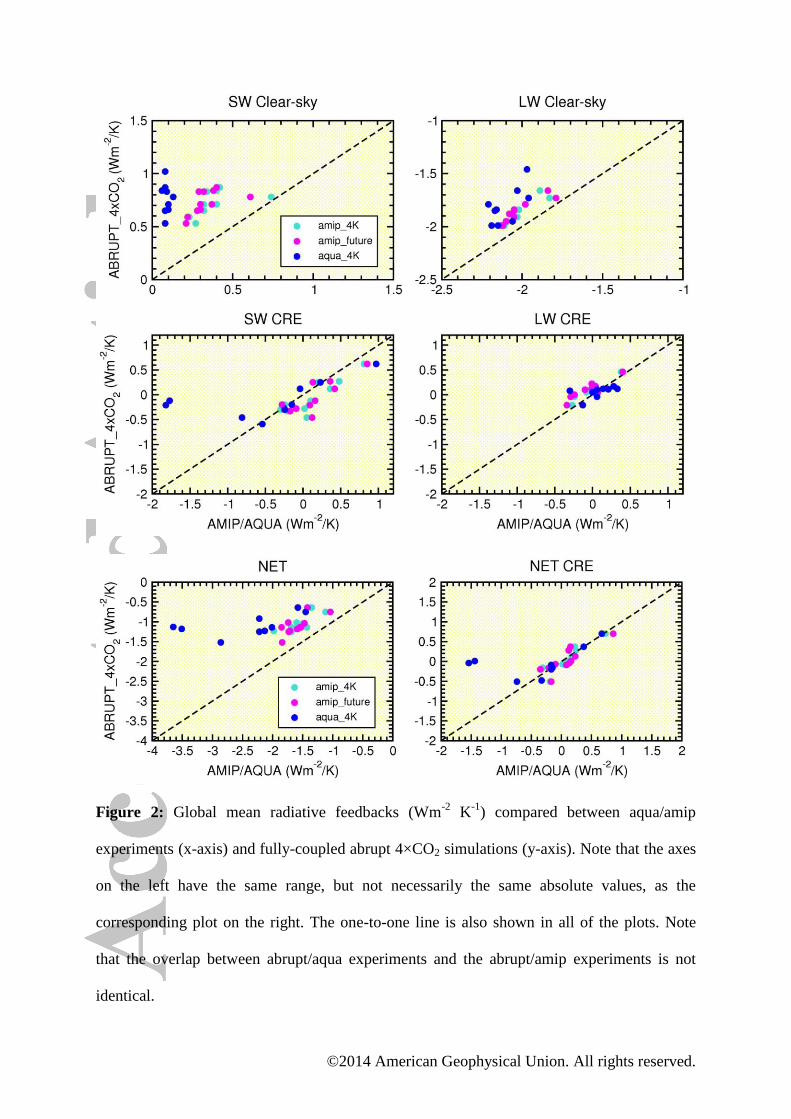
the sample size somewhat (10 – 12 models) it still provides a useful comparison (Figure 2).
Both ,sw clr and ,lw clr in amip and aqua lie to the left of the one-to-one line, indicating
weaker positive and stronger negative feedbacks respectively, compared to the fully-coupled
simulations. As anticipated from Fig. 1, the amip and aqua experiments are distinct for ,sw clr
but not for ,lw clr . Aside from the two aquaplanet models (MPI-ESM-LR/MR) with large
negative shortwave CRE feedback, in aqua most models lie close to the one-to-one line for
both ,sw cre and ,lw cre . The greater spread in the shortwave compared to the longwave CRE
feedback in the coupled experiments is captured by both the amip and aqua simulations.
The net cloud feedback, ,net cre , also lies very close to the one-to-one line. The aqua and amip
experiments thus appear to be a good guide to the global-mean net cloud feedback in the
coupled models, including its spread across the ensemble. This suggests that the global-mean
net cloud feedback in models does not depend on the detailed spatial pattern of the SST
warming, and may not even be greatly influenced by the land-sea contrast in the surface
warming. This differs from previous studies which have suggested that the SST pattern is
important to determining the cloud feedbacks [e.g. Zhu et al., 2007; Dessler, 2013]. However,
it should be noted that these studies usually compare the climate change responses with
present-day interannual variability, ENSO in particular. The contrast between the large
©2014 American Geophysical Union. All rights reserved.
circulation shifts associated with El Niño and La Niña events and the more spatially uniform
feedback patterns associated with the global warming response probably explains a large part
of the difference with our findings [Dessler, 2013].
In addition, feedbacks which are not represented in the aqua and amip experiments may not
have much impact on the global-scale cloud feedback, although differences between the
warming patterns larger than considered here might make manifest such an influence.
This close relationship between the net cloud feedback in the experiments in turn means that
for the total feedback, , the difference between estimates from the coupled and simplified
experiments arises primarily from differences in the clear-sky feedbacks (cf. Fig. 1).
Both Andrews et al. [2012] and Stevens et al. [2013] have drawn attention to deviations from
linearity in the forcing-response relationship derived from the abrupt experiments with
certain models. This means that estimates of both and the effective climate sensitivity
(ECS) will differ depending on whether one uses the early part of the run, the later part, or a
combination of both. This in turn could alter our interpretation of the comparisons with the
simplified experiments.
We have re-calculated the feedbacks in the abrupt experiments separately for the first ten
years after CO2 quadrupling and for year 11 onwards to examine this. The net cloud feedback
for the earlier period is small and negative – as opposed to being small and positive for the
later period – for most models and agrees less well with the amip experiments. Although the
consequent reduction in the total feedback means that estimates of from years 1 – 10 now
appear to agree better with the amip experiments, this is actually a result of compensating the

©2014 American Geophysical Union. All rights reserved.
original disparity due to clear-sky feedbacks (Fig. 1). This suggests that the feedbacks
estimated from the amip experiments are likely to be more relevant to the later part of the
abrupt4×CO2 experiments than to the early part, although clearly more work is necessary to
understand both the nature of the non-linearity and its relationship to the more idealized
simulations.
3.3 Relationship between global-mean feedbacks and forcing
Andrews et al. [2012] and Webb et al. [2013] have noted an anti-correlation between the
radiative forcing due to CO2 and the total climate feedback ( ) in GCMs, which we here
examine in more detail.
For reference, estimates of the 4×CO2 radiative forcing from the different CMIP5
experiments are shown in Fig. S1 (supporting information), together with those from the
previous two IPCC assessments. The median value tends to be around 7 Wm-2
, with an
interquartile range of 6-8 Wm-2
; this does not appear to have changed greatly since the TAR,
even though these earlier assessments did not explicitly account for tropospheric adjustments.
The range is wider in the abrupt experiments compared to both the amip and Hansen
estimates; this results from uncertainties in the linear regression method used to derive the
forcing in the abrupt experiments (possibly including non-linearities not captured by the
method itself). The median CO2 forcing derived from the aqua4×CO2 experiments is larger
than all of the other estimates: this suggests that it results from the lack of rapid land warming
and the increased LW emission to space this induces.
©2014 American Geophysical Union. All rights reserved.
Cross-ensemble correlations between the CO2 forcing and the total and net cloud feedbacks
in the different experiments (Table 1) suggest an anti-correlation that becomes more evident
as the experimental design becomes simpler, driven primarily by the ensemble spread in the
cloud feedback (i.e. the cloud feedback is the dominant contribution to the spread in ).
Figure 4 confirms the strong relationship between the 4×CO2 forcing and the +4K feedbacks
in the aquaplanet experiments. Models with a larger CO2 forcing have a more negative cloud
feedback, the variation of which is dominated by that in the shortwave component (the
longwave component is small in all of the models and varies much less across the ensemble).
This is true for the two models which did not indicate a strong relationship between the cloud
feedback in the aquaplanet and fully-coupled experiments (Fig. 2), i.e. they appear unusual
regarding the relationship between the aquaplanet and coupled versions but not in the context
of the aquaplanet model ensemble itself.
It thus appears that the simplified experimental design not only allows us to explore the
factors driving the inter-model spread in the feedbacks in the coupled models but also
provides a potentially useful framework for understanding the relationship between the CO2
forcing and the feedbacks.
What drives this F relationship and why is it more evident in the aquaplanet models? A
possible reason is that it emerges more clearly due to the reduced degrees of freedom, so that
as the models become more complex the additional feedbacks (and rapid adjustments) this
allows then act to blur the relationship between the forcing and the feedbacks.
©2014 American Geophysical Union. All rights reserved.
Further analysis suggests that the F relationship is primarily driven by that between the
4×CO2 cloud adjustment and the cloud feedback. Neglecting one of the models (FGOALS-
s2) the cross-ensemble correlation between the net CRE adjustments and feedbacks is -0.90,
i.e. stronger negative adjustments are associated with stronger positive feedbacks (Fig. S2,
supporting information). Moreover, the cross-ensemble variations in the net cloud adjustment
and the net cloud feedback make the dominant contributions to the spread in F and
respectively: the linear correlation co-efficient between the net cloud adjustment and F is
0.96, while that between ,net cre and is 0.99.
The one GCM that does not follow this behaviour is FGOALS-s2. Examination of vertical
profiles of relative humidity and cloud amount (not shown) indicates increases in both
quantities in the boundary layer in this model in response to 4×CO2. This is opposite to the
responses which we see in all of the other aquaplanet models, which are consistent with
previous work [e.g. Kamae and Watanabe, 2012]. This likely results from the
parameterization of low-level cloud as a function of lower-tropospheric stability in the
FGOALS model [Qu et al., 2013], with the impact of increasing stability (leading to
increased cloud) dominating the 4×CO2 response. In addition, the boundary layer is much
drier in the FGOALS-s2 control simulation than it is in the other models: the global-mean
relative humidity is 65% at 925 hPa, whereas it ranges between 83-90% in the other ensemble
members.
Taken together, these findings show that the strong forcing-feedback anti-correlation in the
aquaplanet simulations can be explained by identifying the dominant components of the
cross-ensemble spread in each. In all but one of the models considered here this relationship
is dominated by the opposing effects of changes in cloud resulting from these perturbations to

©2014 American Geophysical Union. All rights reserved.
the system. As the experimental design becomes more complex, and the degrees of freedom
of the system to respond to the initial perturbation consequently increase, this relatively
straightforward explanation for the F relationship becomes less evident. It nonetheless
provides a very good starting point for trying to understand the relationship between forcing
and feedbacks due to increased atmospheric CO2.
4. Discussion and conclusions
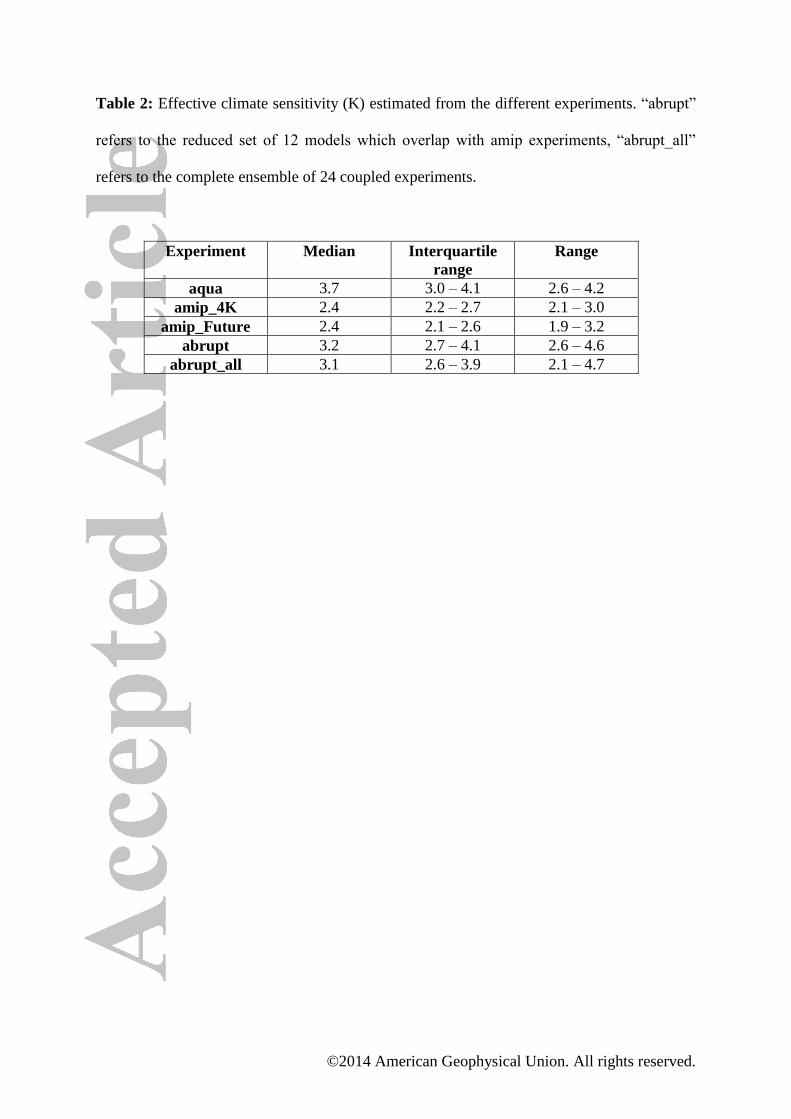
Our estimates of F and from each model can be combined to determine the effective
climate sensitivity (ECS) from the different experiments (Table 2). As expected, the
differences in lead to lower estimates of ECS (median, 1st and 3
rd quartiles, maximum and
minimum) using the amip experiments compared to the abrupt4×CO2 simulations. The full
range of ECS derived using all of the available coupled models (2.1 – 4.7 K) corresponds to
those given in Andrews et al. [2012] and Forster et al. [2013]. Note that compensation
between the differences in the estimates of F and in the aquaplanet experiments (the anti-
correlation described above) means that the range of ECS in this case is comparable to that
derived from the coupled simulations for models where both experiments are available.
Our analysis of the CMIP5 models demonstrates that the simplified (and computationally less
burdensome) amip and aquaplanet SST warming experiments are a good guide to the global-
mean cloud feedback in the fully-coupled CO2-forced experiments, both its value in any
particular model and its spread across the ensemble. Differences in the total climate feedback
parameter estimated from the experiments arise primarily due to differences in the clear-sky
feedbacks which can largely be anticipated from the nature of the experimental design. The
amip and aquaplanet experiments thus provide an ideal test bed for investigating physical

©2014 American Geophysical Union. All rights reserved.
mechanisms of cloud feedbacks and cloud adjustments, for example via targeted sensitivity
tests [e.g. Webb and Lock, 2013].
The anti-correlation between the effective CO2 radiative forcing and the total feedback in the
fully-coupled simulations becomes stronger as the experimental design becomes simpler and
the number of potential degrees of freedom of the system to respond reduces. As this happens
the relevant physical processes can then be more clearly identified.
We emphasise that, as with all climate model inter-comparison studies, the available
ensembles are small, so that it is important not to over-interpret these results. Nonetheless,
they do provide useful information on the relationships between global radiative feedbacks
and forcing estimated from the different experimental designs. Our findings extend previous
studies showing an anti-correlation between adjusted forcing and net feedback by
demonstrating that this relationship is also found in CMIP5, is stronger in aquaplanet and
AMIP simulations than in coupled models, and is driven by an anti-correlation between cloud
adjustment and cloud feedback. Establishing a physical explanation for this behavior is
important future work.
Acknowledgments. This work was supported by the Joint UK DECC/Defra Met Office Hadley
Centre Climate Programme (GA01101). We thank William Ingram, John Mitchell and Jonathan
Gregory for comments on the original manuscript. We acknowledge the World Climate Research
Programme's Working Group on Coupled Modelling, which is responsible for CMIP, and we thank
the climate modeling groups for producing and making available their model output. For CMIP the
U.S. Department of Energy's Program for Climate Model Diagnosis and Intercomparison provides
coordinating support and led development of software infrastructure in partnership with the Global
Organization for Earth System Science Portals.
©2014 American Geophysical Union. All rights reserved.
References
Andrews, T. et al. (2012), Forcing, feedbacks and climate sensitivity in CMIP5 coupled
atmosphere-ocean climate models, Geophys. Res. Lett., 39, L09712,
doi:10.1029/2012GL051607.
Dessler, A.E., (2013), Observations of climate feedbacks over 2000-2010 and comparisons to
climate models, J. Climate, 26, 333-342, doi: 10.1175/JCLI-D-11-00640.1.
Forster, P.M. et al. (2013), Evaluating adjusted forcing and model spread for historical and
future scenarios in the CMIP5 generation of climate models, J. Geophys. Res., 118,
doi:10.1002/jgrd.50174.
Gregory, J.M. et al. (2004), A new method for diagnosing radiative forcing and climate
sensitivity, Geophys. Res. Lett., 31, L03205, doi:10.1029/2003GL018747.
Good, P. et al. (2012), A step-response approach for predicting and understanding non-linear
precipitation changes, Climate Dynamics, 39, 2789-2803, doi:10.1007/s00382-012-1571-1.
Kamae, Y., and M. Watanabe (2012), On the robustness of tropospheric adjustment in
CMIP5 models, Geophys. Res. Lett., 39, L23808, doi:10.1029/2012GL054275.
Qu, X. et al. (2013), On the spread of changes in marine low cloud cover in climate model
simulations of the 21st century, Climate Dynamics , doi:10.1007/s00382-013-1945-z .

©2014 American Geophysical Union. All rights reserved.
Soden, B. J., A. J. Broccoli, and R. S. Hemler, (2004), On the use of cloud forcing to estimate
cloud feedback, J. Climate, 17, 3661-3665.
Soden, B.J. et al., (2008), Quantifying climate feedbacks using radiative kernels, J. Climate,
21, 3504-3520.
Stevens, B., et al. (2013), Atmospheric component of the MPI-M Earth System Model:
ECHAM6, J. Adv. Model. Earth. Syst., 5, 146–172, doi:10.1002/jame.20015.
Taylor, K.E., R.J. Stouffer and G.A. Meehl, (2012), An Overview of CMIP5 and the
experiment design, Bull. Amer. Meteor. Soc., 93, 485-498, doi:10.1175/BAMS-D-11-00094.1,
2012.
Webb M.J., F.H. Lambert and J.M. Gregory (2013), Origins of differences in climate
sensitivity, forcing and feedback in climate models, Climate Dynamics, 40, 677-707.
Webb M.J. and A.P. Lock (2013), Coupling between subtropical cloud feedback and the local
hydrological cycle in a climate model, Climate Dynamics, 41, 1923-1939.
Zhu, P. et al., (2010), Climate Sensitivity of Tropical and Subtropical Marine Low Clouds to
ENSO and Global Warming due to Doubling CO2, J. Geophys. Res., 112, D17108,
doi:1029/2006JD008174.

©2014 American Geophysical Union. All rights reserved.
Figure 1: Global mean radiative feedbacks (all in Wm-2
K-1
) in the different CMIP5
experiments. “abrupt” refers to the reduced set of 12 models which overlap with amip
experiments, “abrupt_all” refers to the complete ensemble of 24 coupled experiments. These
are box plots with the box showing the inter-quartile range, the horizontal line the median,
and the whiskers indicating the full range (maximum and minimum values). Note that the
range spanned by the y-axis is the same for all of the feedbacks although the absolute values
are different.
©2014 American Geophysical Union. All rights reserved.
Figure 2: Global mean radiative feedbacks (Wm-2
K-1
) compared between aqua/amip
experiments (x-axis) and fully-coupled abrupt 4×CO2 simulations (y-axis). Note that the axes
on the left have the same range, but not necessarily the same absolute values, as the
corresponding plot on the right. The one-to-one line is also shown in all of the plots. Note
that the overlap between abrupt/aqua experiments and the abrupt/amip experiments is not
identical.

©2014 American Geophysical Union. All rights reserved.
Figure 3: Relationship between the global-mean total and cloud feedbacks (Wm-2
K-1
) and
the total 4×CO2 radiative forcing (Wm-2
) in the aquaplanet model ensemble. The solid line is
the linear regression fit to the points and the linear correlation co-efficient is shown in each
case.

©2014 American Geophysical Union. All rights reserved.
Table 1: Cross ensemble correlations between the 4×CO2 radiative forcing and the total and
net cloud feedbacks in the different experiments. Single and double asterisks indicate
correlations significant at the 95% and 99% levels respectively. Experiments are listed in
order of increasing complexity.
λ
(total)
λ
(net_cre)
aqua_4K -0.82** -0.95**
amip_4K -0.65* -0.68*
amip_Future -0.48 -0.53
abrupt -0.43* -0.46*
©2014 American Geophysical Union. All rights reserved.
Table 2: Effective climate sensitivity (K) estimated from the different experiments. “abrupt”
refers to the reduced set of 12 models which overlap with amip experiments, “abrupt_all”
refers to the complete ensemble of 24 coupled experiments.
Experiment Median Interquartile
range
Range
aqua 3.7 3.0 – 4.1 2.6 – 4.2
amip_4K 2.4 2.2 – 2.7 2.1 – 3.0
amip_Future 2.4 2.1 – 2.6 1.9 – 3.2
abrupt 3.2 2.7 – 4.1 2.6 – 4.6
abrupt_all 3.1 2.6 – 3.9 2.1 – 4.7