Embed Size (px)
Citation preview
Agricultural Economics Report No. 315
GLOBAL MARKET SEGMENTATION FOR
VALUE-ADDED AGRICULTURAL PRODUCTS
Joyce Hall Krause, William W. Wilson, and Frank J. Dooley
Department of Agricultural Economics * Agricultural Experiment StationNorth Dakota State University, Fargo, ND 58105-5636
February 1994
ACKNOWLEDGEMENTS
Preparation of this report was financed by a USDA/CSRS NRI CGP Agreement No.92-37400-8300 titled "Economics and Strategy for U.S. Value-Added Wheat Exports" andInternational Trade Development Grant No. 91-34192-6204 titled "Economic Growth viaExports of Northern Plains Agricultural Products," Agricultural Experiment Station, NorthDakota State University, Fargo.
Dave Cobia, Demcey Johnson, Jung Hee Lee, and Charlene Lucken providedimportant content and editorial comments. Carol Jensen, Department of AgriculturalEconomics, North Dakota State University, provided secretarial support.
TABLE OF CONTENTS
Page
List of Tables ...................................................... iii
Highlights . ....... .. ........ ...... ...... ... ....... ...... ........ v
Introduction .............. ....................... ................. . 1
Method of Cluster and Factor Analysis................. .................. 3
Cluster Analysis ........ ............ ....... . .......... ........ 3
Factor Analysis ........... ...... ...... .......... .... ......... 4
D ata .... .... .... .... .... .... ............ .... . ... . ... .... .... .... 4
Results of the Factor and Cluster Analysis ..... ........... ................. 7
Factor Analysis Results ................ ..... ......... ........ 7
Cluster Analysis Results ......................................... 9
Summary and Conclusions .......... ............... ....... ..... .... . 14
References .... ................................................... 15

i
LIST OF TABLES
No. Pae
1 Description of Variables Used in the Factor Analysis ................... .. 6
2 Factor Loadings ............................................... 8
3 Clustering Solution ............................................ 10
4 Average Factor Scores for Clusters ............................. . 11
5 Variable Averages by Cluster ..................................... 12
iii

HIGHLIGHTS
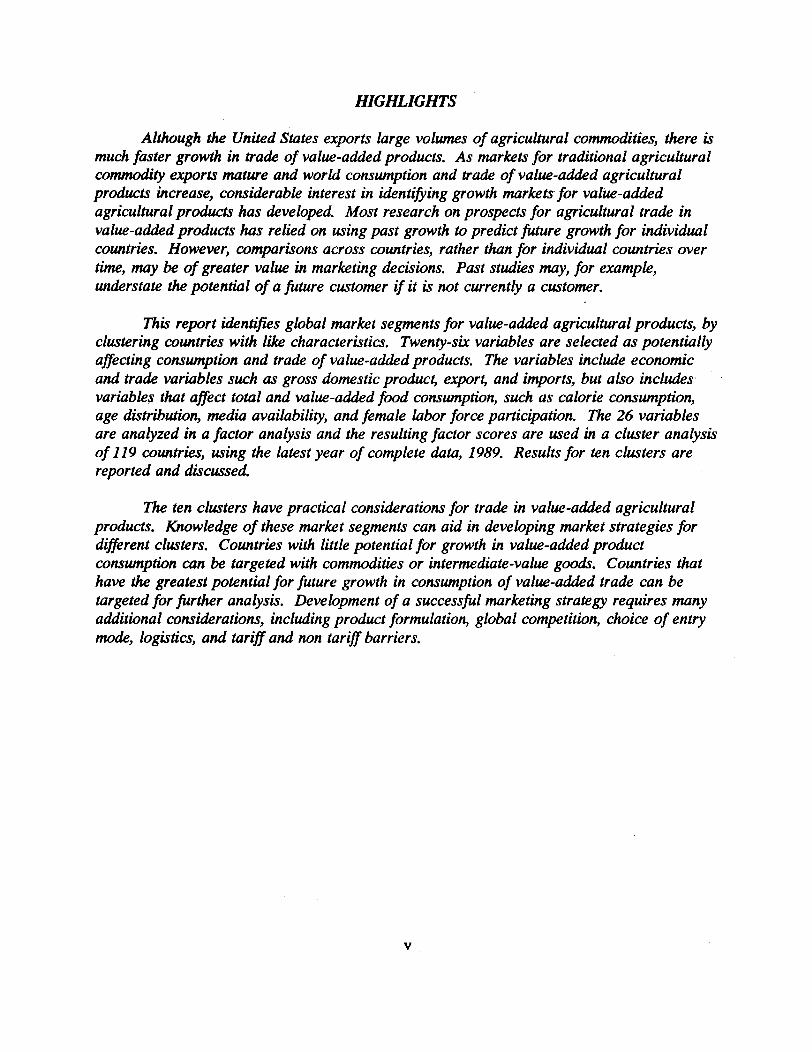
Although the United States exports large volumes of agricultural commodities, there ismuch faster growth in trade of value-added products. As markets for traditional agriculturalcommodity exports mature and world consumption and trade of value-added agriculturalproducts increase, considerable interest in identifying growth markets for value-addedagricultural products has developed. Most research on prospects for agricultural trade invalue-added products has relied on using past growth to predict future growth for individualcountries. However, comparisons across countries, rather than for individual countries overtime, may be of greater value in marketing decisions. Past studies may, for example,understate the potential of a future customer if it is not currently a customer.
This report identifies global market segments for value-added agricultural products, byclustering countries with like characteristics. Twenty-six variables are selected as potentiallyaffecting consumption and trade of value-added products. The variables include economicand trade variables such as gross domestic product export, and imports, but also includesvariables that affect total and value-added food consumption, such as calorie consumption,age distribution, media availability, and female labor force participation. The 26 variablesare analyzed in a factor analysis and the resulting factor scores are used in a cluster analysisof 119 countries, using the latest year of complete data, 1989. Results for ten clusters arereported and discussed.
The ten clusters have practical considerations for trade in value-added agriculturalproducts. Knowledge of these market segments can aid in developing market strategies fordifferent clusters. Countries with little potential for growth in value-added productconsumption can be targeted with commodities or intermediate-value goods. Countries thathave the greatest potential for future growth in consumption of value-added trade can betargeted for further analysis. Development of a successful marketing strategy requires manyadditional considerations, including product formulation, global competition, choice of entrymode, logistics, and tariff and non tariff barriers.
V
GLOBAL MARKET SEGMENTATION FOR VALUE-ADDEDAGRICULTURAL PRODUCTS
Joyce Hall Krause, William W. Wilson, and Frank J. Dooley*
INTRODUCTION
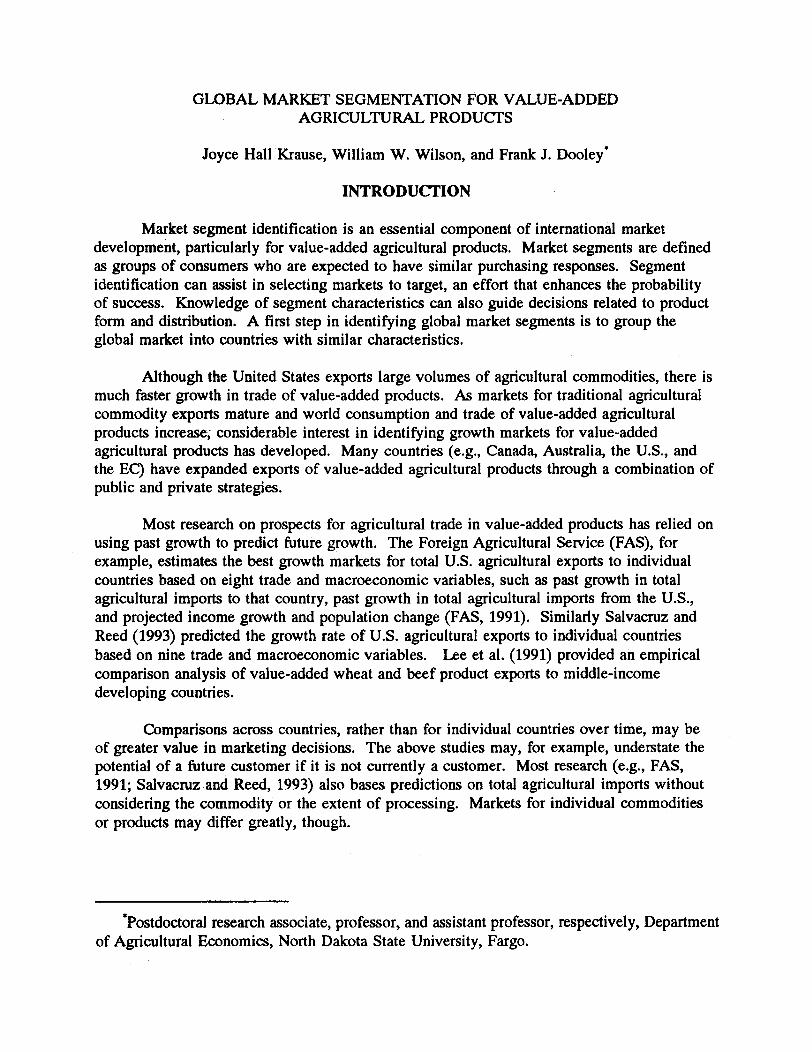
Market segment identification is an essential component of international marketdevelopment, particularly for value-added agricultural products. Market segments are definedas groups of consumers who are expected to have similar purchasing responses. Segmentidentification can assist in selecting markets to target, an effort that enhances the probabilityof success. Knowledge of segment characteristics can also guide decisions related to productform and distribution. A first step in identifying global market segments is to group theglobal market into countries with similar characteristics.
Although the United States exports large volumes of agricultural commodities, there ismuch faster growth in trade of value-added products. As markets for traditional agriculturalcommodity exports mature and world consumption and trade of value-added agriculturalproducts increase, considerable interest in identifying growth markets for value-addedagricultural products has developed. Many countries (e.g., Canada, Australia, the U.S., andthe EC) have expanded exports of value-added agricultural products through a combination ofpublic and private strategies.
Most research on prospects for agricultural trade in value-added products has relied onusing past growth to predict future growth. The Foreign Agricultural Service (FAS), forexample, estimates the best growth markets for total U.S. agricultural exports to individualcountries based on eight trade and macroeconomic variables, such as past growth in totalagricultural imports to that country, past growth in total agricultural imports from the U.S.,and projected income growth and population change (FAS, 1991). Similarly Salvacruz andReed (1993) predicted the growth rate of U.S. agricultural exports to individual countriesbased on nine trade and macroeconomic variables. Lee et al. (1991) provided an empiricalcomparison analysis of value-added wheat and beef product exports to middle-incomedeveloping countries.
Comparisons across countries, rather than for individual countries over time, may beof greater value in marketing decisions. The above studies may, for example, understate thepotential of a future customer if it is not currently a customer. Most research (e.g., FAS,1991; Salvacruz and Reed, 1993) also bases predictions on total agricultural imports withoutconsidering the commodity or the extent of processing. Markets for individual commoditiesor products may differ greatly, though.
'Postdoctoral research associate, professor, and assistant professor, respectively, Departmentof Agricultural Economics, North Dakota State University, Fargo.
2
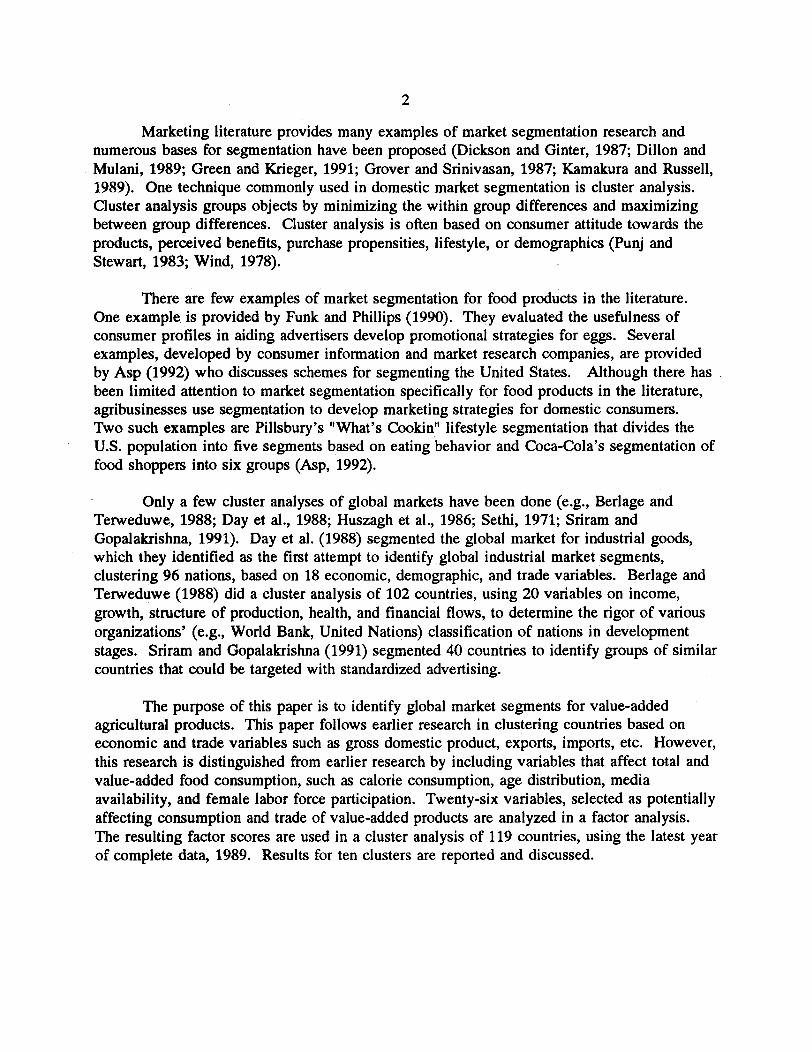
Marketing literature provides many examples of market segmentation research andnumerous bases for segmentation have been proposed (Dickson and Ginter, 1987; Dillon andMulani, 1989; Green and Krieger, 1991; Grover and Srinivasan, 1987; Kamakura and Russell,1989). One technique commonly used in domestic market segmentation is cluster analysis.Cluster analysis groups objects by minimizing the within group differences and maximizingbetween group differences. Cluster analysis is often based on consumer attitude towards theproducts, perceived benefits, purchase propensities, lifestyle, or demographics (Punj andStewart, 1983; Wind, 1978).
There are few examples of market segmentation for food products in the literature.One example is provided by Funk and Phillips (1990). They evaluated the usefulness ofconsumer profiles in aiding advertisers develop promotional strategies for eggs. Severalexamples, developed by consumer information and market research companies, are providedby Asp (1992) who discusses schemes for segmenting the United States. Although there hasbeen limited attention to market segmentation specifically for food products in the literature,agribusinesses use segmentation to develop marketing strategies for domestic consumers.Two such examples are Pillsbury's "What's Cookin" lifestyle segmentation that divides theU.S. population into five segments based on eating behavior and Coca-Cola's segmentation offood shoppers into six groups (Asp, 1992).
Only a few cluster analyses of global markets have been done (e.g., Berlage andTerweduwe, 1988; Day et al., 1988; Huszagh et al., 1986; Sethi, 1971; Sriram andGopalakrishna, 1991). Day et al. (1988) segmented the global market for industrial goods,which they identified as the first attempt to identify global industrial market segments,clustering 96 nations, based on 18 economic, demographic, and trade variables. Berlage andTerweduwe (1988) did a cluster analysis of 102 countries, using 20 variables on income,growth, structure of production, health, and financial flows, to determine the rigor of variousorganizations' (e.g., World Bank, United Nations) classification of nations in developmentstages. Sriram and Gopalakrishna (1991) segmented 40 countries to identify groups of similarcountries that could be targeted with standardized advertising.
The purpose of this paper is to identify global market segments for value-addedagricultural products. This paper follows earlier research in clustering countries based oneconomic and trade variables such as gross domestic product, exports, imports, etc. However,this research is distinguished from earlier research by including variables that affect total andvalue-added food consumption, such as calorie consumption, age distribution, mediaavailability, and female labor force participation. Twenty-six variables, selected as potentiallyaffecting consumption and trade of value-added products are analyzed in a factor analysis.The resulting factor scores are used in a cluster analysis of 119 countries, using the latest yearof complete data, 1989. Results for ten clusters are reported and discussed.
3
METHOD OF CLUSTER AND FACTOR ANALYSIS
Cluster Analysis
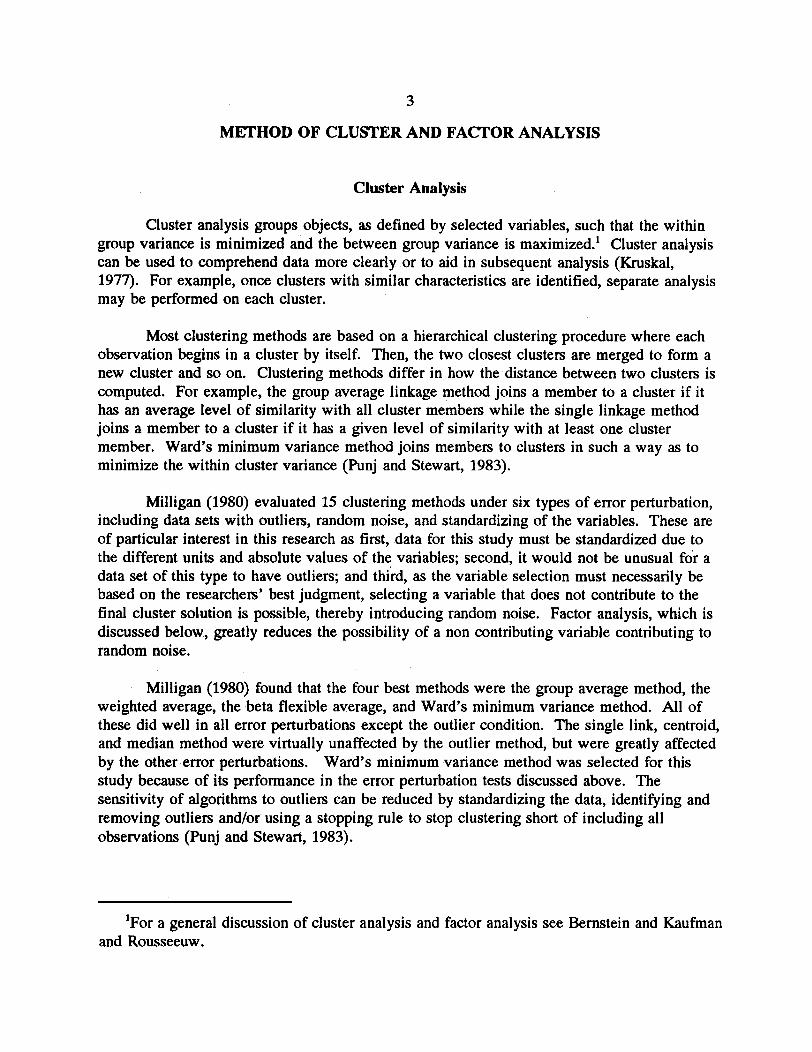
Cluster analysis groups objects, as defined by selected variables, such that the withingroup variance is minimized and the between group variance is maximized.1 Cluster analysiscan be used to comprehend data more clearly or to aid in subsequent analysis (Kruskal,1977). For example, once clusters with similar characteristics are identified, separate analysismay be performed on each cluster.
Most clustering methods are based on a hierarchical clustering procedure where eachobservation begins in a cluster by itself. Then, the two closest clusters are merged to form anew cluster and so on. Clustering methods differ in how the distance between two clusters iscomputed. For example, the group average linkage method joins a member to a cluster if ithas an average level of similarity with all cluster members while the single linkage methodjoins a member to a cluster if it has a given level of similarity with at least one clustermember. Ward's minimum variance method joins members to clusters in such a way as tominimize the within cluster variance (Punj and Stewart, 1983).
Milligan (1980) evaluated 15 clustering methods under six types of error perturbation,including data sets with outliers, random noise, and standardizing of the variables. These areof particular interest in this research as first, data for this study must be standardized due tothe different units and absolute values of the variables; second, it would not be unusual for adata set of this type to have outliers; and third, as the variable selection must necessarily bebased on the researchers' best judgment, selecting a variable that does not contribute to thefinal cluster solution is possible, thereby introducing random noise. Factor analysis, which isdiscussed below, greatly reduces the possibility of a non contributing variable contributing torandom noise.
Milligan (1980) found that the four best methods were the group average method, theweighted average, the beta flexible average, and Ward's minimum variance method. All ofthese did well in all error perturbations except the outlier condition. The single link, centroid,and median method were virtually unaffected by the outlier method, but were greatly affectedby the other error perturbations. Ward's minimum variance method was selected for thisstudy because of its performance in the error perturbation tests discussed above. Thesensitivity of algorithms to outliers can be reduced by standardizing the data, identifying andremoving outliers and/or using a stopping rule to stop clustering short of including allobservations (Punj and Stewart, 1983).
'For a general discussion of cluster analysis and factor analysis see Bernstein and Kaufmanand Rousseeuw.
4
In most cluster analyses the researcher must select the number of clusters in the finalsolution (Milligan and Cooper, 1985). The severity of forming too few or too many clustersdepends on the problem being analyzed. While having a statistical means by which todetermine the optimal number of clusters in the fields of medicine or taxonomy is important,this is less important in marketing applications.
Factor Analysis
Factor analysis is a set of models for transforming a group of variables into a moreuseful form. Linear combinations are formed from the original variables and these linearcombinations are used to predict the original variables (Bernstein, 1988). This step, althoughnot done prior to many cluster analyses, is a potentially crucial step when there is limited apriori information. Variables that do not contribute to the clustering (i.e, random noise) canseriously alter the final solutions. By prior factor analysis, these variables can be located anddeleted. In addition, prior factoring will reduce the impact of redundant variables.
DATA
Twenty-six variables were selected as potentially affecting food consumption and tradeof value-added agricultural products. Variables were selected to measure standard of living,the economic welfare of the nation, propensity to trade, propensity to consume, mediaavailability, and degree of urbanization.
Variables selected to measure the standard of living and general welfare of thepopulation include gross domestic product per capita (GDPCAP), inflation (INFLATE), yearsof life expectancy (LIFEEXP), fertility rate measured as births per woman (FERTILITY),population density measured by persons per square kilometer (POPDENS), and the populationgrowth rate (POPGR). Variables selected to measure the economic welfare of the nationinclude GDPCAP and INFLATE, gross domestic savings (GDS), gross domestic investment(GDI), net foreign investment (NFI), and the percent of land in agriculture (AGLAND).GDS, GDI, and NFI are expressed as a percent of gross domestic product.
Variables selected to measure the propensity to trade include exports expressed as apercent of gross domestic product (EXPORTS), imports expressed as a percent of grossdomestic product (IMPORTS), money supply per capita (MONEY), international reserves percapita (RESERVES), and cereal imports in metric tonnes per capita (CEREALIM). It isoften suggested that urbanization is an important factor in consumption and trade (Day et al.,1988; Huszagh et al., 1986; Sethi, 1971); for example, more highly urbanized countries maybe easier to penetrate with new products. Thus, the percentage of the population living in anurban environment (URBAN) and the urban growth rate (URBANGR) were included.
5
Variables selected to measure the propensity to consume include GDPCAP andMONEY, calories per day per capita (CALORIE), protein per day per capita in kilograms(PROTEIN), and energy consumption per capita per year expressed in kilograms of oilequivalent (ENERGY). In food consumption analyses it has been shown that demographicfactors such as the age composition of the population, female participation in the labor force,and education affect food choice (e.g., Gould et al., 1991; Kinsey, 1983; Redman, 1980).Thus, the percentage of the population age 0 to 14 years (POPDIST), the percentage offemales participating in the paid labor force (FLABOR), the percentage enrollment in primaryschool (PRIMARY), and the percentage enrollment in secondary school (SECONDARY) wereselected.
Following Sriram and Gopalakrishna (1991), media availability, as proxied by thenumber of televisions per 1,000 persons (TV) and the number of radios per 1,000 persons(RADIO), was included. Several possible ways to measure media availability wereconsidered such as the numbers of newspapers in circulation. However, data for thesevariables were not current or complete enough to consider.
Variable definitions and descriptions are presented in Table 1. The latest year that acomplete data set existed, 1989, was used. All monetary values are expressed in U.S.dollars. Variables are converted to per capita terms or percents where necessary to provideequivalent measures among countries. Exports, imports, savings, and investment areexpressed as a percent of gross domestic product.
With the exception of televisions and radios, data for all variables were taken from theWorld Tables and Social Indicators of Development data sets (IBRD, 1991; IBRD, 1991-92).The World Tables data set includes a total of 146 countries. As every country must have anobservation on each variable in the data set to be included in the cluster analysis, efforts weremade to construct as complete a data set as possible. Information missing in World Tables orSocial Indicators was sourced in the United Nations Statistical Yearbook (1993), the 1991Yearbook of Labour, International Financial Statistics, 1993, and the World Factbook, 1991.Data for televisions and radios were taken from the United Nations Statistical Yearbook(1993).
6
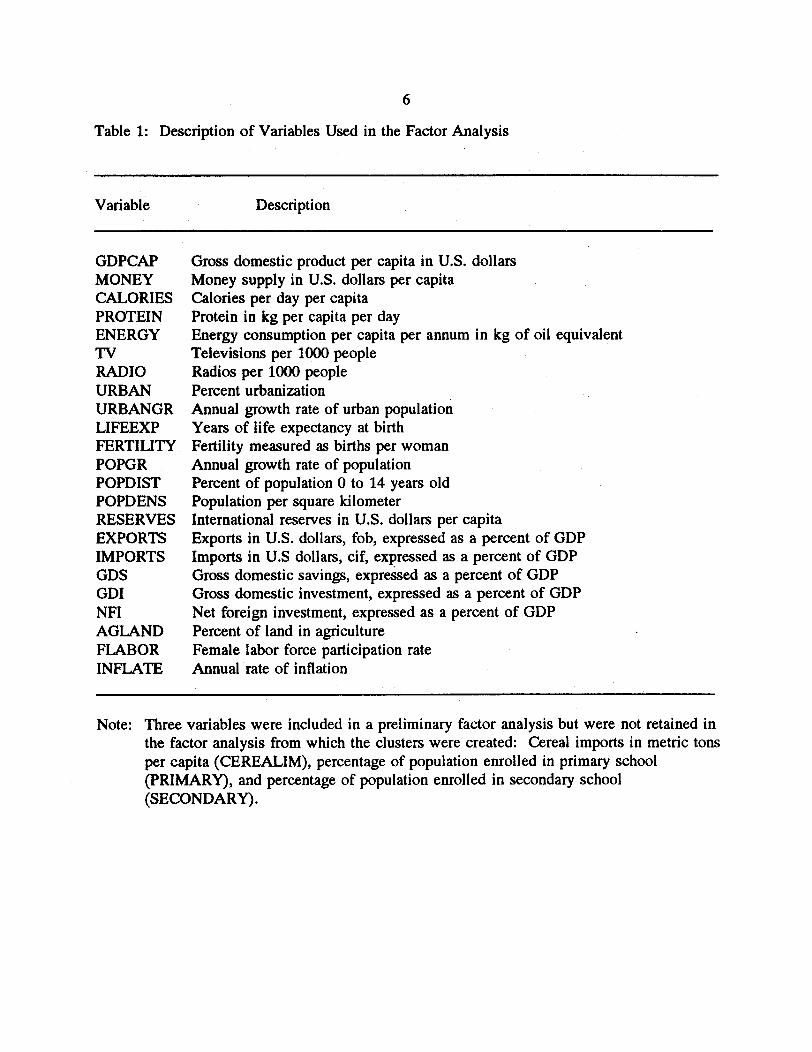
Table 1: Description of Variables Used in the Factor Analysis
Variable Description
GDPCAPMONEYCALORIESPROTEINENERGYTVRADIOURBAN-URBANGRLIFEEXPFERTILITYPOPGRPOPDISTPOPDENSRESERVESEXPORTSIMPORTSGDSGDINFIAGLANDFLABORINFLATE
Gross domestic product per capita in U.S. dollarsMoney supply in U.S. dollars per capitaCalories per day per capitaProtein in kg per capita per dayEnergy consumption per capita per annum in kg of oil equivalentTelevisions per 1000 peopleRadios per 1000 peoplePercent urbanizationAnnual growth rate of urban populationYears of life expectancy at birthFertility measured as births per womanAnnual growth rate of populationPercent of population 0 to 14 years oldPopulation per square kilometerInternational reserves in U.S. dollars per capitaExports in U.S. dollars, fob, expressed as a percent of GDPImports in U.S dollars, cif, expressed as a percent of GDPGross domestic savings, expressed as a percent of GDPGross domestic investment, expressed as a percent of GDPNet foreign investment, expressed as a percent of GDPPercent of land in agricultureFemale labor force participation rateAnnual rate of inflation
Note: Three variables were included in a preliminary factor analysis but were not retained inthe factor analysis from which the clusters were created: Cereal imports in metric tonsper capita (CEREALIM), percentage of population enrolled in primary school(PRIMARY), and percentage of population enrolled in secondary school(SECONDARY).
_ I __
_ _
7
RESULTS OF THE FACTOR AND CLUSTER ANALYSIS
Factor Analysis Results
The 26 variables were first factored using principal components. Three variablesincluded in the preliminary factor analyses were excluded from the final factoring used tocreate the clusters: cereal imports in MT/capita, percentage enrollment in primary school, andpercentage enrollment in secondary school. Cereal imports did not have a high loading onany factor and, thus, only contributed random noise to the analysis. Primary and secondaryschool did have high loadings, but only on Factor 1, which had high loadings on several othervariables. Including the education variables added less than one percent to the explanatorypower of the factors combined. As the education variables have many missing values, whichwould require deleting those countries from the data set, they were not included.
The factor analysis was repeated with the remaining 23 variables. The data setincluded 119 countries. These countries have a combined population of 3.3 billion (1989estimate) or approximately 66% of the worlds estimated population of 5 billion (IBRD, 1991).Data on other countries were not sufficient for their inclusion. Among those countriesexcluded were the former Soviet Union, several Asian countries (e.g., Afghanistan, Cambodia,Mongolia, and Vietnam) and most Caribbean and Pacific island nations.
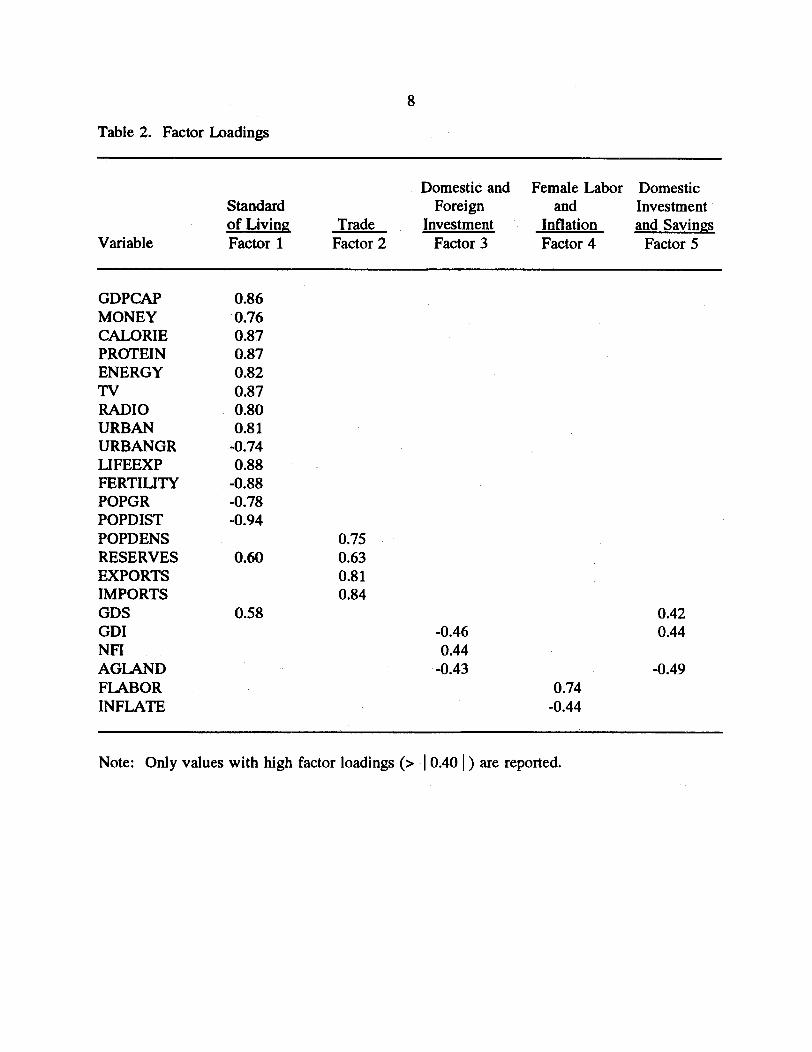
The results of the factor analysis are presented in Table 2. Using the minimumeigenvalue criterion of one, five factors, explaining 74% of the variance of the data set, areretained. These five factors represent the standard of living, the level of trade, the level ofdomestic and foreign investment, the participation of women in the labor force and the rate ofinflation, and the level of domestic savings and investment.
Factor 1, which represents standard of living, has high positive factor loadings for thevariables gross domestic product, money, international reserves, gross domestic savings,calorie and protein consumption, energy consumption, life expectancy, urbanization, andtelevisions and radios (Table 2). The variables fertility, population distribution, populationgrowth rate, and urban growth rate have high negative factor loadings.
Factor 2, which represents the level of trade, has high positive factor loadings for thevariables exports, imports, international reserves, and population density. Factor 3, whichrepresents domestic and foreign investment, has a high positive factor loading for net foreigninvestment and high negative factor loadings for gross domestic investment and percent ofland in agriculture.
Factor 4, which represents the participation of women in the labor force and the rateof inflation, has a high positive factor loading for female labor force participation and a highnegative factor loading for inflation. Factor 5, which represents domestic investment andsavings, has high positive factor loadings for gross domestic investment and gross domesticsavings and a high negative factor loading for the percent of land in agriculture.
8
Table 2. Factor Loadings
Domestic and Female Labor DomesticStandard Foreign and Investmentof Living Trade Investment Inflation and Savings
Variable Factor 1 Factor 2 Factor 3 Factor 4 Factor 5
GDPCAP 0.86MONEY 0.76CALORIE 0.87PROTEIN 0.87ENERGY 0.82TV 0.87RADIO 0.80URBAN 0.81URBANGR -0.74LIFEEXP 0.88FERTILITY -0.88POPGR -0.78POPDIST -0.94POPDENS 0.75RESERVES 0.60 0.63EXPORTS 0.81IMPORTS 0.84GDS 0.58 0.42GDI -0.46 0.44NFI 0.44AGLAND -0.43 -0.49FLABOR 0.74INFLATE -0.44
Note: Only values with high factor loadings (> 1 0.40 I) are reported.
9
Cluster Analysis Results
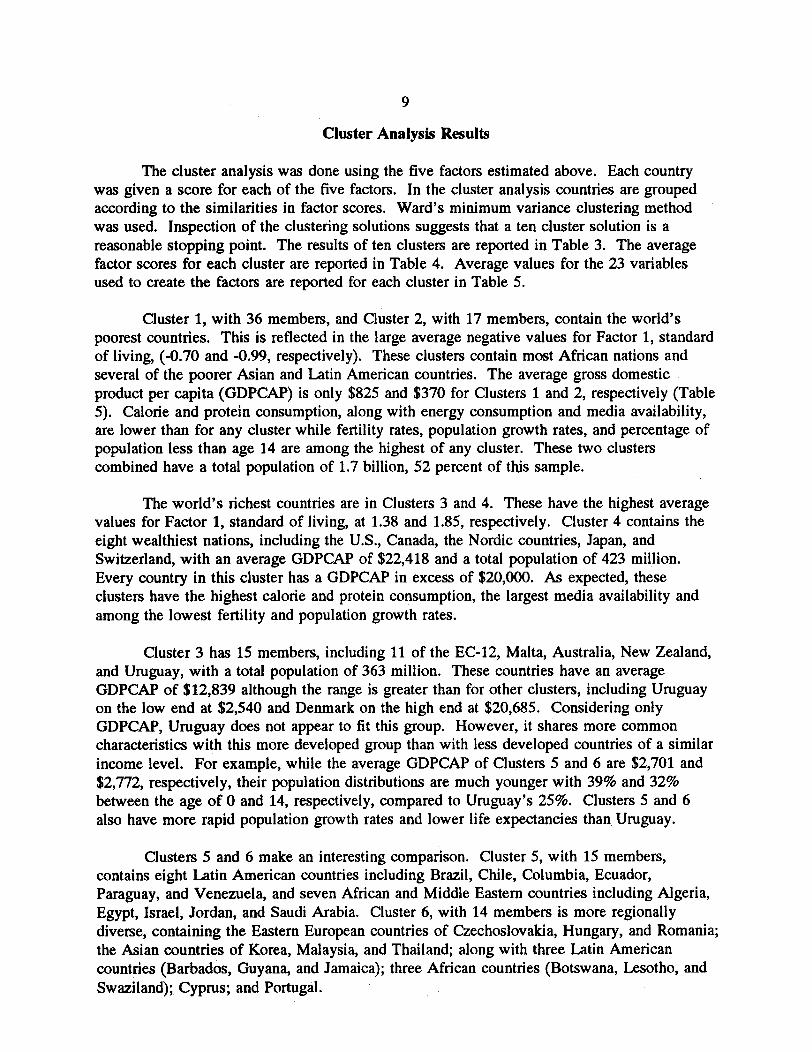
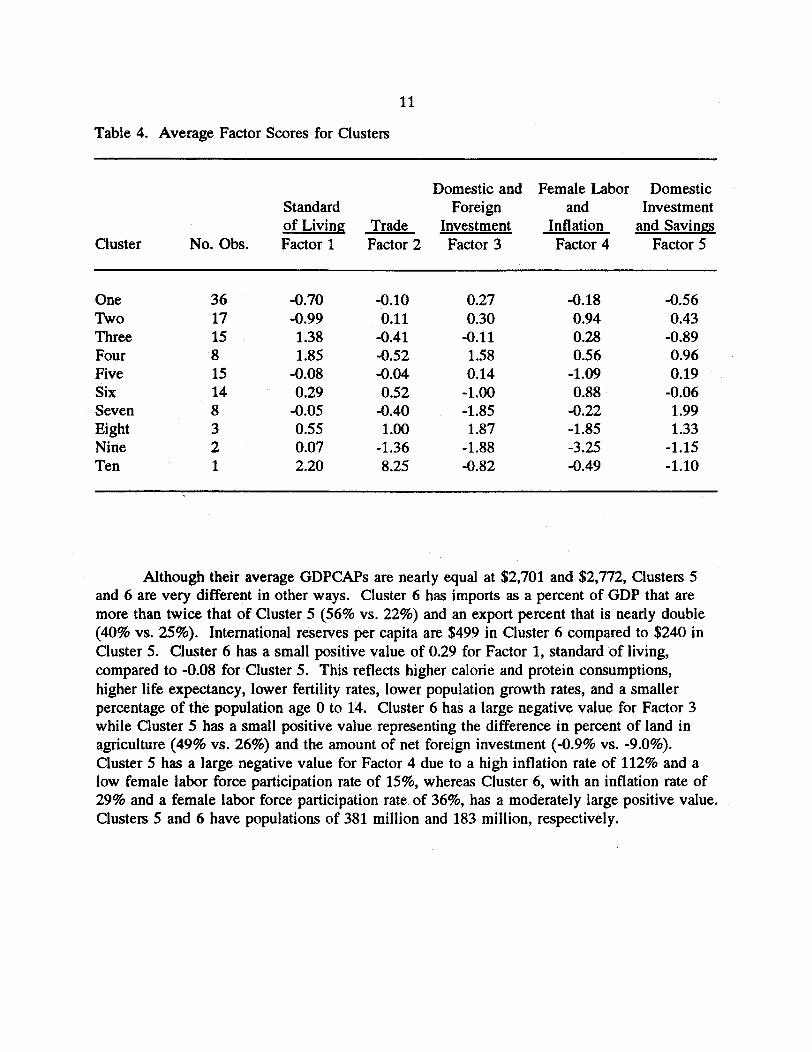
The cluster analysis was done using the five factors estimated above. Each countrywas given a score for each of the five factors. In the cluster analysis countries are groupedaccording to the similarities in factor scores. Ward's minimum variance clustering methodwas used. Inspection of the clustering solutions suggests that a ten cluster solution is areasonable stopping point. The results of ten clusters are reported in Table 3. The averagefactor scores for each cluster are reported in Table 4. Average values for the 23 variablesused to create the factors are reported for each cluster in Table 5.
Cluster 1, with 36 members, and Cluster 2, with 17 members, contain the world'spoorest countries. This is reflected in the large average negative values for Factor 1, standardof living, (-0.70 and -0.99, respectively). These clusters contain most African nations andseveral of the poorer Asian and Latin American countries. The average gross domesticproduct per capita (GDPCAP) is only $825 and $370 for Clusters 1 and 2, respectively (Table5). Calorie and protein consumption, along with energy consumption and media availability,are lower than for any cluster while fertility rates, population growth rates, and percentage ofpopulation less than age 14 are among the highest of any cluster. These two clusterscombined have a total population of 1.7 billion, 52 percent of this sample.
The world's richest countries are in Clusters 3 and 4. These have the highest averagevalues for Factor 1, standard of living, at 1.38 and 1.85, respectively. Cluster 4 contains theeight wealthiest nations, including the U.S., Canada, the Nordic countries, Japan, andSwitzerland, with an average GDPCAP of $22,418 and a total population of 423 million.Every country in this cluster has a GDPCAP in excess of $20,000. As expected, theseclusters have the highest calorie and protein consumption, the largest media availability andamong the lowest fertility and population growth rates.
Cluster 3 has 15 members, including 11 of the EC-12, Malta, Australia, New Zealand,and Uruguay, with a total population of 363 million. These countries have an averageGDPCAP of $12,839 although the range is greater than for other clusters, including Uruguayon the low end at $2,540 and Denmark on the high end at $20,685. Considering onlyGDPCAP, Uruguay does not appear to fit this group. However, it shares more commoncharacteristics with this more developed group than with less developed countries of a similarincome level. For example, while the average GDPCAP of Clusters 5 and 6 are $2,701 and$2,772, respectively, their population distributions are much younger with 39% and 32%between the age of 0 and 14, respectively, compared to Uruguay's 25%. Clusters 5 and 6also have more rapid population growth rates and lower life expectancies than Uruguay.
Clusters 5 and 6 make an interesting comparison. Cluster 5, with 15 members,contains eight Latin American countries including Brazil, Chile, Columbia, Ecuador,Paraguay, and Venezuela, and seven African and Middle Eastern countries including Algeria,
Egypt, Israel, Jordan, and Saudi Arabia. Cluster 6, with 14 members is more regionallydiverse, containing the Eastern European countries of Czechoslovakia, Hungary, and Romania;the Asian countries of Korea, Malaysia, and Thailand; along with three Latin Americancountries (Barbados, Guyana, and Jamaica); three African countries (Botswana, Lesotho, andSwaziland); Cyprus; and Portugal.
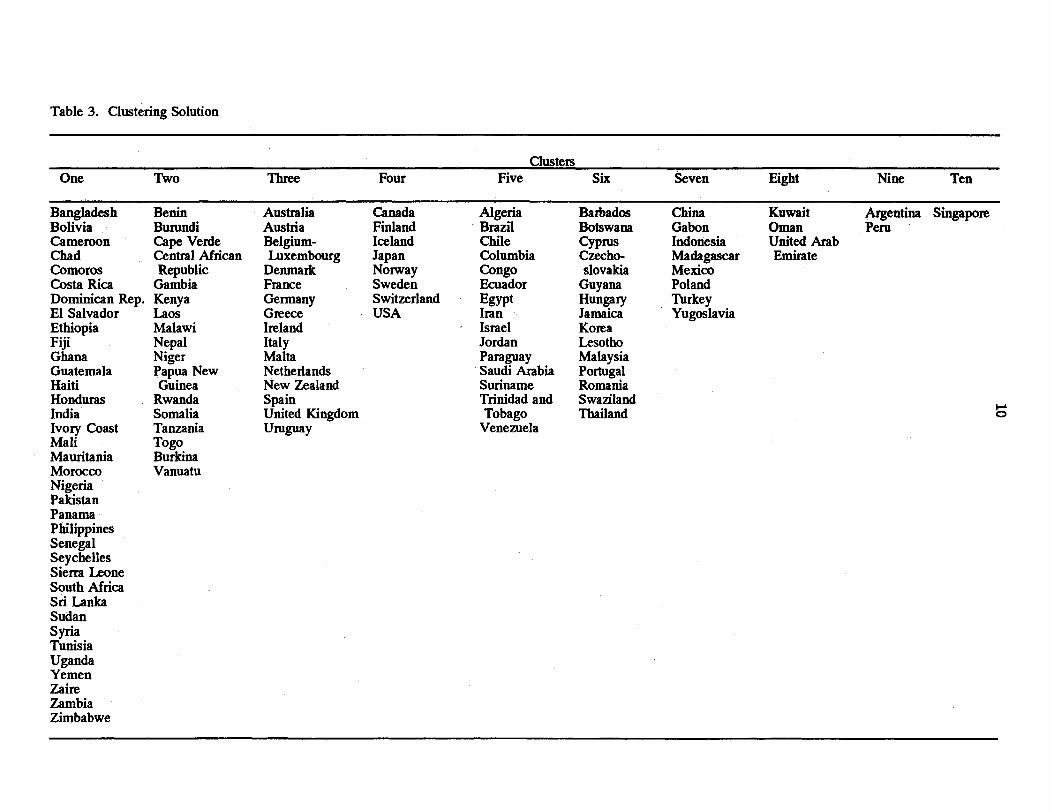
Table 3. Clustering Solution
ClustersOne Two Three Four Five Six Seven Eight Nine
BangladeshBoliviaCameroonChadComorosCosta RicaDominican Rep.El SalvadorEthiopiaFijiGhanaGuatemalaHaitiHondurasIndiaIvory CoastMaliMauritaniaMoroccoNigeriaPakistanPanamaPhilippinesSenegalSeychellesSierra LeoneSouth AfricaSri LankaSudanSyriaTunisiaUgandaYemenZaireZambiaZimbabwe
BeninBurundiCape VerdeCentral AfricanRepublic
GambiaKenyaLaosMalawiNepalNigerPapua NewGuinea
RwandaSomaliaTanzaniaTogoBurkinaVanuatu
AustraliaAustriaBelgium-Luxembourg
DenmarkFranceGermanyGreeceIrelandItalyMaltaNetherlandsNew ZealandSpainUnited KingdomUruguay
CanadaFinlandIcelandJapanNorwaySwedenSwitzerlandUSA
AlgeriaBrazilChileColumbiaCongoEcuadorEgyptIranIsraelJordanParaguaySaudi ArabiaSurinameTrinidad andTobago
Venezuela
BarbadosBotswanaCyprusCzecho-slovakia
GuyanaHungaryJamaicaKoreaLesothoMalaysiaPortugalRomaniaSwazilandThailand
ChinaGabonIndonesiaMadagascarMexicoPolandTurkeyYugoslavia
KuwaitOmanUnited ArabEmirate
Ten
Argentina SingaporePeru
11
Table 4. Average Factor Scores for Clusters
Domestic and Female Labor DomesticStandard Foreign and Investmentof Living Trade Investment Inflation and Savings
Cluster No. Obs. Factor 1 Factor 2 Factor 3 Factor 4 Factor 5
One 36 -0.70 -0.10 0.27 -0.18 -0.56Two 17 -0.99 0.11 0.30 0.94 0.43Three 15 1.38 -0.41 -0.11 0.28 -0.89Four 8 1.85 -0.52 1.58 0.56 0.96Five 15 -0.08 -0.04 0.14 -1.09 0.19Six 14 0.29 0.52 -1.00 0.88 -0.06Seven 8 -0.05 -0.40 -1.85 -0.22 1.99Eight 3 0.55 1.00 1.87 -1.85 1.33Nine 2 0.07 -1.36 -1.88 -3.25 -1.15Ten 1 2.20 8.25 -0.82 -0.49 -1.10
Although their average GDPCAPs are nearly equal at $2,701 and $2,772, Clusters 5and 6 are very different in other ways. Cluster 6 has imports as a percent of GDP that aremore than twice that of Cluster 5 (56% vs. 22%) and an export percent that is nearly double(40% vs. 25%). International reserves per capita are $499 in Cluster 6 compared to $240 inCluster 5. Cluster 6 has a small positive value of 0.29 for Factor 1, standard of living,compared to -0.08 for Cluster 5. This reflects higher calorie and protein consumptions,higher life expectancy, lower fertility rates, lower population growth rates, and a smallerpercentage of the population age 0 to 14. Cluster 6 has a large negative value for Factor 3while Cluster 5 has a small positive value representing the difference in percent of land inagriculture (49% vs. 26%) and the amount of net foreign investment (-0.9% vs. -9.0%).Cluster 5 has a large negative value for Factor 4 due to a high inflation rate of 112% and alow female labor force participation rate of 15%, whereas Cluster 6, with an inflation rate of29% and a female labor force participation rate of 36%, has a moderately large positive value.Clusters 5 and 6 have populations of 381 million and 183 million, respectively.
12
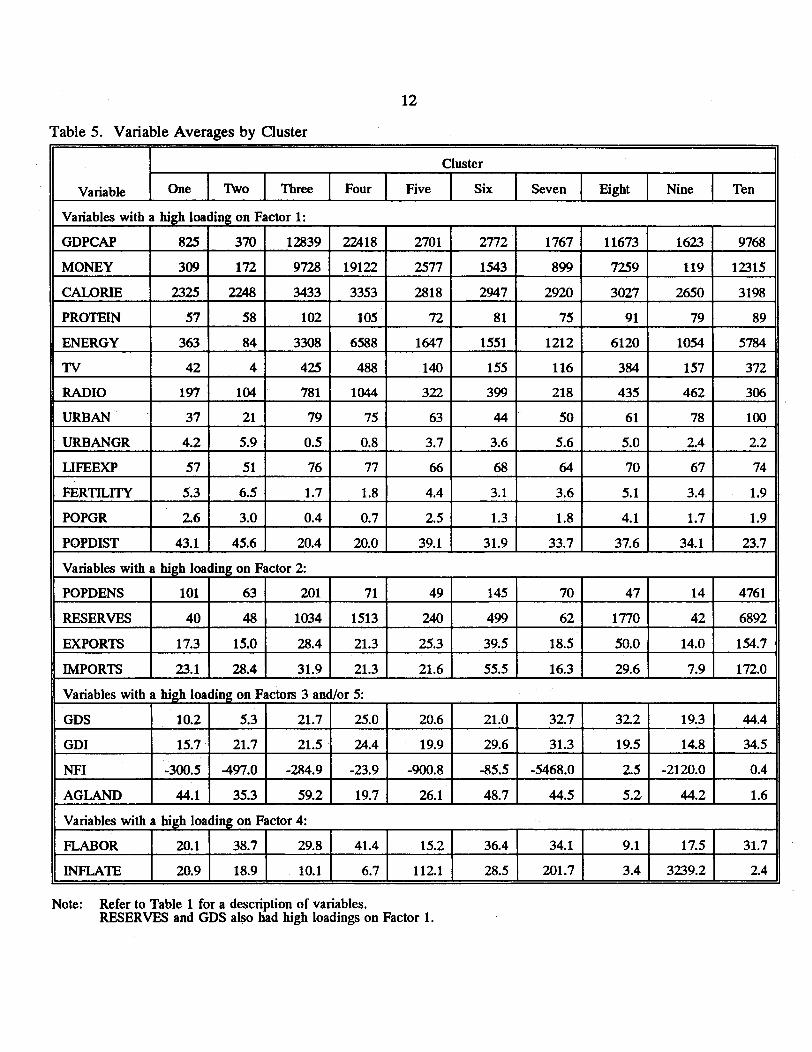
Table 5. Variable Averages by Cluster
Cluster
Variable One Two Three Four Five Six Seven Eight Nine Ten
Variables with a high loading on Factor 1:
GDPCAP 825 370 12839 22418 2701 2772 1767 11673 1623 9768
MONEY 309 172 9728 19122 2577 1543 899 7259 119 12315
CALORIE 2325 2248 3433 3353 2818 2947 2920 3027 2650 3198
PROTEIN 57 58 102 105 72 81 75 91 79 89
ENERGY 363 84 3308 6588 1647 1551 1212 6120 1054 5784
TV 42 4 425 488 140 155 116 384 157 372
RADIO 197 104 781 1044 322 399 218 435 462 306
URBAN 37 21 79 75 63 44 50 61 78 100
URBANGR 4.2 5.9 0.5 0.8 3.7 3.6 5.6 5.0 2.4 2.2
LIFEEXP 57 51 76 77 66 68 64 70 67 74
FERTILITY 5.3 6.5 1.7 1.8 4.4 3.1 3.6 5.1 3.4 1.9
POPGR 2.6 3.0 0.4 0.7 2.5 1.3 1.8 4.1 1.7 1.9
POPDIST 43.1 45.6 20.4 20.0 39.1 31.9 33.7 37.6 34.1 23.7
Variables with a high loading on Factor 2:
POPDENS 101 63 201 71 49 145 70 47 14 4761
RESERVES 40 48 1034 1513 240 499 62 1770 42 6892
EXPORTS 17.3 15.0 28.4 21.3 25.3 39.5 18.5 50.0 14.0 154.7
IMPORTS 23.1 28.4 31.9 21.3 21.6 55.5 16.3 29.6 7.9 172.0
Variables with a high loading on Factors 3 and/or 5:
GDS 10.2 5.3 21.7 25.0 20.6 21.0 32.7 32.2 19.3 44.4
GDI 15.7 21.7 21.5 24.4 19.9 29.6 31.3 19.5 14.8 34.5
NFI -300.5 -497.0 -284.9 -23.9 -900.8 -85.5 -5468.0 2.5 -2120.0 0.4
AGLAND 44.1 35.3 59.2 19.7 26.1 48.7 44.5 5.2 44.2 1.6
Variables with a high loading on Factor 4:
FLABOR 20.1 38.7 29.8 41.4 15.2 36.4 34.1 9.1 17.5 31.7
INFLATE 20.9 18.9 10.1 6.7 112.1 28.5 201.7 3.4 3239.2 2.4
Note: Refer to Table 1 for a description of variables.RESERVES and GDS also had high loadings on Factor 1.
13
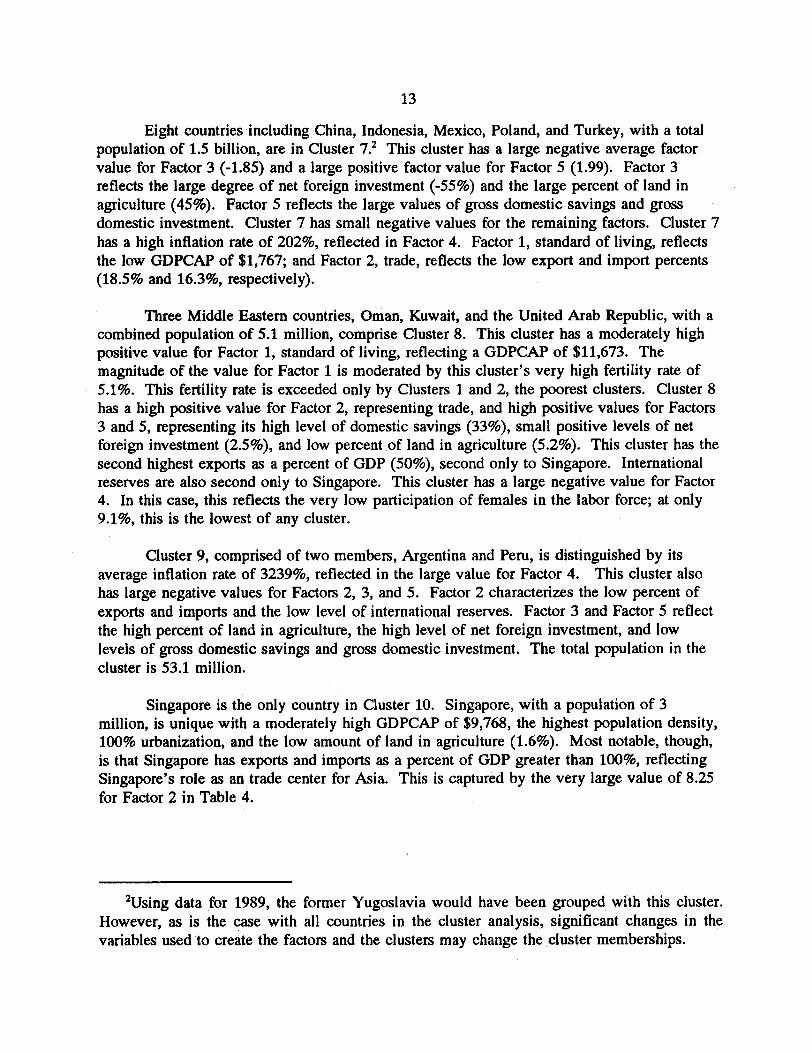
Eight countries including China, Indonesia, Mexico, Poland, and Turkey, with a totalpopulation of 1.5 billion, are in Cluster 7.2 This cluster has a large negative average factorvalue for Factor 3 (-1.85) and a large positive factor value for Factor 5 (1.99). Factor 3reflects the large degree of net foreign investment (-55%) and the large percent of land inagriculture (45%). Factor 5 reflects the large values of gross domestic savings and grossdomestic investment. Cluster 7 has small negative values for the remaining factors. Cluster 7has a high inflation rate of 202%, reflected in Factor 4. Factor 1, standard of living, reflectsthe low GDPCAP of $1,767; and Factor 2, trade, reflects the low export and import percents(18.5% and 16.3%, respectively).
Three Middle Eastern countries, Oman, Kuwait, and the United Arab Republic, with acombined population of 5.1 million, comprise Cluster 8. This cluster has a moderately highpositive value for Factor 1, standard of living, reflecting a GDPCAP of $11,673. Themagnitude of the value for Factor 1 is moderated by this cluster's very high fertility rate of5.1%. This fertility rate is exceeded only by Clusters 1 and 2, the poorest clusters. Cluster 8has a high positive value for Factor 2, representing trade, and high positive values for Factors3 and 5, representing its high level of domestic savings (33%), small positive levels of netforeign investment (2.5%), and low percent of land in agriculture (5.2%). This cluster has thesecond highest exports as a percent of GDP (50%), second only to Singapore. Internationalreserves are also second only to Singapore. This cluster has a large negative value for Factor4. In this case, this reflects the very low participation of females in the labor force; at only9.1%, this is the lowest of any cluster.
Cluster 9, comprised of two members, Argentina and Peru, is distinguished by itsaverage inflation rate of 3239%, reflected in the large value for Factor 4. This cluster alsohas large negative values for Factors 2, 3, and 5. Factor 2 characterizes the low percent ofexports and imports and the low level of international reserves. Factor 3 and Factor 5 reflectthe high percent of land in agriculture, the high level of net foreign investment, and lowlevels of gross domestic savings and gross domestic investment. The total population in thecluster is 53.1 million.
Singapore is the only country in Cluster 10. Singapore, with a population of 3million, is unique with a moderately high GDPCAP of $9,768, the highest population density,100% urbanization, and the low amount of land in agriculture (1.6%). Most notable, though,is that Singapore has exports and imports as a percent of GDP greater than 100%, reflectingSingapore's role as an trade center for Asia. This is captured by the very large value of 8.25for Factor 2 in Table 4.
2Using data for 1989, the former Yugoslavia would have been grouped with this cluster.However, as is the case with all countries in the cluster analysis, significant changes in thevariables used to create the factors and the clusters may change the cluster memberships.
14
SUMMARY AND CONCLUSIONS
Segmenting the global market for value-added agricultural products is a necessary firststep in targeting markets for future trade. In the past, most research predicting growthmarkets for agricultural products used past growth rates for individual countries to predicttheir future growth rates. However, using past growth rates to predict future consumptionmay understate a country's potential if it is not currently a customer. This research avoidsmany of the difficulties in past research on agricultural marketing by clustering countries withlike characteristics. While previous research has clustered the global market using economicand trade variables, this research also included variables affecting total and value-added foodconsumption, such as calorie consumption, age distribution, media availability, and femalelabor force participation. Using the latest year of complete data, 1989, 119 countries wereclustered into ten clusters.
These ten clusters have practical considerations for trade in value-added agriculturalproducts. Clusters 1 and 2, with the world's poorest countries, are dominated by their lowstandard of living and are unlikely candidates for considerable growth in consumption ofvalue-added products in the near future. However, these markets may be candidates forcommodities or intermediate processed goods. Clusters 3 and 4, with the world's 23 richestcountries, Cluster 8, with Kuwait, Oman, and the United Arab Emirates; and Cluster 10,Singapore, are excellent candidates for current and future consumption of value-addedproducts. In fact, within these clusters there is intense competition for the value-addedmarket. Issues of primary concern in these clusters are product development, logistics, policy,and tariff and non tariff barriers.
The nations of the most interest for potential future consumption of value-addedagricultural goods are in Clusters 5, 6, and 7. Of these three clusters, the 14 members ofCluster 6 (Korea, Malaysia, Thailand, and Portugal, among others) are better positioned toenter into trade in value-added agricultural products in the near future. Cluster 5, with 15members, including eight Latin American members and six Middle Eastern and North Africanmembers, has an income nearly equal to Cluster 6. However, Cluster 6 has higher export andimport percents, higher levels of international reserves, higher calorie and proteinconsumptions, and a higher female labor force participation rate. Cluster 7 with eightmembers (Mexico, China, and Indonesia, among others), has few indicators of rapidconsumption growth in the near future, but it does have indicators of becoming a consumer ofvalue-added goods in the longer run. These indicators include the high level of net foreigninvestment along with relatively high levels of gross domestic savings and investment.
Identifying segments of the global market is a necessary first step for successfulinternational marketing. Development of a successful marketing strategy requires manyadditional considerations, including product formulation, global competition, choice of entrymode, logistics, and tariff and non tariff barriers. Knowledge of market segments can aid indeveloping market strategies for different clusters. Countries with little potential for growthin value-added product consumption can be targeted with commodities or intermediate valuegoods. Countries that have the greatest potential for future growth in consumption of value-added trade can be targeted for further market analysis.
15
REFERENCES
Asp, E.H. (1992). "Consumer Lifestyles Are a Key to Food Marketing." Cereal Foods World.Vol. 37(4):311-318.
Berlage, Lodewijk and Dirk Terweduwe. (1988). "The Classification of Countries by Clusterand Factor Analysis." World Development. Vol. 16(12):1527-45.
Bernstein, Ira H. (1988). Applied Multivariate Analysis. Springer-Verlag, New York, NewYork.
Central Intelligence Agency. (1991). The World Factbook, 1991. Washington, D.C.
Day, Ellen, Richard J. Fox and Sandra M. Huszagh. (1988). "Segmenting the Global Marketfor Industrial Goods: Issues and Implications." International Marketing Review. Vol.5(3):14-27.
Dickson, Peter R. and James L. Ginter. (1987). "Market Segmentation, ProductDifferentiation, and Marketing Strategy." The Journal of Marketing. Vol. 51(2):1-10.
Dillon, William R. and Narendra Mulani. (1989). "LADI: A Latent Discriminant Model ofAnalyzing Marketing Research Data." Journal of Marketing Research. Vol. 26:15-29.
Foreign Agricultural Service. (1991, January). "Star Gazing: Markets with the BrightestPotential." AgExporter, pp. 4-9. Washington, D.C.: U.S. Department of Agriculture.
Funk, Thomas F. and Willard Phillips. (1990). "Segmenting of the Market for Table Eggs inOntario." Agribusiness: An International Journal. Vol. 6(4):309-27.
Gould, Brian W., Thomas L. Cox, and Federico Perali. (1991). "Demand for Food Fats andOils: The Role of Demographic Variables and Government Donations." AmericanJournal of Agricultural Economics. Vol. 73(1):212-21.
Green, Paul E. and Abba M. Krieger. (1991). "Segmenting Markets with Conjoint Analysis."The Journal of Marketing. Vol. 55(4):20-31.
Grover, Rajiv and V. Srinivasan. (1987). "A Simultaneous Approach to Market Segmentationand Market Structuring." Journal of Marketing Research. Vol. 24: 139-53.
Huszagh, Sandra M., Richard J. Fox, and Ellen Day. (1986). "Global Marketing: AnEmpirical Investigation." Columbia Journal of World Business. Vol. 20(4):31-43.
International Bank for Reconstruction and Development (IBRD)/ World Bank. (1991). WorldTables. New York.
16
International Bank for Reconstruction and Development (IBRD)/ World Bank. (1991-92).Social Indicator of Development. New York.
International Monetary Fund. (1993). International Financial Statistics Yearbook, 1993.Washington, D.C.
Kamakura, Wagner A. and Gary J. Russell. (1989). "A Probabilistic Choice Model for MarketSegmentation and Elasticity Structure." Journal of Marketing Research. Vol. 26:379-90.
Kaufman, Leonard and Peter J. Rousseeuw. (1990). Finding Groups in Data: An Introductionto Cluster Analysis. John Wiley & Sons, Inc. New York, New York.
Kinsey, Jean. (1983). "Working Wives and the Marginal Propensity to Consume Food AwayFrom Home." Vol 65(1):10-19.
Kruskal, Joseph. (1977). "The Relationship between Multidimensional Scaling andClustering." in Classification and Clustering. J. Van Ryzin, ed., Academic Press, Inc.pp:17-43.
Lee, Jung-Hee, David Henneberry, and David Pyles. (1991). "An Analysis of Value-AddedAgricultural Exports to Middle-Income Developing Countries: The Case of Wheat andBeef Exports." The Southern Journal of Agricultural Economics. Vol. 23(2):141-154.
Milligan, Glenn W. (1980). "An Examination of the Effect of Six Types of Error Perturbationon Fifteen Clustering Algorithms." Psychometrika. Vol. 45(3):325-342.
Milligan, Glenn W. and Martha C. Cooper. (1985). "An Examination of Procedures forDetermining the Number of Clusters in a Data Set." Psychometrika. Vol. 50(2):159-179.
Punj, Girish and David W. Stewart. (1983). "Cluster Analysis in Marketing Research: Reviewand Suggestions for Application." Journal of Marketing Research. Vol. 20:134 -48.
Redman, Barbara. (1980). "The Impact of Women's Time Allocation on Expenditure forMeals Away From Home and Prepared Foods." American Journal of AgriculturalEconomics. Vol 62(1):234-37.
Salvacruz, Joseph and Michael Reed. (1993). "Identifying the Best Market Prospects for U.S.Agricultural Exports." Agribusiness: An International Journal. Vol. 9(1):29-41.
Sethi, S. Prakash. (1971). "Comparative Cluster Analysis for World Markets." Journal ofMarketing Research. Vol. 18:348-54.
17
Sriram, Ven and Pradeep Gopalakrishna. (1991). "Can Advertising be Standardized AmongSimilar Countries? A Cluster-Based Analysis." International Journal of Advertising.Vol. 10:137-149.
United Nations. (1993). Statistical Yearbook, 1991-92. New York.
Wind, Yoram. (1978). "Issues and Advances in Segmentation Research." Journal ofMarketing Research. Vol. 15:317-37.
cjj/global.rpt