Embed Size (px)
Citation preview

GLOBALM&A MARKET REVIEWFINANCIAL RANKINGS1Q 2017

CONTENTS
1. Introduction2. Global M&A Heat Map3. Global M&A Regional Review4. Global M&A League Tables5. Americas M&A Regional Review6. Americas M&A League Tables8. EMEA M&A Regional Review9. EMEA M&A League Tables12. APAC M&A Regional Review13. APAC M&A League Tables16. Disclaimer
DATA SUBMISSIONS AND QUERIES
Contact Phone Email North America Meaghan Burke +1-646-324-1537 [email protected]
EMEA Madeeha Ahmad +44-20-3525-3754 [email protected]
Asia Pacific Ee Wen Tay +65-6231-3404 [email protected]
General M&A queries may be submitted to: [email protected], [email protected], [email protected]
The Bloomberg M&A Advisory League Tables are the definitive publication of M&A advisory rankings. The tables represent the top financial and legal advisors across a broad array of deal types, regions, and industry sectors. The rankings data is comprised of mergers, acquisitions, divestitures, spin-offs, debt-for-equity-swaps, joint ventures, private placements of common equity and convertible securities, and the cash injection component of recapitalization according to Bloomberg standards.
Bloomberg M&A delivers real-time coverage of the M&A market from nine countries around the world. We provide a global perspective and local insight into unique deal structures in various markets through a network of over 800 financial and legal advisory firms, ensuring an accurate reflection of key market trends. Our quarterly league table rankings are a leading benchmark for legal and financial advisory performance, and our Bloomberg Brief newsletter provides summary highlights of weekly M&A activity and top deal trends.
Visit {NI LEAG CRL <GO>} to download copies of the final release and a full range of market specific league table results. On the web, visit: http://www.bloomberg.com/professional/solutions/investment-banking/.
Due to the dynamic nature of the Professional Service product, league table rankings may vary between this release and data found on the Bloomberg Professional Service.
Q1 2017
GLOBAL M&A FINANCIAL ADVISORY RANKINGS
©2017 Bloomberg Finance L.P. All rights reserved.

Global M&A Heat Map
Deal volume and adviser market share for any regional involvement (target, seller, or acquirer) for Q1 2017.
Eastern Europe USD 11.7B 1. Morgan Stanley 16.4% 2. Deutsche Bank AG 15.9% 3. VTB Capital ZAO 10.3%
Asia Pacific USD 234.8B 1. Goldman Sachs & Co 14.4% 2. Morgan Stanley 13.5% 3. UBS AG 9.3%
Western Europe USD 278.4B 1. Bank of America Merrill Lynch 34.3% 2. Citigroup Inc 28.7% 3. Lazard Ltd 22.1%
Latin America & Caribbean USD 45.0B 1. Credit Suisse Group AG 40.3% 2. Morgan Stanley 10.5% 3. Barclays PLC 5.7%
Middle East & Africa USD 19.6B 1. Lazard Ltd 13.6% 2. Goldman Sachs & Co 12.6% 3. Morgan Stanley 11.5%
North America USD 441.2B 1. Morgan Stanley 24.4% 2. Goldman Sachs & Co 22.9% 3. JP Morgan Chase & Co 19.2%
2

DateTotal Value
Amount (Bln.) % of Total
% YoY Change
Number of deals 9,783 Financial $173.0 23.4% 17.2%
Volume (Bln.) $729.0 Consumer Non‐cyclical $147.5 20.0% ‐5.1%
Avg Deal Size (Mln.) $74.5 Energy $115.3 15.6% 142.4%
Consumer Cyclical $88.0 11.9% ‐26.0%
Industrial $62.3 8.4% ‐18.6%
Morgan Stanley Communications $50.7 6.9% 16.4%
Number of deals 74 Utilities $41.5 5.6% 3.7%
Volume (Bln.) $141.1 Technology $36.8 5.0% ‐23.3%
Avg Deal Size (Bln.) $1.9 Basic Materials $19.8 2.7% ‐76.0%
Diversified $4.0 0.5% ‐38.2%
Amount (Bln.)
% Change Deal Count
% Change Volume
Company Takeover $390.8 ‐4.9% ‐14.3%
Cross Border $353.1 1.2% 0.9%
Private Equity $174.4 1.1% 3.4%
Asset Sale $166.3 18.1% 58.4%
Tender Offer $103.4 28.0% 14.6%
Venture Capital $24.4 ‐0.3% ‐30.1%
Spin‐off $2.7 ‐2.0% ‐89.8%
Minority Purchase $89.1 2.2% ‐3.2%
Majority Purchase $50.5 11.8% ‐10.7%
Quarterly Volume represents any involvement (target, seller, or acquirer).
Deal Type
Global M&A: Deal Type Breakdown
Essilor International SA
‐
1/26/2017 $29,762.2
2/10/2017 $17,809.8Mead Johnson Nutrition Co Reckitt Benckiser Group PLC ‐
3/31/2017
Top Adviser
$14,699.3Bradford & Bingley assets Multiple AcquirersUnited Kingdom of Great Britain and Northern Ireland
Delfin SarlLuxottica Group SpA
2/1/2017 $17,378.2
1/16/2017 $16,608.8
ONEOK Partners LP ONEOK Inc
Global M&A: Industry Breakdown
Global M
&A Re
view
| Q1 2017
Global M&A Regional Review Global M&A: Premium Breakdown
Global M&A: Highlights of Q1 2017
Summary IndustryAcquirerTarget Seller
Actelion Ltd Johnson & Johnson ‐
Global M&A: Quarterly Volume
0
2,000
4,000
6,000
8,000
10,000
12,000
$0
$200
$400
$600
$800
$1,000
$1,200
$1,400
2012 Q1 2013 Q1 2014 Q1 2015 Q1 2016 Q1 2017 Q1
Volume $(Bln.) Deal Count
12%
46%
37%
2% 3% 0%0‐10%
10‐25%
25‐50%
50‐75%
75‐100%
100%+
• The global merger and acquisition activity reached $729.0 billion in Q12017, representing the lowestquarterly volume since Q12014. Johnson & Johnson’s announced acquisition of Actelion Ltd for $29.8billion was the largest transaction for the period.
• Private equity transactions reached a Q12017 volume of $174.4 billion, accounting for 23.9% of the globalvolume for the period. Advent International Corp’s pending acquisition of STADA Arzneimittel AG for $5.3billion was the largest announced private equity buyout for the quarter.
• Asset sales targeting the energy sector have increased 239.8% in volume year‐on‐year to $39.1 billion.Royal Dutch Shell PLC’s announced sale of its Athabasca oil sands project to Canadian Natural Resources Ltd for $8.26 billion was the largest global energy asset sale in Q12017.
3

Global Announced Deals 01/01/2017 ‐ 03/31/2017 Cross Border Announced Deals 01/01/2017 ‐ 03/31/2017
Morgan Stanley 1 19.4 141,119 74 2 24.7 ‐5.3 Bank of America Merrill Lynch 1 25.0 88,205 24 14 10.5 14.4Goldman Sachs & Co 2 18.1 132,053 75 1 32.2 ‐14.1 Goldman Sachs & Co 2 24.2 85,370 48 1 40.9 ‐16.7Citigroup Inc 3 16.2 118,219 51 5 16.5 ‐0.2 Citigroup Inc 3 22.6 79,827 27 10 14.6 8.0Bank of America Merrill Lynch 4 16.2 117,887 43 7 13.0 3.2 Morgan Stanley 4 22.1 78,146 41 2 37.9 ‐15.8JPMorgan Chase & Co 5 14.3 104,376 55 3 20.2 ‐5.9 Lazard Ltd 5 18.7 65,927 34 4 24.1 ‐5.5Rothschild & Co 6 11.6 84,519 61 13 6.4 5.2 JPMorgan Chase & Co 6 16.3 57,607 25 3 27.6 ‐11.3Lazard Ltd 7 11.4 82,923 55 4 17.2 ‐5.8 Rothschild & Co 7 15.1 53,423 39 16 9.9 5.2Credit Suisse Group AG 8 10.2 74,059 37 8 12.6 ‐2.5 Credit Suisse Group AG 8 11.8 41,731 16 5 21.4 ‐9.5Barclays PLC 9 9.0 65,492 44 6 15.0 ‐6.0 Robey Warshaw LLP 9 8.8 31,082 3 ‐ ‐ 8.8BNP Paribas SA 10 5.6 40,666 16 37 1.1 4.5 ALANTRA 10 8.5 29,890 8 49 0.4 8.0Evercore Partners Inc 11 5.5 39,832 33 14 6.4 ‐0.9 BNP Paribas SA 11 8.3 29,179 9 36 1.3 6.9UBS AG 12 5.3 38,406 31 10 10.2 ‐4.9 Deutsche Bank AG 12 8.1 28,693 12 11 13.9 ‐5.8RBC Capital Markets 13 5.0 36,145 31 18 4.3 0.6 UBS AG 13 7.5 26,430 19 6 18.7 ‐11.3Deutsche Bank AG 14 4.5 32,895 22 9 11.5 ‐7.0 RBC Capital Markets 14 6.3 22,335 10 29 2.2 4.1Robey Warshaw LLP 15 4.3 31,082 3 94 0.2 4.1 HSBC Bank PLC 15 6.2 21,774 8 9 15.9 ‐9.7ALANTRA 16 4.1 29,890 11 84 0.2 3.9 Barclays PLC 16 4.7 16,686 15 8 16.3 ‐11.6HSBC Bank PLC 17 3.5 25,780 11 12 9.7 ‐6.2 Mediobanca SpA 17 4.7 16,609 1 ‐ ‐ 4.7Centerview Partners LLC 18 2.7 19,914 13 17 5.8 ‐3.1 Kotak Mahindra Bank Ltd 18 4.0 13,978 6 136 0.0 3.9Mediobanca SpA 19 2.3 16,609 1 48 0.8 1.5 Evercore Partners Inc 19 3.8 13,375 13 15 10.3 ‐6.5Raymond James & Associates Inc 20 2.2 15,717 24 113 0.1 2.1 Axis Bank Ltd 20 3.8 13,272 2 96 0.1 3.7
TOTAL 729,091 9,786 TOTAL 353,279 3,599
Global Private Equity Announced Deals 01/01/2017 ‐ 03/31/2017
Morgan Stanley 1 24.0 41,767 29 11 8.3 15.6Credit Suisse Group AG 2 16.7 29,098 9 5 15.2 1.5Goldman Sachs & Co 3 12.9 22,452 24 1 26.1 ‐13.2Citigroup Inc 4 12.4 21,604 17 6 13.1 ‐0.7JPMorgan Chase & Co 5 12.2 21,222 22 3 18.0 ‐5.8Barclays PLC 6 11.9 20,768 17 4 16.4 ‐4.5Bank of America Merrill Lynch 7 8.8 15,365 12 2 18.9 ‐10.1Centerview Partners LLC 8 7.2 12,619 8 54 0.3 7.0Rothschild & Co 9 7.2 12,520 27 16 6.1 1.1RBC Capital Markets 10 6.4 11,209 14 8 11.9 ‐5.5UBS AG 11 5.9 10,327 10 9 11.3 ‐5.4Lazard Ltd 12 4.1 7,171 20 10 10.5 ‐6.4Moelis & Co 13 4.1 7,100 8 27 1.2 2.9Deutsche Bank AG 14 3.7 6,495 8 7 13.1 ‐9.3Evercore Partners Inc 15 3.4 5,940 10 42 0.6 2.9AlixPartners LLP 16 2.7 4,763 2 ‐ ‐ 2.7HSBC Bank PLC 17 2.7 4,716 3 21 1.8 0.9Societe Generale SA 18 1.9 3,372 1 59 0.2 1.7Highbury Partnership Pty Ltd 19 1.8 3,080 1 ‐ ‐ 1.8BMO Capital Markets 20 1.7 2,914 3 46 0.5 1.2
TOTAL 174,396 2,801 168,702
2016MKT SHR CHANGERANK
MKT SHR (%)
VOLUME USD (Mln)
DEAL COUNT RANK
MKT SHR (%) RANK
2017 2016MKT SHR CHANGE FIRM
2017MKT SHR
(%)VOLUME USD
(Mln)DEAL COUNT RANK
MKT SHR (%)
FIRM
2017 2016MKT SHR CHANGE
FIRM
RANKMKT SHR
(%)VOLUME USD
(Mln)DEAL COUNT RANK
MKT SHR (%)
747,037 350,074
4

Country
United States $279.0 81.9% -14.3%
Canada $43.3 12.7% 104.4%
Brazil $11.2 3.3% 200.9%
British Virgin Islands $3.9 1.2% 300.3%
Mexico $1.3 0.4% 62.7%
Chile $0.3 0.1% -95.9%
Colombia $0.0 0.0% -99.4%
Bermuda $0.0 0.0% 32.5%
Date
Total Value
(Mln.)
Amount
(Bln.) % of Total
% YoY
Change
Number of deals 4,220 Energy $81.7 23.8% 149.1%
Volume (Bln.) $340.4 Consumer Non-cyclical $78.6 22.9% -17.3%
Avg Deal Size (Mln.) $80.7 Financial $62.6 18.2% 30.7%
Consumer Cyclical $30.8 9.0% -57.0%
Utilities $30.1 8.8% -12.0%
Morgan Stanley Technology $21.7 6.3% -25.1%
Number of deals 40 Industrial $16.3 4.7% -21.3%
Volume (Bln.) $96.6 Communications $15.8 4.6% -24.2%
Avg Deal Size (Bln.) $2.4 Basic Materials $5.8 1.7% -63.7%
Diversified $0.1 0.0% -88.3%
Amount
(Bln.)
% Change
Deal Count
% Change
Volume
Company Takeover $204.2 -4.9% -18.8%
Cross Border $135.9 8.7% -11.6%
Private Equity $89.4 -3.2% -0.4%
Asset Sale $88.0 31.7% 65.4%
Tender Offer $35.5 35.7% 445.9%
Venture Capital $13.3 -8.0% -19.3%
Spin-off $2.0 4.3% -90.8%
Minority Purchase $22.0 -4.8% -15.6%
Majority Purchase $10.5 24.3% 34.5%
Quarterly Volume represents any involvement (target, seller, or acquirer).
Americas M&A: Quarterly Volume Americas M&A: Deal Type Breakdown
Deal Type
1/9/2017 Williams Partners LP Williams Cos Inc/The - $11,400.0
3/29/2017Canadian conventional
natural gas assetsCenovus Energy Inc ConocoPhillips $13,199.7
Amount
(Bln.) % of Total
% YoY
Change
Top Adviser3/13/2017 Mobileye NV Intel Corp - $14,132.0
2/1/2017 ONEOK Partners LP ONEOK Inc - $17,378.2
Glo
bal
M&
A R
evi
ew |
Q1
20
17
2/10/2017 Mead Johnson Nutrition Co Reckitt Benckiser Group PLC - $17,809.8
Americas M&A Regional Review Americas M&A: Country Breakdown
Americas M&A: Highlights of Q1 2017
Summary Target Acquirer Seller Industry
Americas M&A: Industry Breakdown
0
1000
2000
3000
4000
5000
6000
$0
$200
$400
$600
$800
$1,000
2012 Q1 2013 Q1 2014 Q1 2015 Q1 2016 Q1 2017 Q1
Volume $(Bln.) Deal Count
• Total deal volume in the Americas declined 7.2% in Q12017 to $340.4 billion compared to the sameperiod last year. The Americas maintained its position as the most sought-after region, contributing46.7% to the global deal activity for the period.
• The energy sector was the most targeted for transactions, accounting for 23.8% of the region's totalvolume. The announced acquisition of ONEOK Partners LP by ONEOK Inc for $17.4 billion was thesector’s largest deal globally for the quarter.
• Deals with announced values over $1.0 billion accounted for 68.3% of the Americas’ total volume with$232.5 billion in transactions. Reckitt Benckiser Group PLC’s pending acquisition of Mead JohnsonNutrition Co for $17.8 billion was the region’s largest deal for Q12017.
5

US Announced Deals (Any Involvement) 01/01/2017 ‐ 03/31/2017 US Announced Deals (Target or Seller) 01/01/2017 ‐ 03/31/2017
Morgan Stanley 1 25.9 107,452 48 6 21.6 4.3 Morgan Stanley 1 29.6 96,975 41 5 24.4 5.2Goldman Sachs & Co 2 24.3 101,020 54 1 45.4 ‐21.1 Goldman Sachs & Co 2 29.6 96,921 44 1 47.6 ‐18.0Bank of America Merrill Lynch 3 19.7 81,861 28 8 19.9 ‐0.2 JPMorgan Chase & Co 3 22.9 74,986 38 8 21.5 1.4Citigroup Inc 4 18.6 77,311 34 2 28.0 ‐9.4 Barclays PLC 4 15.2 49,828 31 4 30.9 ‐15.7JPMorgan Chase & Co 5 18.4 76,260 40 5 21.8 ‐3.5 Bank of America Merrill Lynch 5 13.4 43,786 24 7 22.6 ‐9.2Credit Suisse Group AG 6 15.0 62,114 18 13 6.2 8.8 Citigroup Inc 6 12.9 42,394 27 2 31.6 ‐18.7Lazard Ltd 7 13.3 55,296 32 3 28.0 ‐14.7 Evercore Partners Inc 7 10.4 34,186 26 9 13.8 ‐3.3Barclays PLC 8 13.0 53,865 34 4 27.4 ‐14.4 RBC Capital Markets 8 8.9 29,243 18 12 7.3 1.7Evercore Partners Inc 9 9.4 38,897 30 9 12.2 ‐2.8 Lazard Ltd 9 7.7 25,080 30 3 31.2 ‐23.5RBC Capital Markets 10 7.9 32,674 21 12 7.0 0.9 Rothschild & Co 10 7.4 24,186 17 24 1.9 5.5ALANTRA 11 7.2 29,762 6 129 ‐ 7.2 Deutsche Bank AG 11 6.7 21,984 11 6 23.1 ‐16.4Deutsche Bank AG 12 6.6 27,346 15 7 20.4 ‐13.8 HSBC Bank PLC 12 6.5 21,182 2 16 4.1 2.4HSBC Bank PLC 13 5.9 24,696 6 19 3.6 2.4 Centerview Partners LLC 13 6.1 19,914 13 10 9.7 ‐3.6Rothschild & Co 14 5.9 24,530 25 16 4.3 1.6 Robey Warshaw LLP 14 5.4 17,810 1 ‐ ‐ 5.4Centerview Partners LLC 15 4.8 19,914 13 10 11.1 ‐6.3 Raymond James & Associates Inc 15 4.6 15,017 16 51 0.2 4.4Robey Warshaw LLP 16 4.3 17,810 1 ‐ ‐ 4.3 Credit Suisse Group AG 16 3.7 12,051 14 14 4.3 ‐0.6Raymond James & Associates Inc 17 3.7 15,242 19 58 0.2 3.5 UBS AG 17 3.5 11,406 8 23 2.0 1.5UBS AG 18 3.6 14,870 13 15 4.3 ‐0.7 Moelis & Co 18 3.2 10,418 16 29 1.4 1.8Moelis & Co 19 2.5 10,418 17 34 1.2 1.3 BDT & Co LLC 19 2.7 8,793 2 ‐ ‐ 2.7TD Securities Inc 20 2.4 9,834 4 62 0.1 2.2 TD Securities Inc 20 2.7 8,789 2 76 0.0 2.6
TOTAL 415,539 4,376 TOTAL 327,837 3,598
Canada Announced Deals (Any Involvement) 01/01/2017 ‐ 03/31/2017 Canada Announced Deals (Target or Seller) 01/01/2017 ‐ 03/31/2017
JPMorgan Chase & Co 1 46.4 39,634 11 3 25.3 21.1 JPMorgan Chase & Co 1 52.6 28,581 6 18 1.6 51.0Goldman Sachs & Co 2 33.9 28,942 7 1 47.3 ‐13.4 RBC Capital Markets 2 34.8 18,931 9 2 27.0 7.8RBC Capital Markets 3 28.7 24,526 13 17 7.6 21.1 Goldman Sachs & Co 3 32.8 17,819 3 7 12.0 20.7Lazard Ltd 4 17.0 14,552 3 2 26.3 ‐9.3 Bank of Nova Scotia/The 4 21.5 11,675 5 3 16.5 5.0TD Securities Inc 5 14.2 12,102 11 19 5.0 9.2 Lazard Ltd 5 15.2 8,262 2 ‐ ‐ 15.2Morgan Stanley 6 13.9 11,865 4 5 22.8 ‐8.9 TD Securities Inc 6 10.7 5,813 10 4 14.0 ‐3.3Bank of Nova Scotia/The 7 13.7 11,675 5 6 17.3 ‐3.6 Barclays PLC 7 10.3 5,596 3 6 13.2 ‐3.0Barclays PLC 8 12.2 10,384 6 7 16.1 ‐4.0 Citigroup Inc 8 8.6 4,685 2 10 4.2 4.4Citigroup Inc 9 11.5 9,804 5 20 4.7 6.7 Morgan Stanley 8 8.6 4,685 2 ‐ ‐ 8.6Bank of America Merrill Lynch 10 8.8 7,511 2 9 13.9 ‐5.1 Bank of America Merrill Lynch 10 7.9 4,300 1 43 ‐ 7.9Rothschild & Co 11 6.9 5,915 5 28 1.1 5.8 Credit Suisse Group AG 11 6.3 3,432 3 43 ‐ 6.3BMO Capital Markets 12 6.1 5,203 7 14 11.7 ‐5.6 Evercore Partners Inc 11 6.3 3,432 2 25 0.3 6.0Credit Suisse Group AG 13 5.9 5,009 4 8 15.3 ‐9.4 CIBC 13 4.6 2,506 4 1 27.1 ‐22.5Centerview Partners LLC 14 5.7 4,903 3 ‐ ‐ 5.7 Macquarie Group Ltd 14 3.7 2,018 3 19 1.2 2.5AlixPartners LLP 15 5.6 4,763 2 ‐ ‐ 5.6 Wells Fargo & Co 15 2.7 1,478 2 43 ‐ 2.7UBS AG 16 4.6 3,951 4 13 12.1 ‐7.4 BMO Capital Markets 16 2.6 1,433 4 8 9.1 ‐6.5Evercore Partners Inc 17 4.2 3,602 3 39 0.1 4.1 Peters & Co Ltd 17 1.7 915 2 28 0.2 1.5Societe Generale SA 18 4.0 3,372 1 ‐ ‐ 4.0 Raymond James & Associates Inc 18 1.3 700 6 36 0.0 1.3HSBC Bank PLC 18 4.0 3,372 2 ‐ ‐ 4.0 Desjardins Capital Markets 19 1.2 673 2 ‐ ‐ 1.2PJT Partners Inc 20 3.8 3,211 1 ‐ ‐ 3.8 Deloitte LLP/United Kingdom 20 1.1 594 1 ‐ ‐ 1.1
TOTAL 85,393 850 TOTAL 54,377 609
391,308 345,346
88,696 24,449
FIRM
2017 2016MKT SHR CHANGE FIRM
2017 2016VOLUME USD
(Mln)MKT SHR CHANGERANK
MKT SHR (%)
VOLUME USD (Mln)
DEAL COUNT RANK
MKT SHR (%) RANK
MKT SHR (%)
DEAL COUNT RANK
MKT SHR (%)
FIRM
2017 2016MKT SHR CHANGE FIRM
2017 2016MKT SHR CHANGERANK
MKT SHR (%)
VOLUME USD (Mln)
DEAL COUNT RANK
MKT SHR (%) RANK
MKT SHR (%)
VOLUME USD (Mln)
DEAL COUNT RANK
MKT SHR (%)
6

Latin America Announced Deals (Any Involvement) 01/01/2017 ‐ 03/31/2017 Brazil Announced Deals (Any Involvement) 01/01/2017 ‐ 03/31/2017
Morgan Stanley 1 27.4 4,717 7 5 19.7 7.7 Morgan Stanley 1 21.2 2,617 6 17 ‐ 21.2Credit Suisse Group AG 2 19.7 3,398 3 7 11.1 8.6 Banco Bradesco BBI SA 2 19.7 2,427 8 8 8.8 10.9Barclays PLC 3 14.9 2,560 4 ‐ ‐ 14.9 Credit Suisse Group AG 3 10.5 1,298 1 ‐ ‐ 10.5Banco Bradesco BBI SA 4 14.1 2,427 8 14 1.8 12.3 UBS AG 4 5.9 728 1 9 7.9 ‐2.0Banco Bilbao Vizcaya Argentaria SA 5 13.3 2,294 3 6 11.1 2.2 Barclays PLC 5 3.7 460 2 ‐ ‐ 3.7UBS AG 6 7.8 1,338 3 12 2.9 4.9 PricewaterhouseCoopers LLP 6 3.4 415 4 ‐ ‐ 3.4PricewaterhouseCoopers LLP 7 2.4 415 5 ‐ ‐ 2.4 Banco Itau BBA SA 7 3.0 368 9 5 14.7 ‐11.7Banco Itau BBA SA 8 2.1 368 9 3 25.4 ‐23.2 HSBC Bank PLC 8 2.0 250 1 ‐ ‐ 2.0Bank of Nova Scotia/The 9 2.0 350 1 ‐ ‐ 2.0 Goldman Sachs & Co 9 1.8 225 2 17 ‐ 1.8HSBC Bank PLC 10 1.5 250 1 19 0.2 1.2 Haitong Securities Co Ltd 10 1.2 147 1 ‐ ‐ 1.2Banco Santander SA 11 1.4 238 2 2 27.1 ‐25.7 Bank of America Merrill Lynch 11 1.0 118 2 6 10.4 ‐9.4Goldman Sachs & Co 12 1.3 225 3 26 ‐ 1.3 Cooperatieve Rabobank UA 12 0.8 101 3 ‐ ‐ 0.8BNP Paribas SA 13 1.1 194 1 18 0.5 0.7 Banco Safra SA 13 0.5 59 2 ‐ ‐ 0.5Haitong Securities Co Ltd 14 0.9 147 1 27 ‐ 0.9 Banco do Brasil SA 14 0.5 56 1 ‐ ‐ 0.5Bank of America Merrill Lynch 15 0.7 118 2 13 2.2 ‐1.5 Banco Votorantim SA 14 0.5 56 1 ‐ ‐ 0.5Cooperatieve Rabobank UA 16 0.6 101 3 ‐ ‐ 0.6 Artica Participacoes e Assessoria Financeira Ltda 16 ‐ ‐ 2 17 ‐ ‐Lazard Ltd 17 0.4 65 3 10 4.5 ‐4.1 KPMG Corporate Finance LLC 16 ‐ ‐ 1 ‐ ‐ ‐Banco Safra SA 18 0.3 59 2 ‐ ‐ 0.3 Arab Banking Corp BSC 16 ‐ ‐ 1 17 ‐ ‐Banco do Brasil SA 19 0.3 56 1 ‐ ‐ 0.3 A3 Capital Assessoria em Fusoes e Aquisicoes 16 ‐ ‐ 1 ‐ ‐ ‐Banco Votorantim SA 19 0.3 56 1 ‐ ‐ 0.3 Banco Indusval SA 16 ‐ ‐ 1 ‐ ‐ ‐
TOTAL 17,228 235 TOTAL 12,320 107
Latin America Announced Deals (Target or Seller) 01/01/2017 ‐ 03/31/2017 Brazil Announced Deals (Target or Seller) 01/01/2017 ‐ 03/31/2017
Banco Bradesco BBI SA 1 17.3 2,427 8 13 2.5 14.7 Banco Bradesco BBI SA 1 21.5 2,427 8 7 10.0 11.5Morgan Stanley 2 15.3 2,147 4 4 27.4 ‐12.1 Morgan Stanley 2 19.0 2,147 4 16 ‐ 19.0UBS AG 3 9.5 1,338 3 11 4.0 5.5 Credit Suisse Group AG 3 11.5 1,298 1 ‐ ‐ 11.5Credit Suisse Group AG 4 9.2 1,298 2 6 15.4 ‐6.2 UBS AG 4 6.4 728 1 8 9.0 ‐2.6Banco Itau BBA SA 5 2.6 368 9 2 35.2 ‐32.6 Banco Itau BBA SA 5 3.3 368 9 5 16.8 ‐13.5Bank of Nova Scotia/The 6 2.5 350 1 ‐ ‐ 2.5 HSBC Bank PLC 6 2.2 250 1 ‐ ‐ 2.2HSBC Bank PLC 7 1.8 250 1 18 0.3 1.5 Goldman Sachs & Co 7 2.0 225 2 16 ‐ 2.0Banco Santander SA 8 1.7 238 2 12 2.6 ‐0.9 PricewaterhouseCoopers LLP 8 1.6 185 3 ‐ ‐ 1.6Goldman Sachs & Co 9 1.6 225 3 24 ‐ 1.6 Haitong Securities Co Ltd 9 1.3 147 1 ‐ ‐ 1.3Banco Bilbao Vizcaya Argentaria SA 10 1.4 194 2 5 15.4 ‐14.0 Bank of America Merrill Lynch 10 1.0 118 2 16 ‐ 1.0BNP Paribas SA 10 1.4 194 1 17 0.6 0.7 Cooperatieve Rabobank UA 11 0.9 101 3 ‐ ‐ 0.9PricewaterhouseCoopers LLP 12 1.3 185 4 ‐ ‐ 1.3 Banco do Brasil SA 12 0.5 56 1 ‐ ‐ 0.5Haitong Securities Co Ltd 13 1.0 147 1 ‐ ‐ 1.0 Banco Votorantim SA 12 0.5 56 1 ‐ ‐ 0.5Bank of America Merrill Lynch 14 0.8 118 2 24 ‐ 0.8 Banco Safra SA 14 0.3 29 1 ‐ ‐ 0.3Cooperatieve Rabobank UA 15 0.7 101 3 ‐ ‐ 0.7 Artica Participacoes e Assessoria Financeira Ltda 15 ‐ ‐ 2 16 ‐ ‐Lazard Ltd 16 0.5 65 3 9 6.2 ‐5.8 Arab Banking Corp BSC 15 ‐ ‐ 1 16 ‐ ‐Banco do Brasil SA 17 0.4 56 1 ‐ ‐ 0.4 A3 Capital Assessoria em Fusoes e Aquisicoes 15 ‐ ‐ 1 ‐ ‐ ‐Banco Votorantim SA 17 0.4 56 1 ‐ ‐ 0.4 Banco Indusval SA 15 ‐ ‐ 1 ‐ ‐ ‐Banco Safra SA 19 0.2 29 1 ‐ ‐ 0.2 Pacific Growth Equities LLC 15 ‐ ‐ 1 ‐ ‐ ‐Guggenheim Capital LLC 20 ‐ ‐ 1 ‐ ‐ ‐
TOTAL 14,065 208 TOTAL 11,298 94
FIRM
2017 2016MKT SHR CHANGE FIRM
2017 2016MKT SHR CHANGERANK
MKT SHR (%)
VOLUME USD (Mln)
DEAL COUNT RANK
MKT SHR (%) RANK
MKT SHR (%)
VOLUME USD (Mln)
DEAL COUNT RANK
MKT SHR (%)
27,418 5,726
19,762 5,000
FIRM
2017 2016MKT SHR CHANGE FIRM
2017 2016MKT SHR CHANGERANK
MKT SHR (%)
VOLUME USD (Mln)
DEAL COUNT RANK
MKT SHR (%) RANK
MKT SHR (%)
VOLUME USD (Mln)
DEAL COUNT RANK
MKT SHR (%)
7

Country
United Kingdom $60.6 28.3% 136.2%
Switzerland $31.6 14.8% -36.3%
Italy $31.2 14.6% 178.0%
France $20.5 9.6% -7.4%
Germany $16.2 7.6% 57.3%
Spain $10.7 5.0% 0.4%
Netherlands $5.8 2.7% -11.7%
Finland $1.3 0.6% -52.3%
Date
Total Value
(Mln.)
Amount
(Bln.) % of Total
% YoY
Change
Number of deals 2,655 Consumer Non-cyclical $52.9 24.7% 58.4%
Volume (Bln.) $214.2 Financial $52.5 24.5% 22.5%
Avg Deal Size (Mln.) $80.7 Consumer Cyclical $37.7 17.6% 176.7%
Energy $26.4 12.3% 347.5%
Industrial $23.8 11.1% 50.6%
Citigroup Inc Communications $7.7 3.6% 9.4%
Number of deals 23 Utilities $6.2 2.9% 98.5%
Volume (Bln.) $76.5 Basic Materials $4.2 2.0% -91.9%
Avg Deal Size (Bln.) $3.3 Technology $1.9 0.9% -52.5%
Diversified $1.0 0.5% -75.1%
Amount
(Bln.)
% Change
Deal Count
% Change
Volume
Company Takeover $110.6 -8.1% -3.3%
Cross Border $149.0 -0.5% 19.3%
Private Equity $53.5 8.5% 41.4%
Asset Sale $56.9 7.7% 115.4%
Tender Offer $55.4 5.3% -22.6%
Venture Capital $3.5 21.2% -7.4%
Spin-off $0.1 -25.0% -95.1%
Minority Purchase $22.5 13.6% 6.3%
$17.7 -11.1% 119.9%
EMEA M&A: Industry Breakdown
Amount
(Bln.) % of Total
% YoY
Change
Safran SA
EMEA M&A: Quarterly Volume EMEA M&A: Deal Type Breakdown
Deal Type
1/16/2017 Luxottica Group SpA Essilor International SA - $9,507.6
$29,762.2
- $10,234.0
Top Adviser3/31/2017 Bradford & Bingley assets Multiple Acquirers
United Kingdom of
Great Britain and
Northern Ireland
$14,699.3
1/16/2017 Luxottica Group SpA Essilor International SA Delfin Sarl $16,608.8
1/19/2017 Zodiac Aerospace
Quarterly Volume represents any involvement (target, seller, or acquirer).
Glo
bal
M&
A R
evi
ew |
Q1
20
17
Majority Purchase
EMEA M&A Regional Review EMEA M&A: Country Breakdown
EMEA M&A Highlights of Q1 2017
Summary Target Acquirer Seller Industry
1/26/2017 Actelion Ltd Johnson & Johnson -
0
1,000
2,000
3,000
4,000
$0
$100
$200
$300
$400
$500
2012 Q1 2013 Q1 2014 Q1 2015 Q1 2016 Q1 2017 Q1
Volume $(Bln.) Deal Count
• M&A deals involving EMEA-based targets reached $214.0 billion in Q12017, representing a 20.3%increase from the same period last year. The region experienced its strongest first quarter of deal volume since Q12007.
• Deal activity targeting the consumer cyclical sector increased 199.5% year-on-year to $37.6 billion. Thesector’s growth is mainly attributed to Esslior International SA’s announced two-step acquisition ofLuxottica Group SpA for $26.1 billion. This is the largest deal targeting the sector globally.
• Johnson & Johnson’s announced acquisition of Switzerland-based Actelion Ltd for $29.8 billion was the largest transaction in Q12017 and accounted for 13.9% of EMEA’s volume for the period.
• Cross border transactions accounted for $148.8 billion in transactions, representing 69.5% of the overallvolume for the region. The United Kingdom, Switzerland and Italy were the most targeted for crossborder transactions in the region.
8
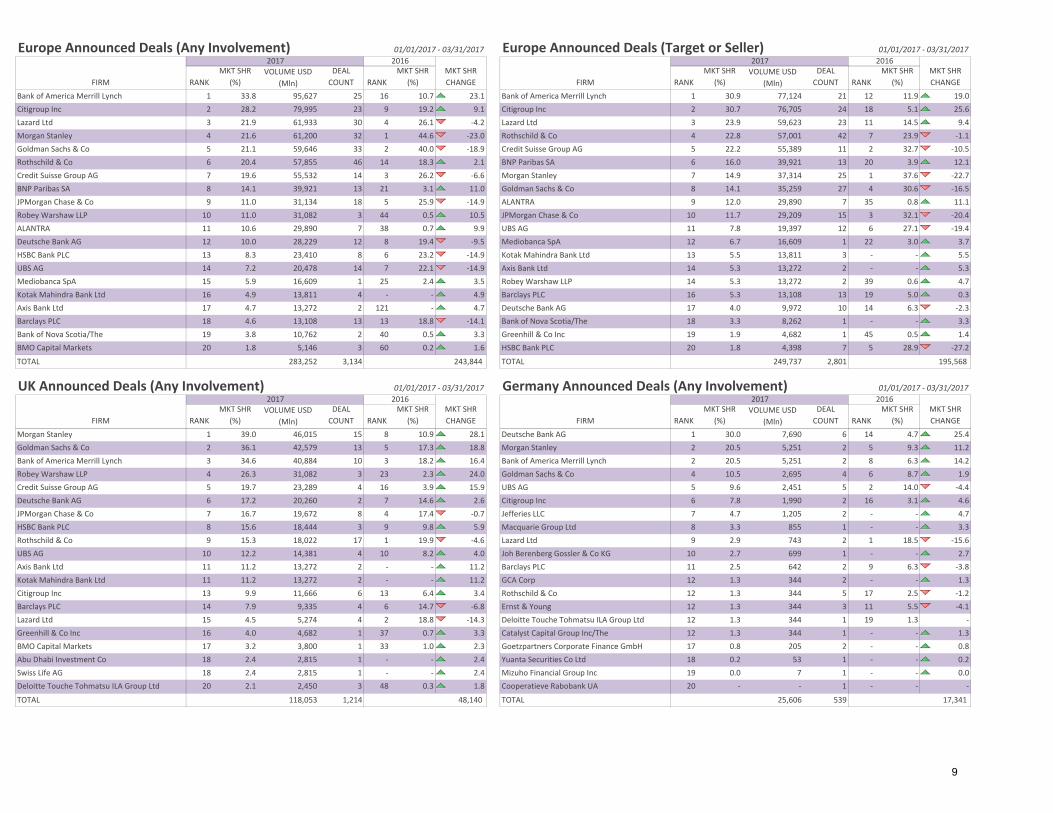
Europe Announced Deals (Any Involvement) 01/01/2017 ‐ 03/31/2017 Europe Announced Deals (Target or Seller) 01/01/2017 ‐ 03/31/2017
Bank of America Merrill Lynch 1 33.8 95,627 25 16 10.7 23.1 Bank of America Merrill Lynch 1 30.9 77,124 21 12 11.9 19.0Citigroup Inc 2 28.2 79,995 23 9 19.2 9.1 Citigroup Inc 2 30.7 76,705 24 18 5.1 25.6Lazard Ltd 3 21.9 61,933 30 4 26.1 ‐4.2 Lazard Ltd 3 23.9 59,623 23 11 14.5 9.4Morgan Stanley 4 21.6 61,200 32 1 44.6 ‐23.0 Rothschild & Co 4 22.8 57,001 42 7 23.9 ‐1.1Goldman Sachs & Co 5 21.1 59,646 33 2 40.0 ‐18.9 Credit Suisse Group AG 5 22.2 55,389 11 2 32.7 ‐10.5Rothschild & Co 6 20.4 57,855 46 14 18.3 2.1 BNP Paribas SA 6 16.0 39,921 13 20 3.9 12.1Credit Suisse Group AG 7 19.6 55,532 14 3 26.2 ‐6.6 Morgan Stanley 7 14.9 37,314 25 1 37.6 ‐22.7BNP Paribas SA 8 14.1 39,921 13 21 3.1 11.0 Goldman Sachs & Co 8 14.1 35,259 27 4 30.6 ‐16.5JPMorgan Chase & Co 9 11.0 31,134 18 5 25.9 ‐14.9 ALANTRA 9 12.0 29,890 7 35 0.8 11.1Robey Warshaw LLP 10 11.0 31,082 3 44 0.5 10.5 JPMorgan Chase & Co 10 11.7 29,209 15 3 32.1 ‐20.4ALANTRA 11 10.6 29,890 7 38 0.7 9.9 UBS AG 11 7.8 19,397 12 6 27.1 ‐19.4Deutsche Bank AG 12 10.0 28,229 12 8 19.4 ‐9.5 Mediobanca SpA 12 6.7 16,609 1 22 3.0 3.7HSBC Bank PLC 13 8.3 23,410 8 6 23.2 ‐14.9 Kotak Mahindra Bank Ltd 13 5.5 13,811 3 ‐ ‐ 5.5UBS AG 14 7.2 20,478 14 7 22.1 ‐14.9 Axis Bank Ltd 14 5.3 13,272 2 ‐ ‐ 5.3Mediobanca SpA 15 5.9 16,609 1 25 2.4 3.5 Robey Warshaw LLP 14 5.3 13,272 2 39 0.6 4.7Kotak Mahindra Bank Ltd 16 4.9 13,811 4 ‐ ‐ 4.9 Barclays PLC 16 5.3 13,108 13 19 5.0 0.3Axis Bank Ltd 17 4.7 13,272 2 121 ‐ 4.7 Deutsche Bank AG 17 4.0 9,972 10 14 6.3 ‐2.3Barclays PLC 18 4.6 13,108 13 13 18.8 ‐14.1 Bank of Nova Scotia/The 18 3.3 8,262 1 ‐ ‐ 3.3Bank of Nova Scotia/The 19 3.8 10,762 2 40 0.5 3.3 Greenhill & Co Inc 19 1.9 4,682 1 45 0.5 1.4BMO Capital Markets 20 1.8 5,146 3 60 0.2 1.6 HSBC Bank PLC 20 1.8 4,398 7 5 28.9 ‐27.2
TOTAL 283,252 3,134 TOTAL 249,737 2,801
UK Announced Deals (Any Involvement) 01/01/2017 ‐ 03/31/2017 Germany Announced Deals (Any Involvement) 01/01/2017 ‐ 03/31/2017
Morgan Stanley 1 39.0 46,015 15 8 10.9 28.1 Deutsche Bank AG 1 30.0 7,690 6 14 4.7 25.4Goldman Sachs & Co 2 36.1 42,579 13 5 17.3 18.8 Morgan Stanley 2 20.5 5,251 2 5 9.3 11.2Bank of America Merrill Lynch 3 34.6 40,884 10 3 18.2 16.4 Bank of America Merrill Lynch 2 20.5 5,251 2 8 6.3 14.2Robey Warshaw LLP 4 26.3 31,082 3 23 2.3 24.0 Goldman Sachs & Co 4 10.5 2,695 4 6 8.7 1.9Credit Suisse Group AG 5 19.7 23,289 4 16 3.9 15.9 UBS AG 5 9.6 2,451 5 2 14.0 ‐4.4Deutsche Bank AG 6 17.2 20,260 2 7 14.6 2.6 Citigroup Inc 6 7.8 1,990 2 16 3.1 4.6JPMorgan Chase & Co 7 16.7 19,672 8 4 17.4 ‐0.7 Jefferies LLC 7 4.7 1,205 2 ‐ ‐ 4.7HSBC Bank PLC 8 15.6 18,444 3 9 9.8 5.9 Macquarie Group Ltd 8 3.3 855 1 ‐ ‐ 3.3Rothschild & Co 9 15.3 18,022 17 1 19.9 ‐4.6 Lazard Ltd 9 2.9 743 2 1 18.5 ‐15.6UBS AG 10 12.2 14,381 4 10 8.2 4.0 Joh Berenberg Gossler & Co KG 10 2.7 699 1 ‐ ‐ 2.7Axis Bank Ltd 11 11.2 13,272 2 ‐ ‐ 11.2 Barclays PLC 11 2.5 642 2 9 6.3 ‐3.8Kotak Mahindra Bank Ltd 11 11.2 13,272 2 ‐ ‐ 11.2 GCA Corp 12 1.3 344 2 ‐ ‐ 1.3Citigroup Inc 13 9.9 11,666 6 13 6.4 3.4 Rothschild & Co 12 1.3 344 5 17 2.5 ‐1.2Barclays PLC 14 7.9 9,335 4 6 14.7 ‐6.8 Ernst & Young 12 1.3 344 3 11 5.5 ‐4.1Lazard Ltd 15 4.5 5,274 4 2 18.8 ‐14.3 Deloitte Touche Tohmatsu ILA Group Ltd 12 1.3 344 1 19 1.3 ‐Greenhill & Co Inc 16 4.0 4,682 1 37 0.7 3.3 Catalyst Capital Group Inc/The 12 1.3 344 1 ‐ ‐ 1.3BMO Capital Markets 17 3.2 3,800 1 33 1.0 2.3 Goetzpartners Corporate Finance GmbH 17 0.8 205 2 ‐ ‐ 0.8Abu Dhabi Investment Co 18 2.4 2,815 1 ‐ ‐ 2.4 Yuanta Securities Co Ltd 18 0.2 53 1 ‐ ‐ 0.2Swiss Life AG 18 2.4 2,815 1 ‐ ‐ 2.4 Mizuho Financial Group Inc 19 0.0 7 1 ‐ ‐ 0.0Deloitte Touche Tohmatsu ILA Group Ltd 20 2.1 2,450 3 48 0.3 1.8 Cooperatieve Rabobank UA 20 ‐ ‐ 1 ‐ ‐ ‐
TOTAL 118,053 1,214 TOTAL 25,606 53948,140 17,341
243,844 195,568
FIRM
2017 2016MKT SHR CHANGE FIRM
2017 2016MKT SHR CHANGERANK
MKT SHR (%)
VOLUME USD (Mln)
DEAL COUNT RANK
MKT SHR (%) RANK
MKT SHR (%)
VOLUME USD (Mln)
DEAL COUNT RANK
MKT SHR (%)
2016MKT SHR CHANGERANK
MKT SHR (%)
VOLUME USD (Mln)
DEAL COUNT RANK
MKT SHR (%) RANK
MKT SHR (%)
VOLUME USD (Mln)
DEAL COUNT RANK
MKT SHR (%)FIRM
2017 2016MKT SHR CHANGE FIRM
2017
9

France Announced Deals (Any Involvement) 01/01/2017 ‐ 03/31/2017 Italy Announced Deals (Any Involvement) 01/01/2017 ‐ 03/31/2017
BNP Paribas SA 1 68.2 39,921 11 6 19.5 48.6 Citigroup Inc 1 77.1 27,068 3 3 38.3 38.8Rothschild & Co 2 64.6 37,841 15 1 61.7 2.9 Rothschild & Co 2 74.4 26,116 6 6 20.5 53.9Citigroup Inc 3 57.1 33,455 9 ‐ ‐ 57.1 BNP Paribas SA 2 74.4 26,116 2 16 3.5 70.9Mediobanca SpA 4 28.4 16,609 1 ‐ ‐ 28.4 Mediobanca SpA 4 47.3 16,609 1 3 38.3 9.0Lazard Ltd 5 20.7 12,141 5 7 17.8 2.9 Bank of America Merrill Lynch 5 12.6 4,430 5 2 40.7 ‐28.1Bank of America Merrill Lynch 6 20.0 11,709 3 5 24.9 ‐4.9 Morgan Stanley 6 2.7 952 2 19 1.6 1.1Morgan Stanley 7 11.4 6,664 5 2 53.0 ‐41.6 Barclays PLC 6 2.7 952 1 10 6.2 ‐3.5Goldman Sachs & Co 8 6.1 3,597 3 11 12.7 ‐6.6 Lazard Ltd 8 2.5 879 5 1 53.8 ‐51.3Societe Generale SA 9 5.8 3,402 2 10 13.5 ‐7.7 Goldman Sachs & Co 9 1.3 438 2 ‐ ‐ 1.3HSBC Bank PLC 10 5.8 3,372 1 12 11.3 ‐5.5 Robert W Baird & Co Inc 10 1.0 350 1 ‐ ‐ 1.0Credit Agricole Corporate & Investment Bank SA 11 1.0 608 6 3 45.6 ‐44.6 EnVent Srl 11 0.4 151 1 ‐ ‐ 0.4Credit Suisse Group AG 12 1.0 575 2 4 45.4 ‐44.4 ALANTRA 12 0.4 128 2 25 0.3 0.1MTS Health Partners LP 12 1.0 575 1 ‐ ‐ 1.0 PricewaterhouseCoopers LLP 13 0.3 118 5 ‐ ‐ 0.3Kotak Mahindra Bank Ltd 14 0.9 539 2 ‐ ‐ 0.9 SunTrust Robinson Humphrey Capital Markets 14 0.3 102 1 ‐ ‐ 0.3Evercore Partners Inc 14 0.9 539 1 ‐ ‐ 0.9 Banco Santander SA 15 0.1 44 2 ‐ ‐ 0.1Nomura Holdings Inc 16 0.9 527 1 ‐ ‐ 0.9 Deutsche Bank AG 16 0.1 32 2 31 ‐ 0.1PNC Financial Services Group Inc/The 17 0.7 432 1 ‐ ‐ 0.7 Nomura Holdings Inc 17 ‐ 2 1 20 0.9 ‐0.9Barclays PLC 18 0.7 405 3 17 3.3 ‐2.6 Societe Generale SA 18 ‐ 2 18 2.4 ‐2.4Perella Weinberg Partners LP 19 0.5 289 1 ‐ ‐ 0.5 Credit Suisse Group AG 18 ‐ 1 ‐ ‐ ‐Robert W Baird & Co Inc 20 0.4 254 1 ‐ ‐ 0.4 RBC Capital Markets 18 ‐ ‐ 1 ‐ ‐ ‐
TOTAL 58,582 455 TOTAL 35,104 186
Benelux Announced Deals (Any Involvement) 01/01/2017 ‐ 03/31/2017 Iberia Announced Deals (Any Involvement) 01/01/2017 ‐ 03/31/2017
Citigroup Inc 1 48.2 25,226 5 11 4.6 43.6 Morgan Stanley 1 20.5 3,832 3 ‐ ‐ 20.5Rothschild & Co 2 41.7 21,802 7 2 26.8 14.9 Citigroup Inc 2 19.3 3,609 6 2 9.9 9.4BNP Paribas SA 3 31.7 16,609 1 22 1.0 30.7 JPMorgan Chase & Co 3 17.1 3,195 2 11 1.0 16.0Mediobanca SpA 3 31.7 16,609 1 ‐ ‐ 31.7 Abu Dhabi Investment Co 4 15.0 2,815 1 ‐ ‐ 15.0Lazard Ltd 5 30.5 15,966 13 1 28.2 2.3 Swiss Life AG 4 15.0 2,815 1 ‐ ‐ 15.0JPMorgan Chase & Co 6 22.8 11,917 3 9 4.8 18.0 UBS AG 6 14.0 2,626 3 7 2.5 11.5Bank of Nova Scotia/The 7 20.6 10,762 2 ‐ ‐ 20.6 Goldman Sachs & Co 7 13.2 2,473 3 21 ‐ 13.2Goldman Sachs & Co 8 16.7 8,763 10 4 12.6 4.2 TAP Advisors LLC 8 7.2 1,344 1 ‐ ‐ 7.2Morgan Stanley 9 14.7 7,684 6 5 10.1 4.6 HSBC Bank PLC 8 7.2 1,344 1 ‐ ‐ 7.2Bank of America Merrill Lynch 10 14.7 7,683 4 ‐ ‐ 14.7 Lazard Ltd 10 6.3 1,188 3 3 9.0 ‐2.7BMO Capital Markets 11 7.3 3,800 1 ‐ ‐ 7.3 Stifel Financial Corp 11 5.5 1,022 1 ‐ ‐ 5.5TD Securities Inc 12 4.8 2,500 1 ‐ ‐ 4.8 Barclays PLC 12 5.1 952 1 ‐ ‐ 5.1Barclays PLC 13 3.8 1,998 3 ‐ ‐ 3.8 Bank of America Merrill Lynch 12 5.1 952 2 ‐ ‐ 5.1Credit Suisse Group AG 14 3.3 1,738 2 39 ‐ 3.3 BNP Paribas SA 14 3.5 663 2 12 0.9 2.6PJT Partners Inc 15 3.3 1,700 2 ‐ ‐ 3.3 Kotak Mahindra Bank Ltd 15 2.9 539 1 ‐ ‐ 2.9Guggenheim Capital LLC 15 3.3 1,700 2 ‐ ‐ 3.3 Evercore Partners Inc 15 2.9 539 1 ‐ ‐ 2.9KPMG Corporate Finance LLC 17 2.4 1,261 5 39 ‐ 2.4 Nomura Holdings Inc 17 2.8 527 1 ‐ ‐ 2.8NSM VIE ABN Amro 18 2.0 1,055 3 39 ‐ 2.0 PricewaterhouseCoopers LLP 18 2.0 370 2 4 7.4 ‐5.4Cooperatieve Rabobank UA 19 0.6 322 7 38 0.0 0.6 Banco BPI SA 19 1.4 256 1 22 ‐ 1.4PricewaterhouseCoopers LLP 20 0.6 305 7 33 0.2 0.4 Banco Comercial Portugues SA 19 1.4 256 1 22 ‐ 1.4
TOTAL 52,338 357 TOTAL 18,742 175
34,838 15,255
18,089 13,891
MKT SHR CHANGE
2016MKT SHR CHANGE
MKT SHR (%)
VOLUME USD (Mln)
DEAL COUNT RANK
MKT SHR (%)
2017 2016MKT SHR CHANGE FIRM
2017VOLUME USD
(Mln)DEAL COUNT
FIRM
2017 2016MKT SHR CHANGERANK
MKT SHR (%)
VOLUME USD (Mln)
DEAL COUNT RANK
MKT SHR (%)
FIRM RANKMKT SHR
(%)VOLUME USD
(Mln)DEAL COUNT RANK
MKT SHR (%) RANK
MKT SHR (%) RANK
MKT SHR (%)
FIRM
2017 2016
RANK
10

Nordic Announced Deals (Any Involvement) 01/01/2017 ‐ 03/31/2017 Eastern Europe Announced Deals (Any Involvement) 01/01/2017 ‐ 03/31/2017
Goldman Sachs & Co 1 15.1 2,097 2 15 4.3 10.8 Morgan Stanley 1 16.4 1,915 3 5 2.4 14.0Morgan Stanley 2 9.1 1,271 4 6 11.6 ‐2.5 Deutsche Bank AG 2 15.9 1,850 1 27 ‐ 15.9NC Advisory UK LLP 3 9.1 1,263 1 ‐ ‐ 9.1 VTB Capital JSC 3 10.3 1,206 3 4 8.7 1.7Lazard Ltd 4 8.1 1,131 2 7 11.5 ‐3.4 PricewaterhouseCoopers LLP 4 8.2 954 7 7 2.0 6.2Nordea Bank AB 5 6.9 961 2 36 0.1 6.8 Ernst & Young 4 8.2 954 2 24 0.1 8.0Wells Fargo & Co 6 5.9 822 1 ‐ ‐ 5.9 Evercore Partners Inc 6 6.3 740 1 ‐ ‐ 6.3UBS AG 6 5.9 822 1 10 6.1 ‐0.2 Lazard Ltd 7 3.9 453 2 13 0.7 3.2Citigroup Inc 8 4.7 650 2 11 5.1 ‐0.4 KPMG Corporate Finance LLC 8 1.9 226 4 11 1.1 0.9Nomura Holdings Inc 8 4.7 650 1 ‐ ‐ 4.7 Rothschild & Co 9 1.8 215 4 3 9.4 ‐7.6Motilal Oswal Investment Advisors Pvt Ltd 10 4.4 607 1 ‐ ‐ 4.4 Solon Advocaten BV 9 1.8 215 1 ‐ ‐ 1.8Bank of America Merrill Lynch 10 4.4 607 1 8 6.8 ‐2.5 Littlebanc Advisors LLC 9 1.8 215 1 ‐ ‐ 1.8Skandinaviska Enskilda Banken AB 12 3.5 484 6 3 37.6 ‐34.2 Citigroup Inc 12 1.0 118 1 ‐ ‐ 1.0Barclays PLC 13 3.3 460 2 17 2.5 0.8 MKB Bank Zrt 13 0.6 69 1 ‐ ‐ 0.6DNB ASA 14 2.8 395 3 24 0.5 2.4 Banco Safra SA 14 0.3 29 1 ‐ ‐ 0.3Sisu Partners Oy 15 2.6 354 1 ‐ ‐ 2.6 Taiga Capital 15 ‐ ‐ 1 ‐ ‐ ‐JPMorgan Chase & Co 16 2.3 320 2 9 6.1 ‐3.9 Goetzpartners Corporate Finance GmbH 15 ‐ ‐ 1 ‐ ‐ ‐Macquarie Group Ltd 16 2.3 320 1 42 ‐ 2.3 Bank Polska Kasa Opieki SA ‐ Grupa Pekao SA 15 ‐ ‐ 1 ‐ ‐ ‐Danske Bank A/S 16 2.3 320 2 16 2.5 ‐0.2 JPMorgan Chase & Co 15 ‐ ‐ 3 7 2.0 ‐2.0Robert W Baird & Co Inc 19 1.9 270 1 ‐ ‐ 1.9 UniCredit SpA 15 ‐ ‐ 1 7 2.0 ‐2.0PricewaterhouseCoopers LLP 20 1.9 263 13 27 0.4 1.5 Gazprombank JSC 15 ‐ ‐ 1 ‐ ‐ ‐
TOTAL 13,900 466 TOTAL 11,664 266
Africa/ME Announced Deals (Any Involvement) 01/01/2017 ‐ 03/31/2017
Lazard Ltd 1 13.9 2,721 4 8 7.0 6.9Goldman Sachs & Co 2 12.6 2,478 3 1 26.1 ‐13.5Morgan Stanley 3 11.6 2,270 4 15 4.0 7.6Perella Weinberg Partners LP 4 11.1 2,170 1 17 1.5 9.6HSBC Bank PLC 4 11.1 2,170 2 ‐ ‐ 11.1Credit Suisse Group AG 4 11.1 2,170 1 13 5.4 5.6Nomura Holdings Inc 7 9.3 1,828 3 ‐ ‐ 9.3Citigroup Inc 8 7.8 1,532 4 6 9.6 ‐1.8Rothschild & Co 9 7.6 1,498 5 4 14.0 ‐6.3Bank of America Merrill Lynch 10 7.5 1,478 2 38 ‐ 7.5RBC Capital Markets 11 5.7 1,109 2 ‐ ‐ 5.7Cenkos Securities PLC 11 5.7 1,109 1 ‐ ‐ 5.7UBS AG 11 5.7 1,109 1 9 6.9 ‐1.3JPMorgan Chase & Co 14 4.9 955 1 5 11.4 ‐6.5Centerview Partners LLC 15 1.4 278 1 ‐ ‐ 1.4Deutsche Bank AG 15 1.4 278 1 10 5.5 ‐4.1PricewaterhouseCoopers LLP 17 0.6 108 2 22 0.5 0.1SunTrust Robinson Humphrey Capital Markets 18 0.5 102 1 ‐ ‐ 0.5I&M Holdings Ltd/Kenya 19 0.2 39 1 ‐ ‐ 0.2Cytonn Investments Management Ltd 19 0.2 39 1 ‐ ‐ 0.2
TOTAL 19,634 368
26,559 13,769
20,025
FIRM
2017 2016MKT SHR CHANGE FIRM
2017 2016
RANKMKT SHR
(%)VOLUME USD
(Mln)DEAL COUNT RANK
MKT SHR (%)
FIRMDEAL COUNT RANK
MKT SHR (%)
MKT SHR (%) RANK
MKT SHR (%)
VOLUME USD (Mln)
DEAL COUNTRANK
MKT SHR CHANGE
2017 2016MKT SHR CHANGERANK
MKT SHR (%)
VOLUME USD (Mln)
11
Date
Total Value
(Mln.)
Number of deals 2,900
Volume (Bln.) $174.2
Avg Deal Size (Mln.) $60.1
Morgan Stanley
Number of deals 18
Volume (Bln.) $24.6
Avg Deal Size (Bln.) $1.4
Deal Type
Amount
(Bln.)
% Change
Deal Count
% YoY
Change
Company Takeover $76.6 0.2% -15.3%
Cross Border $68.0 -4.5% -6.1%
Private Equity $31.5 -0.4% -23.4%
Asset Sale $20.4 2.8% -19.2%
Tender Offer $12.5 39.4% 3.4%
Venture Capital $7.6 -7.4% -48.1%
Spin-off $0.6 7.1% -78.9%
Minority Purchase $44.6 2.2% -0.5%
Majority Purchase $22.3 21.7% -45.9%
Graphs represent any regional involvement (target, seller, or acquirer).
China Vanke Co Ltd
Japan M&A: Quarterly Volume
$2,830.73/1/2017Yingde Gases Group Co
LtdPAG -
Vodafone Group PLC
China Resources
National Corp
APAC M&A: Breakdown
Greater China M&A: Quarterly Volume
3/16/2017Alinta Energy Holdings
Pty Ltd
Chow Tai Fook Capital
LtdMultiple Sellers $3,079.5
Top Adviser1/2/2017
Hengda Real Estate
Group Co LtdMultiple Acquirers - $4,312.9
1/12/2017
$12,679.0
Shenzhen Metro Group
Co Ltd$5,403.1
APAC M&A Regional Review
Glo
bal
M&
A R
evi
ew |
Q1
20
17
APAC M&A: Quarterly Volume
Australia/NZ M&A: Quarterly Volume
APAC M&A: Highlights of Q1 2017
Summary Target Acquirer Seller
3/20/2017 Vodafone India Ltd Idea Cellular Ltd
32%
15% 12%
11%
9%
7%
5% 4% 3%
2%
APAC Industry Breakdown Financial
Communications
Industrial
Consumer Cyclical
Consumer Non-cyclical
Technology
Basic Materials
Energy
Utilities
Diversified
0
2,000
4,000
6,000
$0
$200
$400
$600
Volume $(Bln.) Deal Count
0
200
400
600
$0
$20
$40
$60
$80
Volume $(Bln.) Deal Count
0
500
1000
1500
2000
$0
$100
$200
$300
Volume $(Bln.) Deal Count
0
500
1000
$0
$50
$100
Volume $(Bln.) Deal Count
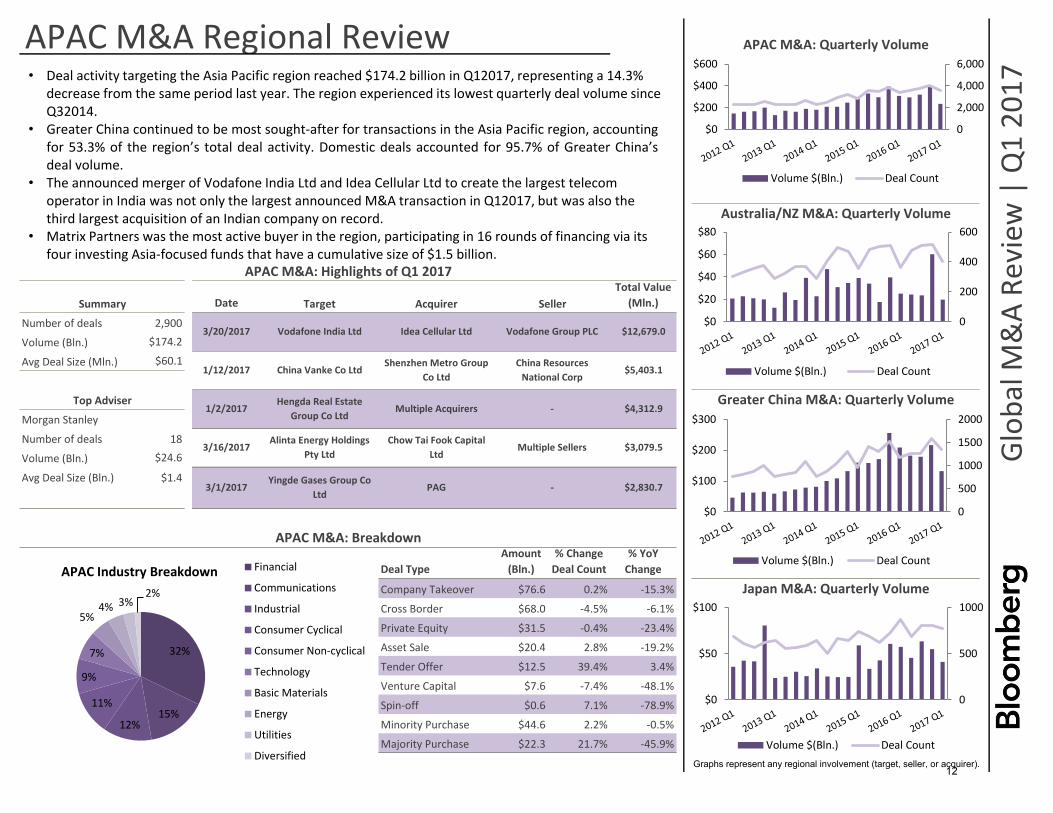
• Deal activity targeting the Asia Pacific region reached $174.2 billion in Q12017, representing a 14.3%decrease from the same period last year. The region experienced its lowest quarterly deal volume sinceQ32014.
• Greater China continued to be most sought-after for transactions in the Asia Pacific region, accountingfor 53.3% of the region’s total deal activity. Domestic deals accounted for 95.7% of Greater China’sdeal volume.
• The announced merger of Vodafone India Ltd and Idea Cellular Ltd to create the largest telecom operator in India was not only the largest announced M&A transaction in Q12017, but was also the third largest acquisition of an Indian company on record.
• Matrix Partners was the most active buyer in the region, participating in 16 rounds of financing via its four investing Asia-focused funds that have a cumulative size of $1.5 billion.
12
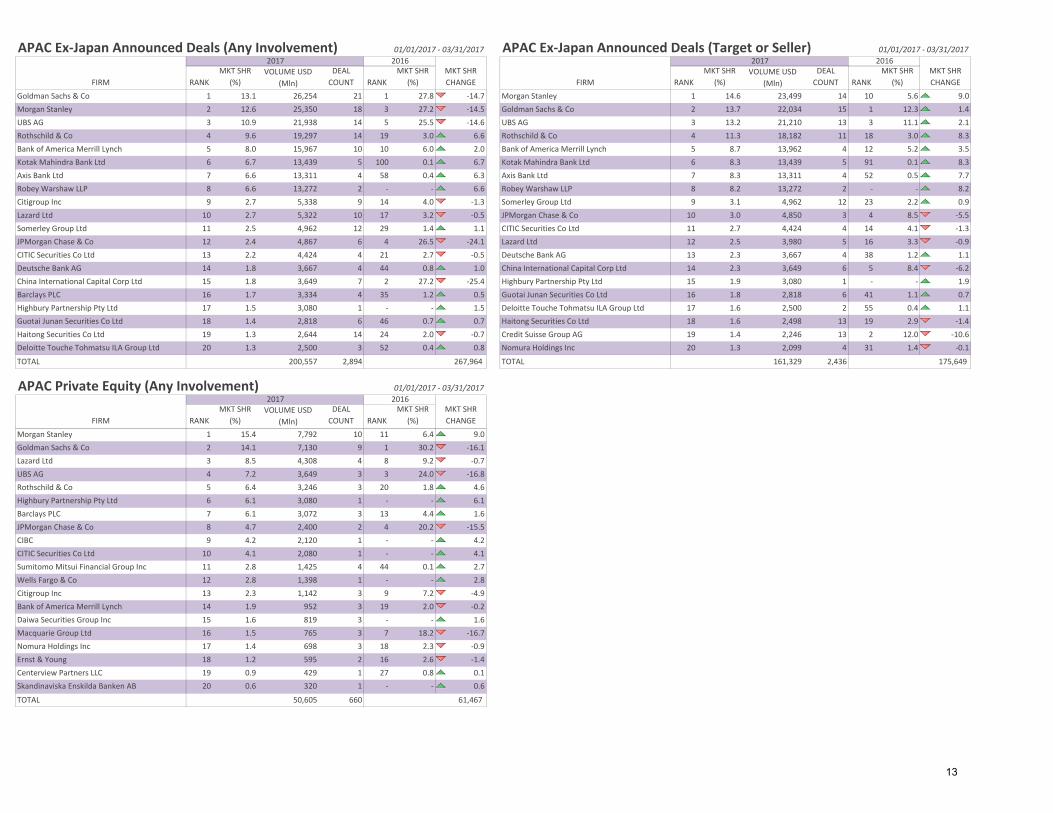
APAC Ex‐Japan Announced Deals (Any Involvement) 01/01/2017 ‐ 03/31/2017 APAC Ex‐Japan Announced Deals (Target or Seller) 01/01/2017 ‐ 03/31/2017
Goldman Sachs & Co 1 13.1 26,254 21 1 27.8 ‐14.7 Morgan Stanley 1 14.6 23,499 14 10 5.6 9.0Morgan Stanley 2 12.6 25,350 18 3 27.2 ‐14.5 Goldman Sachs & Co 2 13.7 22,034 15 1 12.3 1.4UBS AG 3 10.9 21,938 14 5 25.5 ‐14.6 UBS AG 3 13.2 21,210 13 3 11.1 2.1Rothschild & Co 4 9.6 19,297 14 19 3.0 6.6 Rothschild & Co 4 11.3 18,182 11 18 3.0 8.3Bank of America Merrill Lynch 5 8.0 15,967 10 10 6.0 2.0 Bank of America Merrill Lynch 5 8.7 13,962 4 12 5.2 3.5Kotak Mahindra Bank Ltd 6 6.7 13,439 5 100 0.1 6.7 Kotak Mahindra Bank Ltd 6 8.3 13,439 5 91 0.1 8.3Axis Bank Ltd 7 6.6 13,311 4 58 0.4 6.3 Axis Bank Ltd 7 8.3 13,311 4 52 0.5 7.7Robey Warshaw LLP 8 6.6 13,272 2 ‐ ‐ 6.6 Robey Warshaw LLP 8 8.2 13,272 2 ‐ ‐ 8.2Citigroup Inc 9 2.7 5,338 9 14 4.0 ‐1.3 Somerley Group Ltd 9 3.1 4,962 12 23 2.2 0.9Lazard Ltd 10 2.7 5,322 10 17 3.2 ‐0.5 JPMorgan Chase & Co 10 3.0 4,850 3 4 8.5 ‐5.5Somerley Group Ltd 11 2.5 4,962 12 29 1.4 1.1 CITIC Securities Co Ltd 11 2.7 4,424 4 14 4.1 ‐1.3JPMorgan Chase & Co 12 2.4 4,867 6 4 26.5 ‐24.1 Lazard Ltd 12 2.5 3,980 5 16 3.3 ‐0.9CITIC Securities Co Ltd 13 2.2 4,424 4 21 2.7 ‐0.5 Deutsche Bank AG 13 2.3 3,667 4 38 1.2 1.1Deutsche Bank AG 14 1.8 3,667 4 44 0.8 1.0 China International Capital Corp Ltd 14 2.3 3,649 6 5 8.4 ‐6.2China International Capital Corp Ltd 15 1.8 3,649 7 2 27.2 ‐25.4 Highbury Partnership Pty Ltd 15 1.9 3,080 1 ‐ ‐ 1.9Barclays PLC 16 1.7 3,334 4 35 1.2 0.5 Guotai Junan Securities Co Ltd 16 1.8 2,818 6 41 1.1 0.7Highbury Partnership Pty Ltd 17 1.5 3,080 1 ‐ ‐ 1.5 Deloitte Touche Tohmatsu ILA Group Ltd 17 1.6 2,500 2 55 0.4 1.1Guotai Junan Securities Co Ltd 18 1.4 2,818 6 46 0.7 0.7 Haitong Securities Co Ltd 18 1.6 2,498 13 19 2.9 ‐1.4Haitong Securities Co Ltd 19 1.3 2,644 14 24 2.0 ‐0.7 Credit Suisse Group AG 19 1.4 2,246 13 2 12.0 ‐10.6Deloitte Touche Tohmatsu ILA Group Ltd 20 1.3 2,500 3 52 0.4 0.8 Nomura Holdings Inc 20 1.3 2,099 4 31 1.4 ‐0.1
TOTAL 200,557 2,894 TOTAL 161,329 2,436
APAC Private Equity (Any Involvement) 01/01/2017 ‐ 03/31/2017
Morgan Stanley 1 15.4 7,792 10 11 6.4 9.0Goldman Sachs & Co 2 14.1 7,130 9 1 30.2 ‐16.1Lazard Ltd 3 8.5 4,308 4 8 9.2 ‐0.7UBS AG 4 7.2 3,649 3 3 24.0 ‐16.8Rothschild & Co 5 6.4 3,246 3 20 1.8 4.6Highbury Partnership Pty Ltd 6 6.1 3,080 1 ‐ ‐ 6.1Barclays PLC 7 6.1 3,072 3 13 4.4 1.6JPMorgan Chase & Co 8 4.7 2,400 2 4 20.2 ‐15.5CIBC 9 4.2 2,120 1 ‐ ‐ 4.2CITIC Securities Co Ltd 10 4.1 2,080 1 ‐ ‐ 4.1Sumitomo Mitsui Financial Group Inc 11 2.8 1,425 4 44 0.1 2.7Wells Fargo & Co 12 2.8 1,398 1 ‐ ‐ 2.8Citigroup Inc 13 2.3 1,142 3 9 7.2 ‐4.9Bank of America Merrill Lynch 14 1.9 952 3 19 2.0 ‐0.2Daiwa Securities Group Inc 15 1.6 819 3 ‐ ‐ 1.6Macquarie Group Ltd 16 1.5 765 3 7 18.2 ‐16.7Nomura Holdings Inc 17 1.4 698 3 18 2.3 ‐0.9Ernst & Young 18 1.2 595 2 16 2.6 ‐1.4Centerview Partners LLC 19 0.9 429 1 27 0.8 0.1Skandinaviska Enskilda Banken AB 20 0.6 320 1 ‐ ‐ 0.6
TOTAL 50,605 660
175,649
61,467
MKT SHR CHANGE
DEAL COUNT RANK
MKT SHR (%)
RANKMKT SHR
(%)
MKT SHR (%)
VOLUME USD (Mln)
DEAL COUNT RANK
MKT SHR (%) RANK
MKT SHR (%)
VOLUME USD (Mln)
FIRM
2017 2016MKT SHR CHANGE
267,964
FIRM
2017 2016MKT SHR CHANGE FIRM
2017
RANK
RANKMKT SHR
(%)VOLUME USD
(Mln)DEAL COUNT
2016
13
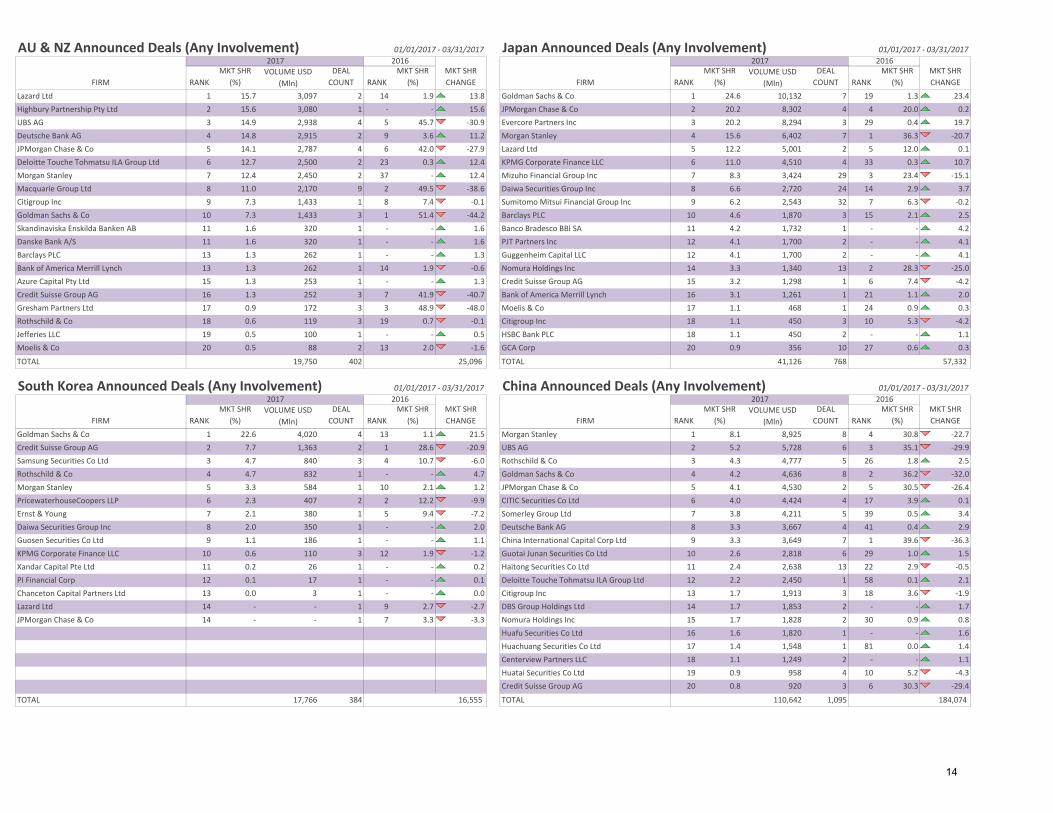
AU & NZ Announced Deals (Any Involvement) 01/01/2017 ‐ 03/31/2017 Japan Announced Deals (Any Involvement) 01/01/2017 ‐ 03/31/2017
Lazard Ltd 1 15.7 3,097 2 14 1.9 13.8 Goldman Sachs & Co 1 24.6 10,132 7 19 1.3 23.4Highbury Partnership Pty Ltd 2 15.6 3,080 1 ‐ ‐ 15.6 JPMorgan Chase & Co 2 20.2 8,302 4 4 20.0 0.2UBS AG 3 14.9 2,938 4 5 45.7 ‐30.9 Evercore Partners Inc 3 20.2 8,294 3 29 0.4 19.7Deutsche Bank AG 4 14.8 2,915 2 9 3.6 11.2 Morgan Stanley 4 15.6 6,402 7 1 36.3 ‐20.7JPMorgan Chase & Co 5 14.1 2,787 4 6 42.0 ‐27.9 Lazard Ltd 5 12.2 5,001 2 5 12.0 0.1Deloitte Touche Tohmatsu ILA Group Ltd 6 12.7 2,500 2 23 0.3 12.4 KPMG Corporate Finance LLC 6 11.0 4,510 4 33 0.3 10.7Morgan Stanley 7 12.4 2,450 2 37 ‐ 12.4 Mizuho Financial Group Inc 7 8.3 3,424 29 3 23.4 ‐15.1Macquarie Group Ltd 8 11.0 2,170 9 2 49.5 ‐38.6 Daiwa Securities Group Inc 8 6.6 2,720 24 14 2.9 3.7Citigroup Inc 9 7.3 1,433 1 8 7.4 ‐0.1 Sumitomo Mitsui Financial Group Inc 9 6.2 2,543 32 7 6.3 ‐0.2Goldman Sachs & Co 10 7.3 1,433 3 1 51.4 ‐44.2 Barclays PLC 10 4.6 1,870 3 15 2.1 2.5Skandinaviska Enskilda Banken AB 11 1.6 320 1 ‐ ‐ 1.6 Banco Bradesco BBI SA 11 4.2 1,732 1 ‐ ‐ 4.2Danske Bank A/S 11 1.6 320 1 ‐ ‐ 1.6 PJT Partners Inc 12 4.1 1,700 2 ‐ ‐ 4.1Barclays PLC 13 1.3 262 1 ‐ ‐ 1.3 Guggenheim Capital LLC 12 4.1 1,700 2 ‐ ‐ 4.1Bank of America Merrill Lynch 13 1.3 262 1 14 1.9 ‐0.6 Nomura Holdings Inc 14 3.3 1,340 13 2 28.3 ‐25.0Azure Capital Pty Ltd 15 1.3 253 1 ‐ ‐ 1.3 Credit Suisse Group AG 15 3.2 1,298 1 6 7.4 ‐4.2Credit Suisse Group AG 16 1.3 252 3 7 41.9 ‐40.7 Bank of America Merrill Lynch 16 3.1 1,261 1 21 1.1 2.0Gresham Partners Ltd 17 0.9 172 3 3 48.9 ‐48.0 Moelis & Co 17 1.1 468 1 24 0.9 0.3Rothschild & Co 18 0.6 119 3 19 0.7 ‐0.1 Citigroup Inc 18 1.1 450 3 10 5.3 ‐4.2Jefferies LLC 19 0.5 100 1 ‐ ‐ 0.5 HSBC Bank PLC 18 1.1 450 2 ‐ ‐ 1.1Moelis & Co 20 0.5 88 2 13 2.0 ‐1.6 GCA Corp 20 0.9 356 10 27 0.6 0.3
TOTAL 19,750 402 TOTAL 41,126 768
South Korea Announced Deals (Any Involvement) 01/01/2017 ‐ 03/31/2017 China Announced Deals (Any Involvement) 01/01/2017 ‐ 03/31/2017
Goldman Sachs & Co 1 22.6 4,020 4 13 1.1 21.5 Morgan Stanley 1 8.1 8,925 8 4 30.8 ‐22.7Credit Suisse Group AG 2 7.7 1,363 2 1 28.6 ‐20.9 UBS AG 2 5.2 5,728 6 3 35.1 ‐29.9Samsung Securities Co Ltd 3 4.7 840 3 4 10.7 ‐6.0 Rothschild & Co 3 4.3 4,777 5 26 1.8 2.5Rothschild & Co 4 4.7 832 1 ‐ ‐ 4.7 Goldman Sachs & Co 4 4.2 4,636 8 2 36.2 ‐32.0Morgan Stanley 5 3.3 584 1 10 2.1 1.2 JPMorgan Chase & Co 5 4.1 4,530 2 5 30.5 ‐26.4PricewaterhouseCoopers LLP 6 2.3 407 2 2 12.2 ‐9.9 CITIC Securities Co Ltd 6 4.0 4,424 4 17 3.9 0.1Ernst & Young 7 2.1 380 1 5 9.4 ‐7.2 Somerley Group Ltd 7 3.8 4,211 5 39 0.5 3.4Daiwa Securities Group Inc 8 2.0 350 1 ‐ ‐ 2.0 Deutsche Bank AG 8 3.3 3,667 4 41 0.4 2.9Guosen Securities Co Ltd 9 1.1 186 1 ‐ ‐ 1.1 China International Capital Corp Ltd 9 3.3 3,649 7 1 39.6 ‐36.3KPMG Corporate Finance LLC 10 0.6 110 3 12 1.9 ‐1.2 Guotai Junan Securities Co Ltd 10 2.6 2,818 6 29 1.0 1.5Xandar Capital Pte Ltd 11 0.2 26 1 ‐ ‐ 0.2 Haitong Securities Co Ltd 11 2.4 2,638 13 22 2.9 ‐0.5PI Financial Corp 12 0.1 17 1 ‐ ‐ 0.1 Deloitte Touche Tohmatsu ILA Group Ltd 12 2.2 2,450 1 58 0.1 2.1Chanceton Capital Partners Ltd 13 0.0 3 1 ‐ ‐ 0.0 Citigroup Inc 13 1.7 1,913 3 18 3.6 ‐1.9Lazard Ltd 14 ‐ ‐ 1 9 2.7 ‐2.7 DBS Group Holdings Ltd 14 1.7 1,853 2 ‐ ‐ 1.7JPMorgan Chase & Co 14 ‐ ‐ 1 7 3.3 ‐3.3 Nomura Holdings Inc 15 1.7 1,828 2 30 0.9 0.8
Huafu Securities Co Ltd 16 1.6 1,820 1 ‐ ‐ 1.6Huachuang Securities Co Ltd 17 1.4 1,548 1 81 0.0 1.4Centerview Partners LLC 18 1.1 1,249 2 ‐ ‐ 1.1Huatai Securities Co Ltd 19 0.9 958 4 10 5.2 ‐4.3Credit Suisse Group AG 20 0.8 920 3 6 30.3 ‐29.4
TOTAL 17,766 384 TOTAL 110,642 1,095
25,096 57,332
FIRM
2017 2016MKT SHR CHANGE FIRM
2017 2016MKT SHR CHANGERANK
MKT SHR (%)
VOLUME USD (Mln)
DEAL COUNT RANK
MKT SHR (%) RANK
MKT SHR (%)
VOLUME USD (Mln)
DEAL COUNT RANK
MKT SHR (%)
16,555 184,074
FIRM
2017 2016MKT SHR CHANGE FIRM
2017 2016MKT SHR CHANGERANK
MKT SHR (%)
VOLUME USD (Mln)
DEAL COUNT RANK
MKT SHR (%) RANK
MKT SHR (%)
VOLUME USD (Mln)
DEAL COUNT RANK
MKT SHR (%)
14
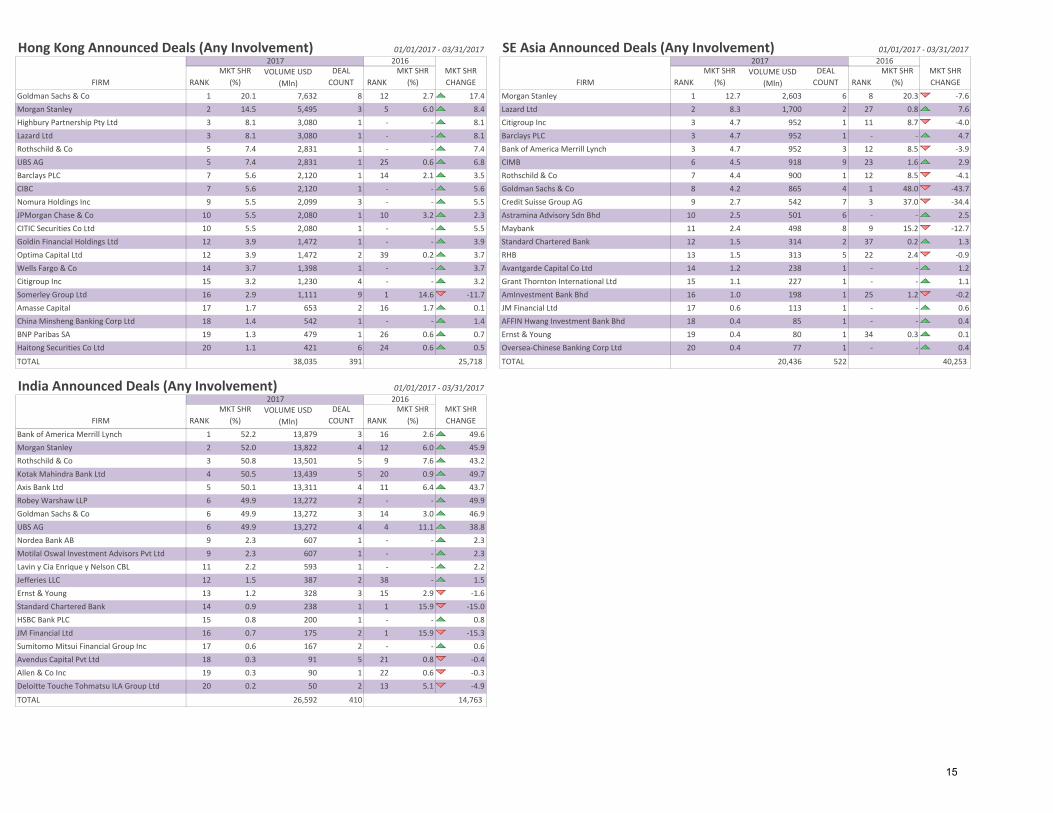
Hong Kong Announced Deals (Any Involvement) 01/01/2017 ‐ 03/31/2017 SE Asia Announced Deals (Any Involvement) 01/01/2017 ‐ 03/31/2017
Goldman Sachs & Co 1 20.1 7,632 8 12 2.7 17.4 Morgan Stanley 1 12.7 2,603 6 8 20.3 ‐7.6Morgan Stanley 2 14.5 5,495 3 5 6.0 8.4 Lazard Ltd 2 8.3 1,700 2 27 0.8 7.6Highbury Partnership Pty Ltd 3 8.1 3,080 1 ‐ ‐ 8.1 Citigroup Inc 3 4.7 952 1 11 8.7 ‐4.0Lazard Ltd 3 8.1 3,080 1 ‐ ‐ 8.1 Barclays PLC 3 4.7 952 1 ‐ ‐ 4.7Rothschild & Co 5 7.4 2,831 1 ‐ ‐ 7.4 Bank of America Merrill Lynch 3 4.7 952 3 12 8.5 ‐3.9UBS AG 5 7.4 2,831 1 25 0.6 6.8 CIMB 6 4.5 918 9 23 1.6 2.9Barclays PLC 7 5.6 2,120 1 14 2.1 3.5 Rothschild & Co 7 4.4 900 1 12 8.5 ‐4.1CIBC 7 5.6 2,120 1 ‐ ‐ 5.6 Goldman Sachs & Co 8 4.2 865 4 1 48.0 ‐43.7Nomura Holdings Inc 9 5.5 2,099 3 ‐ ‐ 5.5 Credit Suisse Group AG 9 2.7 542 7 3 37.0 ‐34.4JPMorgan Chase & Co 10 5.5 2,080 1 10 3.2 2.3 Astramina Advisory Sdn Bhd 10 2.5 501 6 ‐ ‐ 2.5CITIC Securities Co Ltd 10 5.5 2,080 1 ‐ ‐ 5.5 Maybank 11 2.4 498 8 9 15.2 ‐12.7Goldin Financial Holdings Ltd 12 3.9 1,472 1 ‐ ‐ 3.9 Standard Chartered Bank 12 1.5 314 2 37 0.2 1.3Optima Capital Ltd 12 3.9 1,472 2 39 0.2 3.7 RHB 13 1.5 313 5 22 2.4 ‐0.9Wells Fargo & Co 14 3.7 1,398 1 ‐ ‐ 3.7 Avantgarde Capital Co Ltd 14 1.2 238 1 ‐ ‐ 1.2Citigroup Inc 15 3.2 1,230 4 ‐ ‐ 3.2 Grant Thornton International Ltd 15 1.1 227 1 ‐ ‐ 1.1Somerley Group Ltd 16 2.9 1,111 9 1 14.6 ‐11.7 AmInvestment Bank Bhd 16 1.0 198 1 25 1.2 ‐0.2Amasse Capital 17 1.7 653 2 16 1.7 0.1 JM Financial Ltd 17 0.6 113 1 ‐ ‐ 0.6China Minsheng Banking Corp Ltd 18 1.4 542 1 ‐ ‐ 1.4 AFFIN Hwang Investment Bank Bhd 18 0.4 85 1 ‐ ‐ 0.4BNP Paribas SA 19 1.3 479 1 26 0.6 0.7 Ernst & Young 19 0.4 80 1 34 0.3 0.1Haitong Securities Co Ltd 20 1.1 421 6 24 0.6 0.5 Oversea‐Chinese Banking Corp Ltd 20 0.4 77 1 ‐ ‐ 0.4
TOTAL 38,035 391 TOTAL 20,436 522
India Announced Deals (Any Involvement) 01/01/2017 ‐ 03/31/2017
Bank of America Merrill Lynch 1 52.2 13,879 3 16 2.6 49.6Morgan Stanley 2 52.0 13,822 4 12 6.0 45.9Rothschild & Co 3 50.8 13,501 5 9 7.6 43.2Kotak Mahindra Bank Ltd 4 50.5 13,439 5 20 0.9 49.7Axis Bank Ltd 5 50.1 13,311 4 11 6.4 43.7Robey Warshaw LLP 6 49.9 13,272 2 ‐ ‐ 49.9Goldman Sachs & Co 6 49.9 13,272 3 14 3.0 46.9UBS AG 6 49.9 13,272 4 4 11.1 38.8Nordea Bank AB 9 2.3 607 1 ‐ ‐ 2.3Motilal Oswal Investment Advisors Pvt Ltd 9 2.3 607 1 ‐ ‐ 2.3Lavin y Cia Enrique y Nelson CBL 11 2.2 593 1 ‐ ‐ 2.2Jefferies LLC 12 1.5 387 2 38 ‐ 1.5Ernst & Young 13 1.2 328 3 15 2.9 ‐1.6Standard Chartered Bank 14 0.9 238 1 1 15.9 ‐15.0HSBC Bank PLC 15 0.8 200 1 ‐ ‐ 0.8JM Financial Ltd 16 0.7 175 2 1 15.9 ‐15.3Sumitomo Mitsui Financial Group Inc 17 0.6 167 2 ‐ ‐ 0.6Avendus Capital Pvt Ltd 18 0.3 91 5 21 0.8 ‐0.4Allen & Co Inc 19 0.3 90 1 22 0.6 ‐0.3Deloitte Touche Tohmatsu ILA Group Ltd 20 0.2 50 2 13 5.1 ‐4.9
TOTAL 26,592 410
25,718 40,253
14,763
MKT SHR CHANGE
DEAL COUNT RANK
FIRM
2017 2016MKT SHR CHANGERANK
MKT SHR (%)
VOLUME USD (Mln)
DEAL COUNT RANK
MKT SHR (%)
RANKMKT SHR
(%)VOLUME USD
(Mln)DEAL COUNT RANK
MKT SHR (%) RANK
MKT SHR (%)
VOLUME USD (Mln)
MKT SHR (%)FIRM
2017 2016MKT SHR CHANGE FIRM
2017 2016
15

Bloomberg League Criteria
Announced Global League Tables are based upon announced total values, unless otherwise stated in the title. Non-US dollar values are converted to US dollars at the time of announcement.
Credit will be given to transactions in which Bloomberg classifies as mergers, acquisitions, divestitures, self-tenders, or spin-offs.
Regional and industry League Tables will be based on the country of risk and industry of the ultimate publicly traded parent of a privately held company where applicable.
Advisors to any member of an investor group, consortium, or joint venture are eligible for full credit.
Advisory fees hold no weight over advisory credit.
General Database Criteria
A transaction is considered to have been announced upon the release of terms offered by the acquirer, and acknowledgement of the offer by the target company.
Deals that are considered to be in proposed status will not be granted credit.
Full versions of Bloomberg’s League Tables Standards & Guidelines can be accessed on Bloomberg Professional:
{LEAG<GO>}.
Bloomberg L.P. reserves the right of final decision concerning league eligibility and requires adequate documentation for the same. Bloomberg L.P. and its suppliers believe the information herein was obtained from reliable sources, but they do not guarantee its accuracy. Neither the information nor the opinion expressed constitutes a solicitation of the purchase or sale of securities or commodities. Due to the dynamic nature of the Professional Service product, League Table rankings may vary between the quarterly/year-end publications and data found on the Bloomberg Professional Service.
16


![ءايمي ] 3[ ءايمي · 203:لس ايئاصح¤ 8 ة ود ¦ ددع ةنيع¦ كورتم 79 10 20 ةبسن ققحت¦ 1 ةبسن ققحت فده¦ 2 37.9 50.4 15.8 33.7 12.5](https://img.dokumen.tips/doc/110x75/5e50ab339ecf794a6b658d01/-3-203-8-.jpg)