Embed Size (px)
Citation preview

R E S E A R C H A N D A N A LYS I S
Global Lithium AvailabilityA Constraint for Electric Vehicles?
Paul W. Gruber, Pablo A. Medina, Gregory A. Keoleian,Stephen E. Kesler, Mark P. Everson, and Timothy J. Wallington
Keywords:
electric vehicles (EVs)industrial ecologylithium demandlithium-ion (Li-ion) batterymineral resourcesresource availability
Supporting information is availableon the JIE Web site
Address correspondence toGregory A. KeoleianCenter for Sustainable SystemsSchool of Natural Resources and
Environment440 Church StreetAnn Arbor, MI [email protected]://css.snre.umich.edu/
c© 2011 by Yale UniversityDOI: 10.1111/j.1530-9290.2011.00359.x
Volume 00, Number 00
Summary
There is disagreement on whether the supply of lithium isadequate to support a future global fleet of electric vehicles.We report a comprehensive analysis of the global lithium re-sources and compare it to an assessment of global lithium de-mand from 2010 to 2100 that assumes rapid and widespreadadoption of electric vehicles.
Recent estimates of global lithium resources have reachedvery different conclusions. We compiled data on 103 depositscontaining lithium, with an emphasis on the 32 deposits thathave a lithium resource of more than 100,000 tonnes each.For each deposit, data were compiled on its location, geo-logic type, dimensions, and content of lithium as well as cur-rent status of production where appropriate. Lithium demandwas estimated under the assumption of two different growthscenarios for electric vehicles and other current battery andnonbattery applications.
The global lithium resource is estimated to be about 39 Mt(million tonnes), whereas the highest demand scenario doesnot exceed 20 Mt for the period 2010 to 2100. We concludethat even with a rapid and widespread adoption of electricvehicles powered by lithium-ion batteries, lithium resourcesare sufficient to support demand until at least the end of thiscentury.
www.wileyonlinelibrary.com/journal/jie Journal of Industrial Ecology 1

R E S E A R C H A N D A N A LYS I S
Introduction
Recognition of the adverse impacts of climatechange and the importance of mitigating carbondioxide (CO2) emissions has led to interest invehicle electrification. Most major automobilecompanies are pursuing the development of elec-trified vehicles using lithium-ion (Li-ion) batter-ies. Lithium is the lightest solid element, the firstmember of the alkali metal group, and an excel-lent conductor of electricity and heat. Comparedto nickel metal hydride batteries, the type of bat-tery currently powering most hybrid electric ve-hicles (HEVs), Li-ion batteries are lighter, lessbulky, and more energy efficient. In addition, forproduction volumes greater than 300,000 unitsper year, Li-ion batteries are projected to be lessexpensive (Snyder et al. 2009).
Debate persists about whether the supply oflithium is adequate to meet lithium demand, par-ticularly for Li-ion batteries that will power thenext generation of automobiles. Tahil (2007) hasclaimed that there is insufficient economicallyrecoverable lithium to support a large-scale elec-tric vehicle fleet, whereas Evans (1978, 2008a,2008b), Clarke and Harben (2009), and Yaksicand Tilton (2009) write that resources are ade-quate, although these reviews differ in their esti-mates of lithium resources.
This article attempts to resolve this contro-versy by reviewing information on importantlithium deposits to estimate the global lithiumresource and comparing this information to twoscenarios for lithium demand between 2010 and2100.
Lithium Supply
Previous Estimates of Lithium Reservesand Resources
Recently published estimates of global lithiumresources and reserves (table 1) vary significantly,and there is disagreement on how lithium re-sources and reserves should be quantified. As anexample of the rapidly changing nature of theseestimates, in just 1 year, from 2009 to 2010,the U.S. Geological Survey (USGS), one of theworld’s most respected sources of information onmineral deposits, increased its estimate of lithium
resources from 13.8 to 25.5 Mt (1 Mt = 1 milliontonnes)1 and more than doubled its estimate ofreserves, from 4.1 to 9.9 Mt, “based on new infor-mation from government and industry sources”(USGS 2009a; 2010, 93). In early 2011 theUSGS further increased its estimates of lithiumresources and reserves to 33 Mt and 13 Mt, re-spectively (USGS 2011). The USGS estimatesglobal reserves and resources for many mineralcommodities using data provided by mining com-panies, geological studies by government agen-cies, published research papers, presentations bycompany representatives, and trade journal arti-cles (USGS 2010).
Global lithium production comes from de-posits in which the lithium has been concen-trated above background crustal abundance bynatural processes. The feasibility of recoveringlithium economically from any deposit dependson the size of the deposit, its lithium content(referred to as “grade” for ores and “concentra-tion” for brines), the content of other elements,and the processes that are used to remove thelithium-bearing material from the deposit andextract lithium from it. For any specific deposit,the degree to which these parameters are knowndetermines whether the deposit is classified as re-serve or resource. As new information becomesavailable and as prices change, the classificationof a deposit as reserve or resource can change.It is generally assumed that mining and process-ing technologies will improve over time and thatprices will rise, allowing poorer deposits to beexploited.
Our study covers a period of 90 years, duringwhich time the estimates for lithium reserves andresources will undoubtedly change. Despite theconsiderable uncertainties in estimates coveringthis long time period, it is necessary to take a longview because of the large-scale, structural changesrequired by a shift from hydrocarbon fuels to elec-tric power for cars. Although we have so far beenable to produce all of the minerals that societyneeds from the earth, there are limits, and itwould be unwise to begin such a major transitionunless there were a favorable outlook for long-term lithium supplies (as compared to estimateddemand). To simplify reporting, we refer to allof our estimates as lithium resources. As definedby the USGS, a resource is the “concentration
2 Journal of Industrial Ecology

R E S E A R C H A N D A N A LYS I S
Table 1 World total lithium resource and reserve estimates
Li Resources Reference Li Reserves Reference
13.8 USGS (2009a) 4.1 USGS (2009a)19.2 Tahil (2008) 4.6 Tahil (2008)29.9 Evans (2008b) 29.4 Yaksic and Tilton (2009)33 USGS (2011) 13 USGS (2011)34.5 Evans (2010) 39.4 Clarke and Harben (2009)64.0 Yaksic and Tilton (2009)
Note: Values are in million tonnes (Mt) of lithium (Li).
of naturally occurring solid, liquid, or gaseous ma-terial in or on the Earth’s crust in such form andamount that economic extraction of a commodityfrom the concentration is currently or potentiallyfeasible” (USGS 2009b, 191). Reserve is definedby USGS as “That part of the reserve base thatcould be economically extracted or produced atthe time of determination. (Reserve Base.—Thatpart of an identified resource that meets specifiedminimum physical and chemical criteria relatedto current mining and production practices, in-cluding those for grade, quality, thickness, anddepth)” (USGS 2009b, 191–2). Although re-serve estimates have been made for some deposits,they are not available for all deposits, and the longtime interval for this study must emphasize lesserknown deposits for which resource estimates aremore appropriate.
Lithium Deposits
Lithium deposits are of three main types:brines and related evaporites, pegmatites, andsedimentary rocks. According to our analysis (seethe Deposit-by-Deposit Estimates section), brinescontaining lithium make up 66% of the world’slithium resource, pegmatites make up 26%, andsedimentary rocks make up 8%.
BrinesBrines are saline waters with high contents of
dissolved salts. They are found naturally in thepores of rocks where fresh (lake) or salt (ocean)water has undergone extreme evaporation. Themost common such environment for lithium-bearing brines are lacustrine (lake) playas (saltflats), which consist of sand-size grains of rocksand minerals with brine filling the pores between
the grains. In some such playas, evaporationhas deposited layers consisting almost entirely ofsalts, usually halite (NaCl). Lithium, which is aminor but locally important constituent of thesebrines, is thought to have been derived from ero-sion of rocks surrounding the playas and from hotsprings that feed water into the playas (Ide andKunasz 1989; Kesler 1994). The brine is extractedfrom wells that penetrate lithium-bearing zonesof sediment (aquifers) and pumped into shallowevaporation ponds, where it is evaporated undercontrolled conditions that eliminate deleteriouselements and compounds, principally magnesiumand sulfate.
For the most part, brine salt flats contain-ing the highest concentrations of lithium arein Chile, Argentina, China, and Tibet. Brinesin these deposits also contain large amounts ofother useful elements, including potassium andboron, which offset some of the costs of pump-ing and processing brines. Potassium is mainlyused as a fertilizer (potash) and, when producedfrom brines, usually takes the form of potassiumchloride.
The average concentration of lithium in ma-jor brine resources varies from about 0.14% atthe Salar de Atacama, in northern Chile, to0.02% at Silver Peak, Nevada (figure 1). Inaddition to having the highest average con-centration of lithium in its brine, the 3,000-square-kilometers (km2) Salar de Atacama isalso the largest producing deposit.2 The Salarde Atacama is the world’s largest producer oflithium carbonate (Li2CO3), with 40,000 and25,000 tonnes of Li2CO3 in 2008 from oper-ations owned by Sociedad Quimica y Minera(SQM) and Rockwood Holdings Inc., respec-tively (Evans 2008b; Tahil 2008). This amounts
Gruber et al., Global Lithium Availability and Electric Vehicles 3

R E S E A R C H A N D A N A LYS I S
Figure 1 Average lithium (Li) concentrations of brines.
to over 12,000 tonnes of lithium metal produc-tion, more than half of the world’s total produc-tion of 22,800 (O’Keefe 2009) to 25,400 tonnesof lithium in 2008 (USGS 2010). We have es-timated that Atacama has an in-situ (in theground, before extraction and processing losses)lithium resource of at least 6.3 Mt. Zabuye, inChina, is the next largest producing brine deposit.It has an area of 243 km2, an average lithiumconcentration of about 0.07%, an estimatedlithium resource of 1.53 Mt, and a productioncapacity of 7,500 tonnes of Li2CO3 in 2004(ZBY 2004). Silver Peak, in Nevada, has thelowest concentration of lithium of any currentlyproducing brine deposit, around 0.02% after 40years of operation (Kennedy 1990; Clarke andHarben 2009; Yaksic and Tilton 2009). It hasan estimated lithium resource of 0.3 Mt (Tahil2008).
Among deposits that have not yet gone intoproduction, Bolivia’s Salar de Uyuni is of great-est interest. According to Comibol (2010), twodrill holes indicate the presence of 11 lay-ers of lithium-bearing brine and salt with highporosity, totaling 170 meters in thickness. Al-though Uyuni brines have a relatively low av-erage lithium concentration, about 0.05%, thelarge volume of brine indicates a possible totalresource of 10.2 Mt of lithium, or 27% of theworld’s in-situ lithium resource. Whether thislithium can be produced economically will re-main uncertain until further drilling is conductedto define the lithium reserve and it is proven that
processing can deal with the high level of mag-nesium in the brine.
Brines are also found in deep oil reservoirs,and some of these are enriched in lithium. Bestknown of these are the brines in the Smack-over Formation in the Gulf Coast region of theUnited States. These brines are estimated to con-tain 0.75 Mt of lithium resource at an averagelithium concentration of about 0.015%, which isthe lowest concentration that we have includedin our lithium resource compilation (and the sec-ond lowest concentration shown in figure 1). TheSmackover brines are at depths of several thou-sand feet, which increases cost because of theneed to pump the brine to the surface for process-ing (unless it is moved to the surface during oilproduction; Collins 1976).
PegmatitesPegmatite deposits are coarse-grained intru-
sive igneous rocks that formed from the crys-tallization of magma at depth in the crust.Pegmatites can contain recoverable amountsof lithium, tin, tantalum, niobium, beryl-lium, and other elements. Lithium in peg-matites is usually present in the mineral spo-dumene (LiAlSi2O6), although it can alsobe present in petalite (LiAlSi4O10), lepi-dolite [(KLi2Al(Al,Si)3O10(F,OH)2], amblygo-nite [(Li,Na)AlPO4(F,OH)], and eucryptite(LiAlSiO4).
To produce lithium carbonate from mostpegmatites, a concentrate containing the
4 Journal of Industrial Ecology

R E S E A R C H A N D A N A LYS I S
Figure 2 Average lithium (Li) concentrations of pegmatites.
lithium-bearing mineral is obtained from the peg-matite ore, usually by flotation. The mineral con-centrate is then pulverized and leached in hot so-lutions to release the lithium into solution, fromwhich it is usually precipitated as lithium car-bonate (Tahil 2008). The grinding, heating, anddissolution steps in this process are expensive andare the reason that many pegmatites are at a disad-vantage compared to brines, which can be treatedto release lithium much more easily. The concen-tration of lithium in pegmatites is considerablyhigher than in brines, however, and, where highenough, it offsets the additional costs. Pavlovic(1990) estimated the cost of lithium carbonateproduction from brine at USD $1.10 to $1.65per kilogram (kg) Li2CO3 at Atacama and SilverPeak, Nevada,3 respectively, compared to $2.43per kg Li2CO3 for production from spodumeneat Bessemer City, North Carolina. In addition tolithium, some pegmatite operations produce tinand tantalum as well as feldspar and mica, whichcan help offset processing costs.
Lithium is currently being extracted from atleast 13 pegmatite deposits (Clarke and Harben2009), and more deposits are under development.The largest producing spodumene pegmatite op-eration, in Greenbushes, Australia, has an esti-mated resource of 560,000 tonnes of lithium inore, with an average concentration of about 1.6%lithium (USGS 2007). The producing pegmatitedeposit with the lowest lithium concentration of0.59% lithium (Yaksic and Tilton 2009) is Jia-
jika, in China, which by our estimation has aresource of 204,000 tonnes of lithium in ore.
In the United States, Russia, and Australia,some pegmatite operations with low lithiumconcentrations ceased operations when SouthAmerican brine deposits came on line in the1980s and 1990s. For example, Kings Mountainand Cherryville spodumene pegmatite depositsin North Carolina, with average grades of 0.69%and 0.65% lithium, respectively, closed in 1991(Garrett 2004) despite the fact that the regionhas an estimated resource of more than 5 Mt oflithium (Kesler 1978). The average concentra-tions of major pegmatite resources are presentedin figure 2.
Sedimentary RocksLithium is also found in several sedimen-
tary rocks, including clay and lacustrine evap-orites. In the clay deposits, lithium is aconstituent of clay minerals, such as smectite,from which it must be separated by processing.Hectorite, [(Mg,Li)3Si4O10(OH)2], is a type ofsmectite that is rich in magnesium and lithium.The best known hectorite deposit, containing0.7% lithium, is in Hector, California, andthe lithium-bearing hectorite is used for cos-metic and other applications (Garrett 2004).Another, more recently studied hectorite de-posit is Kings Valley, Nevada; it contains anestimated 48.1 Mt of “indicated” hectorite re-sources grading 0.27% lithium and 42.3 Mt of
Gruber et al., Global Lithium Availability and Electric Vehicles 5

R E S E A R C H A N D A N A LYS I S
“inferred” resources grading 0.27% lithium(WLC 2010b). The Jadar Valley, in Serbia,contains lacustrine evaporite deposits contain-ing jadarite [LiNaB3SiO7(OH)], a newly recog-nized mineral that contains lithium and boron(Obradovic et al. 1997; Stanley et al. 2007). Aninferred resource of 114.6 Mt of jadarite-bearingrock containing 1.8% lithium oxide (Li2O) hasbeen reported for this deposit (Rio Tinto, 2010).The feasibility of economically extracting thelithium from these deposits is not known at thistime.
Costs and ProductionPrices for potash, the most common by-
product from brines, help lower the costs forproduction of lithium brine. According to theUSGS, the average price for potash increasedfrom $200 per tonne in 2004 to a record $717 pertonne in 2008, mainly due to increased demandfor fertilizers (Jasinski 2008, 2009). Demand hasdropped since 2008, due to the global economicrecession, and potash companies reduced produc-tion by 28.5% from 2008 to 2009, which helpedkeep the price for potash above $700 per tonnethrough 2009 (Jasinski 2010).
The price of lithium carbonate (in 2008 dol-lars) steadily declined from around $6.50 perpound4 in 1954 to about $1.50 per pound in 1998,as new South American production began at Ata-cama in 1984 and Hombre Muerto, Argentina, in1997. Beginning in 2003, the price of lithium car-bonate (in 2008 dollars) began to increase, reach-ing around $2.80 per pound, or $6,173 per tonne,in 2008 (Yaksic and Tilton 2009). In 2009, how-ever, the price of lithium carbonate decreased by25%, likely due to decreasing demand and pos-sibly due to SQM’s September announcementthat it would reduce the price of lithium by 20%(Johnson 2009).
Lithium Resource Estimatesand Comparison to OtherEstimates
We compiled data on 103 deposits contain-ing lithium, with an emphasis on the 32 depositscontaining more than 100,000 tonnes of lithiumresources. In estimating the in-situ lithium re-
sources for the top 32 deposits, we obtained datafrom primary and secondary sources that werepublically available. We estimated in-situ lithiumresources from brine deposits using the relation
Lithium Resource = A × T × P × D × C
where A = area of aquifer, T = thickness ofaquifer, P = porosity of aquifer, D = density ofbrine, and C = concentration of Li in brine. Inmost deposits, it was necessary to combine differ-ent aquifers into a single thickness estimate.
We estimated lithium resources from rock andmineral deposits using the relation
Lithium Resource = T × C
Where T = tonnes of ore and C = concentrationof Li in ore.
Deposits containing less than 100,000 tonnesof Li that are currently producing were also in-cluded in the estimate. These deposits, with atotal lithium resource of 147,000 tonnes, are de-scribed in Supporting Information on the Jour-nal’s Web site. The Dead Sea, Great Salt Lake,and Searles Lake brines were not included in thetotal, because the concentrations of lithium intheir brines are lower than even the poorest playabrines.
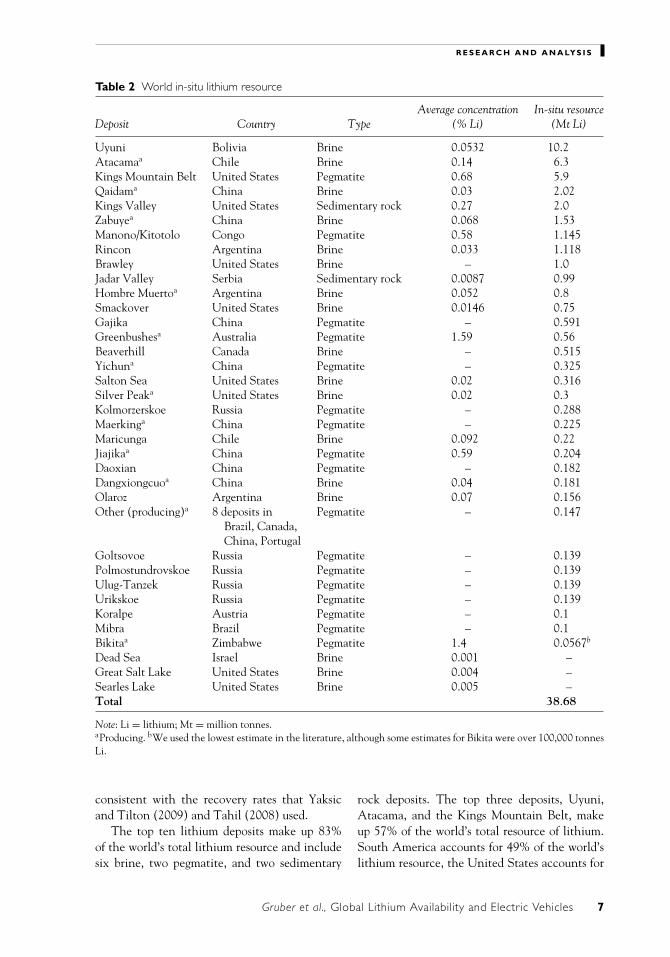
Table 2 presents the in-situ lithium resourceestimate. (Descriptions of these deposits areavailable in the Supporting Information on theWeb.)
Our review suggests that the total in-situlithium resource in the world is 38.68 Mt. If weapply conservative 50% recovery rates for brines,pegmatites, and sedimentary rocks, which takeinto account extraction and processing losses asdiscussed further below, the minimum recover-able lithium resource is 19.34 Mt.
Recovery rates are difficult to estimate andvary by deposit. A 1976 National Research Coun-cil report on lithium and, more recently, Evans(Vaccaro 2010) estimated recovery rates of 75%for open-pit and 50% for underground pegmatitedeposits. Because it is unknown how current andfuture pegmatite deposits will be mined, we chosethe more conservative 50% recovery rate forall lithium-bearing rock deposits, including peg-matites and sedimentary rocks. Evans (Vaccaro2010) also estimated brine operation recoveriesat 50%, which we used for this study. This is
6 Journal of Industrial Ecology
R E S E A R C H A N D A N A LYS I S
Table 2 World in-situ lithium resource
Average concentration In-situ resourceDeposit Country Type (% Li) (Mt Li)
Uyuni Bolivia Brine 0.0532 10.2Atacamaa Chile Brine 0.14 6.3Kings Mountain Belt United States Pegmatite 0.68 5.9Qaidama China Brine 0.03 2.02Kings Valley United States Sedimentary rock 0.27 2.0Zabuyea China Brine 0.068 1.53Manono/Kitotolo Congo Pegmatite 0.58 1.145Rincon Argentina Brine 0.033 1.118Brawley United States Brine – 1.0Jadar Valley Serbia Sedimentary rock 0.0087 0.99Hombre Muertoa Argentina Brine 0.052 0.8Smackover United States Brine 0.0146 0.75Gajika China Pegmatite – 0.591Greenbushesa Australia Pegmatite 1.59 0.56Beaverhill Canada Brine – 0.515Yichuna China Pegmatite – 0.325Salton Sea United States Brine 0.02 0.316Silver Peaka United States Brine 0.02 0.3Kolmorzerskoe Russia Pegmatite – 0.288Maerkinga China Pegmatite – 0.225Maricunga Chile Brine 0.092 0.22Jiajikaa China Pegmatite 0.59 0.204Daoxian China Pegmatite – 0.182Dangxiongcuoa China Brine 0.04 0.181Olaroz Argentina Brine 0.07 0.156Other (producing)a 8 deposits in Pegmatite – 0.147
Brazil, Canada,China, Portugal
Goltsovoe Russia Pegmatite – 0.139Polmostundrovskoe Russia Pegmatite – 0.139Ulug-Tanzek Russia Pegmatite – 0.139Urikskoe Russia Pegmatite – 0.139Koralpe Austria Pegmatite – 0.1Mibra Brazil Pegmatite – 0.1Bikitaa Zimbabwe Pegmatite 1.4 0.0567b
Dead Sea Israel Brine 0.001 –Great Salt Lake United States Brine 0.004 –Searles Lake United States Brine 0.005 –Total 38.68
Note: Li = lithium; Mt = million tonnes.aProducing. bWe used the lowest estimate in the literature, although some estimates for Bikita were over 100,000 tonnesLi.
consistent with the recovery rates that Yaksicand Tilton (2009) and Tahil (2008) used.
The top ten lithium deposits make up 83%of the world’s total lithium resource and includesix brine, two pegmatite, and two sedimentary
rock deposits. The top three deposits, Uyuni,Atacama, and the Kings Mountain Belt, makeup 57% of the world’s total resource of lithium.South America accounts for 49% of the world’slithium resource, the United States accounts for
Gruber et al., Global Lithium Availability and Electric Vehicles 7

R E S E A R C H A N D A N A LYS I S
26%, and China accounts for 14%. Productionof lithium is occurring at 19 deposits (eight ofwhich are below 100,000 tonnes lithium), whosetotal in-situ resource is 12.6 Mt, or 33% of theworld’s total. Of the ten largest deposits, onlyAtacama, Qaidam Basin, and Zabuye are cur-rently producing lithium. In the future, the de-posits with higher grades are likely to be minedbefore lower grade deposits. For brine deposits,Maricunga, Olaroz, and Uyuni are good candi-dates. For pegmatite deposits, Kings MountainBelt may be next to come back on line, althoughother pegmatite deposits in Africa are also can-didates.
Our in-situ resource estimate of 39 Mt oflithium falls between Evans’s (2010) and Yak-sic and Tilton’s (2009) estimates of 34.5 and64.0 Mt, respectively. Differences in estimatesof lithium resources in these studies are partlyattributable to different numbers of deposits in-cluded in each estimate. Tahil (2008), the USGS(2009a, 2010), and Evans (2008b, 2010) includedfewer deposits. We evaluated 103 deposits andincluded 32 of the largest deposits and eight cur-rently producing, smaller deposits in our study.Yaksic and Tilton (2009) included the same num-ber of deposits in their study, although the specificdeposits differed slightly.
The wide range of estimates is also attributableto differences in how resources and reserves wereestimated for specific deposits. The quality of in-formation on the volume of lithium-bearing rockand its lithium content varied from deposit todeposit. Only one of the 40 deposits we studiedreported information that was compliantwith National Instrument 43-101 (NI 43-101; www.sfsc.gov.sk.ca/ssc/files/nat-noti/43-302amendedjan24-03.pdf), an internationallyrecognized standard for the quantification ofmineral reserves and resources. This deposit,DXC (Dangxiongcuo), contains 181,000 tonnesof lithium and was NI 43-101 compliant (Tribe2006). A portion of Western Lithium’s claimat Kings Valley contains an estimate that iscompliant; it amounts to 233,000 tonnes outof an estimated 2.0 Mt of lithium resource at acutoff grade of 0.20% lithium (WLC 2010a).In a recent article, Evans (2010) points outthat few brine deposits can be compliant withNI 43-101 currently, because existing codes for
mineral resource and reserve reporting applyto solid-phase minerals rather than brines,which can change location during production.Assuming the standard is updated to reflect thefluidity of brines, we expect it to be appliedmore widely in the future, as companies seek toattract the investment necessary to develop theirdeposits for mining.
The lowest lithium resource estimate, 19.2 Mtby Tahil (2008), is lower than others primarilybecause it included fewer deposits and becauseTahil used more conservative estimates for thesize of deposits. For many large deposits, includ-ing Uyuni and Atacama, Tahil used the mostconservative figures for surface area, porosity, andconcentration. He used a 20 km2 area of the At-acama deposit in his estimate but did not indi-cate how he estimated the resource for the muchlarger 1,424 km2 nucleus. Also, Tahil did not in-clude pegmatite or sedimentary rock deposits inhis estimate. In doing so, he neglected as muchas one-third of the world’s lithium resource.
While twelve countries are mentioned, it isunclear how many countries in total the USGSincluded when compiling its most recent estimateof lithium resources (USGS 2011); we used datafrom deposits in 15 countries. The USGS doesnot state specifically how its lithium estimateswere obtained, nor does it provide a comprehen-sive list of all deposits included. The main differ-ence between our analysis and that of the USGSis probably related to a larger estimate on our partfor deposits in the United States and China.
In 2010, Evans (Vaccaro 2010) increased hisestimate of lithium resources from 29.9 to 34.5Mt. Evans (2008b) also increased the estimateof the Uyuni deposit from 5.5 Mt of lithium re-serves, as estimated by Ballivian and Risacher(1981), to 8.9 Mt, as estimated by Ballivian in1989. Risacher and Fritz (1991) later revised theestimate to 9.0 Mt, on the basis of more detailedsurvey data and a higher lithium concentration,which is closer to our estimate of 10.2 Mt.
The highest resource estimate, 64.0 Mt oflithium, by Yaksic and Tilton (2009), was basedon 40 deposits. Yaksic and Tilton’s estimate in-cluded 35.7 Mt for the Atacama brine depositbut did not provide data to support this claim. IfYaksic and Tilton used the more widely quotedvalue of 7.0 Mt for Atacama, their global estimate
8 Journal of Industrial Ecology

R E S E A R C H A N D A N A LYS I S
Figure 3 Global lithium consumption by category, 2006–2008, as a percent of total. Cond. = conditioning.
would be similar to our estimate and others in theliterature. Unlike Yaksic and Tilton, we did notinclude the Dead Sea or the Great Salt Lake as re-sources. Clarke and Harben (2009) reported thehighest reserve estimate (which they call “broad-based reserves”), including 61 deposits, but didnot provide deposit-specific resource estimates.
Lithium Markets and Demand
The USGS and major lithium producersreport lithium use by segment starting in2006. Data for the last 3 years are shown infigure 3. Two categories (battery and others) showgrowth. The “other” category includes special al-loy production, chemical processing, continuouscasting, and pharmaceuticals. The “battery” cat-egory includes portable electronics and, more re-cently, vehicles. Given the scale of the appli-cation, if use in vehicles increases, it is likelythat the battery category will outpace all others.These categories were studied and their expecteddemand was projected through 2100.
Nonbattery Demand Forecast
Nonbattery lithium demand includes uses infrits and glass, lubricants, and air conditioning.We note that lithium could be substituted byother materials in these applications. In frits andglass, it could be substituted by sodic and potassicfluxes; in lubricants, by aluminum and calciumsoaps; and lithium alloys could be substituted
by engineered resins that use boron, glass, andpolymer fibers (USGS 2010).
In frits and glass, lithium carbonate is added toceramics, enamels, and glass to reduce their melt-ing point, reduce viscosity, and increase surfacetension, which makes lithium glasses suitable forovenware (Ullmann 2000). Lithium hydroxideis used in the production of greases. The addi-tion of lithium stearates maintains the viscosityof greases at high temperatures and makes theminsoluble in water. Both of these properties areimportant for lubricants in vehicles, aircrafts, andheavy machinery (Ullmann 2000).
Lithium bromide, lithium chromate, andlithium chloride are used in air condition-ers operating on the absorption principle.Lithium hydroxide is also used to absorb car-bon dioxide in submarines and spacecrafts(Ullmann 2000).
Other uses of lithium include production oforganic compounds and alloys (Ullmann 2000).Lithium is used as a coolant and shielding ma-terial in nuclear reactors and for the productionof tritium. Lithium metal is used in alloys withother metals; for example, it changes the hard-ness of aluminum and lead and the ductility ofmagnesium (Ullmann 2000).
Inorganic lithium compounds are employedin several applications. Lithium acetates are usedin pharmaceuticals and in the production ofpolyesters. Lithium carbonate is added to ce-ment to accelerate setting time and to moltensalts used for electrolytic aluminum production.
Gruber et al., Global Lithium Availability and Electric Vehicles 9

R E S E A R C H A N D A N A LYS I S
High-purity lithium carbonate is used in phar-maceuticals to treat manic-depressive conditions(Ullmann 2000).
We estimated the accumulated lithium de-mand for the period 2010–2100, for applicationsother than batteries (i.e., lubricating grease, fritsand glass, air conditioning, and other nonbatteryuses), using growth estimates from Yaksic andTilton (2009) and current demand levels; the re-sult was 3.16 million tonnes of lithium demand.Given the possibilities of substitution by othermaterials, we consider this value to be the up-per limit for the likely lithium demand in theseapplications.
Portable Electronics Battery DemandForecast
Lithium metal and compounds are used as an-ode, cathode, and electrolyte material in batteries(Frost & Sullivan 2008a). Lithium-based batter-ies are lighter, do not have a memory effect, andhave a self-discharge rate lower than other typesof batteries (Winter and Brodd 2004).
Global shipment data are available for pri-mary (i.e., nonrechargeable) batteries between1994 and 2008 and for secondary (i.e., recharge-able) lithium batteries between 2003 and 2007.A linear regression analysis revealed that batteryshipments were strongly correlated with globalgross domestic product (GDP; correlation coef-ficients of 95% for primary batteries and 99%for secondary batteries.) We estimated global de-mand for batteries for the period 2010–2100 onthe basis of the regression result and the Inter-governmental Panel on Climate Change (IPCC)2010–2100 growth scenarios for future globalGDP.
The IPCC identifies four world growth sce-narios (A1, A2, B1, and B2) with annual GDPin the ranges 2.5% to 3.0%, 2.0% to 2.3%, 2.5%to 2.6%, and 2.0% to 2.3%, respectively (IPCC2000). On the basis of these values, two growthscenarios were explored: 2% and 3%.
Once we calculated the annual number ofbattery shipments, we determined the volumeof lithium required, assuming that all batteriesare disposed of after 1 year of useful life. Globalrecycling rates were not available; however, inthe United Kingdom and Canada, disposable andrechargeable battery recycling rates are estimatedto be near 5% (RBRC 2008; Electropaedia 2009).We used this value to represent global recyclingof portable batteries.
Lithium recovery from recycling was assumedto be 90%, a rate that is currently being achieved(Tedjar 2009). Although recovery is expectedto increase as recycling technologies improve,we kept it constant throughout the evaluationperiod.
Finally, we calculated the mass of lithiumused per battery, assuming that all battery-relatedlithium use in 2008 was for primary and secondaryportable batteries. SQM estimated that, in 2008,global lithium consumption was approximately17,400 tonnes, 27% of which was used in bat-teries (SQM 2008). For the same year, Frost &Sullivan (2008b) reported that the world totalcount of primary and secondary lithium batterieswas 4,386 million units. Hence, the average massis 1.07 tonnes of lithium per million batteries. Weassumed that this ratio remained constant for theperiod 2010–2100. Table 3 shows our estimateof the accumulated lithium demand for portablebatteries, using two GDP growth scenarios (2%and 3%).
Table 3 Accumulated lithium demand for portable electronics, 2010–2100
Type of lithium use Primary battery Secondary battery
2% GDP 3% GDP 2% GDP 3% GDP
Batteries (million units) 856,281 1,741,126 868,687 1,780,142Lithium used (million metric tons) 0.92 1.87 0.93 1.91Lithium recycled (million metric tons) 0.04 0.08 0.04 0.09Lithium mined (million metric tons) 0.88 1.78 0.89 1.82
Note: GDP = gross domestic product.
10 Journal of Industrial Ecology

R E S E A R C H A N D A N A LYS I S
Vehicle Battery Demand Forecast
As global penetration of electric vehicles (i.e.,hybrid electric vehicles [HEVs], plug-in hybridelectric vehicles [PHEVs], and battery electric ve-hicles [BEVs]) increases, so will the demand forthe batteries that power them. Currently, mostHEVs use nickel-metal hydride (NiMH) batter-ies, but a transition to Li-ion batteries has be-gun, and researchers have predicted that Li-ionbatteries will be used in the next generation ofvehicles (Frost & Sullivan 2009). We note thatother vehicle technologies, such as fuel cells andultra-capacitor batteries, are being explored, andthese may compete with Li-ion batteries. Hence,we view the demand values calculated below asupper limits.
The lithium demand for vehicle batteries wasestimated as follows. First, we conducted a linearregression analysis using light-duty global vehi-cle production for the period 1995–2008 fromthe Ward’s 2009 Automotive Yearbook (Blinder2009) and global GDP data; a 97% linear cor-relation was found. Second, we estimated vehi-cle manufacturing for 2010–2100 using two GDPgrowth scenarios (2% and 3%). In the 3% GDPgrowth scenario the annual production of light-duty vehicles increases to approximately 630 mil-lion units in 2100; this equates to the production
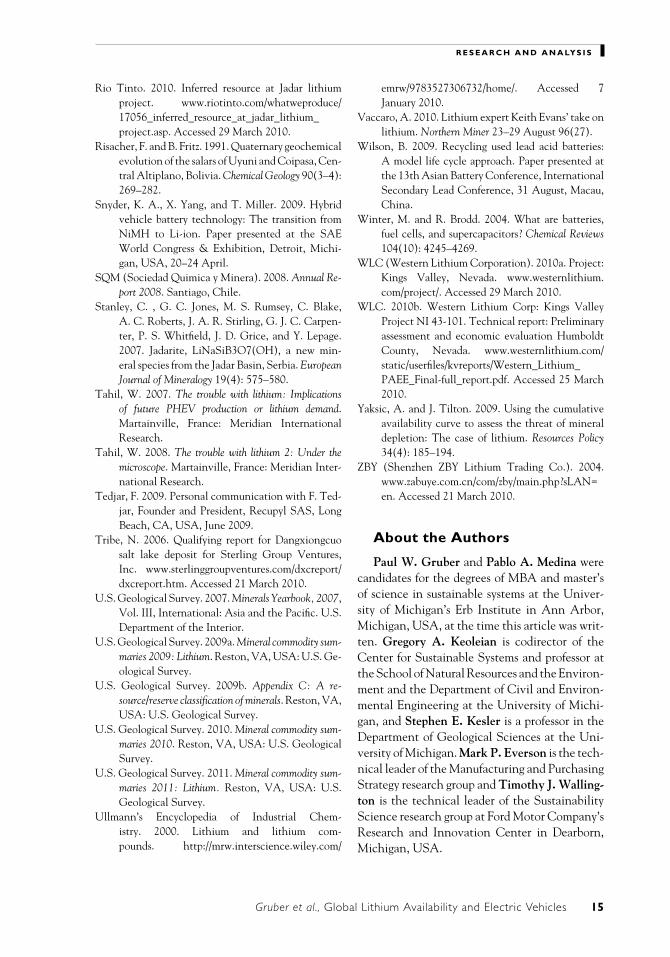
of 42 new vehicles per 1,000 persons per yearin 2100. This level of global vehicle productionand consumption is comparable in magnitude tothe current level in the United States and prob-ably is an upper limit for future global produc-tion. Third, we used Credit Suisse’s projectionof electric vehicle penetration from 2010 to 2030(Jobin et al. 2009). Beyond 2030 we assumed thatyear-over-year electric vehicle growth remainedconstant in the 2% GDP scenario and increased0.5% every 10 years in the 3% GDP scenario.The projected global annual light-duty vehicleproduction is shown in figure 4. These growthprojections result in 100% electric vehicle (EV)penetration in 2083 and 2087 for the 2% and3% GDP scenarios, respectively. Fourth, batterylife, vehicle life, and battery recycling were ac-counted for, and the accumulated lithium use forthe period 2010–2100 was estimated.
To calculate the number of batteries needed,we assumed that all vehicle batteries have 10years of useful life. The amount of lithium re-quired per battery was calculated according tothe electric range of each type of vehicle. Con-sistent with estimates from a recent global en-ergy modeling study (Grahn et al. 2009), we as-sumed that HEVs have 2 km of electric range;PHEVs, 65 km; and BEVs, 200 km. Followingthe recent estimate by Notter and colleagues
Figure 4 Global annual vehicle production (in million units) estimated for 2010–2100 for 2% and 3% grossdomestic product (GDP) scenarios: total vehicles for 3% scenario, dashed line; electric vehicles for 3%scenario, dotted line; total vehicles for 2% scenario, dash-dot line; electric vehicles for 2% scenario,dash-double dot line. “Electric vehicles” includes hybrid electric vehicles (HEVs), plug-in hybrid electricvehicles (PHEVs), and battery electric vehicles (BEVs).
Gruber et al., Global Lithium Availability and Electric Vehicles 11

R E S E A R C H A N D A N A LYS I S
Table 4 2010–2100 maximum expected lithium demand for electric vehicles batteries for 2% and 3% grossdomestic product (GDP) growth scenarios and recycling participation at 90%, 96%, and 100%
Lithium 90% 96% 100%Growth demandandscenario source HEV PHEV BEV Total HEV PHEV BEV Total HEV PHEV BEV Total
2% Demanded 0.22 3.59 11.64 15.45 0.22 3.59 11.64 15.45 0.22 3.59 11.64 15.45Recycled 0.12 1.94 6.76 8.82 0.13 2.06 7.22 9.41 0.14 2.15 7.52 9.80Mined 0.10 1.66 4.88 6.63 0.09 1.53 4.43 6.05 0.08 1.44 4.13 5.66
3% Demanded 0.35 6.14 18.89 25.40 0.35 6.14 18.89 25.40 0.35 6.14 18.89 25.40Recycled 0.17 2.87 9.61 12.65 0.19 3.05 10.25 13.49 0.20 3.18 10.68 14.05Mined 0.18 3.28 9.29 12.75 0.17 3.09 8.64 11.90 0.16 2.96 8.21 11.35
Note: Values are in million tonnes (Mt). A recovery efficiency of 90% during the recycling process was assumed. HEV =hybrid electric vehicle; PHEV = plug-in hybrid electric vehicle; BEV = battery electric vehicle.
(2010), we assumed that electric vehicles con-sume approximately 0.17 kilowatt-hours perkilometer (kWh/km)5. We consider a ±20%range around this value to give 0.14 to 0.20kWh/km. Hence, to provide the needed range,the batteries for HEVs, PHEVs, and BEVsneed to store 0.3 to 0.4, 9 to 13, and 28 to40 kWh, respectively.
Recognizing the need to avoid deep dischargeand seeking to be conservative in our estimations,we added a 100% buffer for HEV and a 50% bufferfor PHEV and BEV batteries to provide adequatecycle life (Miller 2010). The resulting capacityrequirements for HEVs, PHEVs, and BEVs bat-teries in our model are 0.6 to 0.8, 13 to 20, and42 to 60 kWh, respectively. Li-ion batteries haveapproximately 0.114 kg Li per kWh (average forlithium-cobalt oxide [LiCoO2], lithium-nickeloxide [LiNiO2], and lithium-manganese oxide[LiMn2O4] cathode materials from Table 3.1 inGaines and Cuenca 2000), so the lithium con-tent of batteries in HEVs, PHEVs, and BEVswould be 0.068 to 0.091, 1.48 to 2.28, and 5.13 to7.70 kg.
To account for future improvements in ve-hicle efficiency (e.g., weight reduction, aerody-namic and rolling resistance improvements), weadopted the assumption of Grahn and colleagues(2009) that the vehicle energy demand will de-crease by a factor of 2 over the century (i.e.,the energy efficiency increases at a compoundrate of 0.77% per year over the period 2010–2100). Hence, by 2100, HEVs, PHEVs, and BEVswould contain between 0.034 and 0.046, between0.74 and 1.14, and between 2.57 and 3.85 kg of
lithium, respectively. Seeking to calculate maxi-mum expected lithium demand, we used the up-per bound of these ranges (i.e., 0.046, 1.14, and3.85 kg) in our calculations.
Recycling of lithium from Li-ion batteries maybe a critical factor in balancing the supply oflithium with future demand. To cover this fac-tor, we drew on estimates from several sources.The U.S. EPA reports that “nearly 90% of alllead-acid batteries are recycled” (EPA 2008).The International Lead Management Center re-ports that “recycling rates for used batteries is ashigh as 96% in many countries” (Wilson 2009).With regard to lead-acid batteries, the Interna-tional Lead Association states that “some coun-tries boast 100% recycling and most others sharethe possibility of 100% recyclability” (ILA 2010).We calculated total lithium demand and recy-cling volumes for three recycling participationrates (90%, 96%, and 100%), with 90% recoveryof lithium during the recycling process (Paulinoet al. 2008; Tedjar 2009). The results are shown intable 4.
Total Demand Forecast
We calculated the upper limit for lithium de-mand from 2010 to 2100 by aggregating the massneeded to be mined to support the demand fromnonbattery, portable electronic batteries, and ve-hicle batteries uses. In the case of vehicle use,the upper limit was calculated from the 3% GDPgrowth scenario, with vehicle battery recycling at90% (and lithium recovery assumed to be 90%).We expect the total lithium demand for this
12 Journal of Industrial Ecology

R E S E A R C H A N D A N A LYS I S
period to be 19.6 Mt (3.2 Mt from nonbatteryuse, 3.6 Mt from portable battery use, and 12.8Mt from vehicle battery use), and hence we quotean upper limit of 20 Mt.
Conclusion
The lithium demand model shows that accu-mulated demand for lithium from 2010 to 2100could be between 12 and 20 Mt, for the 2% and3% GDP scenarios, when recycling participationis at its lowest (90%). The upper limit for lithiumdemand is significantly lower than the estimated39 Mt of in-situ lithium resource but slightlyhigher than the estimated minimum 19 Mt ofrecoverable lithium. Because some large depositswill likely have higher recovery rates, the actualrecoverable lithium will likely be higher than 19Mt. The biggest hurdles to a long-term lithiumsupply will be establishing lithium production fa-cilities at the rate demanded by the automotiveindustry, advancing the technology to removemagnesium from lithium-bearing brines, and de-veloping the Uyuni deposit. Taking these obsta-cles into consideration, we conclude that lithiumavailability will not constrain the electrificationof the automobile during the present century.
The in-situ resource estimate of 39 Mt willchange as new information becomes available.Although the same data were not available forall deposits, the three largest deposits made upmost of the world’s resource and were estimatedon the basis of substantial data (see Case Studiesof Lithium Deposits in the Supporting Informa-tion on the Web). Seven of the top ten depositsare not in production, and two new types of de-posits, Kings Valley (hectorite) and Jadar Valley(jadarite), have not been operated economically.With demand for lithium batteries, we are en-tering a new lithium exploration era; new brine,spodumene, and other types of deposits will bediscovered. Some deposits might not currently beeconomically exploitable, and others might pro-duce larger than expected amounts of lithium be-fore 2100. Further exploration of current and po-tential lithium deposits, especially if these studiesare NI 43-101 compliant, will help produce im-proved estimates of the world’s lithium resources.
Growth ratios used to calculate lithium usein frits, lubricants, air conditioning, and otherapplications could be lower or higher than thereal growth rates observed in the future. Annualglobal GDP growth for the period 2010–2100could be less than 2% or more than 3%, thus af-fecting our estimates for the number of portablebatteries and vehicle batteries manufactured. Ourdemand for battery use would also be affected ifrecycling participation and recovery factors weredifferent than what we assumed in this work.
Despite these limitations, this study providesa comprehensive repository of data and estimateson lithium supply and a transparent set of pa-rameters used for projecting demand. It also pro-vides a context for interpreting and comparingresults from previous investigations. Further-more, we hope this research facilitates futurestudies examining the adequacy of this uniqueresource.
Notes
1. One megatonne (Mt) = 106 tonnes (t) = one tera-gram (Tg, SI) ≈ 1.102 × 10⁶ short tons.
2. One square kilometer (km2, SI) = 100 hectares (ha)≈ 0.386 square miles ≈ 247 acres.
3. One kilogram (kg, SI) ≈ 2.204 pounds (lb).4. One pound (lb) ≈ 0.4536 kilograms (kg, SI).5. One kilowatt-hour (kWh) ≈ 3.6 × 10⁶ joules (J,
SI) ≈ 3.412 × 10³ British Thermal Units (BTU).
References
Ballivian, O. and F. Risacher. 1981. Los Salares del Al-tiplano Boliviano. [The salt flats of the BolivianAltiplano]. Paris: Office de la Recherche Scien-tifique et Technique Outre-Mer.
Blinder, A. K. 2009. Ward’s automotive yearbook 2009.Southfield, MI, USA: Ward’s Automotive Group.
Clarke, G. M. and P. W. Harben. 2009. Lithium avail-ability wall map LAWM.
Collins, A. 1976. Lithium abundances in oilfield waters.Report P 1005. Reston, VA, USA: U.S. Geolog-ical Survey.
COMIBOL (Corporacion Minera de Bolivia). 2010.The reserves in Uyuni. www.evaporiticosbolivia.org/indexi.php?Modulo=Temas&Opcion=Reservas. Accessed 20 October 2010.
Gruber et al., Global Lithium Availability and Electric Vehicles 13

R E S E A R C H A N D A N A LYS I S
Electropaedia. 2009. Battery and energy technologies.www.mpoweruk.com/recycling.htm. Accessed 18June 2009.
EPA (U.S. Environmental Protection Agency). 2008.U.S. Environmental Protection Agency: Batteryrecycling. www.epa.gov/osw/conserve/materials/battery.htm. Accessed 5 October 2009.
Evans, R. K. 1978. Lithium reserves and resources. En-ergy 3(3): 379–385.
Evans, R. K. 2008a. An abundance of lithium.http://lithiumabundance.blogspot.com/. Ac-cessed 21 May 2009.
Evans, R. K. 2008b. An abundance of lithium:Part. two. www.evworld.com/library/KEvans_LithiumAbunance_pt2.pdf. Accessed 21 May2009.
Evans, R. K. 2010. The lithium-brine reserve conun-drum. Northern Miner. 96(35): 2–6.
Frost & Sullivan. 2008a. Technical insights report: Energystorage and generation for portable power. London:Frost & Sullivan.
Frost & Sullivan. 2008b. World primary lithium batterymarkets. London: Frost & Sullivan.
Frost & Sullivan. 2009. World hybrid electric and electricvehicle lithium-ion battery market. London: Frost &Sullivan.
Gaines, L. and R. Cuenca. 2000. Costs of lithium-ion bat-teries for vehicles. Report ANL/ESD-42. Argonne,IL, USA: Argonne National Laboratory.
Garrett, D. 2004. Handbook of lithium and natural cal-cium chloride: Their deposits, processing, uses andproperties. Amsterdam: Elsevier Academic Press.
Grahn, M., C. Azar, M. I. Williander, J. E. Anderson,S. A. Mueller, and T. J. Wallington. 2009. Fueland vehicle technology choices for passenger ve-hicles in achieving stringent CO2 targets: Con-nections between transportation and other sec-tors. Environmental Science & Technology 43(9):3365–3371.
Ide, Y. F. and I. A. Kunasz. 1989. Origin of lithium inSalar de Atacama, Northern Chile. In Geology ofthe Andes and its relation to hydrocarbon andmineral resources, edited by G. E. Erickson, M. T.Canas Pinochet, and J. A. Reinemund. Houston,TX: Circum-Pacific Council for Energy and MineralResources.
ILA (International Lead Association). 2010. Lead re-cycling. www.ila-lead.org/lead-information/lead-recycling. Accessed 16 February 2010.
IPCC. 2000. Emissions Scenarios. Ch. 4.3. Nakicenovic,N. and Rob Swart (Eds.) Intergovernmental Panelon Climate Change. Cambridge University Press,UK. pp. 570.
Jasinski, S. M. 2008. Mineral commodity summaries.
Potash. Reston, VA, USA: U.S. GeologicalSurvey.
Jasinski, S. M. 2009. Mineral commodity summaries.Potash. Reston, VA, USA: U.S. GeologicalSurvey.
Jasinski, S. M. 2010. Mineral commodity summaries.Potash. Reston, VA, USA: U.S. GeologicalSurvey.
Jobin, L. et al. 2009. HEV and EV projections. Zurich,Switzerland: Credit Suisse.
Jobin, P., J. Yamaguchi, G. Balter, C. J. Ceraso, A.Chan, D. Eggers, D. Ellinghorst, M. Flanery, J. P.McNulty, S. Pearson, and J. Pitzer. 2009. Elec-tric Vehicles. Zurich, Switzerland: Credit Suisse,Global Equity Research, Energy Technology /Auto Parts & Equipment, 1 October 2009.
Johnson, B. 2009. SQM slashes lithium prices.http://www.morningstar.com/1/3/58042-sqm-slashes-lithium.html. Accessed 20 October 2010.
Kennedy, B. 1990. Surface mining. Englewood, CO,USA: Society for Mining, Metallurgy, andExploration.
Kesler, T. L. 1978. Raw lithium supplies. Mining Engi-neering March: 283–284.
Kesler, S. E. 1994. Mineral resources, economics and theenvironment. Upper Saddle River, NJ, USA: Pren-tice Hall.
Miller, T. J. 2010. Personal communication with T. J.Miller, Manager, Energy Storage Research, FordMotor Company, Dearborn, Michigan, January2010.
Notter, D. A., R. Widmer, P. Wager, A. Stamp, R.Zah, and H.-J. Althaus. 2010. Contribution ofLi-ion batteries to the environmental impact ofelectric vehicles. Environmental Science and Tech-nology 44(17): 6550–6556.
Obradovic, J., J. Djurdjevic-Colson, and N. Vasic.1997. Phytogenic lacustrine sedimentation oilshales in Neogene from Serbia, Yugoslavia. Jour-nal of Paleolimnology 18(4): 351–364.
O’Keefe, M. 2009. Lithium opportunities update.Toronto, Canada: Cormark Securities, Inc.
Pavlovic, P. 1990. Desarrollo de la Industria del Litio enChile. Quımica & Industria, Journal of the ChileanSociety of Chemistry 3: 4–19.
Paulino, J. F., N. G. Busnardo, and J. C. Afonso 2008.Recovery of valuable elements from spent Li-batteries. Journal of Hazardous Materials 150(3):843–849.
RBRC (Rechargeable Battery Recycling Corpo-ration). 2008. The challenge of calculatingportable rechargeable battery recycling rates.www.call2recycle.org/doc_lib/ISP%20Appendix%2006.pdf. Accessed 11 June 2009.
14 Journal of Industrial Ecology
R E S E A R C H A N D A N A LYS I S
Rio Tinto. 2010. Inferred resource at Jadar lithiumproject. www.riotinto.com/whatweproduce/17056_inferred_resource_at_jadar_lithium_project.asp. Accessed 29 March 2010.
Risacher, F. and B. Fritz. 1991. Quaternary geochemicalevolution of the salars of Uyuni and Coipasa, Cen-tral Altiplano, Bolivia. Chemical Geology 90(3–4):269–282.
Snyder, K. A., X. Yang, and T. Miller. 2009. Hybridvehicle battery technology: The transition fromNiMH to Li-ion. Paper presented at the SAEWorld Congress & Exhibition, Detroit, Michi-gan, USA, 20–24 April.
SQM (Sociedad Quimica y Minera). 2008. Annual Re-port 2008. Santiago, Chile.
Stanley, C. , G. C. Jones, M. S. Rumsey, C. Blake,A. C. Roberts, J. A. R. Stirling, G. J. C. Carpen-ter, P. S. Whitfield, J. D. Grice, and Y. Lepage.2007. Jadarite, LiNaSiB3O7(OH), a new min-eral species from the Jadar Basin, Serbia. EuropeanJournal of Mineralogy 19(4): 575–580.
Tahil, W. 2007. The trouble with lithium: Implicationsof future PHEV production or lithium demand.Martainville, France: Meridian InternationalResearch.
Tahil, W. 2008. The trouble with lithium 2: Under themicroscope. Martainville, France: Meridian Inter-national Research.
Tedjar, F. 2009. Personal communication with F. Ted-jar, Founder and President, Recupyl SAS, LongBeach, CA, USA, June 2009.
Tribe, N. 2006. Qualifying report for Dangxiongcuosalt lake deposit for Sterling Group Ventures,Inc. www.sterlinggroupventures.com/dxcreport/dxcreport.htm. Accessed 21 March 2010.
U.S. Geological Survey. 2007. Minerals Yearbook, 2007,Vol. III, International: Asia and the Pacific. U.S.Department of the Interior.
U.S. Geological Survey. 2009a. Mineral commodity sum-maries 2009: Lithium. Reston, VA, USA: U.S. Ge-ological Survey.
U.S. Geological Survey. 2009b. Appendix C: A re-source/reserve classification of minerals. Reston, VA,USA: U.S. Geological Survey.
U.S. Geological Survey. 2010. Mineral commodity sum-maries 2010. Reston, VA, USA: U.S. GeologicalSurvey.
U.S. Geological Survey. 2011. Mineral commodity sum-maries 2011: Lithium. Reston, VA, USA: U.S.Geological Survey.
Ullmann’s Encyclopedia of Industrial Chem-istry. 2000. Lithium and lithium com-pounds. http://mrw.interscience.wiley.com/
emrw/9783527306732/home/. Accessed 7January 2010.
Vaccaro, A. 2010. Lithium expert Keith Evans’ take onlithium. Northern Miner 23–29 August 96(27).
Wilson, B. 2009. Recycling used lead acid batteries:A model life cycle approach. Paper presented atthe 13th Asian Battery Conference, InternationalSecondary Lead Conference, 31 August, Macau,China.
Winter, M. and R. Brodd. 2004. What are batteries,fuel cells, and supercapacitors? Chemical Reviews104(10): 4245–4269.
WLC (Western Lithium Corporation). 2010a. Project:Kings Valley, Nevada. www.westernlithium.com/project/. Accessed 29 March 2010.
WLC. 2010b. Western Lithium Corp: Kings ValleyProject NI 43-101. Technical report: Preliminaryassessment and economic evaluation HumboldtCounty, Nevada. www.westernlithium.com/static/userfiles/kvreports/Western_Lithium_PAEE_Final-full_report.pdf. Accessed 25 March2010.
Yaksic, A. and J. Tilton. 2009. Using the cumulativeavailability curve to assess the threat of mineraldepletion: The case of lithium. Resources Policy34(4): 185–194.
ZBY (Shenzhen ZBY Lithium Trading Co.). 2004.www.zabuye.com.cn/com/zby/main.php?sLAN=en. Accessed 21 March 2010.
About the Authors
Paul W. Gruber and Pablo A. Medina werecandidates for the degrees of MBA and master’sof science in sustainable systems at the Univer-sity of Michigan’s Erb Institute in Ann Arbor,Michigan, USA, at the time this article was writ-ten. Gregory A. Keoleian is codirector of theCenter for Sustainable Systems and professor atthe School of Natural Resources and the Environ-ment and the Department of Civil and Environ-mental Engineering at the University of Michi-gan, and Stephen E. Kesler is a professor in theDepartment of Geological Sciences at the Uni-versity of Michigan. Mark P. Everson is the tech-nical leader of the Manufacturing and PurchasingStrategy research group and Timothy J. Walling-ton is the technical leader of the SustainabilityScience research group at Ford Motor Company’sResearch and Innovation Center in Dearborn,Michigan, USA.
Gruber et al., Global Lithium Availability and Electric Vehicles 15

R E S E A R C H A N D A N A LYS I S
Supporting Information
Additional supporting information may be found in the online version of this article:
Supporting Information S1: This supporting information provides detailed data and informa-tion regarding both the characterization of global lithium resources and lithium demand.
Please note: Wiley-Blackwell is not responsible for the content or functionality of any supportinginformation supplied by the authors. Any queries (other than missing material) should bedirected to the corresponding author for the article.
16 Journal of Industrial Ecology