Embed Size (px)
Citation preview

2017
G20/OECD INFE CORE COMPETENCIES FRAMEWORK ON FINANCIAL LITERACY FOR ADULTS
GLObAL INSURANCE MARKET TRENDS

OECD Insurance and Private Pensions Committee
The importance of insurance as a foundation for economic activity was acknowledged at the inception of the OECD with the creation of the Insurance Committee in 1961. The scope of activities of the Insurance Committee has gradually widened, and now covers the topic of private pensions, reflecting the importance of private pension systems in OECD countries (the Committee was accordingly renamed the Insurance and Private Pensions Committee in 2005).
Today, the Committee’s work focuses on: strengthening market and regulatory surveillance and transparency of the insurance sector and private pension systems; promoting the role of insurance in providing protection against risks within the economy and society, including long-term retirement savings, and enhancing financial resilience to shocks, including disasters; supporting insurance market efficiency, stability, and trust; promoting the role of funded private pensions, taking into account the overall pension system and its contribution to the level of retirement income, to ensure adequate retirement income within a cost-effective, stable, and sustainable framework, and complementing the public pension system; supporting the contribution of insurers and private pensions – along with other institutional investors and banks – to long-term investment and growth; and ensuring appropriate protection of policyholders and pension plan participants, adequate financial education and awareness given financial and other risks, and access to insurance and private pension systems.
The Committee engages in a range of co-operative activities with non-OECD economies.
More information on the Committee’s work is available at: www.oecd.org/daf/fin/insurance.
Global Insurance Statistical database: www.oecd.org/daf/fin/insurance/oecdinsurancestatistics.htm
© OECD 2018
This work is published on the responsibility of the Secretary-General of the OECD. The opinions expressed and arguments employed herein do not necessarily reflect the official views of OECD member countries. This document, as well as any statistical data and map included herein, are without prejudice to the status of or sovereignty over any territory, to the delimitation of international frontiers and boundaries and to the name of any territory, city or area. The statistical data for Israel are supplied by and under the responsibility of the relevant Israeli authorities. The use of such data by the OECD is without prejudice to the status of the Golan Heights, East Jerusalem and Israeli settlements in the West Bank under the terms of international law.

3
Foreword
This seventh edition of the Global Insurance Market Trends provides an overview of market trends to
better understand the insurance industry’s overall performance and health. This monitoring report is
compiled using data from the OECD Global Insurance Statistics (GIS) database.
The OECD has collected and analysed data on insurance in OECD countries such as the number of
insurance companies and employees, insurance premiums and investments by insurance companies dating
back to the beginning of the 1980s. The framework of this exercise was expanded several years ago to
include the collection of key balance sheet and income statement items for the direct insurance and
reinsurance sectors.
The geographical reach of the insurance statistics database is constantly expanding and will continue to do
so in the future. In addition to OECD countries, this edition covers: a number of non-OECD Latin
American countries, achieved through cooperation with the Association of Latin American Insurance
Supervisors (ASSAL); several non-OECD countries in Asia; as well as Lithuania, South Africa and, for the
first time, Tunisia.
This monitoring report and the GIS database provide an increasingly valuable cross-country source of data
and information on insurance sector developments for use by governmental and supervisory authorities,
central banks, the insurance sector and broader financial industry, consumers and the research community.


5
TABLE OF CONTENTS
FOREWORD ................................................................................................................................................... 3
HIGHLIGHTS ................................................................................................................................................. 7
GLOBAL INSURANCE MARKET TRENDS ............................................................................................... 8
Underwriting performance ........................................................................................................................... 8 Annual real gross premium growth in the life and non-life insurance sectors ....................................... 10 Claims development: Life sector ............................................................................................................ 12 Claims development: Non-life sector ..................................................................................................... 13 Combined ratio: Non-life sector ............................................................................................................. 14
Investment allocation and performance ..................................................................................................... 16 Portfolio allocation: Life insurers........................................................................................................... 16 Portfolio allocation: Non-life insurers .................................................................................................... 20 Portfolio allocation: Composite insurers ................................................................................................ 23 Investment returns .................................................................................................................................. 26
Profitability: Return on equity ................................................................................................................... 27 Change in equity position ....................................................................................................................... 28
ADDITIONAL NOTES ................................................................................................................................ 30
Notes to be taken into consideration when interpreting the data ............................................................... 30
STATISTICAL ANNEX ............................................................................................................................... 32
Figures
Figure 1. Participants to the OECD exercise subject to Solvency II (SII) reporting requirements 9 Figure 2. Amount of direct premiums of all insurance companies by area, in 2016 9 Figure 3. Annual real gross premium growth (direct) in the life and non-life sectors
in selected countries, 2016 10 Figure 4. Annual real growth of gross claims payments in the life sector in selected countries, 2016 12 Figure 5. Annual real growth of gross claims payments in the non-life sector in selected countries, 2016 14 Figure 6. Combined ratio for the non-life sector in selected countries, 2015-2016 15 Figure 7. Investment portfolio allocation of domestic direct life insurers in selected countries, 2016 18 Figure 8. Direct investments to public and private-sector bonds by domestic direct life insurers
in selected countries, 2016 19 Figure 9. Investment portfolio allocation of domestic direct non-life insurers, 2016 21 Figure 10. Direct investments to public and private-sector bonds by domestic direct non-life insurers
in selected countries, 2016 22 Figure 11. Investment portfolio allocation of domestic composite insurers in selected countries, 2016 24 Figure 12. Direct investments to public and private-sector bonds by domestic direct composite
insurers in selected countries, 2016 25 Figure 13. Average real net investment return by type of domestic insurer in selected countries in 2016 26 Figure 14. Return on equity by type of insurer in selected countries in 2016 28 Figure 15. Change in equity position by type of insurer in selected countries, 2016 29

6
Tables
Table 1. Average real net investment return by type of domestic insurer
in selected countries, 2015-2016 .......................................................................................................... 32 Table 2. Return on equity by type of insurer in selected countries, 2014-2016 ........................................... 33 Table 3. Change in equity position by type of insurer in selected countries, 2015-2016 ............................. 34

7
HIGHLIGHTS
The implementation of Solvency II was one of the major changes in the European insurance
industry in 2016, impacting activities of both insurance companies and the authorities supervising
them. To a certain extent, this transition has led to changes in information collection in EU/EEA
countries, making analysis of trends difficult for some countries during the transitional period
(between 2015 and 2016).
The insurance industry continued to thrive in most countries that were analysed, achieving a strong
underwriting performance again in 2016. This performance was possible through an increase in
gross premiums in most countries reaching levels that exceeded overall amounts of claims
payments and expenses. Several factors drive the developments of the insurance markets, such as
the customer’s perception of insurance products (relevant for both life and non-life markets). The
macroeconomic context can have a significant impact on the insurance industry, leading to a
higher demand of insurance products during economic growth but, conversely, lower demand
when the economy slows down. In the non-life sector, the frequency and severity of disasters that
insurance companies cover also have a major impact on gross claims paid. In New Zealand, claims
payments are returning to lower levels following a severe earthquake in 2011.
Investment returns of insurers continued to be positive in 2016 in most countries. Bonds, which are
seen as a stable source of income, usually account for the largest part of insurers’ portfolios,
irrespective of whether they are engaged in life or non-life insurance activities, or both. However,
in the context of prolonged low interest rates, some countries, such as Switzerland, may be
witnessing reinvestment risk related to bonds materialising, as old bonds with higher yields mature
and new bonds purchased by insurers generate lower returns. In Israel, some insurers are
increasing their lending activities, potentially as a result of the low interest rate environment and
possibly in search for yield.
The insurance business remained profitable in most countries in 2016, with positive returns on
equity observed and an increase in shareholders’ equity. Small or new insurers starting operations
may encounter difficulties in generating positive net income (such as in Costa Rica).
8
GLOBAL INSURANCE MARKET TRENDS
One of the major changes in 2016 was the implementation of the Solvency II reporting requirements
among EU/EEA countries. These requirements led to changes in national data collection, making analysis
of trends in the insurance sector more difficult in some countries during the 2016 transitional period. This
edition of Global Insurance Market Trends shows trends in EU/EEA participating countries where the data
collection method allowed reporting of data in a similar fashion (see Box 1).
The structure of this report remains the same as before, focusing first on underwriting performance in the
life and non-life insurance sectors, before examining asset allocation, investment returns and profitability
by type of insurance company.
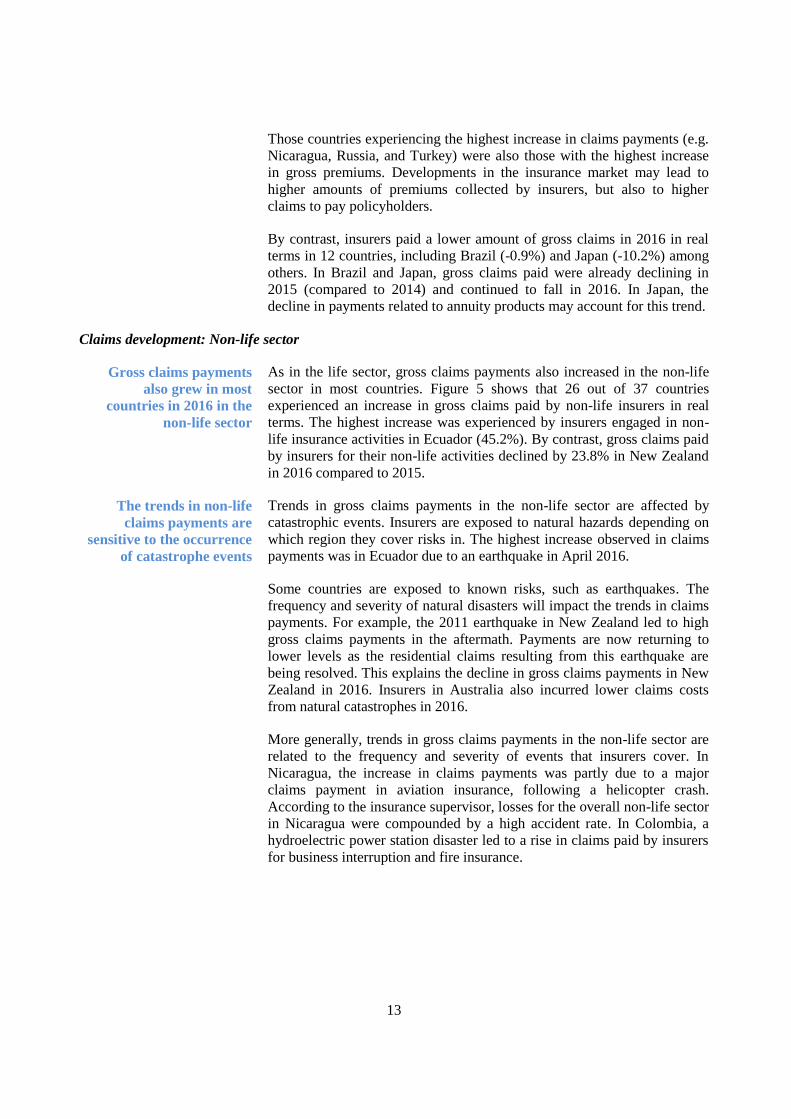
Underwriting performance
Gross premiums grew in both the life and non-life sectors among the
reporting countries under analysis. In many countries, the insurance market
is maturing, giving room for future expansion. An increase in premiums
can be explained by an increase in insurance contract sales and/or an
increase in the contract price. Economic growth can lead to a higher
demand of insurance products, while a competitive insurance market can
lead to a decline in insurance contract prices that individuals and
companies can purchase.
As the insurance market generally expanded in 2016, the amount of claims
paid also continued to increase. The drivers of claims payments differ in
the life and non-life sectors, although some, such as the customers’
perception, may be common to both. In the non-life sector, natural hazards
are one of the main factors driving claims paid.
Insurers achieved an overall underwriting profit in the non-life segment in
most countries in 2016. This shows that premiums written exceeded the
amount of claims paid by insurers, their operating costs and commissions
paid.
Insurance markets
continued their
expansion in 2016

9
Box 1. Implementation of Solvency II reporting requirements and impact on the OECD exercise
Solvency II is the new supervisory framework of the European Union (EU) for insurance and reinsurance companies, which
was implemented in 2016. This framework includes harmonised reporting requirements across countries that are members of
the EU or the European Economic Area (EEA). Insurance companies are expected to produce two reports: the Solvency and
Financial Condition Report and the Regulatory Supervisory Report. These two reports are based on quantitative reporting
templates and national specific templates. The quantitative reporting templates are required annually, and some of the items in
the templates are required on a quarterly basis. The standardised statistics are compiled and published by EIOPA at:
https://eiopa.europa.eu/Pages/Financial-stability-and-crisis-prevention/Insurance-Statistics.aspx
Following the introduction of Solvency II reporting requirements, insurance supervisors had to change their IT systems in order
to collect the required data. Overall, 31 European countries, including 24 OECD countries, follow these requirements to feed
into EIOPA’s statistics.
The OECD collects insurance statistics from OECD countries and beyond. Figure 1 shows the sample of countries participating
in the OECD Global Insurance Statistics exercise, highlighting EU/EEA countries which are subject to Solvency II reporting
requirements. Insurance companies in EU/EEA countries collected gross premiums worth USD 1.2 trillion in 2016,
representing 28% of premiums collected by insurance countries in all participating countries (Figure 2).
Under Solvency II provisions, balance sheets and prudential requirements are based on economic valuations. Data for 2016
collected within this framework may not be comparable with data collected for previous years. The use of lines of business
within the Solvency II framework may introduce discrepancies with data previously collected according to classes of insurance,
especially when countries only rely on data collected within the Solvency II framework to fill out the OECD survey.
Figure 1. Participants to the OECD exercise subject to Solvency II (SII) reporting requirements
Note: Countries in the lightest (grey) colour are currently not part of the OECD exercise.
Figure 2. Amount of direct premiums of all insurance companies by area, in 2016
In USD trillion
Source: OECD Global Insurance Statistics.
0.0
0.5
1.0
1.5
2.0
2.5
3.0
3.5
Participants to the OECD exercisesubject to SII reporting requirements
Participants to the OECD exercisenot subject to SII reporting
requirements

10
Annual real gross premium growth in the life and non-life insurance sectors
Gross premiums grew on average in both the life and non-life insurance
sectors in real terms in 2016. In 2016, gross premiums increased on
average by 3.7% in the life sector and 2.0% in the non-life sector among
40 reporting countries (Figure 3). A growth of gross premiums occurred in
both life and non-life sectors in 14 of these countries, mainly located in
Latin America (e.g. Chile, Colombia and Nicaragua), North America (e.g.
Canada) and Asia (e.g. Korea, Singapore).
Figure 3. Annual real gross premium growth (direct) in the life and non-life sectors in selected countries, 2016
In per cent
Notes: Countries are labelled with their ISO code. ISO codes are available on the United Nation Statistics Division internet page, ‘Countries and areas, codes and abbreviations’ at the following address: http://unstats.un.org/unsd/methods/m49/m49alpha.htm.
The red triangle shows the simple average of the growth of gross premiums in the life and non-life sectors in 2016 among the selected countries. Data refer to all undertakings reporting in the countries (i.e. domestic undertakings and branches and agencies of foreign undertakings operating in the reporting countries) except in some cases, such as for Bolivia, Canada and Panama where data refer to domestic undertakings only. Data include reinsurance business accepted for El Salvador, South Africa. Data for New Zealand refer to the growth rates of net written premiums of all undertakings.
Source: OECD Global Insurance Statistics.
Slightly more than half of the reporting countries observed an increase in
life gross premiums. In 2016, 22 out of 40 analysed countries exhibited a
positive growth rate of life gross premiums. The highest increases were
observed in Costa Rica, Turkey and Russia where life gross premiums
soared by more than 30% in real terms between 2015 and 2016. By
contrast, the overall amount of life gross premiums shrank the most in
three European countries: Finland (-27.6%), Portugal (-24.0%) and Poland
(-14.1%), partly as a result of a decline of premiums for unit-linked
products in these countries.
FIN
PRT
POL
AUS
PER
ITA JPN
AUT
CZE
CHE
LUX
BEL
DEU
ZAF
SVN
NOR
USASLV
KOR
HUN
LTU
ECU
GTM
NZL
MYS
ISR
CAN
BOL
SGP
PAN
COL
BRA
MEX
CHL
NIC
IDN HKG
CRI
TUR
RUSAverage
-15
-10
-5
0
5
10
15
20
25
30
-40 -30 -20 -10 0 10 20 30 40 50 60 70
Non-life sector
Life sector
Gross premiums grew on
average in both the life
and non-life sectors

11
Overall trends may hide disparities in the evolution of premiums for
specific life insurance activities. For instance, in Hong Kong (China), the
amount of gross premiums related to life and annuity products increased,
while the amount of premiums for unit-linked products declined between
2015 and 2016. This decline slowed the overall growth of life premiums in
Hong Kong (China) in 2016, which was still around 25%.
Several factors may have an influence on the sales of life insurance
products, which in turn impact premium volume. Customer demand for
insurance products may be affected by taxes related to these products, their
fees, the returns they offer to policyholders, the availability of alternative
financial products and the perception of these products by customers.1 On
the supply side, interest rates were still low in 2016, affecting the types of
insurance product being offered with guarantees. Swiss authorities
reported that insurance companies scaled back their activities related to the
selling of life insurance products with guaranteed interest, as a reaction to
market interest rates falling below 0%.
Regulation can also impact the insurance industry. For example, premiums
for annuity products declined in Peru in 2016 following the application of
a law allowing pensioners to withdraw 95.5% of their savings from private
pension accounts as a lump sum upon retirement.
In the non-life sector, premiums increased in 25 out of 40 countries
analysed. In 2016, the strongest increase of gross premiums in real terms
was experienced by insurers engaged in non-life activities in Poland
(15.9%), followed by Costa Rica (13.1%), Turkey (11.6%) and Lithuania
(11.3%). By contrast, the biggest decline in the non-life sector occurred in
Ecuador in 2016 (-11.5%).
The drop in non-life gross premiums in Ecuador was related to the
economic slowdown in this country. In Malaysia, the slight decline in non-
life gross premiums (-0.8% in real terms) in 2016 may be related to
economic conditions, with lower oil prices affecting offshore oil activities
and therefore marine insurance. Related but in contrast, in Mexico, the
state-owned petroleum company PEMEX renewed a multi-annual
insurance contract in June 2015, which reinforced growth in non-life
premiums in Mexico.
Motor insurance was reported as one non-life activity which contributed to
the increase in non-life gross premiums in some fast growth countries.
National authorities from Costa Rica, Hungary, Poland, Turkey and
Nicaragua, for instance, mentioned motor insurance as one of the drivers
of increased premiums.
1 Some factors, such as customers’ perception, may also be relevant in the non-life sector, especially when
the purchase of an insurance contract is voluntary.
Overall trends may hide
different trends by
type of activity
Several factors can
influence the demand
and supply of life
insurance products
The macroeconomic
environment can influence
the development of the
non-life insurance sector

12
Both life and non-life insurance may have room to expand as penetration
of these sectors is still relatively low, compared to the size of the economy
(measured by GDP). Therefore, further expansion of insurance markets
and gross premiums may be expected over the long-run, depending on the
economic context.
Claims development: Life sector
Gross claims payments increased in real terms in 24 out of the 36 reporting
countries (Figure 4). Gross claims paid increased by more than 20% in real
terms in three countries: Nicaragua (33.9%), Turkey (31.6%) and Russia
(22.1%). Seven other countries, from Latin America or Asia, experienced a
growth of claims payments by more than 10%. Claims payments increased
at a slower pace in 2016 in other countries, including the United States
(1.2%).
Figure 4. Annual real growth of gross claims payments in the life sector in selected countries, 2016
In per cent
Notes: The claims payments indicator includes variations in outstanding claims provisions to better reflect the magnitude of the industry’s obligations in 2016 as a result of insured events that occurred. (1) When the breakdown of gross claims paid or changes in outstanding claims provisions for composite undertakings into their life and non-life businesses was not available, the breakdown in each subsector was assumed to be the same as the one for gross written premiums. (2) Variations in outstanding claims provisions are not taken into account in the chart. Source: OECD Global Insurance Statistics.
33.931.6
22.115.6
14.113.613.1
11.910.610.4
9.28.9
6.05.45.34.9
3.13.12.11.81.41.21.10.2
0.0-0.9-1.2
-5.4-5.5
-6.7-6.7
-9.0-10.1-10.2
-11.6-14.7
-50 -40 -30 -20 -10 0 10 20 30 40 50
Nicaragua (1)TurkeyRussia
Korea (2)Chile (2)
Costa RicaIndonesia
Guatemala (2)Mexico (2)
PeruLithuania (1)
FinlandIsrael
GermanySingapore (2)
SwitzerlandMalaysia
Australia (2)New Zealand (2)
ColombiaHungary
United StatesSlovenia
Norway (2)Denmark (2)
BrazilLuxembourg
BelgiumPoland
South AfricaPortugalEcuador
AustriaJapan
ItalyCzech Republic
Both life and non-life
insurance may have room
to further expand
Gross claims payments
increased in most
cases, but the range
of this increase differs
across countries
13
Those countries experiencing the highest increase in claims payments (e.g.
Nicaragua, Russia, and Turkey) were also those with the highest increase
in gross premiums. Developments in the insurance market may lead to
higher amounts of premiums collected by insurers, but also to higher
claims to pay policyholders.
By contrast, insurers paid a lower amount of gross claims in 2016 in real
terms in 12 countries, including Brazil (-0.9%) and Japan (-10.2%) among
others. In Brazil and Japan, gross claims paid were already declining in
2015 (compared to 2014) and continued to fall in 2016. In Japan, the
decline in payments related to annuity products may account for this trend.
Claims development: Non-life sector
As in the life sector, gross claims payments also increased in the non-life
sector in most countries. Figure 5 shows that 26 out of 37 countries
experienced an increase in gross claims paid by non-life insurers in real
terms. The highest increase was experienced by insurers engaged in non-
life insurance activities in Ecuador (45.2%). By contrast, gross claims paid
by insurers for their non-life activities declined by 23.8% in New Zealand
in 2016 compared to 2015.
Trends in gross claims payments in the non-life sector are affected by
catastrophic events. Insurers are exposed to natural hazards depending on
which region they cover risks in. The highest increase observed in claims
payments was in Ecuador due to an earthquake in April 2016.
Some countries are exposed to known risks, such as earthquakes. The
frequency and severity of natural disasters will impact the trends in claims
payments. For example, the 2011 earthquake in New Zealand led to high
gross claims payments in the aftermath. Payments are now returning to
lower levels as the residential claims resulting from this earthquake are
being resolved. This explains the decline in gross claims payments in New
Zealand in 2016. Insurers in Australia also incurred lower claims costs
from natural catastrophes in 2016.
More generally, trends in gross claims payments in the non-life sector are
related to the frequency and severity of events that insurers cover. In
Nicaragua, the increase in claims payments was partly due to a major
claims payment in aviation insurance, following a helicopter crash.
According to the insurance supervisor, losses for the overall non-life sector
in Nicaragua were compounded by a high accident rate. In Colombia, a
hydroelectric power station disaster led to a rise in claims paid by insurers
for business interruption and fire insurance.
Gross claims payments
also grew in most
countries in 2016 in the
non-life sector
The trends in non-life
claims payments are
sensitive to the occurrence
of catastrophe events

14
Figure 5. Annual real growth of gross claims payments in the non-life sector in selected countries, 2016
In per cent
Notes: The claims payments indicator includes variations in outstanding claims provisions to better reflect the magnitude of the industry’s obligations in 2016 as a result of insured events that occurred. (1) When the breakdown of gross claims paid or changes in outstanding claims provisions for composite undertakings into their life and non-life businesses was not available, the breakdown in each subsector was assumed to be the same as the one for gross written premiums. (2) Variations in outstanding claims provisions are not taken into account in the chart.
Source: OECD Global Insurance Statistics.
Combined ratio: Non-life sector
The combined ratio measures the operational underwriting profitability of
insurance companies in the non-life sector on their direct business,
allowing for the disaggregation of the sources of profitability.2 It is the
aggregation of the loss ratio (which measures claims paid and changes in
claims provisions relative to gross premiums written) and the expense ratio
(which measures expenses incurred and commissions relative to gross
premiums written). A lower combined ratio can be due to higher
premiums, better cost control and/or more rigorous management of risks
covered in insurance classes. A combined ratio of more than 100%
2 The combined ratio in this report is defined as the sum of gross claims paid, the variation in outstanding
claims provisions, gross operating expenses and gross commissions divided by gross written premiums (for
direct business only). It should be noted that the inclusion of reinsurance pay-outs in the calculation would
be likely to have material impacts for many countries and could lead to some underwriting results
calculated as losses becoming overall underwriting profits.
45.238.0
33.818.4
16.415.814.8
11.110.310.39.2
7.97.77.5
6.25.5
3.63.52.92.72.42.21.91.40.80.3
-0.4-0.5-1.1-1.5
-5.3-7.1
-10.2-10.3
-15.7-17.6
-23.8
-50 -40 -30 -20 -10 0 10 20 30 40 50
EcuadorNicaragua (1)
ColombiaFinland
Singapore (2)Poland
IsraelPortugal
Mexico (2)South AfricaLithuania (1)
JapanHong Kong (China) (2)
Guatemala (2)Turkey
Korea (2)Russia
MalaysiaSwitzerland
United StatesHungaryChile (2)
LuxembourgSlovenia
Czech RepublicBelgium
ItalyAustria
GermanyPeru
Australia (2)Denmark (2)
BrazilIndonesia
Costa RicaNorway
New Zealand (2)

15
represents an underwriting loss for a non-life insurer. It should be noted
that an underwriting loss does not indicate an overall loss, as these losses
can be recovered through investment earnings.
In most of the reporting countries under analysis (35 out of 39), insurers
engaged in non-life insurance activities achieved an underwriting profit
(Figure 6). Mexico showed the lowest combined ratio in the non-life sector
in 2016 (68.2%).
The combined ratio declined in 15 out of the 36 countries for which both
2015 and 2016 values are available. The largest improvement of the
combined ratio occurred in Costa Rica where insurers managed to attain a
combined ratio below 100% (from 104.5% in 2015 to 79.7% in 2016) due
to a lower loss ratio and lower administrative expenses.
Figure 6. Combined ratio for the non-life sector in selected countries, 2015-2016
In per cent
Notes: In this report, the combined ratio is calculated as the sum of gross claims payments, changes in outstanding claims provisions, gross operating expenses, and gross commissions divided by gross written premiums. i.e., Combined ratio = “Loss ratio” + “Expense ratio”, where:
• Loss ratio = (Gross claims paid + changes in outstanding claims provisions) / gross written premiums (the latter used as a proxy for gross earned premiums); and, • Expense ratio = (Gross operating expenses + commissions) / Gross written premiums.
The combined ratio is used in analysing the underwriting performance of insurance companies, especially for non-life insurance where the risk exposure is short-term -- generally one year. The use of the combined ratio for long-term business, such as life insurance, is of limited use only. When available, this chart shows the breakdown of the combined ratio between loss and expense ratio in 2016. (1) Variations in outstanding claims provisions are not taken into account in the calculation of the combined ratio. (2) Source: NAIC. Data refer to the combined ratio of the US property and casualty insurance industry. (3) Data include reinsurance accepted business. (4) Data include business abroad. (5) Earned premiums (instead of gross written premiums) for direct insurers were used in the calculation of the combined ratio. The numerator of the combined ratios includes reinsurance business accepted by direct insurers. (6) Source: Insurance Sweden. (7) Data refer to domestic undertakings only.
Source: OECD Global Insurance Statistics.
0
20
40
60
80
100
120
Loss ratio in 2016 Expense ratio in 2016 Combined ratio in 2015
An overall underwriting
profit was achieved in
most countries in 2016

16
Insurers in four countries recorded an overall underwriting loss in 2016:
the United States (with a combined ratio of 100.7% for the property and
casualty insurance industry), Hungary (101.3%), Ecuador (112.5%) and
Bolivia (115.5%). The US National Association of Insurance
Commissioners explains this underwriting loss in 2016 as a result of
unfavourable loss trends within auto lines and higher catastrophe losses
(e.g. severe storms and Hurricane Matthew).3 The underwriting loss in
Ecuador was due to claims paid following the earthquake in April 2016.
The high combined ratio in Bolivia and Hungary can probably be
accounted for by the expense ratios, which are the highest among reporting
countries (45.4% and 50.9% respectively).
In general, the loss ratio accounted for the majority of the combined ratios.
Investment allocation and performance
The OECD has modified its statistical exercise in order to capture the
investment allocation of insurance companies in more detail. The changes
consisted of the introduction of new categories (e.g. structured products,
hedge funds) that allow for a better understanding of what was reported
under “other investments” in previous editions of this report. Investments
by insurance companies through collective investment schemes are now
collected separately as well. This last change allows assessing the direct
exposure of insurance companies towards some assets.
Data collected for 2016 in this new framework showed that bonds were
dominant in the portfolios of all types of insurance company. Most of the
bonds are purchased directly by insurance companies. They may however
have a larger exposure to bonds through their investments in collective
investment schemes which may invest in bonds as well.
Overall, insurers achieved positive real investment rates of return in most
countries, irrespective of whether they engage in life or non-life insurance
activities.
Portfolio allocation: Life insurers
Despite the low interest rate environment, bonds continued to represent a
large portion of direct investments of life insurance companies in 2016 in
most reporting countries (Figure 7). Life insurance companies (33 out of
43 reporting countries under review) held more than 50% of their assets in
bonds (excluding assets held for unit-linked products).4 Life insurers in
Korea also held close to 50% of their assets in bonds. Life insurers in
Mexico held the largest proportion of their assets in bonds (more than
3 See NAIC’s “U.S. Property and Casualty and Title Insurance Industries":
www.naic.org/documents/topic_insurance_industry_snapshots_2016_prop_cas_title_ins_ind_report.pdf
4 Life insurers invest assets related to unit-linked products on behalf of policyholders. However, in this case,
life insurers do not bear the investment risk which falls to the policyholder. Assets linked to unit-linked
products are excluded from this analysis.
Bonds are predominant in
the portfolio of all types of
insurance company
Bonds continue
to dominate life
insurers’ portfolios

17
95%). A recent regulation in Mexico changed the investment regime to
allow insurers to invest in a wider range of assets. This may lead to future
changes in the asset allocation of life insurers in Mexico.
Most investments in bonds were directed towards bonds issued by public
institutions (Figure 8). Life insurers invested more in public sector bonds
than in private sector bonds in 26 out of 37 countries, for which the
breakdown by issuer is available. Life insurers in Argentina, Greece,
Hungary, India, Israel, Italy, Japan, Lithuania, Mexico, Poland, Portugal,
Puerto Rico, Spain and the United States held more than half of their
overall portfolio (excluding unit-linked products) in public sector bonds. In
four other countries (namely Colombia, Iceland, Ireland and Korea),
insurers have more than 40% of their overall portfolios in public sector
bonds. Bonds held by life insurers in Colombia were treasury bonds (TES).
The overall exposure of life insurers to bonds may be even higher when
taking into account their investment in collective investment schemes. Life
insurers invest almost 50% of their assets through collective investment
schemes in Austria, close to 40% in Brazil, and a bit more than 30% in
Germany.
Life insurers in some countries invested significantly in equities. In five
countries, life insurers invested more than 20% of their assets in equities:
Denmark, Singapore, South Africa, Sweden and Turkey.
In some countries, life insurers held a significant share of their assets in
cash and deposits. Life insurers had 21.4% of their assets in cash and
deposits in Israel, 22.6% in Estonia and 38.3% in Turkey.
Life insurers can also invest in other instruments than the ones mentioned
above. For example, life insurers invested more than 10% of their assets in
land and buildings in Chile, Norway and Switzerland; in loans in Belgium,
Chile, Germany, Korea, Norway, Switzerland and the United States; and in
private equity funds in Brazil and Ecuador.
Life insurers invested
significantly in equity in
some countries

18
Figure 7. Investment portfolio allocation of domestic direct life insurers in selected countries, 2016
As a percentage of total investment
Notes: Data exclude assets linked to unit-linked products where risk is fully borne by policyholders. (1) The negative value that was reported for investments in structured products was excluded from the calculation of the asset allocation. (2) Data refer to domestic investments only. Source: OECD Global Insurance Statistics.
0 20 40 60 80 100
Mexico
Greece
Portugal
Italy
Hungary
Spain
Peru
Puerto Rico
India
Israel
Colombia
El Salvador
Lithuania
United States (1)
Estonia
France
Poland
Japan
Argentina
Ireland
Bolivia
Slovenia
Norway
Chile
Iceland
Singapore (1)
Switzerland
Russia (2)
United Kingdom
Finland
Malaysia
Belgium
Luxembourg
Korea
Austria
Germany
Sweden
Indonesia
Denmark
Brazil
Turkey
South Africa
Ecuador
Bills and bonds issued by public and private sector Equity
Cash and Deposits Land and buildings
Loans Collective Investment Schemes (CIS)
Private equity funds Hedge Funds
Structured products Other Investments

19
Figure 8. Direct investments to public and private-sector bonds by domestic direct life insurers in selected countries, 2016
As a percentage of total investment
Notes: Data exclude assets linked to unit-linked products where risk is fully borne by policyholders. (1) Data refer to domestic investments only. Source: OECD Global Insurance Statistics.
92.8
83.7
80.7
78.6
67.8
65.5
62.6
60.7
58.6
54.6
53.0
51.5
50.5
50.3
45.6
43.3
42.7
41.5
38.1
34.4
34.3
31.3
31.0
28.8
26.9
26.8
26.0
25.4
24.8
24.5
23.9
21.3
19.1
8.8
8.5
8.3
3.4
1.6
12.8
3.9
0.0
3.3
14.6
18.3
16.8
26.3
28.6
17.9
22.1
36.9
20.5
21.8
16.9
6.6
36.9
33.9
29.5
20.4
40.4
32.1
53.4
23.6
50.9
2.7
30.8
34.2
2.8
33.4
11.3
20.4
6.7
53.4
11.7
58.1
0 20 40 60 80 100
Greece
Mexico
Hungary
Israel
Poland
India
Puerto Rico
Lithuania
Italy
Spain
Japan
United States
Portugal
Argentina
Ireland
Iceland
Korea
Colombia
Estonia
Bolivia
Belgium
France
Slovenia
Peru
Luxembourg
El Salvador
Brazil
United Kingdom
Switzerland
Turkey
Russia (1)
Indonesia
Austria
Ecuador
Norway
South Africa
Chile
Public sector bonds Private sector bonds

20
Portfolio allocation: Non-life insurers
Bonds are seen as a stable source of income for non-life insurers as well.
Overall, non-life insurers in 24 countries out of the 49 reporting countries
allocated more than 50% of their portfolios in bonds (Figure 9). Non-life
insurers held more than 75% of their assets in bonds in Guatemala, India
and Mexico.
Figure 10 shows that public sector bonds represented more than half of the
investments of non-life insurers in eight countries: Puerto Rico (50.5%),
Portugal (50.9%), Latvia (51.2%), Poland (51.9%), Mexico (52.6%), the
United States (55.8%), Hungary (64.9%) and Lithuania (65.7%).
Non-life insurers invested through collective investment schemes in some
Latin American and European countries, with 50.4% investing through
collective investment schemes in Brazil, 30.0% in Argentina and 29.1% in
Germany.
Non-life insurers in some countries allocated a significant part of their
portfolios in equities. Non-life insurers held more than 25% of their assets
in equities in Austria, El Salvador, France, Iceland, South Africa, Sweden
and the United States. In Iceland, 17.2% of the assets of non-life insurers
were held in listed equities and 14.9% in unlisted equities.
In several countries, cash and deposits are significant in the portfolios of
non-life insurers in Asia (e.g. Malaysia, Singapore), Europe (e.g. Czech
Republic, Latvia) and Latin America (e.g. Chile, Costa Rica).
Non-life insurers have, in some countries, decided to allocate a significant
share of their assets to land and buildings (more than 10% in Bolivia and
Peru), loans (e.g. in Costa Rica, Germany, Korea, Singapore) or private
equity funds (e.g. Ecuador). National authorities in Israel have noticed a
relative growth in lending by insurance companies, which was viewed as
searching for yield. In 2016, loans in non-life insurance companies
represented almost 5% of their assets.
Bonds also dominate the
portfolio of non-life
insurers
Non-life insurers in some
countries allocated a
significant part of their
portfolios in equity

21
Figure 9. Investment portfolio allocation of domestic direct non-life insurers, 2016
As a percentage of total investment
Notes: Data exclude assets linked to unit-linked products where risk is fully borne by policyholders. (1) The negative value that was reported for investments in structured products was excluded from the calculation of the asset allocation. (2) Data refer to domestic investments only.
Source: OECD Global Insurance Statistics.
0 20 40 60 80 100
Guatemala
India
Mexico
Estonia
Colombia
Portugal
Italy
Slovenia
Paraguay
United Kingdom
Hungary
Norway
Lithuania
Israel
Australia
United States (1)
Denmark
Puerto Rico
Ireland
Chile
Belgium
Greece
Poland
Latvia
Luxembourg
Finland
Costa Rica
Argentina
France
Iceland
Spain
Brazil
Czech Republic
Germany
Peru
Sweden
El Salvador
Korea
Switzerland
Malaysia
Bolivia
Singapore (1)
Japan
Ecuador
Indonesia
Turkey
South Africa
Russia (2)
Austria
Bills and bonds issued by public and private sector Equity
Cash and Deposits Land and buildings
Loans Collective Investment Schemes (CIS)
Private equity funds Hedge Funds
Structured products Other Investments

22
Figure 10. Direct investments to public and private-sector bonds by domestic direct non-life insurers in selected countries, 2016
As a percentage of total investment
Notes: Data exclude assets linked to unit-linked products where risk is fully borne by policyholders. (1) Data do not include investments in bonds issued by foreign issuers (public or private). Investments in bonds issued by the Central Bank and the Ministry of Finance were classified under "public sector bonds" while investments in bonds issued by financial or non-financial public companies were classified under "private sector bonds". (2) Data refer to domestic investments only.
Source: OECD Global Insurance Statistics.
65.764.9
55.852.651.951.250.950.5
49.045.8
40.640.2
38.938.6
37.235.934.9
32.331.731.330.4
27.326.826.5
24.223.8
21.421.320.619.6
15.714.913.9
12.111.09.89.39.3
7.14.4
2.71.4
2.14.1
6.624.0
3.33.4
21.510.5
33.725.8
2.725.4
17.534.9
43.410.5
35.910.911.8
29.530.4
16.917.2
22.09.7
45.923.2
2.840.2
9.053.0
9.112.2
13.327.3
24.029.9
65.326.2
12.59.0
69.3
0 20 40 60 80 100
LithuaniaHungary
United StatesMexicoPolandLatvia
PortugalPuerto RicoGuatemala
ItalyBrazilIsrael
GreeceColombia
IndiaArgentinaSlovenia
Czech RepublicCosta Rica (1)
BelgiumIrelandIceland
SpainLuxembourg
KoreaUnited Kingdom
FranceTurkey
ChileJapan
NorwaySouth Africa
EcuadorIndonesia
El SalvadorSwitzerland
PeruEstoniaBolivia
Russia (2)Austria
Paraguay
Public sector bonds Private sector bonds

23
Portfolio allocation: Composite insurers
A number of OECD and non-OECD countries allow insurance companies
to offer insurance products classified as both life and non-life products
under the OECD classification of classes of insurance (for example, life
insurance companies in many countries offer health/accident and sickness
insurance, which is classified as non-life business under the OECD
classification). These companies are accounted for as composite
companies.
Composite companies also invest predominantly in bonds. Composite
insurers from 29 reporting countries under review invested 63.8% of their
assets directly in bonds (Figure 11). In six countries, bonds represented
more than 75% of the assets: Czech Republic, Estonia, Hungary,
Lithuania, Paraguay and Spain.
Composite insurers held more bonds issued by public institutions than by
private companies in almost all reporting countries except Austria, El
Salvador, France, Paraguay, Peru, Russia and the United Kingdom (Figure
12).
In Argentina and Brazil, composite insurers, like non-life insurers,
invested through collective investment schemes: 24.3% of the assets were
invested through pooled vehicles in Argentina, and 46.4% in Brazil.
Composite insurers in Mexico, Portugal and Singapore allocated the
largest proportion of their direct investments to equities among all
reporting countries: 16.8% for Mexico, 17.9% for Portugal and 20.5% for
Singapore.
Nicaragua is the only country which reported that more than half of the
portfolio of composite insurers was invested in cash and deposits in 2016
(50.9% according to the insurance supervisor of Nicaragua).
Assets invested in land and buildings represented less than 5% of the
portfolio of composite companies in all reporting countries, except Austria
(8.9%), Greece (5.7%) and Slovenia (5.1%). Composite insurers in
Guatemala invested close to 5% in land and buildings (4.8%).
It should be noted that loans represented more than 10% of assets of
composite companies in the following countries: Costa Rica, El Salvador
and Israel.
Finally, composite companies in Brazil and Ecuador invested more than
5% of their assets in private equity funds in 2016: 6.3% for Brazil, and
8.0% for Ecuador.
Bonds were also the
favoured investments of
composite companies
Composite insurers in
Mexico, Portugal and
Singapore invested the
most in equity

24
Figure 11. Investment portfolio allocation of domestic composite insurers in selected countries, 2016
As a percentage of total investment
Notes: Data exclude assets linked to unit-linked products where risk is fully borne by policyholders. (1) The negative value that was reported for investments in structured products was excluded from the calculation of the asset allocation. (2) Data refer to domestic investments only.
Source: OECD Global Insurance Statistics.
0 20 40 60 80 100
Czech Republic
Estonia
Spain
Hungary
Lithuania
Paraguay
Slovenia
Peru
Guatemala
Belgium
Greece
Italy
Mexico
Costa Rica
Singapore (1)
France
Malaysia
Portugal
United Kingdom
South Africa
Israel
El Salvador
Austria
Latvia
Argentina
Brazil
Ecuador
Nicaragua
Russia (2)
Bills and bonds issued by public and private sector Equity
Cash and Deposits Land and buildings
Loans Collective Investment Schemes (CIS)
Private equity funds Hedge Funds
Structured products Other Investments

25
Figure 12. Direct investments to public and private-sector bonds by domestic direct composite insurers in selected countries, 2016
As a percentage of total investment
Notes: Data exclude assets linked to unit-linked products where risk is fully borne by policyholders. (1) Data do not include investments in bonds issued by foreign issuers (public or private). Investments in bonds issued by the Central Bank and the Ministry of Finance were classified under "public sector bonds" while investments in bonds issued by financial or non-financial public companies were classified under "private sector bonds". (2) Data refer to domestic investments only.
Source: OECD Global Insurance Statistics.
74.8
65.7
63.4
61.4
59.0
56.6
54.0
53.4
52.9
51.5
50.3
48.3
47.2
45.5
43.1
42.4
38.8
38.6
33.4
30.4
28.3
27.5
22.8
19.0
18.4
9.7
1.4
3.5
11.9
0.0
8.3
24.5
21.8
19.8
25.1
17.9
21.7
21.8
23.1
16.2
6.0
21.9
31.8
4.4
10.6
34.1
3.6
45.9
27.6
16.8
46.1
38.4
66.1
9.7
0 20 40 60 80 100
Hungary
Lithuania
South Africa
Costa Rica (1)
Czech Republic
Spain
Guatemala
Estonia
Mexico
Belgium
Greece
Italy
Israel
Latvia
Portugal
Slovenia
Brazil
Argentina
France
Nicaragua
Peru
Austria
Ecuador
United Kingdom
El Salvador
Paraguay
Russia (2)
Public sector bonds Private sector bonds

26
Investment returns
In 2016, insurance companies engaged in life activities (i.e. life insurers),
non-life activities (i.e. non-life insurers) or both (i.e. composite companies)
exhibited positive real net investment rates of return in most reporting
countries (Figure 13). In 30 out of the 38 reporting countries, all types of
insurance company achieved positive returns. Returns on investment
remained positive in 2016, despite the volatility in stock markets created
by uncertainties (e.g. Brexit vote). 5
Among life insurers, real investment returns ranged from -3.0% in Turkey
to 6.3% in Iceland. Returns were positive for life insurers of 27 countries,
and were above 5% in four of them: Chile, Iceland, Indonesia and Ireland.
Life insurers failed to achieve positive investment returns (in real terms) in
six countries: Bolivia, Brazil, Canada, Estonia, Russia and Turkey. Life
insurers in these six countries had positive investment rates of return in
nominal terms in 2016, but lower than inflation. In Brazil, Russia and
Turkey, the consumer price index increased by more than 5% over 2016.
Figure 13. Average real net investment return by type of domestic insurer in selected countries in 2016
In per cent
Notes: Average annual real net investment returns calculations are based on nominal annual net investment returns reported by countries over 2016 and the variation of the consumer price index over the same period. Final data showed that insurers achieved the following nominal returns in Argentina: 36.9% for life, 36% for non-life and 31.9% for composite. In Puerto Rico, insurers achieved the following nominal returns: 3.8% for life and 1.9% for non-life. (1) Data cover conventional products only.
Source: OECD Global Insurance Statistics.
5 Table 1 provides average real net investment returns for 2015 and 2016.
-15
-10
-5
0
5
10
15
20
25
30
Life Non-Life Composite
Insurers continued to
exhibit positive investment
results in most countries
in 2016

27
In some countries, such as Switzerland, investment rates of return were
lower in 2016 than in 2015, possibly as a result of prolonged low interest
rates. Real investment rate of return of life insurers was positive in 2016
(2.7%) but lower than 2015 (4.4%). This lower performance could
potentially be attributed to the reduction of direct profits coming from
fixed-interest securities due to persistent low interest rates which have
fallen over the past years. The reinvestment risk related to the maturing of
older bonds with higher yields and the purchase of new bonds with lower
yields may be materialising in Switzerland.
Non-life insurers in some countries achieved strong investment returns.
The strongest return was experienced in Paraguay (24.7%), followed by
India (8.7%), Hungary (8.0%), Peru (6.6%) and Iceland (6.3%). Overall,
returns of non-life insurers were positive in all reporting countries except
Belgium, Bolivia, Estonia, Lithuania, Russia and Turkey. In Bolivia,
returns were slightly closer to 0% for non-life insurers than for life
insurers.
Real investment rates of return of composite insurance companies were
positive in all countries, except Russia (-8.9%). These rates were above
2% in 11 out of 20 reporting countries, including Canada (3.9%).
Composite insurers in Paraguay had a real return above 10% in 2016.
Profitability: Return on equity
Return on equity (ROE) is an indicator of profitability and income
generating capacity of insurers.6 It shows how much income insurance
companies have generated with the capital that shareholders have invested.
In 2016, ROE was positive, and sometimes very high, for all types of
insurer (i.e. life, non-life, and composite insurers) in most countries (30 out
of 34 reporting countries) (Figure 14). Profitability was high for all
insurers in Argentina, with a ROE higher than 20% for all types of insurer,
irrespective of whether they engaged only in life activities, non-life
activities or both.
The ROE of life insurers was positive in all reporting countries except for
Israel; only one small company is engaged in life activities in Israel. This
company recorded negative net profit in 2015 and 2016. Life insurers in
other countries achieved positive ROE, while sometimes lower compared
to 2015. Following an increase in shareholders’ equity in 2016, the ROE of
life insurers in Brazil declined, compared to 2015, but remained
significantly positive in 2016 (26.5%).7
6 In this report, the return on equity (ROE) is calculated as the current year’s net income divided by the
average of the current and previous year’s shareholder equity, as reported on the balance sheet calculated at
an industry level.
7 Table 2 provides returns on equity for 2014, 2015 and 2016.
But reinvestment risk
related to bonds may be
materialising in some
countries
Strong investment returns
were observed for non-life
insurers in some countries
Investment returns of
composite insurers were
positive in all countries
except one
ROE was positive for all
types of insurer in most
countries

28
The ROE of non-life insurers was also positive in almost all reporting
countries. The highest ROEs were observed in Argentina, South Africa
and Switzerland. Non-life insurers in Australia achieved a ROE above
10%, slightly improved from 2015 due to falls in property claims and
higher investment income. By contrast, in Costa Rica, the ROE of non-life
insurers continued to be negative in 2016, although it has improved since
2014 (-23.0% in 2016 compared to - 46.0% in 2015 and -68.1% in 2014).
Two non-life insurance companies (out of three) that recorded negative net
income started operations relatively recently, which may explain why they
have not yet generated positive income.
Figure 14. Return on equity by type of insurer in selected countries in 2016
In per cent
Note: ROE was calculated by dividing net income in 2016 by average shareholder equity over 2015 and 2016. Source: OECD Global Insurance Statistics.
In 2016, composite companies of all reporting countries had a positive
ROE with a strengthened ROE, exceeding 20%, occurring in some
countries, such as: Argentina, Brazil, Malaysia and Mexico.
Change in equity position
The change in equity position reveals the evolution of shareholder capital.8
Changes may occur due to dividend distributions, share buybacks and
issuance of share capital; they may also reflect unrecognised gains or
losses that do not appear in the income statement but nonetheless may be
8 The change in equity position is obtained by dividing the change in total shareholder equity relative to the
previous year over the total shareholder equity in the previous year.
-30
-20
-10
0
10
20
30
40
50
Life Non-Life Composite
Composite companies had
a positive ROE in all
reporting countries

29
important to understand the undertaking’s financial position. For instance,
unrealised gains and losses on investments held to maturity within an
investment portfolio do not appear in the income statement, yet they are
reflected in changes to shareholder equity.
Shareholder equity has increased in most cases.9 Shareholder equity
increased in 22 out of 31 reporting countries for life insurers, 25 out of 33
reporting countries for non-life insurers, and 15 out of 17 reporting
countries for composite companies (Figure 15).
In some cases, changes in shareholder equity may be impacted by a
difference in the number of insurance companies. In Israel, for instance,
the sharp decline in shareholders’ equity of non-life insurers resulted from
the cancellation of an insurer’s license because it had merged with other
insurance companies.
Figure 15. Change in equity position by type of insurer in selected countries, 2016
In per cent
Notes: Change in equity position is calculated as the change in shareholder equity divided by the level of shareholder equity from the previous year. (1) The large increase in shareholders' equity for non-life insurance companies in 2016 is due to a change in Norwegian accounting regulations applying from 2016 onwards.
Source: OECD Global Insurance Statistics.
9 Table 3 provides change in equity position for 2015 and 2016.
-80
-60
-40
-20
0
20
40
60
80
100
Life Non-Life Composite
Shareholder equity has
increased in most cases

30
ADDITIONAL NOTES
Notes to be taken into consideration when interpreting the data
This report is based on responses provided by countries to the 2017 Global Insurance Statistics (GIS)
exercise and includes qualitative information supplied by countries, or sourced from national
administrative sources. Data collected under the GIS exercise can be accessed at:
www.oecd.org/daf/fin/insurance/oecdinsurancestatistics.htm.
Given possible divergences in national reporting standards and different methods of compiling data,
caution needs to be exercised when interpreting them. For this reason, countries are regularly requested to
provide relevant methodological information to enable a thorough understanding of their submissions to
the GIS exercise. The methodological notes below provide the main explanations in this respect.
Economic data on Gross Domestic Product (GDP), exchange rates and the Consumer Price Index (CPI)
come from the IMF International Financial Statistics (IFS) and the OECD Main Economic Indicators
(MEI) databases.
According to the OECD GIS framework, data in Figures 1 to 6, Figures 14 and 15 and Tables 2 and 3,
usually refer to direct business and include domestically incorporated undertakings (i.e., incorporated
under national law) and, where data are available, branches and agencies of foreign undertakings
operating in the country. In this publication, tables and figures about asset allocation of insurers and
investment rates of return refer to domestic direct insurers only. Some countries may be unable to
exclude foreign branches of domestic undertakings, therefore, their data may include these foreign
branches.
Composite undertakings operate in a number of countries. In some countries, such as Costa Rica and
Uruguay, most insurance companies are composite companies dealing with both life and non-life
businesses.
Conventional signs: "c" means confidential; ".." means missing value (not available or not applicable).
Data for Argentina refer to end-June instead of end-December.
Data for the non-life insurance sector in Australia exclude private health insurance.
Data for the life sector in Honduras include the accident and health business of one company. Under
OECD definition, accident and health products are considered as non-life insurance products.
Data for India and Japan reflect the fiscal year ending 31 March, instead of the calendar year.
Data for Indonesia cover conventional products and Takaful insurance, unless specified otherwise.
Statistical data for Israel are supplied by and under the responsibility of the relevant Israeli authorities.
The use of such data by the OECD is without prejudice to the status of the Golan Heights, East
Jerusalem and Israeli settlements in the West Bank under the terms of international law.
Data on composite insurers from Italy and Portugal include life insurers also operating in the accident
and health line of business.

31
Data for Korea’s non-life insurance sector include private pension products offered by non-life
insurers. Private pension products are considered as life insurance products under the OECD definition.
Data for Malaysia cover global business (within and outside Malaysia), including Takaful insurance.
Data supplied for New Zealand come from Statistic New Zealand’s Annual Enterprise Survey. This is a
financial survey of organisations from across the economy, that compiles information at the latest
balance date for each organisation. Data refer to end-December for most undertakings operating in life
insurance, and to end-June for most cases for health and general insurance.
Data for Paraguay reflect the fiscal year ending 30 June, instead of the calendar year.
Data for the United States also include insurance activities in Puerto Rico.
32
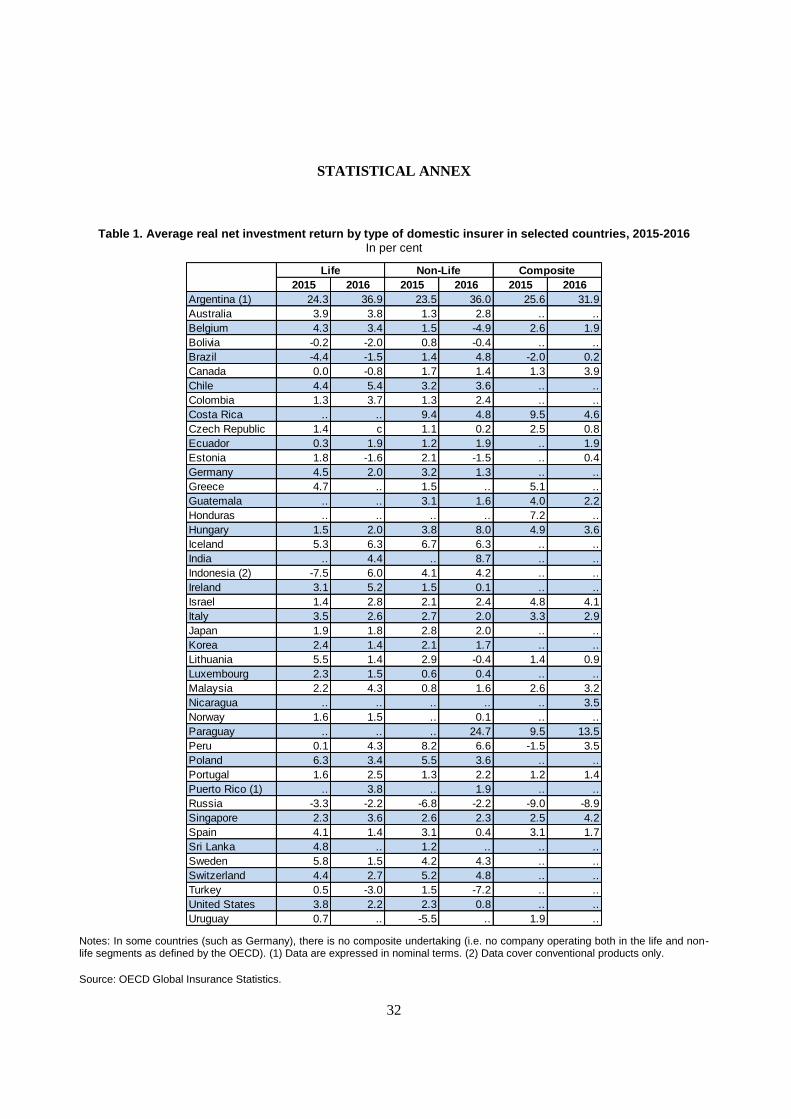
STATISTICAL ANNEX
Table 1. Average real net investment return by type of domestic insurer in selected countries, 2015-2016
In per cent
Notes: In some countries (such as Germany), there is no composite undertaking (i.e. no company operating both in the life and non-life segments as defined by the OECD). (1) Data are expressed in nominal terms. (2) Data cover conventional products only.
Source: OECD Global Insurance Statistics.
2015 2016 2015 2016 2015 2016
Argentina (1) 24.3 36.9 23.5 36.0 25.6 31.9
Australia 3.9 3.8 1.3 2.8 .. ..
Belgium 4.3 3.4 1.5 -4.9 2.6 1.9
Bolivia -0.2 -2.0 0.8 -0.4 .. ..
Brazil -4.4 -1.5 1.4 4.8 -2.0 0.2
Canada 0.0 -0.8 1.7 1.4 1.3 3.9
Chile 4.4 5.4 3.2 3.6 .. ..
Colombia 1.3 3.7 1.3 2.4 .. ..
Costa Rica .. .. 9.4 4.8 9.5 4.6
Czech Republic 1.4 c 1.1 0.2 2.5 0.8
Ecuador 0.3 1.9 1.2 1.9 .. 1.9
Estonia 1.8 -1.6 2.1 -1.5 .. 0.4
Germany 4.5 2.0 3.2 1.3 .. ..
Greece 4.7 .. 1.5 .. 5.1 ..
Guatemala .. .. 3.1 1.6 4.0 2.2
Honduras .. .. .. .. 7.2 ..
Hungary 1.5 2.0 3.8 8.0 4.9 3.6
Iceland 5.3 6.3 6.7 6.3 .. ..
India .. 4.4 .. 8.7 .. ..
Indonesia (2) -7.5 6.0 4.1 4.2 .. ..
Ireland 3.1 5.2 1.5 0.1 .. ..
Israel 1.4 2.8 2.1 2.4 4.8 4.1
Italy 3.5 2.6 2.7 2.0 3.3 2.9
Japan 1.9 1.8 2.8 2.0 .. ..
Korea 2.4 1.4 2.1 1.7 .. ..
Lithuania 5.5 1.4 2.9 -0.4 1.4 0.9
Luxembourg 2.3 1.5 0.6 0.4 .. ..
Malaysia 2.2 4.3 0.8 1.6 2.6 3.2
Nicaragua .. .. .. .. .. 3.5
Norway 1.6 1.5 .. 0.1 .. ..
Paraguay .. .. .. 24.7 9.5 13.5
Peru 0.1 4.3 8.2 6.6 -1.5 3.5
Poland 6.3 3.4 5.5 3.6 .. ..
Portugal 1.6 2.5 1.3 2.2 1.2 1.4
Puerto Rico (1) .. 3.8 .. 1.9 .. ..
Russia -3.3 -2.2 -6.8 -2.2 -9.0 -8.9
Singapore 2.3 3.6 2.6 2.3 2.5 4.2
Spain 4.1 1.4 3.1 0.4 3.1 1.7
Sri Lanka 4.8 .. 1.2 .. .. ..
Sweden 5.8 1.5 4.2 4.3 .. ..
Switzerland 4.4 2.7 5.2 4.8 .. ..
Turkey 0.5 -3.0 1.5 -7.2 .. ..
United States 3.8 2.2 2.3 0.8 .. ..
Uruguay 0.7 .. -5.5 .. 1.9 ..
Life Non-Life Composite

33
Table 2. Return on equity by type of insurer in selected countries, 2014-2016
In per cent
Notes: In some countries (such as Germany), there is no composite undertaking (i.e. no company operating both in the life and non-life segments as defined by the OECD). ROE was calculated by dividing net income for the year N by average shareholder equity over N-1 and N. Source: OECD Global Insurance Statistics.
2014 2015 2016 2014 2015 2016 2014 2015 2016
Argentina 45.9 39.0 35.2 32.4 27.8 25.8 34.2 24.8 38.3
Australia 14.1 15.4 10.1 16.7 9.6 11.9 .. .. ..
Belgium 7.3 1.3 1.8 7.1 7.3 -9.6 9.8 8.3 14.1
Brazil .. 46.3 26.5 .. 18.2 12.8 .. 20.2 22.7
Chile 12.5 13.6 13.5 4.1 5.5 10.0 .. .. ..
Colombia 16.5 14.4 20.9 3.7 3.5 7.4 .. .. ..
Costa Rica .. .. .. -68.1 -46.0 -23.0 7.3 7.6 6.9
Czech Republic .. .. 20.4 .. .. 9.2 .. .. 15.9
Denmark 9.5 3.6 7.6 17.1 10.7 16.3 .. .. ..
El Salvador 27.0 14.5 11.2 2.5 2.2 0.9 19.8 18.0 17.8
Finland 5.5 6.5 9.3 25.6 19.7 19.3 .. .. ..
Germany 5.1 3.2 2.2 3.9 4.1 4.1 .. .. ..
Guatemala .. .. .. 20.7 19.7 15.0 25.4 23.4 21.6
Hungary 6.8 7.9 11.7 4.4 5.7 17.6 17.9 25.5 23.9
Indonesia .. .. 14.8 .. .. 10.4 .. .. ..
Israel -11.4 -25.3 -18.3 15.8 7.9 2.8 12.0 7.0 6.7
Italy 12.0 12.0 8.7 14.7 11.8 8.4 8.5 8.0 8.6
Japan 14.7 12.3 13.0 13.5 19.1 19.2 .. .. ..
Korea 5.9 5.8 3.7 9.5 9.4 11.2 .. .. ..
Luxembourg 10.1 8.3 7.3 11.5 7.1 9.8 .. .. ..
Malaysia 24.7 15.5 20.4 13.3 12.1 12.7 19.8 17.5 23.5
Mexico 13.0 11.1 13.2 11.4 -0.6 15.0 20.8 17.4 26.7
New Zealand 15.0 26.7 24.8 11.0 -14.3 12.8 .. .. ..
Nicaragua .. .. .. .. .. .. 25.1 25.6 23.1
Norway 7.0 13.4 7.4 28.1 20.1 19.5 .. .. ..
Peru 17.4 16.2 17.3 15.5 20.3 15.1 21.2 17.4 14.9
Poland 23.0 24.1 18.2 17.5 12.3 8.9 .. .. ..
Portugal 7.5 10.7 1.7 -22.1 4.9 -2.2 7.1 4.6 6.3
Russia .. .. .. .. 35.5 .. .. 19.2 ..
Singapore 23.5 9.5 15.3 5.9 6.5 9.3 15.1 10.5 7.5
Slovenia 9.2 4.3 4.8 11.1 5.8 2.7 11.1 12.3 12.7
South Africa 44.4 37.9 0.0 6.0 10.6 21.3 .. .. ..
Switzerland 8.2 6.5 6.8 24.7 18.7 20.5 .. .. ..
Turkey 16.3 18.0 25.0 9.7 -11.1 14.1 .. .. ..
United States 10.5 10.5 11.8 7.1 6.2 5.4 .. .. ..
Uruguay 8.4 -7.9 .. 0.1 -0.2 .. 13.0 7.1 ..
Non-Life CompositeLife

34
Table 3. Change in equity position by type of insurer in selected countries, 2015-2016
In per cent
Notes: In some countries (such as Germany), there is no composite undertaking (i.e. no company operating both in the life and non-life segments as defined by the OECD). (1) The large increase in shareholders' equity for non-life insurance companies in 2016 is due to a change in Norwegian accounting regulations applying from 2016 onwards. Source: OECD Global Insurance Statistics.
2015 2016 2015 2016 2015 2016
Argentina 20.4 -17.2 76.6 52.0 20.2 88.7
Australia -7.8 1.6 1.2 2.5 .. ..
Austria 3.3 .. -3.0 .. -2.2 ..
Belgium 8.6 25.4 -14.8 -14.3 -3.8 -1.8
Brazil 106.6 8.0 -2.2 3.4 -30.2 18.5
Canada 51.9 .. 5.8 .. 9.5 ..
Chile 11.7 12.8 6.5 -3.1 .. ..
Colombia -2.7 17.1 2.5 5.0 .. ..
Costa Rica .. .. 47.1 17.0 8.4 6.5
Czech Republic .. -15.6 .. -0.5 .. 1.0
Denmark 0.5 0.3 -7.6 -4.8 .. ..
El Salvador 0.2 -2.8 2.4 -11.8 8.4 4.6
Finland -3.9 -16.0 3.0 6.1 .. ..
Germany 6.2 4.5 1.9 2.4 .. ..
Guatemala .. .. 6.9 3.3 11.6 9.1
Hungary 10.8 -3.5 12.8 26.3 4.2 15.4
Indonesia .. 12.1 .. 7.6 .. ..
Israel 105.1 1.1 6.8 -68.9 0.1 6.6
Italy 7.2 5.0 33.2 3.3 0.0 -0.8
Japan -0.2 -1.6 10.2 13.5 .. ..
Korea 8.2 2.7 8.4 11.4 .. ..
Luxembourg 11.2 6.2 10.0 0.1 .. ..
Malaysia 0.0 3.2 6.1 10.0 2.0 5.0
Mexico 4.2 8.5 5.3 17.3 3.7 29.2
New Zealand -2.3 -1.1 9.3 7.6 .. ..
Nicaragua .. .. .. .. 18.3 17.2
Norway (1) 16.1 10.9 -1.7 64.0 .. ..
Peru 18.6 18.6 21.2 17.4 -10.9 25.2
Poland -4.1 -1.6 0.7 1.0 .. ..
Portugal -4.3 3.0 12.4 -14.7 13.3 2.9
Russia -9.8 .. -14.3 .. 1.1 ..
Singapore 1.8 5.6 3.3 15.9 16.6 11.6
Slovenia -1.8 9.1 7.9 4.0 -0.2 4.3
South Africa 6.8 1.1 9.2 -1.1 .. ..
Sri Lanka 51.7 .. -10.1 .. -1.5 ..
Switzerland -1.8 -2.0 0.2 11.4 .. ..
Turkey 12.3 17.4 -10.8 25.8 .. ..
United States 3.5 3.9 -3.4 3.5 .. ..
Uruguay 1.4 .. 19.9 .. 17.2 ..
Life Non-Life Composite


www.oecd.org/finance/insurance