Embed Size (px)
Citation preview

19 November 2019 Global
Sales and Trading personnel at Macquarie are not independent and, therefore, the information herein may be subject to certain conflicts of interest, and may have been shared with other parties prior to publication. Note: To the extent Macquarie Research is referenced, it is identified as such and the associated disclaimers are included in the published research report. Please refer to the important disclosures www.macquarie.com/salesandtradingdisclaimer.
FX AND RATES
Fed's Broad Dollar Index
Source: Bloomberg, Fed, Macquarie Strategy
Strategists
Macquarie Bank Limited Singapore Branch
Gareth Berry +65 6601 0348 [email protected]
Macquarie Futures USA LLC
Thierry Wizman +1 212 231 2082 [email protected]
Macquarie Bank Limited Hong Kong Branch
Trang Thuy Le +852 3922 2113 [email protected]
Macquarie Capital (Europe) Limited
Eimear Daly +44 20 3037 4802 [email protected]
This publication has been prepared by Sales and Trading personnel at Macquarie
and is not a product of the Macquarie Research Department.
Global FX Outlook: Peak USD Topping out
For the US dollar, this is as good as it gets. This is the high-water mark. A “phase
one” US-China trade deal looks possible, which could end the 5-year old US
dollar rally.
The precise timing of any negotiating breakthrough is unknown. But even the
absence of further escalation could encourage a gentle uptick in global growth
and a decline in safe-haven demand.
That should prevent further USD upside and even spark a very gradual decline.
Escalating US political risk much later in 2020 could add to the selling
pressure, especially in USDJPY which could dip to 102 by end-2020.
USDCNY is likely to fall to 6.80 by mid-2020, promoting generalised USD
weakness across Asia-Pacific; KRW and TWD are best placed to benefit.
Any AUDUSD upswing should stop at 0.71 though. The RBA’s easing bias
remains in place and each additional cut from here brings QE potentially closer.
The novelty of unconventional policy, even just the distant threat of it, should help
cap any gains.
The outlook for GBP hinges on the UK general election, scheduled for
December 12th. A stable overall majority for Boris Johnson would trigger a decent
move higher in GBPUSD, towards 1.35 by end-2020. It would also contribute
to a weaker dollar, irrespective of US-China developments.
A recovery in Eurozone PMIs should help EURUSD mount a tentative rebound
towards 1.15 by end-2020, driven by a thaw in trade tensions at home and
abroad. But the threat of US Section 232 auto tariffs is likely to linger.
The potential exists for a more powerful euro upswing, but we’d be surprised
if it happens. Large scale eurozone fiscal stimulus or a hawkish ECB reset both
seem unlikely.
An epic rebalancing out of US stocks and into Eurozone equities is just about
conceivable, given real money positioning is lop-sided. But a spontaneous
recovery in European growth seems very unlikely, so the trigger for such a move
would have to originate inside the US and selectively cripple the US growth
outlook. Outside of extreme US political developments, it’s hard to imagine what
might provide the necessary spark.
The Canadian dollar should be an exception in the developed-market space,
bucking the weaker USD trend. USDCAD could climb to 1.35 by end-Q1 as
poorer data catches policymakers out, and the BoC is finally forced into a long-
awaited easing cycle.
We are constructive on RUB. But ZAR is likely to be left behind in any EM rally,
potentially falling to 15.55 against the USD by end-2020. The Asian high-yielders
(IDR and INR) could also struggle as global bond yields push higher and the Fed
refrains from further cuts. The outlook for BRL, MXN and CLP looks equally
challenging.
90
95
100
105
110
115
120
125
130
135
Jan-95 Jan-03 Jan-11 Jan-19
index

Global FX Outlook: Peak USD
19 November 2019 2
Contents
Forecast Summary ................................................................................ Error! Bookmark not defined. USD: Peak US dollar has arrived .......................................................................................................... 7 CNY: On recovery track ........................................................................................................................ 9 EUR: Basing at last ............................................................................................................................. 12 AUD, NZD: The allure of unconventional measures .......................................................................... 14 GBP: A relief rally ................................................................................................................................ 17 JPY: Rally on hold ............................................................................................................................... 19 CAD: Rates Cuts Will Undermine the Loonie’s Strength ..................................................................... 20 EM FX Asia: A change of fortune ....................................................................................................... 22 EMEA: The risk-reward weighing scales ............................................................................................. 26 Latin America: Will Politics Drive Performance in 2020? ................................................................... 31 Detailed FX Forecasts Table ............................................................................................................... 44

Global FX Outlook: Peak USD
19 November 2019 3
Forecast Summary
Fig 1 Major currency FX forecasts summary
Spot Forecasts*
Currency vs. Latest 19Q4 20Q1 Near-term view
US dollar EUR 1.106 1.090 1.110 Mildly bearish for 2020. A mini-global growth upswing should benefit other more-open economies proportionately more than the US. It should also undermine the dollar’s safe haven appeal. Escalating US political risk could add to the USD selling pressure later in 2020, but we would not want to overstate the case. While the policies of some presidential candidates might not be market-friendly President Trump’s counter-manifesto could keep USD bulls engaged.
by market convention JPY 108.8 109.0 109.0
GBP 1.293 1.300 1.300
AUD 0.682 0.690 0.700
CNY 7.01 6.95 6.85
Euro USD 1.106 1.090 1.110 Getting mildly bullish. EURUSD is well placed to benefit from a gentle global growth upswing, plus an amical Brexit resolution. But FX technical resistance might not be overcome, at the earliest, until the UK’s general election is out of the way on Dec 12th. Escalating US political risk should add to upside pressure later in 2020.
Foreign currency units per euro JPY 120.3 118.8 121.0
GBP 0.856 0.838 0.854
AUD 1.622 1.580 1.586
CNY 7.75 7.58 7.60
Japanese yen USD 108.8 109.0 109.0 Neutral for now. The global economic backdrop looks set to brighten after the recent scare. The Fed seems in no rush to cut again either, which suggests this could be just a mid-cycle adjustment rather than the early stages of a deeper easing campaign. Neither development is good for the yen. But a delayed yen rally still looks likely, as US political risks intensify into the US Presidential Election.
Yen per unit of foreign currency EUR 120.3 118.8 121.0
GBP 140.6 141.7 141.7
AUD 74.2 75.2 76.3
CNY 15.5 15.7 15.9
UK sterling USD 1.293 1.300 1.300 Bullish. ‘Hard Brexit’ risk should recede materially if PM Johnson returns as PM with an overall majority after the upcoming general election. Opinion polls are pointing convincingly in that direction. His new Brexit withdrawal deal could then be ratified, offering a route out of the quicksand. The issue of how to handle the end of the transition period in Dec 2020 would remain unresolved, but at least the tail-risk of a hard no-deal exit would have mostly vanished, ensuring GBP holds on to recent gains and creeps even higher. that depends on Brexit Party and DUP support. There would be very limited room for manoeuvre in that case, raising the risk of a hard no-deal Brexit whenever the clock runs out again, probably sometime in Q1 2020. A thumping overall majority though, however unlikely, would create scope for compromise, in which case.
Foreign currency units per pound EUR 1.169 1.193 1.171
JPY 140.6 141.7 141.7
AUD 1.896 1.884 1.857
CNY 9.06 9.04 8.91
Australian dollar USD 0.682 0.690 0.700 Mildly bullish for now in anticipation of a partial US-China trade deal being struck. This would deliver a shot in the arm for global growth and boost CNY too (dragging AUD along for the ride). But any additional RBA rate cut from here brings closer the day when unconventional measures might be needed. Although we see no imminent risk of this, the market is likely to price in QE well in advance, which — for AUD — should more than neutralise the benefit from any trade resolution.
Foreign currency units per dollar EUR 0.616 0.633 0.631
JPY 74.2 75.2 76.3
GBP 0.527 0.531 0.538
CNY 4.78 4.80 4.80
Chinese renminbi USD 7.01 6.95 6.85 Bullish: Our base case is for a Phase 1 deal to be signed before December 15 to enable 4Q tariff cancelation. A currency agreement in trade deal combined with a step up in China stimulus we forecast by 1Q 2020 and a gentle global growth rebound will support RMB strength in 1H 2020. The PBoC is likely to encourage CNY appreciation post deal via lower USDCNY fixes. A rollback of the September tariffs would be an upside versus our base case, while a delay in Phase-1 deal beyond December represents a downside risk.
RMB per unit of foreign currency EUR 7.75 7.58 7.60
JPY 0.064 0.064 0.063
GBP 9.06 9.04 8.91
AUD 4.78 4.80 4.80
Source: Bloomberg, Macquarie Strategy. *End-of-quarter forecasts.
Global FX Outlook: Peak USD
19 November 2019 4
Fig 2 Other currency FX forecasts summary*
Spot Forecasts**
Currency vs. Latest 19Q4 20Q1 Near-term view
Canadian dollar USD 1.322 1.34 1.35 Bearish. The BoC’s unwillingness to follow the Fed into dovishness has kept the CAD strong vs. the USD. But we see this policy strategy shifting as poorer data catches up with policymakers. We foresee the beginning of an easing cycle in Q1 2020, underpinning the CAD’s softness.
New Zealand dollar† USD 0.640 0.64 0.65 Neutral, but likely to underperform AUD. RBNZ Gov Orr is already talking about the theoretical possibility of unconventional measures, and even appears to have settled on negative rates as his preferred tool. Looks like the RBNZ may reach the unconventional threshold before the RBA does.
Indonesian rupiah USD 14072 14150 14050 Neutral: Global environment has turned less favourable for IDR with a rise in global bond yields, and a Fed pause, while domestically inflation is trending higher. Similar to RBI, the scope for BI to cut rates further should be limited, although fiscal concern is less severe in Indo case versus India.
Indian rupee USD 71.8 71.5 71.2 Underperformance near term. Weak growth and fiscal slippage remain key concerns amongst investors. While RBI may still cut in December, a Fed pause and an uptick in food inflation could limit its ability to ease further, denting sentiment. A focus on improving transmission of rate cuts to market rates could improve INR outlook in 2H 2020. FDI inflows could surprise to the upside thanks to the recent corporate tax cut and FDI incentives.
Taiwan dollar USD 30.5 30.3 29.8 Bullish. TWD will benefit from a rebound in tech cycle driven by smartphone and data-center growth, although to a lesser degree than Korea given its product mix. Lifers have increased TWD hedges in the past months, but we believe hedging ratios still remain below levels in 2017/18. This implies need for lifers to chase TWD on strength if and when US-China trade deal is finalized.
Korean won USD 1163 1160 1130 Outperformance: KRW outperformance is
supported by its high “beta” proxy to global growth, a return of equity inflows (which have lagged others in the region YTD), and a bottoming in the memory price cycle and tech demand. The BoK may still cut once in in 1Q 2020, but FX correlation with equity has tended to overwhelm rate spreads. Legislative elections in April 2020 a risk to watch for the won.
Malaysian ringgit USD 4.15 4.18 4.20 Underperformance. MYR should normally benefit from a rebound in global growth, while the recent surge in palm prices also implied better terms of trade support. However, we suspect the pending FTSE Russell decision on Malaysia’s bonds exclusion from its flagship WGBI index will still weigh on sentiment, limiting foreign inflows and capping MYR performance relative to its peers in 1H 2020.
Singaporean dollar USD 1.361 1.360 1.350 Neutral. USDSGD path should be largely a function of the broad USD weakness we expect over the coming months. Good news are otherwise already in price when it comes to the NEER as it trades close to the top-end of its policy range. We

Global FX Outlook: Peak USD
19 November 2019 5
view SGD as a funder for relative value trades in Asia near term.
Philippines peso USD 50.62 50.8 50.0 Neutral. PHP is likely to drop from the top 3 in the EM Asia FX ranking table this year to the middle of the pack in 2020. PHP strength in 2019 was a result of a recovery from an inflation and growth shock in 2018, supportive real rates, and lower current account deficit due to delayed Budget spending. These tailwinds could turn into headwinds in 2020, with the current account deficit likely re-widening while inflation should tick up from a low base.
Argentinian peso USD 59.7 63.0 69.0
Neutral. FX controls have made price discovery in the USD/ARS impossible, but the FX controls are likely to endure for many several quarters, and at least until the new gov’t can conclude its negotiations with bondholders and re-establish access to int’l capital markets. How the new gov’t will treat bondholders will reflect on the coherence of its domestic policies in regard to the needed fiscal adjustment and a resumption of ‘normality’.
Brazilian real USD 4.19 4.25 4.30 Bearish Short-term, More Constructive in 2020. Pressure from the weaker ARS and the BCB’s weak-BRL policy bias will take USD/BRL higher before it stabilizes around 4.25, before reform initiatives help support sentiment and the BRL stabilizes by early 2020.
Chilean peso USD 777 790 810 Relatively Bearish. The prospect that a new constitution will be drafted over the next 9- to 12 months ensures that uncertainty about Chile will remain high throughout 2020. After the BCCh’s measure help stabilize the CLP in the short term, expect depreciation to resume during 2020.
Colombian peso USD 3426 3400 3400 Relatively Bullish. Relative to the region, Colombia has been a growth ‘champ’, although we doubt that strong growth will persist in absolute terms into H2 2019, especially as residential investment slows. Policy rates throughout most of 2020 will still be attractive, and the COP’s diversification properties and its detachment from China will draw organic inflows. The risk comes from labor unrest in the medium term.
Mexican peso USD 19.2 19.5 20.0 Structurally Bearish. Despite Mexico being in an industrial “slow-growth” trap, we have yet to see an earnest change of policy direction from the AMO administration, leading us to think that the risk is rising that various policy targets go unmet. Banxico remains the last bastion of conservatism, but even it will be gradually cutting the policy rate in 2020.
Turkish lira USD 5.72 5.7 5.5 Bullish. A restored positive growth differential and a global reach for yield into 2020 underpin our cautiously constructive view on the TRY. Domestic dollarization also appears to have reached a peak, removing one key driver of TRY weakness. Positioning is also cleaner.
South African rand USD 14.8 14.7 15.8 Relatively Bearish. The combination of low growth, structural barriers to economic reform, high and inexorable rising debt, immediate credit

Global FX Outlook: Peak USD
19 November 2019 6
Fig 3 USD strength prevailing against most FX counterparts into year-end
Source: Bloomberg, Macquarie Strategy.
rating risk and a relatively hawkish central banks means ZAR will be left out of the EM rally in 2020.
Russian ruble USD 63.8 63.0 60.0
Bullish. We are constructive on the RUB due to
our expectation of a stronger EUR into 2020,
fiscal loosening extending the RUB’s relative
growth differential, further CBR rate cuts driving
foreign inflows into OFZ’s and still high real yield
relative to other EMs.
Source: Bloomberg, Macquarie Strategy. *Currencies are quoted as domestic currency per US dollar unless otherwise specified († denotes inverse quotation). **End-of-quarter forecasts.

Global FX Outlook: Peak USD
19 November 2019 7
USD: Peak US dollar has arrived
The dollar’s demise has been frequently foretold ever since its rally began 5 years ago. Perhaps
the soft USD during the BRICs era has left its mark on the psyche. Same goes for the long years
of Fed QE. Both episodes have planted the idea that the dollar’s natural state is one of
weakness.
We have no wish to fall into this trap. But even we must acknowledge that the balance of risks
for 2020 is skewed towards a mildly softer outcome. For the dollar, the situation right now is as
good as it gets. This is the high-water mark.
From here a gentle pickup in global growth seems likely, conditional on a meaningful de-escalation
of US-China trade tensions. That should undermine one veneer of dollar strength: its safe
haven appeal.
It should have other consequences too. US growth would participate in that upswing, but other
more-open economies would benefit proportionately more, especially the Eurozone where the
growth effect would be amplified by relief over the avoidance of a hard Brexit. A EURUSD
upswing could soon be underway.
A trade-truce-inspired CNY surge would also spread USD weakness across the currencies of
Asia-Pacific. Meanwhile, the result of the UK general election has every chance of jolting
GBPUSD into a higher range. Combined, the price action would reinforce the sense that the USD
had turned.
Timing the turnaround will be tricky as much hinges on how long it takes to seal a partial US-
China trade compromise. Suffice it to say that the US political calendar means we are talking
weeks or months, not years.
Fig 4 Equity market performance (USD terms) Fig 5 Foreigners are active in US stocks
Source: Bloomberg, Macquarie Strategy Source: Fed, Macquarie Strategy
The political backdrop
Escalating US political risk could add to the USD selling pressure later in 2020, but we would
not want to overstate the case. While the policies of some presidential candidates might not be
market-friendly (see page 19 here), President Trump’s counter-manifesto could keep USD bulls
engaged. So any adverse impact is likely to be delayed until much closer to the Nov 3rd
Presidential election, or perhaps until after the votes are counted.
Several presidential candidates favour a weaker USD, but this is easier said than done. Ask
President Trump. FX intervention is not as simple as it sounds – if it were, Trump would probably
have done it already.
Admittedly Japan’s government succeeded in weakening the yen, but only after enlisting the help
of the Bank of Japan. We see zero chance that the Federal Reserve, under its current mandate,
would use monetary policy to engineer a weaker USD.
The Fed’s policy framework is currently being reviewed and “make up” strategies to compensate
for past inflation misses are under consideration. But for this to hurt the dollar, the Fed would
25
50
75
100
125
150
175
200
225
Jan-07 Jan-10 Jan-13 Jan-16 Jan-19
ind
ex (
ba
se
= 1
00
)
USEurope excluding UKUKJapan
0
5
10
15
20
Jan-88 Jan-98 Jan-08 Jan-18
as a
sh
are
of to
tal m
kt ca
p (
%)
Foreigner ownership of US stocks
Gareth Berry +65 6601 0348 [email protected] Thierry Wizman +1 212 231 2082 [email protected]
Trang Thuy Le +852 3922 2113 [email protected]
Eimear Daly +44 20 3037 4802 [email protected]
Global FX Outlook: Peak USD
19 November 2019 8
need to pledge to drive the inflation rate above target, beginning soon or even immediately.
A passive tolerance of above-target inflation (if it presents itself) would be no game-changer for the
USD.
The market would also need to have confidence that the Fed could meet this tougher
challenge. Inflation is low now, but not for want of trying. Would trying harder make much
difference?
Political developments could knock the dollar off its perch if a new administration harms
the growth outlook. More specifically, US stocks would be vulnerable if higher corporate taxes
were suddenly imposed, and in theory some dollar weakness could ensue if investors reacted by
trimming their overweight US positions and redeploying into Europe.
Trouble is, we do not recall a sustained period when the USD fell in tandem with US stocks.
Weakness in US equities would likely spread globally, and the USD could actually benefit from
safe-haven demand.
Still, higher foreign participation these days and lop-sided real-money positioning means the
downside risks for the dollar from this are not negligible.
Guard against excessive pessimism
Still, we would not want to over-emphasise the downside risks to the US dollar in 2020. We see a
gradual decline, but no collapse.
This is the same US dollar that weathered the end of the Fed’s tightening cycle, three rate cuts,
and a resumption of Fed balance sheet expansion. The dollar’s resilience is proven.
Global growth will remain fragile, challenged, and uninspiring. Within this, the US should continue
to outperform its developed market peers, even though the gap could narrow. The dollar’s yield
advantage will remain in place too reflecting strong underlying economic fundamentals.
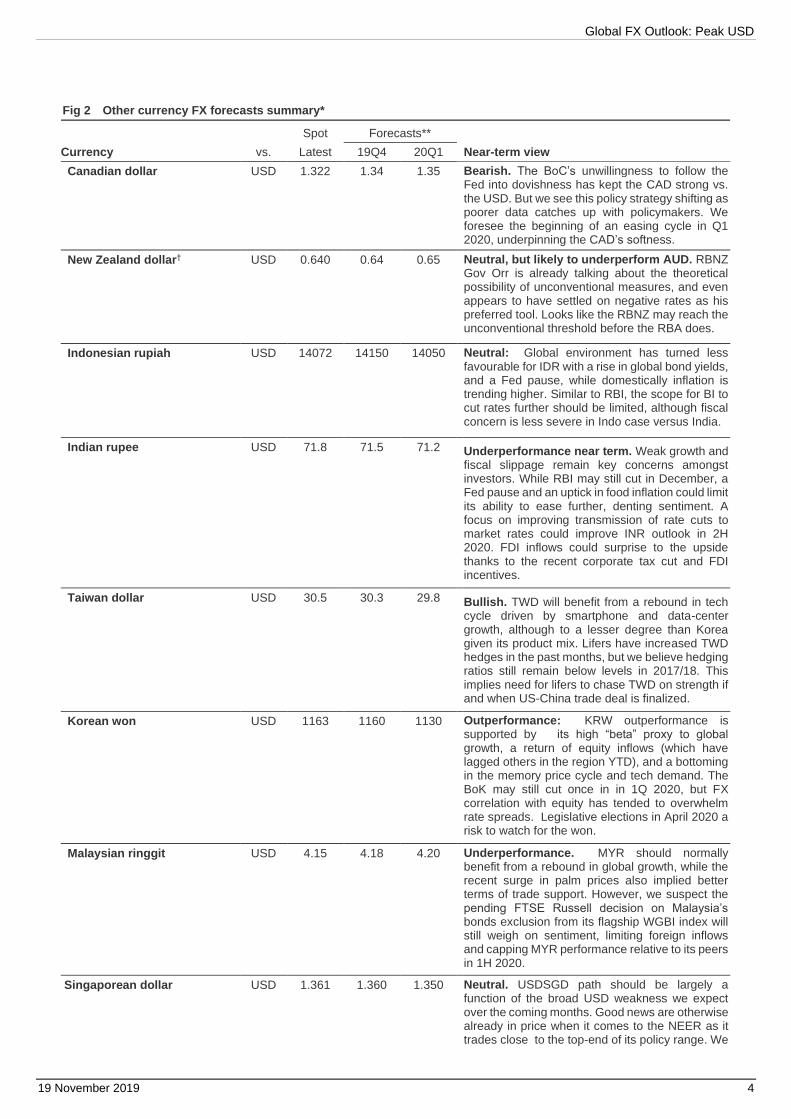
Foreign central banks also have mostly maintained their USD reserve holdings. Russia has been
the exception in this respect, but it is a special case. Crucially, there is no sign that China aims to
follow suit.
Fig 6 Only Russia has reduced USD exposure Fig 7 No dumping of China’s USTs
Source: CBR, Macquarie Strategy Source: Bloomberg, Macquarie Strategy
0%
20%
40%
60%
80%
100%
Se
p-1
6
Dec-1
6
Ma
r-17
Jun
-17
Se
p-1
7
Dec-1
7
Ma
r-18
Jun
-18
Se
p-1
8
Composition of Russia's int. reservesCNY
gold
AUD
CAD
GBP
EUR
USD
0
200
400
600
800
1000
1200
1400
Jan-08 Jan-11 Jan-14 Jan-17
$ (
bn
)
China's UST holdings

Global FX Outlook: Peak USD
19 November 2019 9
CNY: On recovery track
We cut USDCNY forecast to 6.95 by year end and 6.80 by 1H 2020, bringing forward the RMB
gains we had expected through 2020 to the next 6 months.
Despite the uncertainty near term on timing of Phase 1 deal, we think incentives for US and China
to strike an agreement to support their economies are high. A trade truce combined with a rebound
in global growth and a step up in China stimulus we forecast in the next one to two quarters
suggests to us that RMB gains will likely be front-loaded in 1H 2020.
• Our base case is for Phase-1 deal to be signed before December 15 to enable the
cancelation of the December 15 tariffs. If it comes with additional tariff rollback, it would be an
upside versus our forecast. Importantly, we think this trade truce will be more durable than the
previous two (Dec 2018 and Jun 2019), with the US Elections acting as a circuit breaker to
prevent talks breakdown and tariff re-escalation in 2020.
• PBoC’s endorsement of RMB strength could lead the market to price for an implicit
agreement for FX gains in trade deal. We don’t expect a deal to include RMB pledge at a
specific target or range. However, the PBoC will likely encourage RMB strength post deal via
lower USDCNY fixes. The UST may follow through to remove China’s currency manipulator
designation. This should be enough to encourage the market to believe in an implicit agreement
for RMB strength may have been struck.
• China’s policy stimulus should gear up. While timing remains difficult to call, indication may
come from the December Work Conference, where policy makers set their growth and key
economic targets for 2020. We think achieving growth around 6% in 2020 will require a step up
in stimulus.
• A gradual moderation in the USD at a broad level should help add to USDCNY downside.
We expect a gentle global growth rebound, with receding Brexit and US-China trade war risks
also working to lessen the USD’s safe-haven appeal.
Fig 8 Trade war is likely to enter a de-escalation phase after nearly 2 years of escalating
Fig 9 Trade truce combined with a step up in China stimulus should boost RMB prospect in 2020
Source: Bloomberg, Macquarie Strategy Source: Bloomberg, CEIC, Macquarie Strategy
But the path for RMB to get back to below 7 is unlikely to be linear. While not our base case,
the risk of Phase-1 deal being delayed beyond December is high (~30%). The cancelation of the
Chile summit has removed the deadline pressure to have a deal ready by November 16-17 for
signing.
The market can still weather a few months delay as long as trade talks continue, and the
December 15 tariffs are put on hold. However, the uncertainty leading to the December 15
deadline could drive a pullback in risk sentiment and the RMB. Ultimately, we view such rallies in
USDCNY/CNH as opportunities to add to short to position for a better 1H 2020.
6.20
6.40
6.60
6.80
7.00
7.20
7.40
7.60
Jan 18 Apr 18 Jul 18 Oct 18 Jan 19 Apr 19 Jul 19 Oct 19
RMB and US trade tariffs
USDCNH
25% onf irst $34bn
25% on
$50bn
25% on$50bn, 10%
on addtional $200bn
25% on$250bn
25% on$250bn,
15% on additional $110bn
Trump's tarif f threat
Tarrifeffective
dates
6.00
6.20
6.40
6.60
6.80
7.00
7.20
4.0
5.0
6.0
7.0
8.0
9.0
10.0
13 14 15 16 17 18 19
%y oy RMB and macro indicators
USDCNY (RHS,inverted)
China IP grow th, %yoy
Trang Thuy Le +852 3922 2113 [email protected]
Global FX Outlook: Peak USD
19 November 2019 10
A currency agreement forms the basis for yuan stability, and quite likely strength
in 1H 2020
We envisage a Phase 1 deal will include a currency chapter – similar to the USMCA agreement –
with the following strengthened commitments:
• Maintain RMB stable around an equilibrium level
• Foster a market-determined exchange rate regime; refrain from competitive devaluation,
including through intervention in the foreign exchange market;
• Possibly commitment to further liberalize the capital account
• Disclose data on FX intervention on a regular basis, likely within 90 days. Conform to other IMF
requirement on FX reserves and forward disclosure, participation in IMF COFER report (which
China already largely implemented).
• Agree to an enforcement and monitoring mechanism which include regular office-level and
ministerial-level meetings, between the PBoC and US Treasury to monitor FX policy.
What a currency agreement between the US and China is unlikely to include is an explicit pledge
for RMB at a specific target or range, and/or commitment to pursue intervention policies to
achieve such targets (a Plaza Accord like arrangement).
We explained in our Asia FX Strategy: CNY currency clause - from USMCA to Plaza Accord why
such an agreement is not feasible, and its success highly questionable in today’s world.
One key issue is publishing outright FX target/range would lead to speculation and more costly
intervention. Even the Plaza or Lourve Accords did not release FX targets to the public.
Another issue is from the PBoC’s perspective, agreeing to commit to certain RMB target would
essentially mean giving up its FX and potentially monetary policy autonomy – a hard sell to its
domestic audience.
Intervention also has less chance of success absence greater coordination in underlying economic
policy by both US and China.
International criticism, including from the IMF for any such currency arrangement would be high.
But the lack of a specific FX pledge in US-China agreement will not prevent the market to believe
in an “implicit” agreement for RMB appreciation in trade deal. The PBoC is likely to reinforce
such thinking by encouraging faster yuan appreciation post deal, via lower USDCNY fixes.
The US could also signal its approval by removing China’s currency manipulation designation.
In short, any rally in RMB post trade deal will be reinforced by policy, implying scope for it
to extend.
Progress beyond Phase 1 easier said than done – renewed trade uncertainty could
bring back volatility in 2H 2020
As much as we are positive on a Phase 1 US-China trade deal, we find it much harder to see
breakthrough beyond Phase 1. China is unlikely to budge on more structural issues, including its
industrial policy and state subsidy practice. A honeymoon period in 1H for US-China could be
replaced by renewed tensions again in 2H.
Lacking progress in Phase 2 could lead to tariff threat by Trump again - although market may read
them as less credible during the elections.
A scenario where in the final US election race, Trump competes with Elizabeth Warren, who is also
known for being a China hawk and for her restrictive policy on trade, could also lead the market to
pare back optimism on RMB.

Global FX Outlook: Peak USD
19 November 2019 11
Fig 10 CNH vol curves have shifted lower – own protection at the back-end of the curve makes sense early in 2020
Fig 11 China FX vols should be structurally higher as FX regime increasing shift to a more flexible float
At the money implied vols
Source: Bloomberg, Macquarie Strategy Source: Bloomberg, Macquarie Strategy
CNH vol curve has shifted downward in recent months. Long-end vols are at the lower end of their
4-year range, but skews are still well bid for calls. We think owning protection at the back-end of
the vol curve makes sense in early 2020, especially if RMB gains we expect early in the year
further drive down skews and vols from current levels.
China’s effort to open-up its financial market to foreign portfolio investors will make the RMB more
susceptible to hot money flow. This combined with the government’s desire to allow RMB to be
more market determined should lead to a repricing of RMB vols structurally higher - approaching
those of more flexible FX regime, such as KRW.
The evolution of China FX regime is on-going. China vols were well below the basket-managed
SGD vols pre 2015 when CNY FX regime was seen as a managed USD peg. Vols rose structurally
from August 2015 to par with SGD vols after China made an explicit link of the CNY fix to the
CFETS basket.
Since the trade war broke down, China vols have traded above SGD vols. This may reflect a
market premium for trade war, but also a policy realization that a flexible FX regime is best suited
for China in an environment of high external stress.
4.6
4.8
5.0
5.2
5.4
5.6
5.8
1m 2m 3m 6m 9m 1y 2y
% CNH vol curve, %
1m before
Latest
2y median
-1.0
1.0
3.0
5.0
7.0
9.0
11.0
13.0
15.0
14 15 16 17 18 19
% CNY 1y implied vol against FX regime, %
USDCNH1y impl vol
USDSGD1y impl vol
USDKRW1y impl vol
Flexible float regime
Managedbasket regime
Managed USD peg regime

Global FX Outlook: Peak USD
19 November 2019 12
EUR: Basing at last
We keep our rising EURUSD forecast profile, partly in anticipation of some mild USD weakness
later in 2020 courtesy of the US political cycle.
The Eurozone is well positioned to benefit from the mini-global growth upswing too, as the lagged
effect of previous tariff imposition fades, and the prospect of a partial US-China trade deal boosts
sentiment. Even the absence of further escalation represents progress of sorts.
Owing to an open economy, the burden of escalating US-China tensions so far has fallen
disproportionately on the Eurozone, despite the region not being a party to the dispute. The same
logic should also hold in reverse as relations eventually thaw. A headwind could become a
tailwind.
Fig 12 Manufacturing mood needs a boost Fig 13 Sensitivity to the external environment
Source: Bloomberg, Macquarie Strategy Source: World Bank, Macquarie Strategy
So although Eurozone PMIs are subdued now, they could turn soon, helped too by the
avoidance of a hard Brexit. A negotiated EU withdrawal deal means Europe’s hard-pressed
manufacturing sector should continue to enjoy unfettered access to a key export market, and
their complex supply chains will be safeguarded for now at least.
All of this should help EURUSD mount a tentative rebound, although an upswing may be delayed
until the results of the UK general election on December 12th are announced. Until then, the
FX technicals look too challenging.
Also, the FX carry earned by EURUSD shorts is superior to the yield on a 30y UST; in a low yield
world, that’s an important consideration.
The speculative positioning picture does not argue for a sudden euro surge either. There is a
legacy euro net short out there but it’s not substantial. So a cascade of short-covering on any
positive shock could only go so far before the propellant runs out.
From a real-money flow perspective the latest indications suggest a base may be forming in
EURUSD, but nothing more than that for now. Fixed income outflows from the Eurozone have
essentially stopped, but equity inflows from abroad are still nowhere to be seen. The latter is the
missing ingredient, and its absence keeps our euro upside expectations in check.
The market remains overweight US equities though. So anything that triggers an equity
rebalancing out of the US and back into the Eurozone would force us to raise our EURUSD
forecasts. Such a shock would have to originate inside the US though, and selectively cripple the
US growth outlook. Outside of extreme US political developments, it’s hard to imagine what might
realistically provide the spark.
44
46
48
50
52
54
56
58
60
62
Apr-15 Apr-16 Apr-17 Apr-18 Apr-19
ind
ex
Eurozone PMIs
comp
manf
0
10
20
30
40
50
1960 1970 1980 1990 2000 2010
exp
ort
s a
s a
sh
are
of G
DP
(%
)
Exports as a share of GDP
US
China
Eurozone
Gareth Berry +65 6601 0348 [email protected]
Eimear Daly +44 20 3037 4802 [email protected]
更多精品报告,登录东西智库网站(dx2025.com)下载

Global FX Outlook: Peak USD
19 November 2019 13
Fig 14 FX technicals still capping any gains Fig 15 Net positioning in EURUSD FX futures
Source: Bloomberg, Macquarie Strategy Source: Bloomberg, IMM, Macquarie Strategy
There is much talk of two possible wild-card outcomes that could theoretically trigger a sharp
euro upswing, but we’re not convinced:
(1) Eurozone fiscal stimulus would admittedly attract new equity inflows, boost PMIs, and
drive bond yields higher. But even if it happens, it would be small in scale, and not a
game-changer in our view. It is ironic that the countries keenest to launch stimulus (like
Italy) are those with the least scope to do so. Meanwhile, Germany is likely to remain
ideologically opposed to large-scale active stimulus outside of a deep recession scenario.
(2) We don’t hold out much hope for a hawkish policy reset at the ECB either, despite
Lagarde’s arrival as ECB President. Her promised policy review is likely to conclude that
existing accommodative settings should be maintained. Even if the wisdom of negative
interest rates is reconsidered, the same econometric models used to justify their
introduction will probably be consulted again. We see no reason why the models
should recommend a different course of action this time. The conclusion is likely to be
that negative rates are a necessary evil, and must remain in place until inflationary
pressures reappear.
1.00
1.05
1.10
1.15
1.20
1.25
Jan-16 Jan-17 Jan-18 Jan-19
EU
RU
SD
EURUSD
daily close
50dma
100dma
200dma
-250
-200
-150
-100
-50
0
50
100
150
Jan-08 Jan-11 Jan-14 Jan-17
10
00
's o
f co
ntr
acts
EUR speculative positioning
Net long
Net short
Global FX Outlook: Peak USD
19 November 2019 14
AUD, NZD: The allure of unconventional measures
We keep an upward bias in our AUD FX forecasts, reflecting the likelihood of a tentative upswing
in global growth over the coming year. Our view still hinges on an eventual de-escalation in US-
China trade tensions, which would boost CNY and drag AUD and NZD along for the ride.
So a mild recovery in AUDUSD to 71c still seems likely over the next 6 months. But we lower
our longer-term forecasts, to capture the risk of unconventional measures eventually being
deployed by the RBA.
To be clear, we doubt this will happen imminently. Australia’s domestic economy appears to have
reached a “gentle turning point”, as RBA Gov Lowe puts it. We tend to agree, even if our growth
forecasts are less optimistic (see page 71 here). The danger has passed for Australia’s
residential property market too.
But if our expectations of another rate cut in February are realised, conventional firepower will
soon be all but depleted. The next logical step could involve a foray into the unconventional
arena, and the market is likely to start positioning for that well in advance.
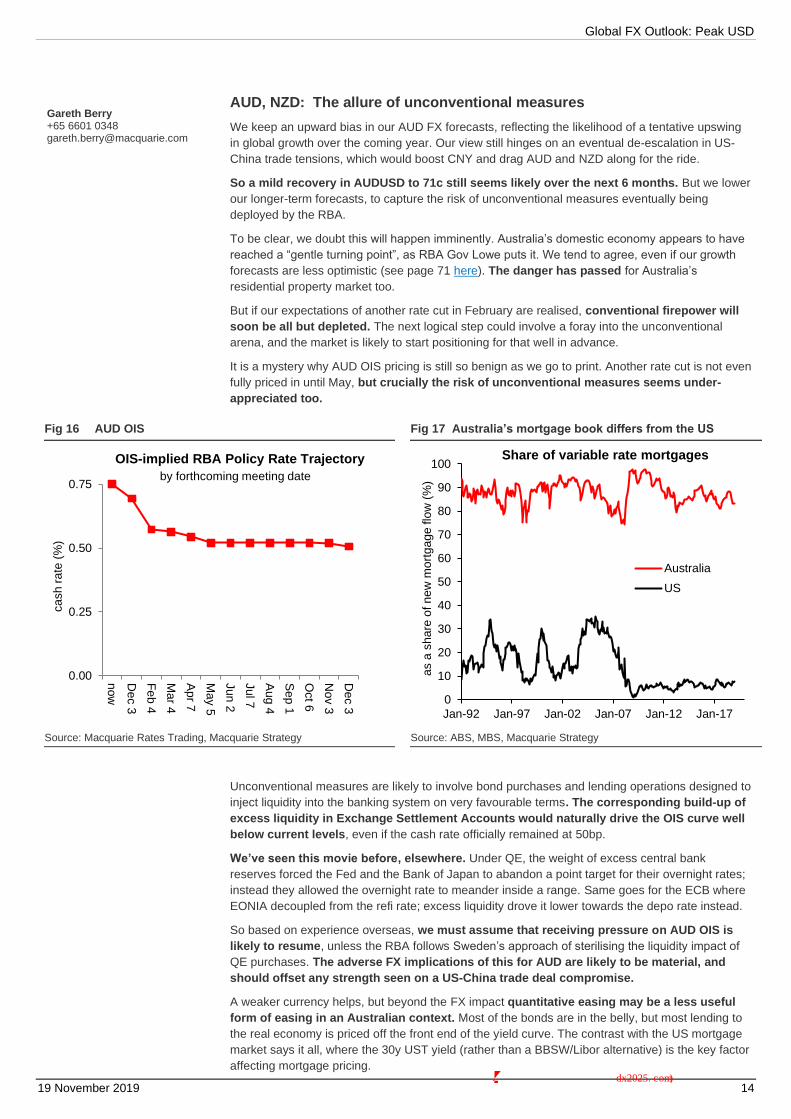
It is a mystery why AUD OIS pricing is still so benign as we go to print. Another rate cut is not even
fully priced in until May, but crucially the risk of unconventional measures seems under-
appreciated too.
Fig 16 AUD OIS Fig 17 Australia’s mortgage book differs from the US
Source: Macquarie Rates Trading, Macquarie Strategy Source: ABS, MBS, Macquarie Strategy
Unconventional measures are likely to involve bond purchases and lending operations designed to
inject liquidity into the banking system on very favourable terms. The corresponding build-up of
excess liquidity in Exchange Settlement Accounts would naturally drive the OIS curve well
below current levels, even if the cash rate officially remained at 50bp.
We’ve seen this movie before, elsewhere. Under QE, the weight of excess central bank
reserves forced the Fed and the Bank of Japan to abandon a point target for their overnight rates;
instead they allowed the overnight rate to meander inside a range. Same goes for the ECB where
EONIA decoupled from the refi rate; excess liquidity drove it lower towards the depo rate instead.
So based on experience overseas, we must assume that receiving pressure on AUD OIS is
likely to resume, unless the RBA follows Sweden’s approach of sterilising the liquidity impact of
QE purchases. The adverse FX implications of this for AUD are likely to be material, and
should offset any strength seen on a US-China trade deal compromise.
A weaker currency helps, but beyond the FX impact quantitative easing may be a less useful
form of easing in an Australian context. Most of the bonds are in the belly, but most lending to
the real economy is priced off the front end of the yield curve. The contrast with the US mortgage
market says it all, where the 30y UST yield (rather than a BBSW/Libor alternative) is the key factor
affecting mortgage pricing.
0.00
0.25
0.50
0.75
now
De
c 3
Fe
b 4
Ma
r 4
Ap
r 7
Ma
y 5
Jun
2
Jul 7
Au
g 4
Se
p 1
Oct 6
No
v 3
De
c 3
ca
sh
ra
te (
%)
OIS-implied RBA Policy Rate Trajectory
by forthcoming meeting date
0
10
20
30
40
50
60
70
80
90
100
Jan-92 Jan-97 Jan-02 Jan-07 Jan-12 Jan-17
as a
sh
are
of n
ew
mo
rtg
ag
e flo
w (
%)
Share of variable rate mortgages
Australia
US
Gareth Berry +65 6601 0348 [email protected]
更多精品报告,登录东西智库网站(dx2025.com)下载
Global FX Outlook: Peak USD
19 November 2019 15
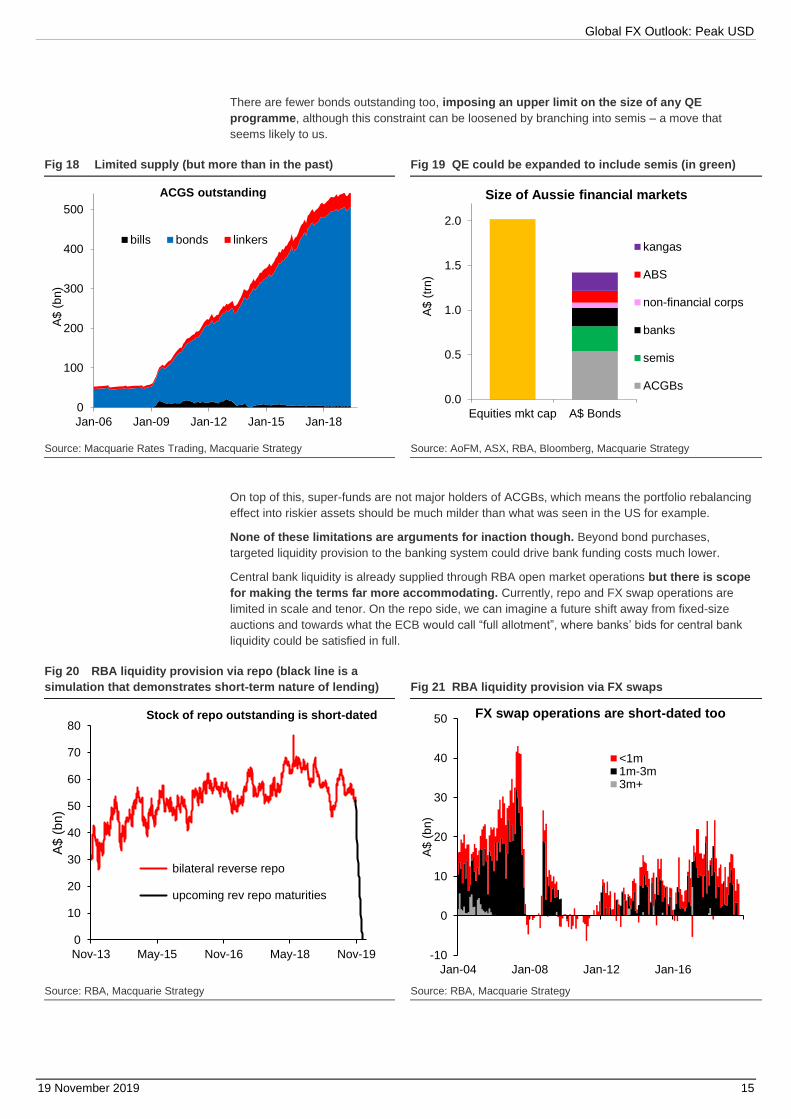
There are fewer bonds outstanding too, imposing an upper limit on the size of any QE
programme, although this constraint can be loosened by branching into semis – a move that
seems likely to us.
Fig 18 Limited supply (but more than in the past) Fig 19 QE could be expanded to include semis (in green)
Source: Macquarie Rates Trading, Macquarie Strategy Source: AoFM, ASX, RBA, Bloomberg, Macquarie Strategy
On top of this, super-funds are not major holders of ACGBs, which means the portfolio rebalancing
effect into riskier assets should be much milder than what was seen in the US for example.
None of these limitations are arguments for inaction though. Beyond bond purchases,
targeted liquidity provision to the banking system could drive bank funding costs much lower.
Central bank liquidity is already supplied through RBA open market operations but there is scope
for making the terms far more accommodating. Currently, repo and FX swap operations are
limited in scale and tenor. On the repo side, we can imagine a future shift away from fixed-size
auctions and towards what the ECB would call “full allotment”, where banks’ bids for central bank
liquidity could be satisfied in full.
Fig 20 RBA liquidity provision via repo (black line is a
simulation that demonstrates short-term nature of lending)
Fig 21 RBA liquidity provision via FX swaps
Source: RBA, Macquarie Strategy Source: RBA, Macquarie Strategy
0
100
200
300
400
500
Jan-06 Jan-09 Jan-12 Jan-15 Jan-18
A$
(b
n)
ACGS outstanding
bills bonds linkers
0.0
0.5
1.0
1.5
2.0
Equities mkt cap A$ BondsA
$ (
trn
)
Size of Aussie financial markets
kangas
ABS
non-financial corps
banks
semis
ACGBs
0
10
20
30
40
50
60
70
80
Nov-13 May-15 Nov-16 May-18 Nov-19
A$ (
bn)
Stock of repo outstanding is short-dated
bilateral reverse repo
upcoming rev repo maturities
-10
0
10
20
30
40
50
Jan-04 Jan-08 Jan-12 Jan-16
A$
(b
n)
FX swap operations are short-dated too
<1m1m-3m3m+
Global FX Outlook: Peak USD
19 November 2019 16
Tenors could be stretched too. Currently roughly 3m money is the maximum available; by
contrast, the ECB, the Bank of Japan, and the Bank of England have all supplied cash to the
banking system for up to 4 years.
Pricing could also be made extra-attractive, especially if banks could demonstrate that the
benefits were being passed on to the real economy.
If these measures are adopted and pushed to the limit, Australia’s mortgage interest rates
could fall another 100bp from current levels. Good for growth, but probably bad for the
currency.
For NZ, the policy trajectory is not dissimilar. Unconventional measures seem likely too eventually,
but an AUDNZD breakout could occur in either direction depending on which central bank
gets there first.
There are two novelties as far as NZ policy is concerned, which could make the adverse FX effect
on NZD more severe. First, Gov. Orr may have already selected negative interest rates his
preferred tool if his televised interview at Jackson Hole is any guide. By contrast the RBA has
described negative rates as “extraordinarily unlikely“, and would lean towards other measures
instead.
Second, foreigners are major holders of NZGBs too, but foreign central banks are less prevalent
than in the case of ACGBs. That means a QE programme in NZ is more likely to see
participation from foreign bond holders, leaving NZD especially exposed as foreigners decide
where to reinvest the proceeds.
更多精品报告,登录东西智库网站(dx2025.com)下载

Global FX Outlook: Peak USD
19 November 2019 17
GBP: A relief rally
We keep our upward-sloping forecast profile for sterling throughout 2020, but we no longer
project a sharp dip around next month’s December 12th general election.
Previously, our fear had been that PM Johnson would fight the election on a hard no-deal Brexit
platform, or at least that his manifesto would keep that option alive. The political incentive for
doing so was clear: it would reduce the risk of losing seats to the Brexit Party, which favours a
clean break with the EU when the UK exits.
If Johnson had failed to broadcast his Brexiteer credentials in this way, enough Brexit Party and
DUP MPs might hold the balance of power afterwards. And the possibility of a negotiated
settlement with Brussels would decline sharply. That was our fear.
But two things have changed. First, after months of fruitless negotiations, a new Brexit
withdrawal agreement has appeared out of the blue; Johnson wasn’t so keen on a hard Brexit after
all, it seems, despite all the rhetoric to the contrary.
Second, the Brexit Party has failed to capitalise on Johnson’s decision to cut a deal. The
deal offers less than a ‘pure’ Brexit, and yet opinion polls indicate that support for the Brexit Party
is dwindling not increasing. In the eyes of voters sympathetic to the Brexit cause, it seems that
Johnson’s deal will do, despite its imperfections.
So the risk of a hard no-deal Brexit has materially receded. Whether sterling can build on
recent gains will depend hugely on the outcome of the forthcoming general election on December
12th. But early signs are encouraging.
Sterling would prefer a stable overall majority for PM Johnson’s Conservative Party. This is also
our base case. Opinion polls show Conservative support is hovering around the magic 40%
which, under the first-past-the-post electoral system, is usually enough to deliver an overall
majority, although does not guarantee it.
Such an outcome would be seen as a public endorsement of the new deal. There would be
no more obstruction by an uncooperative parliament afterwards either. Following parliamentary
ratification, the UK would leave the EU in a legal and political sense on (or even before) Jan 31st,
when the new Article 50 deadline expires.
But unlike the three previous cliff-edges, there would be no risk of an economic shock this
time. Under the terms of the deal, bilateral trade with the EU would remain frictionless at least until
the ‘transition period’ ends on Dec 31st, 2020.
There is in fact no transition; it is a misnomer coined out of political necessity; a ‘standstill
arrangement’ would be a better description. Economically-speaking, everything stays the same
immediately after exit.
Fig 22 Support for the four main parties in opinion polls Fig 23 GBP FX vol is off the highs
Source: Bloomberg, Macquarie Strategy Source: Wikipedia, Macquarie Strategy
0%
5%
10%
15%
20%
25%
30%
35%
40%
45%
Jun-19 Jul-19 Aug-19 Oct-19
Opinion Polls
Cons LabourLib Dems Brexit Party 6
7
8
9
10
11
12
13
14
May-18 Sep-18 Jan-19 May-19 Sep-19
atm
vo
l (%
)
GBPUSD atm 6m FX vol
First 2 cliff-edges pass without incident
Johnson'snew deal is done
Gareth Berry +65 6601 0348 [email protected]
Eimear Daly +44 20 3037 4802 [email protected]

Global FX Outlook: Peak USD
19 November 2019 18
So if we’re right, the UK could finally move on out of the Brexit quicksand. But more cliff
edges would lie ahead, the first appearing only 11 months later when standstill arrangements
expire.
There is almost zero chance that a full free-trade agreement will be in place before then, so this
deadline will likely be extended too, but probably not without another nervous countdown.
That’s one reason why we see a meaningful, but not explosive, sterling upswing ahead.
The second reason is that corporate investment is likely to remain subdued until the precise terms
of the future trading arrangements have been nailed down. This explains in part why Bank of
England forecasts were downgraded last week, and why the market sees a material risk of a rate
cut over the coming months.
Under the withdrawal deal, Northern Ireland will remain to all intents and purposes inside the EU.
But the island of Great Britain (GB) can let its trade rules diverge from the EU, up to a point. The
degree matters greatly. If GB tries to undercut EU’s regulatory standards, there would be a price
to pay in the form of increased trade frictions with the EU. Border checks would become more
intrusive. The tariff wall would rise.
So for corporate UK, the uncertainty will go on – probably for years. But at least the risk of an
acrimonious hard no-deal Brexit would have almost vanished, and that’s reason enough to
imagine some moderate further sterling upside from here.
Suffice it to say, there are no certainties in democratic elections, especially one as emotive as this
one. It has been so dominated by a single issue that traditional party allegiances cannot be taken
for granted. Even in normal times, opinion polls are not very reliable.
So another hung parliament is a very material risk (40%), though not our base case. We examine
the FX consequences if the hung scenario on page 17-18 here.
更多精品报告,登录东西智库网站(dx2025.com)下载

Global FX Outlook: Peak USD
19 November 2019 19
JPY: Rally on hold
We raise our near-term USDJPY forecasts, to reflect the likelihood of a partial US-China trade deal
over the coming months. Escalating trade tensions had previously driven USDJPY sub-105,
but the selling pressure has now subsided amid signs of progress in negotiations.
Stable US policy settings should relieve some downside pressure on USDJPY too. After three rate
cuts, the Fed has made it clear that further easing is not a foregone conclusion. We expect the US
policy rate to remain unchanged for all of 2020 and 2021 (see page 53 here).
The prospect of a cyclical global mini-upswing should also help support USDJPY, and new highs
by US equities are providing constructive mood music.
Meanwhile bond outflows from Japan-based investors show little sign of stopping, and
equity outflows are now reaccelerating having cooled earlier. These flows should keep
USDJPY supported around current levels, and any dips on temporary setbacks in US-China
negotiations could be seen as buying opportunities.
Fig 24 Japan bond outflows continue unabated
Fig 24 Appetite for foreign equities increasing again too
Source: Bloomberg, Macquarie Strategy Source: Bloomberg, Macquarie Strategy
But a delayed yen rally still looks likely, as US political risks intensify into the Nov 2020
Presidential election. Any resulting USD weakness would be most keenly felt in USDJPY – just
as it was into the previous 2016 election, although the Bank of Japan’s foray into negative rates
territory earlier that year would have amplified that move.
Once the yen rally gets underway, Tokyo should be mostly powerless to stop it. US President
Trump’s has taken a personal interest in the economic policy of trading partners, which means
there is a very high hurdle for Japanese authorities to weaken the yen via FX intervention.
Monetary policy options are very limited too. The Bank of Japan already owns almost half of
the JGB market, and is already the biggest shareholder in a number of single-name equities.
Another rate cut could be counter-productive if used, ultimately boosting the yen instead of
weakening it.
0
10
20
30
40
50
60
70
80
Jan-11 Jan-13 Jan-15 Jan-17 Jan-19
JP
Y (
trn
)
Net Buying of Foreign BondsBy Japanese investors, cumulative
bond outflows abroad
past 12m
initial launchof QQE
negative rates introduced
-20
-10
0
10
20
30
40
Jan-11 Jan-13 Jan-15 Jan-17 Jan-19
JP
Y (
trn
)
Net Buying of Foreign Equities By Japanese investors, cumulative
equities outflows abroad
past 12m
initial launch of QQE
negative rates introduced
Gareth Berry +65 6601 0348 [email protected]

Global FX Outlook: Peak USD
19 November 2019 20
CAD: Rates Cuts Will Undermine the Loonie’s Strength
As we noted back in September’s Global FX Outlook, we haven’t been surprised by the BoC’s
decisions to maintain its neutral tone over during the summer months and well into October.
After all, the data was not deteriorating yet, and Canada was likely going to need to get though
its federal election before the BoC would be comfortable “stepping out” of its comfort zone.
However, we’ve believed that the global rate-cutting cycle would eventually visit the BoC in Ottawa,
even though it might come after it brought glad tidings to all the other major central banks – the Fed,
ECB, RBA, RBNZ, etc. We now believe that the BoC will ease its overnight lending rate (OLR) in
January (our baseline), although we wouldn’t dismiss a cut in the policy rate coming in December,
either. What are the Governing Council’s motivations for an OLR cut (from the current OLR of
1.75%)? In our view, it is not so much that the BoC would be compelled by an upcoming
event, but rather that the bar for a cut is already set low in view of a soft outlook for 2020,
allowing even a drift downward in the data to provide cover for a cut.
Indeed, we believe we’ve seen the BoC already prepare the market for a cut. In its October
Statement, the concluding paragraph removed two key lines that had been construed as hawkish,
i.e., that i) “the economy is operating close to potential and inflation is on target”, and that ii) “the
current degree of monetary stimulus remains appropriate”. Governor Poloz even suggested in his
October press conference that an “insurance rate cut” was discussed by the Governing Council, but
that two factors led to the decision to hold, i) inflation being at the midpoint of the target range, and
ii) strength in housing data suggesting a potential rise in financial vulnerabilities. And consistent with
the more dovish tone, the BoC further downgraded its 2020 real GDP forecast (Q4 on Q4 basis) to
1.6% from 2.0% previously. This downgrade was motivated mainly by a smaller contribution from
business investment and exports, areas that the BoC has proven to be overly optimistic about in the
past.
And yet despite this downgrade, the BoC remains still too optimistic in the view of economist
David Doyle. The BoC’s 2020 growth forecast remains both above the consensus (1.5%) and
David’s own projection for 2020 growth (1.2%). Notwithstanding that, the BoC’s forecast over the
coming 18 months suggests growth that will be below potential growth – even after the BoC cut its
own estimate of potential growth to 1.7% (from 1.9% previously), suggesting a widening output gap.
In our view, this all means that there is very a low bar for cut. That is, if data comes in tad
weaker than the BoC anticipates, or we see any development that would push its growth
forecast toward our own or toward the consensus, the Governing Council will cut in
response. Alternatively, the same response could come out of inflation coming in below projections
in coming months. Core inflation, David believes, has been driven by idiosyncratic categories that
should moderate ahead. Indeed, the BoC seems to know this, insofar as it dropped from its
September policy Statement the line that said “inflation is expected to return sustainably to 2% by
mid-2020”. A reassessment of the convergence theme could be used to justify easier policy. And
finally, we will note that Canada’s yield curve remains (partly) inverted, which has itself provided a
rationale for a cut, in previous cycles. Either way, there’s enough here to suggest that a rate cut
happens by December, or likelier by January.
What about beyond the next few weeks? Well, for one thing, Canada is not escaping the global
manufacturing slowdown, as the structural decline in auto production continues to intensify. Mexico’s
ongoing decline in auto production(see our section on Mexico’s MXN, below) portends a slowdown
in Canada’s too, and passage of the USMCA in the US Congress will not turn things around, but
only cement the status quo, at best. Indeed, the prospect that manufacturing may slow further
underscores our view that the strength seen in Q2’s real GDP growth (3.7% annualized) is
temporary, as the BoC itself had acknowledged.
Nor will Canada escape a slowdown in its housing market, which is among the principal
reasons for growth in 2020 to disappoint. The typical behavior of the Canadian consumer has
been to use the benefit of a lower mortgage rates over several decade to renovate their existing
home, or “move-up” into a more expensive dwelling. This has helped propel home prices higher
relative to incomes and contributed to residential investment’s rise as a share of GDP. But following
the BoC’s rate hikes in 2017-18, the three-decade tailwind behind growth in housing will shift
to headwinds, as mortgage resets begin to take a bite out of household budgets in 2020 and
2021 - unless interest rates revert back to new lows. (The typical fixed-rate period for a Canadian
Thierry Wizman +1 212 231 2082 [email protected]
更多精品报告,登录东西智库网站(dx2025.com)下载

Global FX Outlook: Peak USD
19 November 2019 21
mortgage is five years, and the current five-year Canada yield suggests rates should reset higher in
2020 by roughly 70 bps.)
It is this structure of Canada’s mortgage market that will put the BoC in a difficult position in 2020,
especially if a further rise in US bond yields drags the Canada five-year yield higher, leading to
meaningful increases in mortgage rates upon resets. So although housing data in Canada has
improved in recent months, with yields backing up again there will be ever smaller support
for the economy from the demand for housing and the ancillary wealth-effects that might
bring.
To offset this, David believes that the BoC will be inclined to remain dovish in its rhetoric in
2020 and cut rates by a total of 50 bps in total in 2020, starting in January. Along the way, this
dovishness will be supported by the BoC lowering its own estimate of the “neutral” rate (from 2.25%,
currently) although this may not happen until April’s. Our own view is that the neutral rate is much
lower than the BoC’s estimate, a consequence of elevated housing and corporate debt, an over-
reliance on residential investment, and lower potential output growth in Canada. A policy rate of
1.5%, in our view, is close to ‘neutral.
.
Fig 26 Canada’s forward yield curve will invert further
Fig 27 …and the US vs CA yield spread will widen
Source: Bloomberg LP Source: Bloomberg LP
And what does this all mean for the CAD? Well, up until now, the CAD has been supported nicely
by a Canadian policy rate that has risen relative to the US policy rate, as the US policy rate was
reduced by three times this year, starting in July. But we anticipate that this will switch in 2020, as
Canadian rates decline relative to the US and reverse 2/3rds of the spread compression on the past
six months. (US rates, we expect, will stay unchanged throughout 2020). In conjunction with this, we
expect that the spread between US vs. Canadian government yields – in the tenors that correspond
to the policy horizon - will expand again (see Figure, above). That will also reverse a trend set in
motion in March 2020 as traders began to anticipate the US’s rate easing in March 2019. Canada’s
forward policy-rate curve will invert further, perhaps even as the US’s flattens (see Figure above).
As this happens, the CAD’s footings will be kicked from under it – even as the USD weakens
vs. some non-CAD currencies - and we expect that USD/CAD will begin a slow but long-
anticipated move higher, toward 1.36 and ultimately 1.40 in the longer term. We’ll remind
readers again that among the most important determinants of the USD/CAD pair since the
great financial crisis has been the spread between US and Canada yields in the belly of the
curves.

Global FX Outlook: Peak USD
19 November 2019 22
EM FX Asia: A change of fortune
Our top-down view for receding US-China trade war and Brexit risks, combined with a gentle pick
up in global growth in 1H 2020 suggests for a favourable backdrop for EM FX.
Within Asia, we expect North Asia currency bloc (CNY, KRW and TWD) to outperform in
2020, reversing their misfortunes in 2018 and 2019.
Conditions for CNY, KRW and TWD outperformance are supported by 1/ a more credible de-
escalation phase in US and China trade war in 2020, 2/ A rebound in global growth and step-up in
China stimulus, and 3/ Stabilization in tech demand and core export products.
The turning point is probably already in. The total return gap between an equally weighted
basket of North Asia currencies - CNY, KRW and TWD versus a carry basket – as proxied by INR
and IDR bottomed in early October.
Importantly, we show below that this return gap is highly correlated with the direction of US
10 yield. This makes intuitive sense to us, as a sharp drop in US yields since late 2018 reflected
broader concerns on global growth and escalation in US-China trade war – both detrimental for the
more export-geared North Asian economies. In contrast, the subsequent global chase for yields
benefited INR and IDR disproportionately by boosting inflows into their local currency markets.
Fig 28 USD backdrop should turn more favourable for EM Asia more broadly into 2020
Fig 29 We expect KRW, CNY and TWD to outperform in 2020 following 2 years of underperformance
Source: Bloomberg, Macquarie Strategy Source: Bloomberg, Macquarie Strategy
Fig 30 The gap between North Asia vs. Carry Asia have bottomed in October
Fig 31 A rebound in US 10y a good leading indicator for North Asia outperformance
Total returns index, equally weighted baskets Total returns index, equally weighted baskets
Source: Bloomberg, Macquarie Strategy Source: Bloomberg, Macquarie Strategy
75
80
85
90
95
100
105
110
115
120
08 09 10 11 12 13 14 15 16 17 18 19
Asia FX and DXY, index to Jan 2018
DXY index
USDAsia, equally w eighted basket
-5.0% 0.0% 5.0% 10.0%
THB
IDR
PHP
INR
MYR
SGD
TWD
CNH
KRW
Total returns against USD, %
2018
YTD
89
91
93
95
97
99
101
103
Jan 18 Apr 18 Jul 18 Oct 18 Jan 19 Apr 19 Jul 19 Oct 19
Performance gap between North Asia vs. high yielders complex
High yielding basket (INR, IDR)
North Asia basket (KRW,
CNY, TWD)
1.0
1.5
2.0
2.5
3.0
3.5
4.0
0.88
0.93
0.98
1.03
1.08
1.13
1.18
1.23
12 13 14 15 16 17 18 19
%Performance gap between North Asia vs. high
yielders complex
US 10y yield, % (RHS)
North Asia vs. High Yielders
total return gap
Trang Thuy Le +852 3922 2113 [email protected]
更多精品报告,登录东西智库网站(dx2025.com)下载

Global FX Outlook: Peak USD
19 November 2019 23
KRW, in particular, should benefit from its high “beta” proxy to global growth, a return of equity
inflows (which have lagged others in the region YTD), and a bottoming in the memory price cycle –
a key factor we previously said would turn us more constructive on the won. There are also green
shoots when it comes to Korea’s shipping industry.
Our equity analyst Daniel Kim sees a recovery in DRAM/NAND prices in 2020 with inventory from
key players normalizing, while demand picks up from an acceleration in data-center traffic and 5G-
enabled smartphones. Memory accounts for more than 10% of Korea’s exports, and its price
slump was the key behind Korea’s nominal export and won underperformance in recent years.
That being said, any pick-up in the economy will be gradual, and Korea’s growth in 1H 2020 may
still fall well short of BoK 2.6% forecast and its estimate of growth potential (2.7%-2.8%). This
leaves open the possibility of another rate cut in 1Q 2020 to 1%, an all-time low. However, we are
not too concerned on the effect of an extra rate cut on the won. KRW correlation to equity has
traditionally overwhelmed its correlation to relative interest rate spreads.
Korea’s legislative election (15 April 2020) could be seen as a public referendum for Moon’s
political agenda ahead of the 2022 Presidential Election. A weak economy has been the key
complaint for his administration. Moon currently does not hold a parliament majority, and failure to
make progress could lead to more uncertainty in economic policy in the 2nd half of his 5-year term.
A major shake-up of BoK MPC will also take place in April. 4 out of 7 MPC board members are
expected to depart, including the two most dovish voices – Cho Dongchul and Shin Inseok, but
also the most hawkish member Lee Il Houng. A rate cut, if any, is likely to take place ahead of this
reshuffle.
Fig 325 Terms of trade shock dissipating for Korea
Fig 33 Bottoming of memory price cycle implies better outlook for exports and the won ahead
Macquarie equity team estimate.
Source: Bloomberg, CEIC, Macquarie Strategy Source: CEIC, Macquarie Strategy
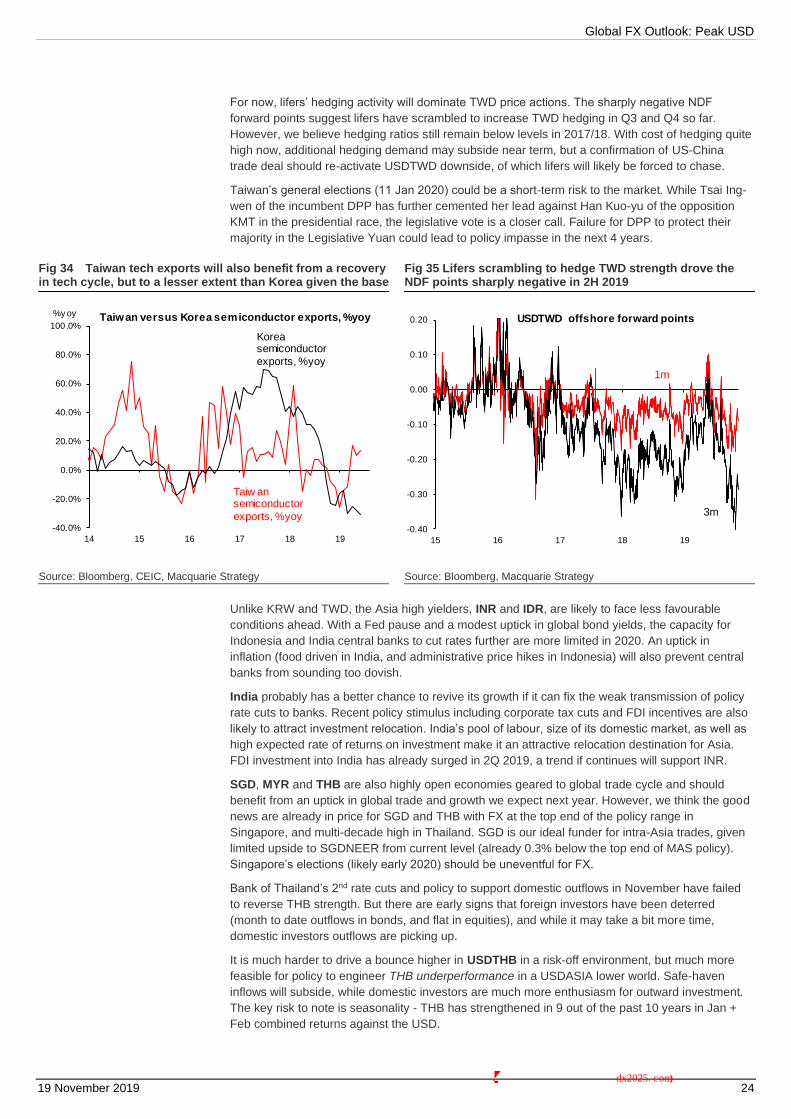
TWD will benefit from a rebound in tech cycle driven by smartphone and data-center growth, but
the extent of its tech export rebound should be more modest than Korea. Better product mix
means Taiwan’s tech exports was not hit as badly in 2019 as Korea’s, implying a higher base.
TWD’s resilience in 2019 has also come from a big investment relocation shift – as companies re-
shored and government introduced tax and investment incentives to attract repatriation. But the
momentum here also appears to be slowing into 2H 2019.
TWD’s advantage comes from its huge current account surplus (>10% of GDP) – and an insurance
sector running close to its regulatory cap on foreign assets, implying receding domestic capacity to
recycle the current account balance.
Bond ETF has proven to be a new channel for lifers to bypass regulatory limit, but this is also
facing regulatory scrutiny. Bond ETFs are locally traded and denominated in TWD, although they
are made up primarily of US bonds and US credit. Exhaustion of bond ETF channel will lead to
structural TWD strength, although we will be patient for this theme to play out later in 2020 or
even 2021.
90.0
95.0
100.0
105.0
110.0
115.0
120.0
80.0
85.0
90.0
95.0
100.0
105.0
110.0
10 11 12 13 14 15 16 17 18 19
IndexIndexKRW and terms of trade
KRW effective exchange rate (RHS)
Terms of trade index
-30%
-20%
-10%
0%
10%
20%
30%
Mar 16 Dec 16 Sep 17 Jun 18 Mar 19 Dec 19 Sep 20
US$/1Gb Memory average selling price, %qoq
Forecast
NAND
DRAM
Global FX Outlook: Peak USD
19 November 2019 24
For now, lifers’ hedging activity will dominate TWD price actions. The sharply negative NDF
forward points suggest lifers have scrambled to increase TWD hedging in Q3 and Q4 so far.
However, we believe hedging ratios still remain below levels in 2017/18. With cost of hedging quite
high now, additional hedging demand may subside near term, but a confirmation of US-China
trade deal should re-activate USDTWD downside, of which lifers will likely be forced to chase.
Taiwan’s general elections (11 Jan 2020) could be a short-term risk to the market. While Tsai Ing-
wen of the incumbent DPP has further cemented her lead against Han Kuo-yu of the opposition
KMT in the presidential race, the legislative vote is a closer call. Failure for DPP to protect their
majority in the Legislative Yuan could lead to policy impasse in the next 4 years.
Fig 34 Taiwan tech exports will also benefit from a recovery in tech cycle, but to a lesser extent than Korea given the base
Fig 35 Lifers scrambling to hedge TWD strength drove the NDF points sharply negative in 2H 2019
Source: Bloomberg, CEIC, Macquarie Strategy Source: Bloomberg, Macquarie Strategy
Unlike KRW and TWD, the Asia high yielders, INR and IDR, are likely to face less favourable
conditions ahead. With a Fed pause and a modest uptick in global bond yields, the capacity for
Indonesia and India central banks to cut rates further are more limited in 2020. An uptick in
inflation (food driven in India, and administrative price hikes in Indonesia) will also prevent central
banks from sounding too dovish.
India probably has a better chance to revive its growth if it can fix the weak transmission of policy
rate cuts to banks. Recent policy stimulus including corporate tax cuts and FDI incentives are also
likely to attract investment relocation. India’s pool of labour, size of its domestic market, as well as
high expected rate of returns on investment make it an attractive relocation destination for Asia.
FDI investment into India has already surged in 2Q 2019, a trend if continues will support INR.
SGD, MYR and THB are also highly open economies geared to global trade cycle and should
benefit from an uptick in global trade and growth we expect next year. However, we think the good
news are already in price for SGD and THB with FX at the top end of the policy range in
Singapore, and multi-decade high in Thailand. SGD is our ideal funder for intra-Asia trades, given
limited upside to SGDNEER from current level (already 0.3% below the top end of MAS policy).
Singapore’s elections (likely early 2020) should be uneventful for FX.
Bank of Thailand’s 2nd rate cuts and policy to support domestic outflows in November have failed
to reverse THB strength. But there are early signs that foreign investors have been deterred
(month to date outflows in bonds, and flat in equities), and while it may take a bit more time,
domestic investors outflows are picking up.
It is much harder to drive a bounce higher in USDTHB in a risk-off environment, but much more
feasible for policy to engineer THB underperformance in a USDASIA lower world. Safe-haven
inflows will subside, while domestic investors are much more enthusiasm for outward investment.
The key risk to note is seasonality - THB has strengthened in 9 out of the past 10 years in Jan +
Feb combined returns against the USD.
-40.0%
-20.0%
0.0%
20.0%
40.0%
60.0%
80.0%
100.0%
14 15 16 17 18 19
%y oy Taiwan versus Korea semiconductor exports, %yoy
Korea semiconductor
exports, %yoy
Taiw an semiconductor
exports, %yoy-0.40
-0.30
-0.20
-0.10
0.00
0.10
0.20
15 16 17 18 19
USDTWD offshore forward points
1m
3m
更多精品报告,登录东西智库网站(dx2025.com)下载

Global FX Outlook: Peak USD
19 November 2019 25
Fig 36 India should focus on policy transmission of rate cuts to banks in 2020
Fig 37 Ex-China pick-up in FDIs are concentrated in Singapore, India and Indonesia
Source: Macrobond, Macquarie Strategy Source: CEIC, Macquarie Strategy
Relative to SGD and THB, MYR has a better chance to benefit from a rebound in global growth
with its REER largely in line with fundamentals. Palm prices have surged 24% in 3Q, implying
better terms of trade support. However, we suspect the pending FTSE Russell decision on
Malaysia’s bonds exclusion from its flagship WGBI index will still weigh on sentiment, limiting
foreign inflows and capping MYR performance relative to others in 1H 2020.
PHP is likely to drop from the top 3 in the EM Asia FX ranking table this year to the middle of the
pack in 2020. PHP strength in 2019 was a result of a recovery from an inflation and growth shock
in 2018, supportive real rates, and lower current account deficit due to delayed Budget spending.
These tailwinds could turn into headwinds in 2020, with the current account deficit likely re-
widening to above 2% of GDP, while inflation should tick up from a low base in 2019. BSP liquidity
easing could also stimulate capital outflows.
Fig 38 MYR seems more fairly valued, but FTSE pending decision could limit foreign interests into bonds
Fig 39 THB REER at multi-decade high calls for greater policy resistance
Fair value based on crude prices and rolling trend
Source: Bloomberg, CEIC, Macquarie Strategy Source: Bloomberg, Macquarie Strategy
8.0
8.5
9.0
9.5
10.0
10.5
11.0
11.5
12.0
12.5
13.0
5.0
5.5
6.0
6.5
7.0
7.5
8.0
8.5
9.0
9.5
10.0
12 13 14 15 16 17 18 19
%%India Interest Rates
WALR for fresh rupee loans (RHS)**
Repo rate(LHS)
WALR for outstanding rupee loans (RHS)**
*Weighted-average domestic term deposit rate**Weighted-average lending rate
WADTDR for outstanding rupee term deposit (LHS)*
-15 -10 -5 0 5 10
MYR
PHP
TWD
KRW
VND
THB
IDR
INR
SGD
CNY
$bn
Difference in gross FDI versus trend, $bn
(*) Linear trendfrom 2010 to 2017
4q moving average
2Q 2019
78
83
88
93
98
103
108
113
08 09 10 11 12 13 14 15 16 17 18 19
IndexMYR REER valuation
Trend line
MYR REER
+/-2 stdev
70
75
80
85
90
95
100
105
110
115
120
95 98 01 04 07 10 13 16 19
THB REER

Global FX Outlook: Peak USD
19 November 2019 26
EMEA: The risk-reward weighing scales
RUB: Ready, steady, rally
We are constructive on the RUB due to our expectation of a stronger EUR into 2020, fiscal
loosening extending the RUB’s relatively growth differential, further Central Bank of Russia rate
cuts driving foreign inflows into OFZ’s and still high real yield relative to other EMs. We forecast
USDRUB at 54 and 55 by end 2020 and 2021, respectively.
1.) We expect the EUR to appreciate modestly against the USD. Macquarie projects the
euro to appreciate to 1.15 versus USD by end-2020 and to 1.17 by end-2021.
2.) A 2020 growth recovery is to be driven by a pick-up government investment and, to
a lesser extent, a rebound in private consumption as real household incomes are
supported by falling inflation. The delayed implementation of the government’s national
projects initiative, the January 2019 VAT hike and improvements in tax collection led to a
federal budget cash surplus of 3.8% in the first nine months of 2019. This implies that the
fiscal outcome for 2019 will turn out to be substantially higher than the government
planned for, and thus a fiscal boost to the economy is in the pipeline for 2020.
The Russian government has stated that it intends to invest a portion of the National
Welfare Fund (NWF) into infrastructure projects once its liquid part exceeds 7% of GDP.
The Finance Ministry envisages around RUB1trn invested over 2020-2022. We project
the liquid part of the NWF will exceed 7% of GDP by H2 2020, suggesting an additional
upside to growth and the RUB from mid-2019.
3.) The CBR accelerating its easing cycle should loosen credit conditions and drive
non-resident inflows into OFZs. The RUB827bn of OFZ inflow in the first nine months
of 2019 was the main driver of RUB appreciation this year. We see the CBR cutting rates
to 6% by end-2019 and a further 50bps in H2 2020. Our expectations exceed the 67bps
of rate cuts priced into the Russian rates market over the next year. Additional US
Federal Reserve easing would also create room for further foreign inflow into OFZs.
We believe a shift has occurred at the CBR. Future monetary policy is likely to be shaped
by more emphasis on the output gap, on the symmetry of the inflation target and on a
downward revision to its estimate of the neutral rate and less weight on FX developments.
A strong RUB, food price declines and base effects from the VAT hike should drag
headline CPI below 3% in Q1 2020. We forecast headline inflation to only rise back to the
4% target by mid-2021.
4.) RUB to remain supported by one of the highest real rates in the EM space. The real
yield available on Russia’s 10 year government bonds stands at 2.68%, compared to a
negative -2.37% for Turkey and negative -1.2% of the Czech Republic. Our top down
view of a global growth recovery in Q1 2020 underpinned by China fiscal stimulus should
support a global reach for real return for countries backed by strong fundamentals.
Fig 40 Foreign inflow key driver of RUB past appreciation Fig 41 RUB offers of the highest real rates
Source: Bloomberg, CBR, Macquarie FX Strategy, Nov-19 Source: Bloomberg, Macquarie FX Strategy, Nov-19
15
20
25
30
35
40
0
500
1000
1500
2000
2500
3000
No
v 1
4
Feb
15
May 1
5
Aug
15
No
v 1
5
Feb
16
May 1
6
Aug
16
No
v 1
6
Feb
17
May 1
7
Aug
17
No
v 1
7
Feb
18
May 1
8
Aug
18
No
v 1
8
Feb
19
May 1
9
Aug
19
Russia Internal Govt Debt (OFZ) Holdings by Non-Residents
RUB bn % Market Share
90
95
100
105
110
115
120
Feb 19Mar 19 Apr 19 May19
Jun 19 Jul 19 Aug 19Sep 19Oct 19Nov 19
EM local currency Govt Total Returns Index, Unhedged
Russia Global EM
Eimear Daly +44 20 3037 4802 [email protected]
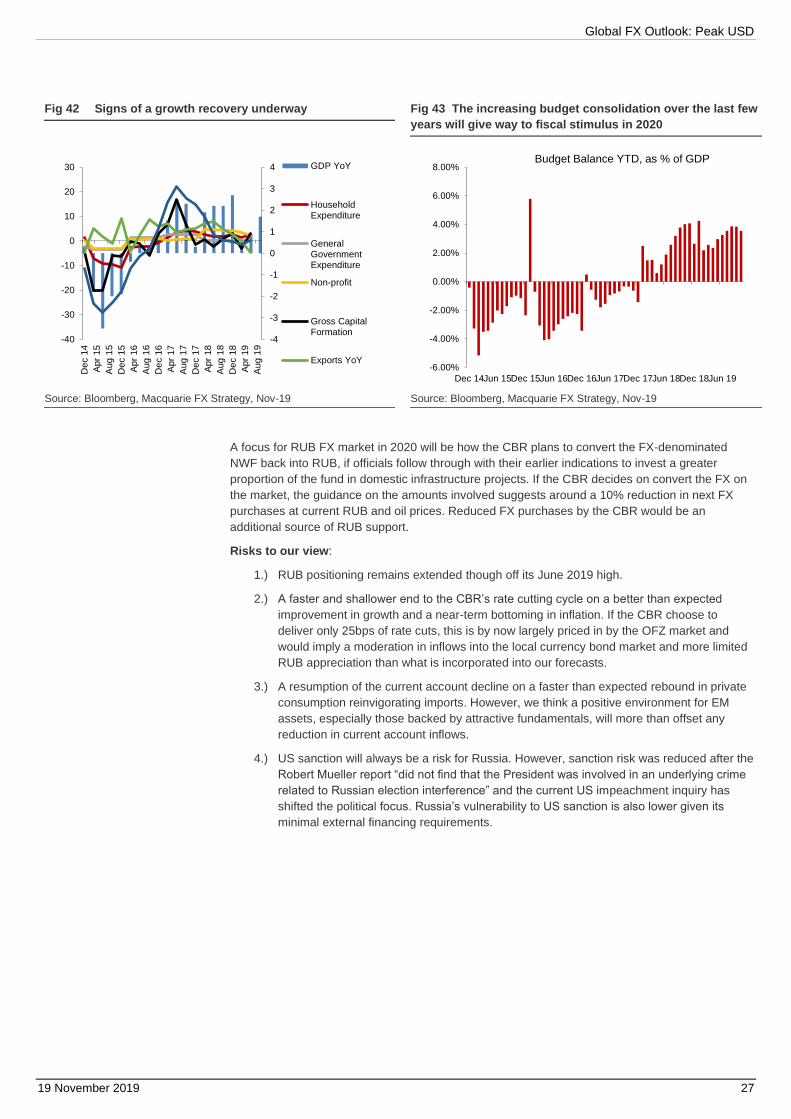
Global FX Outlook: Peak USD
19 November 2019 27
Fig 42 Signs of a growth recovery underway Fig 43 The increasing budget consolidation over the last few
years will give way to fiscal stimulus in 2020
Source: Bloomberg, Macquarie FX Strategy, Nov-19 Source: Bloomberg, Macquarie FX Strategy, Nov-19
A focus for RUB FX market in 2020 will be how the CBR plans to convert the FX-denominated
NWF back into RUB, if officials follow through with their earlier indications to invest a greater
proportion of the fund in domestic infrastructure projects. If the CBR decides on convert the FX on
the market, the guidance on the amounts involved suggests around a 10% reduction in next FX
purchases at current RUB and oil prices. Reduced FX purchases by the CBR would be an
additional source of RUB support.
Risks to our view:
1.) RUB positioning remains extended though off its June 2019 high.
2.) A faster and shallower end to the CBR’s rate cutting cycle on a better than expected
improvement in growth and a near-term bottoming in inflation. If the CBR choose to
deliver only 25bps of rate cuts, this is by now largely priced in by the OFZ market and
would imply a moderation in inflows into the local currency bond market and more limited
RUB appreciation than what is incorporated into our forecasts.
3.) A resumption of the current account decline on a faster than expected rebound in private
consumption reinvigorating imports. However, we think a positive environment for EM
assets, especially those backed by attractive fundamentals, will more than offset any
reduction in current account inflows.
4.) US sanction will always be a risk for Russia. However, sanction risk was reduced after the
Robert Mueller report “did not find that the President was involved in an underlying crime
related to Russian election interference” and the current US impeachment inquiry has
shifted the political focus. Russia’s vulnerability to US sanction is also lower given its
minimal external financing requirements.
-4
-3
-2
-1
0
1
2
3
4
-40
-30
-20
-10
0
10
20
30
De
c 1
4
Apr
15
Aug
15
De
c 1
5
Apr
16
Aug
16
De
c 1
6
Apr
17
Aug
17
De
c 1
7
Apr
18
Aug
18
De
c 1
8
Apr
19
Aug
19
GDP YoY
HouseholdExpenditure
GeneralGovernmentExpenditure
Non-profit
Gross CapitalFormation
Exports YoY-6.00%
-4.00%
-2.00%
0.00%
2.00%
4.00%
6.00%
8.00%
Dec 14Jun 15Dec 15Jun 16Dec 16Jun 17Dec 17Jun 18Dec 18Jun 19
Budget Balance YTD, as % of GDP
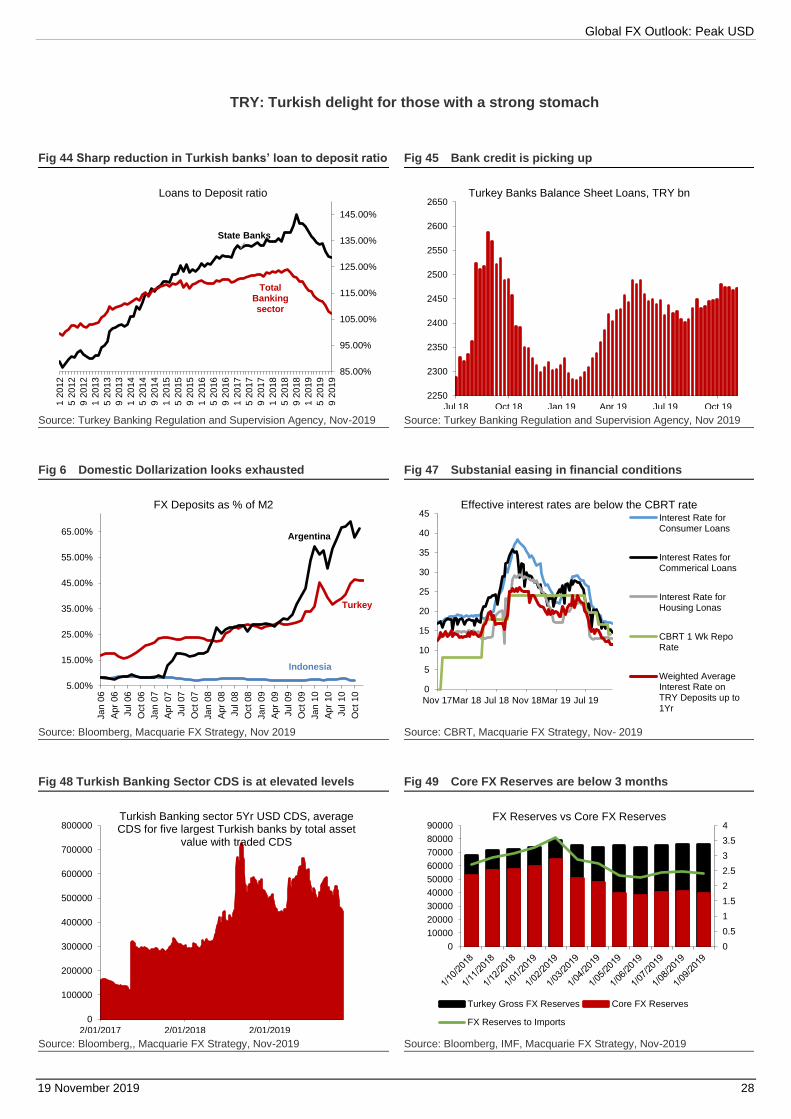
Global FX Outlook: Peak USD
19 November 2019 28
TRY: Turkish delight for those with a strong stomach
Fig 44 Sharp reduction in Turkish banks’ loan to deposit ratio
Fig 45 Bank credit is picking up
Source: Turkey Banking Regulation and Supervision Agency, Nov-2019 Source: Turkey Banking Regulation and Supervision Agency, Nov 2019
Fig 6 Domestic Dollarization looks exhausted
Fig 47 Substanial easing in financial conditions
Source: Bloomberg, Macquarie FX Strategy, Nov 2019 Source: CBRT, Macquarie FX Strategy, Nov- 2019
Fig 48 Turkish Banking Sector CDS is at elevated levels
Fig 49 Core FX Reserves are below 3 months
Source: Bloomberg,, Macquarie FX Strategy, Nov-2019 Source: Bloomberg, IMF, Macquarie FX Strategy, Nov-2019
State Banks
Total Banking sector
85.00%
95.00%
105.00%
115.00%
125.00%
135.00%
145.00%
9 2
019
5 2
019
1 2
019
9 2
018
5 2
018
1 2
018
9 2
017
5 2
017
1 2
017
9 2
016
5 2
016
1 2
016
9 2
015
5 2
015
1 2
015
9 2
014
5 2
014
1 2
014
9 2
013
5 2
013
1 2
013
9 2
012
5 2
012
1 2
012
Loans to Deposit ratio
2250
2300
2350
2400
2450
2500
2550
2600
2650
Jul 18 Oct 18 Jan 19 Apr 19 Jul 19 Oct 19
Turkey Banks Balance Sheet Loans, TRY bn
Turkey
Indonesia
Argentina
5.00%
15.00%
25.00%
35.00%
45.00%
55.00%
65.00%
Ja
n 0
6
Apr
06
Ju
l 06
Oct 06
Ja
n 0
7
Apr
07
Ju
l 07
Oct 07
Ja
n 0
8
Apr
08
Ju
l 08
Oct 08
Ja
n 0
9
Apr
09
Ju
l 09
Oct 09
Ja
n 1
0
Apr
10
Ju
l 10
Oct 10
FX Deposits as % of M2
0
5
10
15
20
25
30
35
40
45
Nov 17Mar 18 Jul 18 Nov 18Mar 19 Jul 19
Effective interest rates are below the CBRT rateInterest Rate forConsumer Loans
Interest Rates forCommerical Loans
Interest Rate forHousing Lonas
CBRT 1 Wk RepoRate
Weighted AverageInterest Rate onTRY Deposits up to1Yr
0
100000
200000
300000
400000
500000
600000
700000
800000
2/01/2017 2/01/2018 2/01/2019
Turkish Banking sector 5Yr USD CDS, average CDS for five largest Turkish banks by total asset
value with traded CDS
0
0.5
1
1.5
2
2.5
3
3.5
4
0
10000
20000
30000
40000
50000
60000
70000
80000
90000FX Reserves vs Core FX Reserves
Turkey Gross FX Reserves Core FX Reserves
FX Reserves to Imports

Global FX Outlook: Peak USD
19 November 2019 29
ZAR: A will, but no way
The combination of low growth, structural barriers to economic reform, high and inexorable rising
debt, immediate credit rating risk and a relatively hawkish central banks means ZAR will be left out
of the EM rally in 2020. The immediacy of risks related to the sharp deterioration in the fiscal
position means investors will be unwilling to take the risk for the returns on offer. We forecast
USDZAR at 15.55 and 15.2 by end-2020 and end-2021, respectively.
Fiscal policy: teetering under the burden of SOEs and debt service costs
The South African National Treasury failed to find ways to offset increased funding for State
Owned Enterprises (SOEs) and reduced tax revenue due to weaker growth, resulting in a material
deterioration in the fiscal deficit and debt-to-GDP ratios in the Medium Term Budget Policy
Statement (MTBPS). A persistent primary budget deficit and no consolidation in the debt-to-GDP
ratio across the forecast horizon increases our conviction that Moody’s will remove South Africa’s
last remaining investment grade rating from Q1 2020. Following the MTBPS, Moody’s changed the
outlook on the sovereign’s credit rating to negative on 1 November and cut the country’s 2020
GDP forecast on 14 November. The Moody’s 1 November review implicitly sets the February 2020
Budget Review as the deadline to “halt and ultimately reserve the rise in debt” seen in the October
MTBPS or lose its last investment grade rating. Moody’s admitted that resistance to reform from
key stakeholders and a too big to fail problem at the state electricity provider means this may be an
impossible task. A Moody’s downgrade will immediately trigger South Africa’s removal from
Citigroup’s World Government Bond Index, leading to bond outflows of around USD15bn. We
remain relatively bearish ZAR.
• The MTBPS reported a material deterioration in the fiscus. The budget deficit is now
expected to peak at 6.5% of GDP in FY2020, compared to the February estimate of 4.5%.
• Debt-to-GDP breaks 70% to hit 71.3% at the end of the forecast horizon. The Treasury
failed to show a consolidating debt level, reinforcing the Finance Ministers own
pronunciation that debt is “unsustainable”
• Real GDP growth was downgraded across the entire horizon, with real growth failing to
reach 2% by the outer forecast years. The result was a ZAR251.2bn gross tax shortfall
over FY19 to FY22, resulting in a revenue shortfall of ZAR231bn over the period.
• Expenditure was revised higher throughout the projection period due to persistent bailouts
of SOEs and higher debt-service costs. Consolidated expenditure rose by ZAR55bn over
FY19 to FY22, driven by a ZAR88.5bn increase in payments to financial assets, how the
National Treasury classifies SOE bail-outs including Eskom. Debt-service costs were also
increased by ZAR27.4bn.
Monetary policy: a solution for the different problem
The National Treasury provided a figure of ZAR150bn in additional cost saving measures that
would be needed to achieve the fiscal target and stabilise government debt by 2020. Other than
saying the savings would come from containing the public sector wage bill, no tangible details were
given about how the government would implement something that has proven unachievable in the
past given the political capital of vested interest groups.
Fig 50 Both lower revenue and greater expenditure is
responsible for the downgrade
Fig 51 Change in FY19 tax revenue between Feb Budget and
Oct MTBPS, ZAR mn
Feb Budget Review Oct MTBPS
-8.00%
-7.00%
-6.00%
-5.00%
-4.00%
-3.00%
-2.00%
-1.00%
0.00%
-2500
-2000
-1500
-1000
-500
0
500
1000
1500
2000
2500
2019/20 2020/21 2021/22 2022/23
Revenue, ZAR bn
Expenditure, ZAR bnBudget Balance, % GDP
-60000 -40000 -20000 0
Specific exercise duties
Import VAT
Ad-valorem excise duties
Skills development levy
Customs duties
Other
Fuel levy
Domestic VAT
VAT refunds
Corporate income tax
Personal income tax
Gross tax

Global FX Outlook: Peak USD
19 November 2019 30
Source: South Africa National Treasury, Macquarie FX Strategy, Nov-19 Source: South Africa National Treasury, Macquarie FX Strategy, Nov-19
With inflation undershooting target and growth, especially domestic demand, subdued, rates
market pricing in 18bps of SARB rate cuts in the next 6month seems justified, even conservative.
However, the disappointing MTBR and Moody’s response in changing the rating’s outlook to
negative and cutting the growth forecast suggest the SARB will exercise caution. Credit rating risk
and thus the implicit risk to the ZAR and the inflation target will limit the SARB’s ability to act.
Furthermore, we believe the SARB recognises the limits of monetary policy to support growth.
Ultimately South Africa suffers from structural barriers to growth meaning monetary easing can
provide little help, only increase the risks.
Fig 52 Increased funding for SOEs is only partially offset by expenditure elsewhere, but expenditure growth has been revised down in key areas throughout the forecast horizon
Source: South Africa National Treasury, Macquarie FX Strategy, Nov2019
Fig 53 No consolidation in the debt-to-GDP ratio
Source: South Africa National Treasury, Macquarie FX Strategy, Nov-2019
0.00%
2.00%
4.00%
6.00%
8.00%
10.00%
12.00%
14.00%
16.00%
0
50
100
150
200
250
300
350
400
450
Change in consolidated government expenditure by function, ZAR bn
Feb Budget Review Oct MTBPS Average annual growth FY19-FY21 Average annual growth FY19-FY22
Feb Budget Review
Oct MTBPS
0.00%
10.00%
20.00%
30.00%
40.00%
50.00%
60.00%
70.00%
80.00%
2019/20 2020/21 2021/22 2022/23
Gross public debt, % of GDP

Global FX Outlook: Peak USD
19 November 2019 31
Fig 54 Recent Foreign Net Inflows show complacency to
downgrade risk
Fig 55 Market expectations for SARB easing may be
disappointed
Source: Bloomberg, JSE, Macquarie FX Strategy, Nov-2019 Source: South Africa Nation, Macquarie FX Strategy, Nov-2019
Latin America: Will Politics Drive Performance in 2020?
Introduction and Summary Projections
Back in September, we were highlighting that the theme in Latin America was the slow-growth
trap that seemed to be ensnaring Brazil, Mexico, Chile, and Argentina. However, the consensus
that began to form in late Q3 was one that foresaw slow recoveries in 2020, at least for Brazil, Chile,
Argentina, and Mexico. (Colombia was an outlier that was already experiencing strong growth in H1
2019). The prospect of recovery, however slow, was based partly on easy monetary policy. Central
banks in Brazil, Mexico, and Chile were after all, easing in the wake of lower inflation. A global
recovery, predicated on a truce in the US-China trade war and on monetary policy easing
abroad, was also part of the more optimistic picture for 2020.
Of course, local politics and social conditions have are always figured prominently for
investors in Latin America, but the events of the past few weeks (in Mexico, Brazil, Argentina,
and especially Chile) have put politics and social issues front and center again. And these are
now seen as a significant factor potentially diminishing the relative importance of the global recovery,
local monetary policy, and the region’s own reform agenda as drivers of asset price performance
and regional FX returns in 2020. Indeed, traders now worry that politics and social unrest in the
region may upend both monetary policy and the reform agenda, deflating any recovery that
the region may otherwise have seen in a calmer political environment during 2020.
That’s why we keep the political and social trends in mind when we discuss the region’s
countries and their respective FX and rates outlooks, below. Are we worried about these
trends? It’s hard not to be worried. We’ve already seen how social and political revolutions have
already overturned the conventional views on Chile and Argentina this year, and both countries are
set to enter an extended period of uncertainty because of it. If Chile – the region’s safe economy –
can be hit, then Mexico, Brazil, and Colombia can be too.
-2000
-1500
-1000
-500
0
500
1000
1500
No
v 1
6
Ja
n 1
7
Mar
17
May 1
7
Ju
l 17
Sep
17
No
v 1
7
Ja
n 1
8
Mar
18
May 1
8
Ju
l 18
Sep
18
No
v 1
8
Ja
n 1
9
Mar
19
May 1
9
Ju
l 19
Sep
19
South Africa Net Sales to Foreigners, ZAR mn, 50 day rolling avg, normalised as of 2 Jan 2019
Bonds Equity
6.5
6.6
6.7
6.8
6.9
7
7.1
7.2
7.3
Oct 18 Jan 19 Apr 19 Jul 19 Oct 19
SA Forward Rate Agreement 1x 4
SA Interbank Agreed Rate, JIBAR 3 Mnth
Thierry Wizman +1 212 231 2082 [email protected]

Global FX Outlook: Peak USD
19 November 2019 32
Fig 56 Macquarie’s FX and Policy Rate Projections for Latin America
Source: Bloomberg LP, Ministry of Economy
Argentina: Bondholders (and Growth) May Be Sacrificed in the Age of Protests Fernandez’ Frente de Todos Beat Macri’s Cambiemos. Argentina’s social and political revolution
came in October with the election of Alberto Fernandez, the candidate of the neo-Peronist Frente de
Todos coalition. He defeated President Mauricio Macri in a one-round election with 48.0% of the
votes (vs. 40.4% for Macri), thus ending the market-friendly tenure of Macri’s Juntos por el Cambio
administration. Of course, the Frente’s victory was widely expected since August’s primary election
(see here). Yet Macri’s Cambiemos coalition did OK in the Lower House (of Deputies) where it holds
46% of seats, and in the Senate (42%), hinting at an institutional balance among lawmakers. Still,
the composition of Congress won’t be very relevant for some issues in Argentina, such as how the
new government will be disposed toward external (i.e., foreign) bondholders. And yet the issue of
how bondholders are treated may determine when and if foreign capital returns to Argentina
eventually, and whether ancillary issues, such as the lifting of FX controls, takes place in the
foreseeable future. By extension, it also will determine whether growth resumes.
Fernandez May Reduce Debt Burden, But at a Cost to Bondholders. Although Argentina’s
current debt burden is high (see Figures, below), it can be made sustainable were fiscal spending to
be reduced, which would help maximize the value of its debt. But fiscal austerity would be
politically difficult for the new government to implement. And after all, even if debt sustainability
were not the issue, the new left-wing government would have a political incentive to avoid a large
fiscal adjustment, seeing as how fiscal adjustment (specifically, the removal of transportation
subsidies) led to a social explosion in Chile, next door. Fernández criticized Macri for slashing energy
and transportation subsidies. In four years, those federal subsidies went from 5% to 1.6% of the
GDP. So they could now go up again, under Fernandez, if the debt burden were to decline with a
restructuring that reduced coupon payments, haircut principal, or rescheduled maturities.
Fig 57 Argentina’s borrowing binge in 2016-18… Fig 58 …led to large debt service costs in 2019-2023
Source: Ministry of Economy, Argentina Source: Ministry of Economy, Argentina

Global FX Outlook: Peak USD
19 November 2019 33
The Region’s Social Protests Reduce Bondholder Power. Knowing that the new gov’t will have
a strong political incentive to reduce debt through a significant restructuring, and not adhere to fiscal
austerity, Argentina’s external bondholders have been organizing a “blocking minority”, in case the
new gov’t begins its negotiations by asking for a large haircut on Argentina external debt. The need
for blocking minority arises from the so-called “collective action clauses” – or CACs - in the bond
indentures. CACs require that if a super-majority of bondholders agrees to a debt restructuring, it
can impose the solution on all bondholders. As such, CACs are believed to reduce the power of
bondholders that reject a negotiated restructuring, since those holdouts are powerless to,
well, hold out, or bring their claims into Court.
Yet if a blocking minority can’t be put together, can bondholders avoid a large restructuring
if the government wants a large restructuring? To a degree, they can. After all, capital markets
would perceive an unnecessary squeeze of bondholders as a tactical default, setting in motion
processes that would be detrimental for Argentina’s future growth, its trade relationships, and even
its ability to service its restructured debt. The prospect of a long protracted fight in the courts
could temper the Argentina government’s demands, of course, but the new gov’t may not
care about issues such as trade and international integration that much if it risks street
protests of the kind seen in Chile if it relents to bondholders. After all, the political platform of
Fernandez and Cristina Kirchner has been to argue in opposition to the Mercosur-EU Treaty. They
have also argued in favor of a model of import substitution—which would make Argentina an even
more insular economy.
Moreover, the IMF (which is now a major creditor to Argentina) is likely to want Argentina’s external
debt to be sustainable and serviceable, so that the IMF’s exposure is minimized, before resuming
disbursements. It may also adopt a sympathetic view toward the government, in view of the risk of
social unrest. As such, external bond-holders may see their interests in conflict with the
government and the IMF, putting them at a disadvantage in negotiations.
How Long Must We Wait to See What Happens? Our analysis of how much FX Argentina could
muster through the use of its net international reserves and any prospective current account surplus,
suggests that it may have between USD 10bn and USD 15bn of “play” left to deal with debt service
costs, assuming that no new foreign capital is sourced. On the basis of this, and the amount of debt
service payments over the next year, we believe that negotiations with bondholders may last for a
year before Argentina is apt to begin defaulting on principal and coupon payments to external
bondholders. That relatively ‘short runway’ works to the negotiating advantage of the government,
rather than the creditor. Once reserves run out, bondholders may wish to ‘deal’ so as to avoid the
prospect that coupons are missed and that their bonds become ‘zombie’ bonds.
Fig 59 Not all Reserves can Be Used to Pay Debtors… Fig 60 Net reserves are likely no greater than USD 10bn
Source: BCRA, Argentina Source: BCRA, Argentina
Might Fernandez Treat Bondholders Well? There has been some ‘hope’ that Fernandez would
adopt a more conventional view of bondholder rights, but there is little tangible support for
this yet. Fernandez recently said that the 2003 Uruguayan debt restructuring might be a better path

Global FX Outlook: Peak USD
19 November 2019 34
for Argentina to follow. In that restructuring, there was voluntary debt exchange that lengthened
maturities by 5 years while keeping coupons and principal constant. The process was widely viewed
as “friendly” as it was completed with 93% participation, and because Uruguay was able to access
international credit markets within the year. But there is no way of really knowing if this comment
was intended to keep markets calm until the election. Moreover, the Uruguayan restructuring
involved not just a haircut, but also required a significant fiscal adjustment and important structural
reforms - which would go against Fernandez’ promises on the campaign trail. So, when Fernandez
is confronted with the need to avoid a fiscal adjustment and reforms, he may abandon the Uruguay
plan. The other unknown factor is the role that Cristina Fernandez Kirchner will play as Vice-
President. She may stay on the sidelines at first, as Pres. Fernandez negotiates with
bondholders and the IMF, but she may exert her influence behind the scenes, and her
disposition is likely to be antagonistic to the bondholders.
Bottom Line: Watch How Bondholders Will Be Treated. If there is to be a signal of whether
the new government will be “market-friendly”, it will come in the way that the new gov’t treats
bondholders in the negotiations over the next year. A willingness to reschedule the maturity of
Argentina’s external bonds (instead of large haircuts) would be such a signal, and traders would use
this to anticipate other “market-friendly” actions, including a commitment to fiscal austerity. But so
far, the government has not suggested that it would adopt fiscal austerity or treat bondholders with
largesse. As such, we remain skeptical regarding outcomes in Argentina over the next year.
We believe that FX controls, for example, will persist throughout 2020, ensuring that capital flight is
minimized, but not prevented. At the same time, we remain concerned that the BCRA’s monetary
policy to date – of fixing the monetary base – will be abandoned in favor of monetary finance of the
deficit. The bias in this backdrop, of course, is toward a cheaper ARS over time.
Brazil: Success with Reform, But Politics Becoming Less Benign
Unlike Argentina, Brazil has Seen Favorable Politics. That positive backdrop facilitated the final
passage of pension reform in the Congress in October, which was a major benefit in stabilizing
Brazil’s gross debt-to-GDP ratio over the coming years. More importantly, the passage of pension
reform demonstrated to the skeptics that there was an alignment in Congress for the government’s
reform agenda more broadly. It also demonstrated the political skill of the economy Minister, Paulo
Guedes, during a period in which President Bolsonaro largely stayed out of the debate in Congress.
But Politics Hasn’t Made Us Bullish on the BRL in the Short Term. Yet despite the recent good
news on reform, we’ve noted that there are a few forces that are still militating in favor of a weaker
BRL, and our year-end 2019 projection is 4.25 for the USD/BRL, before we see some stabilization
in the pair in 2020, on the premise of reform.
First, we remain convinced that the BRL remains under competitive pressure from the recent
devaluation of the ARS. Brazil, after all, conducts about 20% of its gross trade with Argentina, its
3rd largest trading partner after China and the US. Conversely, Brazil is Argentina’s largest trading
partner, followed by the EU and China. The recent depreciation of the CLP, while not as impactful
for Brazil’s competitiveness as the ARS, may also impart some competitive pressure.
Fig 61 Brazil’s trade balance suffered in the Argentina devaluation of summer 2018
Fig 62 …with the slowdown in trade weighing on both industrial production and GDP
Brazil’s trade balance with Argentina, Dec. 2013 to Mar. 2019, in million USD
Argentina’s and Brazil’s auto exports, by destination (2017, in billion USD)
Global FX Outlook: Peak USD
19 November 2019 35
Source: IMF data, via Bloomberg LP Source: Trade Map
Second, and at least for the time being, the central bank’s (BCB’s) decision-makers are
implicitly pursuing a weak-BRL policy, with an aggressive pace of policy-rate cuts that will
likely endure into December with another 50bp reduction in the SELIC target, before the target
eventually settles at 4.00% with another two 25bp cuts.
The Copom’s recent statement highlighted how underlying inflation measures are “running at
comfortable levels”, and that the “the consolidation of the benign scenario for prospective inflation
should permit an additional adjustment of the same magnitude” – i.e., -50bps in December – even
though “the current stage of the business cycle warrants caution when considering “possible new
changes in the degree of stimulus”. The assessment of the current situation saw Brazil’s economy
improving only gradually. Projections of CPI inflation for 2019 and were kept unchanged from
September at 3.4%, 3.6%, respectively, but the 2021 projection of 3.5% remained well below the
respective mid-points of the inflation target ranges for that year (3.75%). That suggests that if the
Copom were trying to achieve inflation convergence over a multi-year period, rather than
inflation stability, there is room for more cuts in the short term to reduce the base from which
interest rates may have to rise later. We also note that long-term inflation breakevens remain
historically low, at around 3.85%, and comfortably within the BCB’s +/- 2% range around the 3.5%
2022 midpoint. The Copom, in effect, is OK with a weaker BRL.
In 2020, Though, Things Get Interesting. Following the current bout of weakness, however, we
see a better environment for the BRL in 2020, and expect relative steadiness, compared to the
upward trend in USD/BRL of 2019. The BCB’s rate cuts after all, will end by Q1 2010, allowing
investors to focus on the pending recovery in Brazil. That recovery has already started it seems, with
the recent uptick in consumption, although it is yet to reveal itself in better industrial output, owing to
ongoing competitive pressures. But more importantly, it is Brazil’s structural transformation
that may move into the limelight in 2020.
For our part, we have been cautiously optimistic about the passage of new reforms in 2020,
or at least more political progress toward reform. This includes a tax reform, central bank reform,
a new bankruptcy law, administrative reform, and new laws governing public-private partnerships to
help enable asset sales. Asset sales themselves (i.e., further sales of public-sector companies,
mineral concessions, and infrastructure facilities, such as ports) are likely to also be prominent in
2020. Why stay optimistic? Admittedly, recent events in privatization have not gone well, after all.
Brazil’s auction of deep-water profit-sharing agreements didn’t see significant interest from foreign
oil companies in November, but we would attribute that to a poorly-designed auction mechanism,
rather than poor politics. Instead, we’d rather look at political support for Economy Minister Guedes’
economic policy agenda. On that count, public support remains above 50%, even though
approval of Bolsonaro himself barely rests above 30%.
Are There Political Risks? Of Course. Indeed, in the very past few sessions, some events have
cast doubt on whether politics will stay conducive to Brazilian reform in 2020. The biggest of these
events was the release from prison of former President Inacio Lula da Silva. His release was the
result of a generic case before the Supreme Court, in which it decided that convicts could stay out
of jail while they have yet to exhaust the court system’s appellate process. The bad news is that this
means that Lula will return to the political spotlight and take an active role in his Workers’ Party,
although he is barred for now from running for political office. But there is some ‘good news’ in this
too, perhaps. First, Bolsonaro’s popularity is based on his image as the "anti-Lula," so he will use
this to rally his own support base, and possibly fight harder for reform. The return of Lula may also
hamper the emergence of new leaders at the PT, who could otherwise had more vigor to challenge
the administration’s agenda. So this may reignite some left-right polarization in Brazil, but it
may also cause Bolsonaro to pursue reform more aggressively by “getting in the game”. We
would get more concerned, however, if the Supreme Court would annul Lula’s conviction completely,
as this would return his eligibility to run for the presidency in 2022.
So we remain cautiously optimistic about momentum in the reform process, but just as
Argentina, Chile, and Mexico have not been immune to a return of left-wing political and
policy agendas, of late, Brazil’s political outlook is important and requires monitoring.
Chile: Social Unrest Culminates With the Uncertainty of a Constitutional Change Before the Riots Began, We Weren’t Fans of the CLP. That’s because we saw Chile’s economy
as prone to being buffeted by global trends largely outside of policymakers’ control. That made for

Global FX Outlook: Peak USD
19 November 2019 36
higher risks, and traders need higher expected return to assume higher risk – i.e., a cheaper CLP.
Moreover, we saw little incentive for the BCCh to fight against any CLP weakness. The BCCh was
structurally dovish we argued, expecting that Chile’s disinflation process would endure for many
quarters, if not years. Finally, we couldn’t count on structural reform, either. Expectations for reform
in Chile were high when the center-right government of Chile Vamos, led by President Sebastian
Pinera, took over. But the lack of a legislative majority for his coalition and allies (due to
institutional changes in the way seats are allocated in the Congress) had kept the reform
initiatives on the back foot. Among the most important reforms that have stalled include a
modernization of the tax, healthcare, labor, and pension systems. And as these reforms have stalled,
the far left in Congress has become more assertive, pushing for anti-market measures such as
minimum wage legislation. The inability to pass reform, against a backdrop of low growth, had
led to lower support for the government, with Pinera around 30% in approval ratings.
So there was already tinder in place when Chile’s street riots began in mid-October. Although
ostensibly set off by an increase in public transportation fares, political polarization and
disaffection were already high.
Riots Set Off a Process of Reform Reversal. What happened in response to the riots, however,
is what mattered more for traders and investors. First, Pinera’s government remained unwilling to
make concessions to the street movement. Then, the opposition took advantage of the situation.
Seeing as the riots had unearthed the disenchantment of the middle class, and pointed to a rejection
of market-oriented reforms that Pinera’s gov’t was still trying to get passed at the time that the riots
broke out, the opposition pressed for a reversal of reforms. The government conceded by broadening
some social entitlement programs (health insurance, pensions), and allowing an increase in
minimum wages. Yet in a late October poll, 80% of respondents said that those “reforms” were
“inadequate, and social protest spread to other segments of civil society – unions, students, etc.
The Dam Broke When the Government Proposed to Revamp the Constitution. With the riots
expanding to encompass protests by other segments of society (e.g., unions), Pinera’s gov’t threw
in the towel on the weekend of November 9-10, by offering to initiate a process that will revamp
Chile’s Constitution. Notwithstanding that the current Constitution has already been seen major
amendments introduced several times since it came into force in 1990, traders now feared that a
wholly new Constitution will codify various entitlement programs as “inalienable rights”. That would
make the new Constitution more rigid, and potentially “lock in” an extended period of higher fiscal
spending, and effectively attenuate Chile’s reputation as a market-friendly country with stable
institutions. (This, despite the government’s stated purpose of writing a new Constitution to expand
“civil participation” in the democratic process.) It’s no wonder, then, that the USD/CLP rose to 800
in the trading that took place after that announcement, before the BCCh stepped in with a
program to provide USD liquidity through short-term swaps, auctioned over a period of
several months.
Next Comes a Long Period of Uncertainty. In our view, the prospect that Chile will undertake to
draft a new Constitution risks stacking the political environment against the pro-market political
forces, given that these forces were already flailing before the riots began. Indeed, a recent poll
shows that 52% of respondents prefers a whole new Constitution, while only 42% favor new
amendments only. Pinera’s polls are too low to resist the thrust, with his approval rating now close
to 14% - a historic low in Chile. And of the 52% that want a new or amended Constitution, roughly
2/3rds say it is necessary because a “new agreement with citizens” to meet “new times” is needed.
The balance say it is needed because it “originated in the dictatorship”. (The Constitution of 1988
emerged out of a series of pro-democracy organic laws that were instituted by the dictatorship of
Augustin Pinochet.) And on the matter of the protests, 72% agree that they should go on, suggesting
that social unrest will now become a way for segments of civil society (unions, students, etc.) to
ensure that their agendas are reflected in the new Constitution. The principle risk is that drafting
a Constitution will be fraught with social unrest, while traders see the uncertainty associated
with the process as an excuse to shun the local market.
GDP to Worsen in Q4, But BCCh May Not Cut in December. Even though Chile’s Q3 growth was
solid at 0.7% quarter-over-quarter (3.3% year-over-year), there’s now little doubt in our minds that
Chile will suffer a significant decline in Q4 GDP growth that approaches a recession. There’s also
no doubt that the BCCh is structurally ‘dovish’, given it’s a priori belief that Chilean inflation was
being subjected to structural changes that would keep inflation low. However, even a dovish
central bank has its limiting principles, and we doubt that the BCCh would be quick to cut the
policy rate again in December. Indeed, the policy Minutes (for the Oct. 23 meeting) released on

Global FX Outlook: Peak USD
19 November 2019 37
Monday (the 11th) had already brought no confirmation in the forward guidance to suggest that a cut
was coming. The policy Board made the case that recent events would have an impact on
inflation that is uncertain and “not obvious”. Yet since those Minutes were prepared, the impact
has become more obvious; the major depreciation in the CLP almost ensures that pass-through will
be reflected in higher inflation on a six-month horizon. And this is in addition to the negative supply
shocks emanating by the various logistic disruptions since the protests began. So we conclude that
the BCCh is even more likely to refrain from easing in December, and to keep the policy rate
(the TPM) at 1.75%.
Fig 63 With the recent depreciation, Chile’s CLP reached its historical lows on a real effective exchange rate basis
Fig 64 With pass-through, inflation is set to go higher
Source: JP Morgan, via Bloomberg LP Source: Bloomberg, Macquarie calculations
What Happens to the CLP? We argued on November 12 (here) that traders that went short CLP
vs. the USD or vs. other crosses, such as the COP, should consider taking profit tactically when
USD/CLP had reached 800. After all, the two-day spike in USD/CLP to 800 after the weekend of
Nov. 9-10 was a three standard-deviation event. And as far as economic benchmarks go, the CLP’s
real effective exchange rate (CPI based) had declined to a point where the CLP is as cheap as it
was in 2003, 2008, and late 2015, but not cheaper than at those points. However, because of the
issues noted above, this is unlikely to be the week of Nov. 10-16 is unlikely to mark the end
of the general political turmoil in Chile. So we expect that after the USD/CLP settles below
800 for a brief period, long-term hedgers will come out. The prospect of a political-economic shift
(coming with a new Constitution) may eventually work to ensure that the real value of the CLP is
undergoing a structural revaluation, making the range-benchmark levels for the CLP and its CPI-
based REER obsolete. We see these pressures acting on the CLP throughout this period of
uncertainty, with USD/CLP eventually climbing again, toward 840 by end-2020.
Colombia: The Region’s Growth Leader – But Don’t Discount Prospect of Unrest Growth Outpacing the Region’s. On reason we’ve liked the COP is that we have felt that its value
would reflect Colombia’s standing as Latin America’s growth leader. Indeed, recent growth in
Colombia has been coming in at multiples of the growth at its Latin America peers, where until Q3
ended growth slumps still prevailed. The growth data in Colombia has also stayed loftier than
we or most analysts expected in recent months, suggesting a still-strong turnout for H2 2019.
For example, the monthly estimate of GDP (the ISE) showed that activity is still picking up speed in
Colombia, with a 3.7% year-over-year gain compared to a 3.6% increase in Q2. This continuing
strength reinforces the view that overall growth won’t soften just yet in Q3 2019, and the carryover
(of strong H2 growth) may still produce growth of roughly 3.5% in 2020 (all else equal), keeping
Colombia a growth stand-out on a year-over-year basis, in 2020.
Why Has Growth Been Stronger Than Peers? One reason is the government’s ongoing
infrastructure expansion, especially in 4G telecom infrastructure. But Colombia policymakers like to
attribute the growth to the government’s pro-growth reform policies. In the “official view”, the fiscal
reform 2018, which reduced the corporate tax rate from 37% to 33%, and enacted other incentives
Global FX Outlook: Peak USD
19 November 2019 38
to investment – such as a reduction in the VAT for capital goods imports – caused the surge in
investment, which multiplier effects carried consumption along. The “official view” has some
merit, as recent growth is driven by investment, rather than consumption. For the first time in
many years, in fact, growth in Colombia’s gross fixed investment has exceeded growth in household
consumption, although both have recently run just above 4% per annum – i.e., both strong.
…And the Regional Inflation Leader. Colombia’s strength, however, has come at the “cost” of
some inflation, with CPI now tracking near 3.8% year-over-year. Indeed, following a September print
that saw CPI inflation accelerate, inflation is now tracking near 3.8% year-over-year, alongside a
0.22% month-over-month increase in the CPI. September’s inflation reflected sturdy food price
increases of 0.48% month-over-month, after a 0.13% drop in August, and energy prices increased
by 0.46% month-over-month from a previous -0.09% change. On annual terms, food prices now
account for about 25% of annual inflation, and core inflation continues to diverge further from
BanRep’s target, at 3.4% year-over-year. In effect, the anticipated decline in Colombia inflation
has not yet occurred. Naturally, because we are speaking of consumer prices, strong
household demand is partly to blame. Data released last week showed that retail sales jumped
9.5% year-over-rate in August, up from 8.1% in July, and the underlying trend is rising. Core retail
sales, excl. fuel and autos, rose 11.2% in August, accelerating from 8.4% in July and 7.2% in Q2.
…But BanRep is Unlikely to Hike in Q4 2019. Colombia’s BanRep hasn’t yet responded to this
inflation, with its most recent rate action being a cut in its repo rate to 4.25%, back in 2018. But
Colombia’s BanRep remains among the more ‘hawkish’ central banks in the region. And for good
reasons – the anticipated decline in Colombia inflation has not yet occurred. Moreover, the ongoing
boost from a hefty infrastructure program, including at the local level as municipal elections approach
in Q4, are supporting an activity upturn. Data last week showed that retail sales jumped 6.9% year-
overrate in September. With that, why didn’t the BanRep just hike rates at its October 31
meeting, and why won’t it hike on December 21? It could, of course, do so. But it is likely
restrained, for now, by a few factors:
(1) First, there’s the fact that inflation expectations for 12 and 24-months ahead remain relatively
well-anchored at 3.4% and 3.2% year-over-year, still suggesting no divergence from target.
(2) Second, as noted above, the spike in September inflation derived mainly in the non-core areas,
especially food, owing to supply-shocks related to the weather. That’s expected to be a
transitory factor, according to our recent meetings with BanRep officials. Core inflation is lower,
and BanRep has expressed to us that it is confident that core inflation is in structural decline.
(3) Of course, the inflation seen may reflect pass-through from the weaker COP in July and August,
but with global conditions possibly set to improve if there is a ‘truce’ in the trade war, BanRep
may conclude that pass-through will have limited impact on inflation. The BanRep generally
perceives that pass-through is low, in any case, at no more than a 12% ‘delta’. In any case, it
was worry about pass-through that led to speculation in early October that the BanRep would
intervene in the FX market. BanRep didn’t intervene, however, bolstering the case that it
sees the inflation burst as not something that should warrant higher interest rates for the
purpose of stabilizing the COP.
(4) Fourth, there is uncertainty about whether Colombia’s tax reforms will remain in effect,
after they failed to withstand judicial review a few weeks ago. The Constitutional Court has
recently struck down the tax breaks passed in 2018, on the premise that its passage in 2018
had procedural irregularities. This uncertainty will stay BanRep’s hand, throughout Q4.
Ultimately, however, we believe that the congress will pass the fiscal reform measures
again, by end-2019, averting a fiscal contraction.
So we don’t yet see a rate hike in Q4 2019. But we also believe that BanRep is unlikely to hike
in H1 2020 either. That’s because we expect that growth will slow at the margin in Colombia
as we enter 2020, even though that is not the intention of the government.
One reason is that the government’s aggressively hawkish fiscal targets would leave at least
some of the burden for stimulus on the BanRep in 2020. The 2020 Budget would lock in the
more fiscally responsible spending contours in 2020 (see Figure, below). (The draft 2020 budget
curtails public investment by roughly 0.3% of GDP. In the absence of an oil-price recovery, the deficit

Global FX Outlook: Peak USD
19 November 2019 39
targets are likely to remain highly pro-cyclical, even as they help Colombia avert a rating downgrade
as the rating agencies wait to see how the debt-to-GDP ratio evolves.)
Another factor that would be a further slowing in areas where there’s already been some weakness
- i.e., residential and commercial construction (which makes up 40% of gross investment). Housing
prices in Colombia’s main cities have remained solid for several quarters, and haven’t seen a
reversal through Q2. But builders are likely sensing an oversupply following the building boom and
high prices of the 2012-2016 period, and are curtailing construction activity. In addition, consumers’
expectations for their future economic situation, have deteriorated consistently since April,
suggesting that consumption may slow further, putting an even greater onus on investment. Thus,
Q2-Q3 growth may be a ‘peak’, and the economy will come under pressure by Q1 2020.
We think that BanRep will be forward-looking in its assessment of growth, seeing growth slowing in
sequential terms in 2020, but the optics of a strong year-over-year growth may matter enough to get
the BanRep to also avoid easing ‘prematurely’ in H1 2020. So we see a standstill in policy rates
in H1 2020. We’re still more inclined, however, to believe that the ‘next move’ is a cut, although that
comes way ahead in H2 2020, by which time inflation will have receded, and Colombia can ‘catch
up’ with the low policy rates that will sill prevail in the region.
Colombia’s External Risks are not as Bad as They Seem. It is legitimate to ask why the COP
hasn’t done better under a still vigilant BanRep in 2019 and despite strong growth. In our view, that’s
because traders continue to attach several downside risks to Colombia and the COP, although some
of these risks aren’t as scary as they seem to be. What are these risks and why are they not as
scary as they seem?
1. One ‘risk’ is that oil seems to be in structural surplus, with prices declining. Oil prices
are still relevant for the terms of trade, but less so for the budget and for FDI. That’s because
efficiency gains have resulted in extraction breakevens moving from USD 65/bbl. Several
years ago to USD 45/bbl on a Brent-equivalent basis. So activity in the sector is far from
slowing down. Moreover, oil production itself is growing at 4% p.a., - giving the government
revenue support even if prices edge lower. Our recent meetings with Finance Ministry
officials also revealed that Colombia will begin to hedge the oil exposure in the
Budget, the way that Mexico does.
2. The second ‘risk’ is Colombia’s large current account deficit, about 4.25% of GDP is
wide, creating a challenge for the COP. Yet traders also forget that Colombia’s strong
FDI inflows, about 4.75% of GDP— particularly to activities related to the oil sector—
persists, despite weaker oil prices. That is, FDI inflows remain above what is needed to
finance Colombia’s current account deficit, and with FDI growth of 24% in 2019,
coverage of the CA deficit is likely to continue into 2020.
3. Also, traders forget that nearly 3/4 of Colombia’s current account deficit derives from
up-streamed dividends payments made to foreign owners of Colombia’s companies.
This is the result of many years of international investment in Colombia’s oil sector and
other sectors. (Only 1/4 of the CA deficit actually arises from a net trade deficit and net
transfer payments.) In times of stress or declines in corporate revenue, those
dividends would be adjusted lower, curtailing USD demand. Finally, remittances are
now 2% of GDP – a hefty sum that is starting to rival Mexico (at 3%).
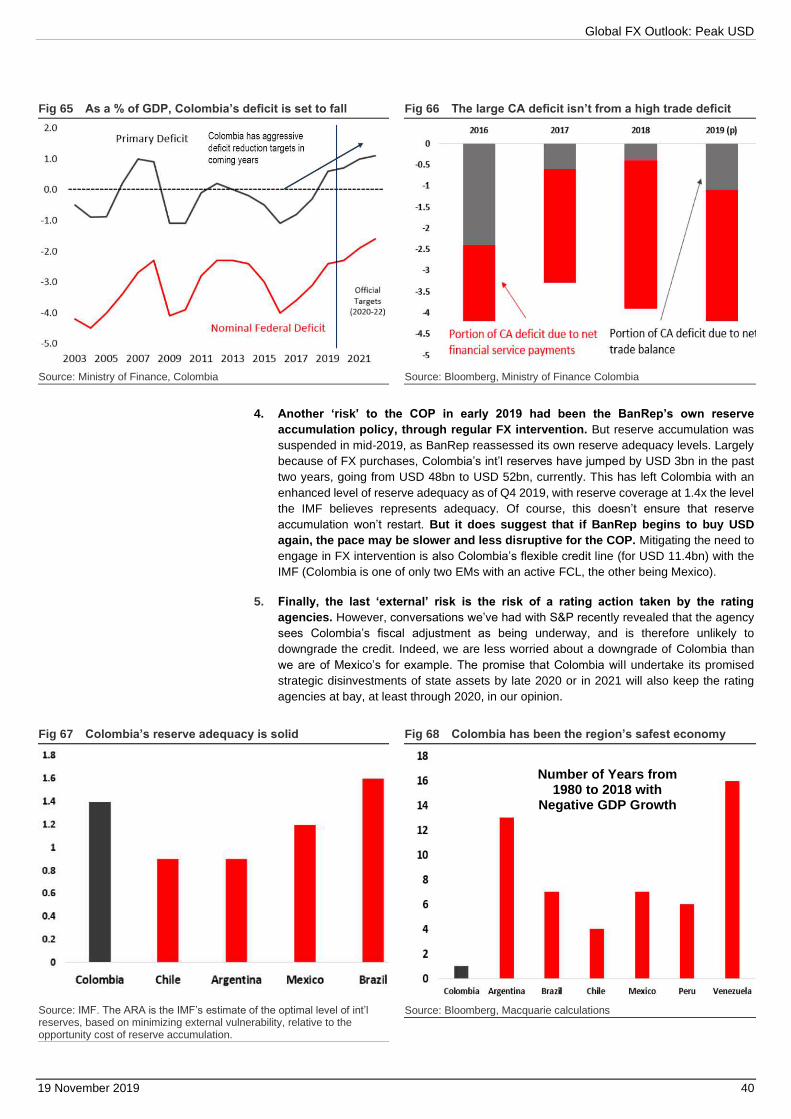
Global FX Outlook: Peak USD
19 November 2019 40
Fig 65 As a % of GDP, Colombia’s deficit is set to fall Fig 66 The large CA deficit isn’t from a high trade deficit
Source: Ministry of Finance, Colombia Source: Bloomberg, Ministry of Finance Colombia
4. Another ‘risk’ to the COP in early 2019 had been the BanRep’s own reserve
accumulation policy, through regular FX intervention. But reserve accumulation was
suspended in mid-2019, as BanRep reassessed its own reserve adequacy levels. Largely
because of FX purchases, Colombia’s int’l reserves have jumped by USD 3bn in the past
two years, going from USD 48bn to USD 52bn, currently. This has left Colombia with an
enhanced level of reserve adequacy as of Q4 2019, with reserve coverage at 1.4x the level
the IMF believes represents adequacy. Of course, this doesn’t ensure that reserve
accumulation won’t restart. But it does suggest that if BanRep begins to buy USD
again, the pace may be slower and less disruptive for the COP. Mitigating the need to
engage in FX intervention is also Colombia’s flexible credit line (for USD 11.4bn) with the
IMF (Colombia is one of only two EMs with an active FCL, the other being Mexico).
5. Finally, the last ‘external’ risk is the risk of a rating action taken by the rating
agencies. However, conversations we’ve had with S&P recently revealed that the agency
sees Colombia’s fiscal adjustment as being underway, and is therefore unlikely to
downgrade the credit. Indeed, we are less worried about a downgrade of Colombia than
we are of Mexico’s for example. The promise that Colombia will undertake its promised
strategic disinvestments of state assets by late 2020 or in 2021 will also keep the rating
agencies at bay, at least through 2020, in our opinion.
Fig 67 Colombia’s reserve adequacy is solid Fig 68 Colombia has been the region’s safest economy
Source: IMF. The ARA is the IMF’s estimate of the optimal level of int’l reserves, based on minimizing external vulnerability, relative to the opportunity cost of reserve accumulation.
Source: Bloomberg, Macquarie calculations
Number of Years from 1980 to 2018 with
Negative GDP Growth

Global FX Outlook: Peak USD
19 November 2019 41
The COP Offers a Better Reward-to-Risk Ratio. After all, despite the exposure to oil prices and
the perceived external vulnerabilities, Colombia’s GDP has been remarkably stable over four
decades, with the economy suffering only one negative-growth year since 1980. From that
perspective, it is safer than any of the major Latin American economies or currencies. Moreover,
given that one of the extant risks in the world is a disruption in oil supplies, the COP at least offers
an interesting diversification within local currency portfolios. That combination of the high relative
carry, relative safety in the growth variance, combined with diversification benefits will keep the COP
relatively steady in 2020, in the context of a USD that will be weakening against the major currencies
(EUR, AUD, and GBP). We project stability around 3400 in Q4 2019 to Q1 2020, followed by
slow depreciation to 3600 in keeping with an eventual return to more ‘dovishness’ at BanRep,
alongside a growth slowdown by H2 2020.
Why Stability and Not Gains for the COP? Because the country’s political travails are unlikely
to get investors to take a huge leap into Colombia’s money markets, despite strong growth.
The euphoria over the installation of Ivan Duque as President in 2018 has clearly faded, as Duque
made missteps in the peace process, and in urging for too-aggressive a tax reform in 2018-2019 –
one that was eventually watered down. Also, with the protests in Chile, anxiety has been building
over labor-strike activity in the short term and into 2020, and the left-wing opposition is likely to take
advantage of Duque’s declining ability to govern to protest periodically. Other domestic risks are a
return to arms by former commanders of the Revolutionary Armed Forces of Colombia (FARC)
heightens risk that demobilized guerrillas will abandoning the peace and target both urban and rural
areas. Of course, President Ivan Duque – partly because of dissatisfaction with how he has managed
the fragile peace – remains unpopular. So the COP will be prone to periodic volatility over protests
and demonstration sin late 2019 and 2020. But because Colombia is no stranger to internal
conflicts, the authorities should be able to deal with social unrest much faster than their
counterparts in Chile.
Mexico: Some Risks Mount as Year-End Approaches
As an Economy, Mexico Disappoints. Our beef with Mexico was that in the absence of market-
friendly reforms that liberalized the economy’s various sclerotic sectors, especially the oil sector, it
would be difficult to generate growth. And yes, industry has been still sluggish in Q3, with output flat
in September. And we are acutely aware that Q4 could be worse for Mexican industry since GM’s
strike contributed to a 16% plunge in auto production (year-over-year) in October, including a 30%
drop at GM’s local factories. Looking ahead, with the prospect of some softening of the
consumer in the US, with “peak car”, and with the USMCA to place competitive disadvantages
on Mexico, the outlook for the auto sector - and hence IP - is not good. After all, industry and
the auto sector are closely linked in Mexico, given the county’s integration with the North
American supply chain. And with growth compromised, concern that revenue generation at the
federal level will be impaired will be a lingering concern, especially as oil-related revenues, too,
continue to suffer.
In this context, there’s really been only one solution to Mexico’s “slow-growth trap” – a
supply-side solution that allows for free-market price determination, and liberal entry and
participation of the private-sector into the heretofore state-controlled sectors – starting with
energy, and extending to energy distribution, electricity, etc. Indeed, allowing private-sector
participation would attract foreign participation, allowing Mexico to finance its external deficit with
more FDI, rather than relying on the money markets. It would also absolve Mexico’s federal
government of the need to ‘bail out” key parastatal companies – first on the list being Pemex, which
will require a government assistance plan in 2020. If this ‘road not taken’ were taken, the MXN
would have appreciated, allowing Banxico to ease policy earlier, and still have the benefit of
lower inflation.
But rather than that, the policies of President Andres Manuel Lopez Obrador have had a deleterious
effect on growth. The attempt to curtail government spending in the face of falling revenue, for
example, has resulted in cuts in the government’s administrative functions and personnel. This
hollowing out of government has potentially amplified the already pro-cyclical effects of public-sector
compensation cuts. So although traders and investors could applaud AMLO for maintaining a
narrow budget deficit in the face of lower revenue growth, the way fiscal savings has been
generated has been counter-productive. Moreover, the threat of higher taxes to fill prospective
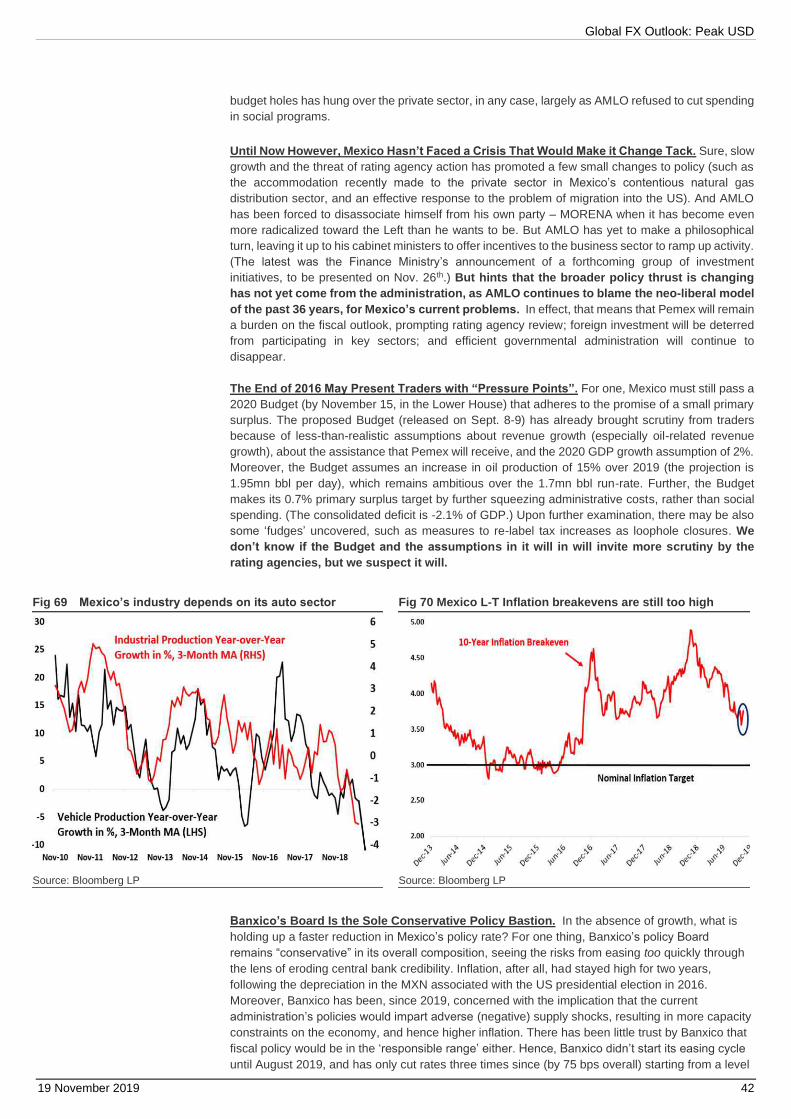
Global FX Outlook: Peak USD
19 November 2019 42
budget holes has hung over the private sector, in any case, largely as AMLO refused to cut spending
in social programs.
Until Now However, Mexico Hasn’t Faced a Crisis That Would Make it Change Tack. Sure, slow
growth and the threat of rating agency action has promoted a few small changes to policy (such as
the accommodation recently made to the private sector in Mexico’s contentious natural gas
distribution sector, and an effective response to the problem of migration into the US). And AMLO
has been forced to disassociate himself from his own party – MORENA when it has become even
more radicalized toward the Left than he wants to be. But AMLO has yet to make a philosophical
turn, leaving it up to his cabinet ministers to offer incentives to the business sector to ramp up activity.
(The latest was the Finance Ministry’s announcement of a forthcoming group of investment
initiatives, to be presented on Nov. 26th.) But hints that the broader policy thrust is changing
has not yet come from the administration, as AMLO continues to blame the neo-liberal model
of the past 36 years, for Mexico’s current problems. In effect, that means that Pemex will remain
a burden on the fiscal outlook, prompting rating agency review; foreign investment will be deterred
from participating in key sectors; and efficient governmental administration will continue to
disappear.
The End of 2016 May Present Traders with “Pressure Points”. For one, Mexico must still pass a
2020 Budget (by November 15, in the Lower House) that adheres to the promise of a small primary
surplus. The proposed Budget (released on Sept. 8-9) has already brought scrutiny from traders
because of less-than-realistic assumptions about revenue growth (especially oil-related revenue
growth), about the assistance that Pemex will receive, and the 2020 GDP growth assumption of 2%.
Moreover, the Budget assumes an increase in oil production of 15% over 2019 (the projection is
1.95mn bbl per day), which remains ambitious over the 1.7mn bbl run-rate. Further, the Budget
makes its 0.7% primary surplus target by further squeezing administrative costs, rather than social
spending. (The consolidated deficit is -2.1% of GDP.) Upon further examination, there may be also
some ‘fudges’ uncovered, such as measures to re-label tax increases as loophole closures. We
don’t know if the Budget and the assumptions in it will in will invite more scrutiny by the
rating agencies, but we suspect it will.
Fig 69 Mexico’s industry depends on its auto sector Fig 70 Mexico L-T Inflation breakevens are still too high
Source: Bloomberg LP Source: Bloomberg LP
Banxico’s Board Is the Sole Conservative Policy Bastion. In the absence of growth, what is
holding up a faster reduction in Mexico’s policy rate? For one thing, Banxico’s policy Board
remains “conservative” in its overall composition, seeing the risks from easing too quickly through
the lens of eroding central bank credibility. Inflation, after all, had stayed high for two years,
following the depreciation in the MXN associated with the US presidential election in 2016.
Moreover, Banxico has been, since 2019, concerned with the implication that the current
administration’s policies would impart adverse (negative) supply shocks, resulting in more capacity
constraints on the economy, and hence higher inflation. There has been little trust by Banxico that
fiscal policy would be in the ‘responsible range’ either. Hence, Banxico didn’t start its easing cycle
until August 2019, and has only cut rates three times since (by 75 bps overall) starting from a level

Global FX Outlook: Peak USD
19 November 2019 43
(8.25%) that was quite high in both nominal and real terms when compared to other EMs. To be
sure, Banxico’s Statement in November alluded to the risk that core inflation was not declining
quickly enough, but also to the supply-side problems: (1) of a lack of “certainty” for the investment
decisions, (2) of wage growth that exceeds productivity growth, and (3) of achieving fiscal targets.
Largely because of the persistence of these problems, it did not cut the policy rate faster – i.e., by
50bps.
Also, what isn’t working in favor of easing are inflation expectations. Yes, breakevens have
retreated in recent months, as have survey-based inflation projections, but both long-term and
short-term inflation projections remain well above the 3% target of the central bank.
…While Social Issues Pose Risks to the MXN Too. Mexico has not been immune to social
unrest in the past few weeks, and the stability associated with AMLO’s first year seems to
be at risk because of the recent events that have brought violence to the limelight again.
AMLO said that he “laments” cases such as the recent assassination of US citizens, but also that
his gov’t will “continue to act in the same manner” – i.e., not change its public-safety strategy.
AMLO seemed fairly certain that those policies were “doing very well” and that the country will
gradually “overcome all that which was inherited from failed policy” – including violence. AMLO’s
remarks may refer to his policies having disbanded drug cartels, but the violence is now being
conducted increasingly by scattered gangs, many of which rely on threatening or extorting locals
rather than working in drug trafficking. So foreign direct investors may not be so forgiving, nor
will tourists.
We’ll note that foreign direct investment has already deteriorated since AMLO became
president, and we believe that it is set to deteriorate further in view of an apparent
unwillingness to address violence more directly. Indeed, we think that some of the MXN’s
recent weakness is linked to the negative headlines.
MXN Won’t Fare Well, and Banxico Will Forced Into Conservative Path for Rates. The
Bottom Line is that a combination of supply-side constraints in Mexico, combined with still-
high inflation and a Fed that is no longer in easing mode will keep Banxico among the central
banks that are not succumbing to pressure to ease aggressively. Beyond 2019, we see the rate
easing cycle extending, but slowly. Uncertainty regarding AMLO’s agenda will also persist,
especially under the lasting threat that the MORENA party’s radicals will gain more legislative
power. And finally, while passage of USMCA is good (vs. not passing it), the demands that the
Democrats will make on Mexico’s environmental and labor standards will also erode productivity.
That augurs a still-weak MXN and an inflationary impulse. And it also means that after
reaching 19.50 at year-end, we foresee USD/MXN rising further, to 20.75 by year-end 2020,
making the prospect of taking the risk of earning the carry less compelling.

Global FX Outlook: Peak USD
19 November 2019 44
Detailed FX Forecasts Table
Fig 71 FX forecasts (end of period, forecasts shaded)
Quarterly Annual
19Q2 19Q3 19Q4 20Q1 20Q2 20Q3 20Q4 21Q1 21Q2 21Q3 2018 2019 2020 2021 LR
G10
EUR USD 1.14 1.09 1.09 1.11 1.13 1.13 1.15 1.16 1.16 1.17 1.14 1.09 1.15 1.17 1.20
USD JPY 107.7 108.1 109.0 109.0 107.0 105.0 102.0 100.0 100.0 100.0 109.8 109.0 102.0 100.0 95.0
GBP USD 1.27 1.23 1.30 1.30 1.30 1.32 1.35 1.35 1.35 1.35 1.27 1.30 1.35 1.35 1.40
AUD USD 0.70 0.67 0.69 0.70 0.71 0.71 0.70 0.70 0.70 0.70 0.70 0.69 0.70 0.70 0.75
USD CAD 1.31 1.32 1.34 1.35 1.36 1.37 1.38 1.38 1.39 1.39 1.37 1.34 1.38 1.40 1.40
NZD USD 0.67 0.63 0.64 0.65 0.65 0.65 0.64 0.64 0.64 0.64 0.67 0.64 0.64 0.64 0.70
Asia
USD CNY 6.87 7.14 6.95 6.85 6.80 6.80 6.80 6.80 6.80 6.80 6.88 6.95 6.80 6.80 6.60
USD INR 69.0 70.6 71.5 71.2 71.0 70.5 70.0 69.5 69.0 69.5 69.7 71.5 70.0 70.0 74.0
USD IDR 14125 14182 14150 14050 14000 14000 14000 14000 13950 14000 14429 14150 14000 14000 14500
USD KRW 1157 1199 1160 1130 1110 1100 1100 1100 1100 1100 1114 1160 1100 1100 1070
USD MYR 4.14 4.19 4.18 4.20 4.25 4.20 4.10 4.05 4.05 4.05 4.14 4.18 4.10 4.05 3.95
USD SGD 1.353 1.383 1.360 1.350 1.340 1.330 1.320 1.315 1.310 1.305 1.363 1.360 1.320 1.305 1.260
USD TWD 31.0 31.1 30.3 29.8 29.0 29.0 29.0 28.8 28.8 28.8 30.6 30.3 29.0 28.8 29.0
USD PHP 51.2 51.8 50.8 50.0 49.5 49.5 49.5 49.5 50.0 50.0 52.6 50.8 49.5 50.0 54.0
USD THB 30.7 30.6 30.4 30.0 30.5 31.0 31.0 31.0 31.0 31.0 32.3 30.4 31.0 31.0 30.0
Latin America
USD ARS 42.4 57.6 63.0 69.0 71.0 73.0 75.0 80.0 80.0 80.0 37.7 63.0 75.0 80.0 80.0
USD BRL 3.83 4.17 4.25 4.30 4.30 4.25 4.25 4.30 4.30 4.30 3.88 4.25 4.25 4.35 4.50
USD CLP 679 728 790 810 820 830 840 850 850 850 694 790 840 850 800
USD COP 3207 3478 3400 3400 3450 3500 3600 3600 3600 3600 3248 3400 3600 3600 3600
USD MXN 19.2 19.7 19.5 20.0 20.3 20.5 20.8 20.8 20.8 21.0 19.7 19.5 20.8 21.0 21.5
EMEA
USD ZAR 14.1 15.3 14.8 14.2 13.7 13.2 13.2 13.2 13.2 13.2 14.4 14.8 12.8 12.4 15.0
USD TRY 5.79 5.65 5.70 5.50 5.30 5.20 5.20 5.10 5.00 5.40 5.31 5.70 5.20 5.50 7.28
USD RUB 63.1 67.0 63.0 60.0 57.0 55.0 54.0 54.0 54.0 54.0 69.4 63.0 54.0 55.0 72.0
Source: Bloomberg, Macquarie Strategy

Global FX Outlook: Peak USD
19 November 2019 45
Important information:
This publication represents the views of the Sales and Trading Global Macro Strategy Department and/or Sales and Trading Desk strategists (collectively referred to as “Global Macro”) of Macquarie. It is not a product of Macquarie Research and the view of Global Macro may differ from the views of Macquarie Research and other divisions at Macquarie. Macquarie has policies in place to promote the independence of Macquarie Research and to manage conflicts of interest, including policies relating to dealing ahead of the dissemination of Macquarie Research. These policies do not apply to the views of Global Macro contained in this report. Global Macro Disclosure The name “Macquarie” refers to Macquarie Group Limited and its worldwide affiliates and subsidiaries (the Macquarie Group). This information is provided on a confidential basis and may not be reproduced, distributed or transmitted in whole or in part without the prior written consent of Macquarie. This publication has been prepared by Macquarie Sales and Trading personnel and is not a product of the Macquarie Research Department. Any views or opinions expressed are the views of the author and the Macquarie Sales and/or Trading desk from which it originates (‘the Authors’) and those views may differ from those of the Macquarie Research Department. Prior to distribution of this publication, information contained herein may be shared with Macquarie Trading desks who are not subject to prohibitions on trading prior to the dissemination of this publication. The views are not independent or objective of the interests of the Authors and other Macquarie Sales and/or Trading desks that trade as principal in the financial instruments mentioned within and who may be compensated in part based on trading activity. The views do not include and are not intended as trading ideas or recommendations specifically tailored for the needs of any particular investor. This communication is provided for information purposes only, is subject to change without notice and is not binding. Any prices or quotations in the information provided are indicative only, are subject to change without notice and may not be used or relied on for any purpose, including valuation purposes. This communication is not a solicitation to buy or sell any product, or to engage in, or refrain from engaging in, any transaction, except to the extent covered by the CFTC Rules (see Important Derivatives Disclosure). Nor does it constitute investment research, a research report or a personal or other recommendation. Nothing in the information provided should be construed as legal, financial, accounting, tax or other advice. Important Derivatives Disclosure: This material constitutes a solicitation for entering into a derivatives transaction only for the purposes of, and to the extent it would otherwise be subject to, U.S Commodity Futures Trading Commission Regulations §§ 1.71 and 23.605 promulgated under the U.S. Commodity Exchange Act (the “CFTC Rules”). Futures options and derivatives products are not suitable for all investors and trading in these instruments involves substantial risk of loss. Macquarie is a global provider of banking, financial advisory, investment and funds management services. As such, Macquarie may act in various roles including as provider of corporate finance, underwriter or dealer, holder of principal positions, broker, lender or adviser and may receive fees, brokerage or commissions for acting in those capacities. In addition, Macquarie and associated personnel may at any time buy, sell or hold interests in financial instruments referred to in this information either on behalf of clients or as principal. Therefore, this information should not be relied upon as either independent or objective from the interests of Macquarie and associated personnel which may conflict with your interests. To the extent permitted by law, Macquarie accepts no responsibility or liability (in negligence or otherwise) for loss or damage resulting from the use of or relating to any error in the information provided. This information has been prepared in good faith and is based on information obtained from sources believed to be reliable, however, Macquarie is not responsible for information stated to be obtained from third party sources. Any modelling, scenario analysis, past or simulated past performance (including back-testing) contained in this information is no indication as to future performance. Canada: This report has been prepared by an Economist/Desk Strategy analyst in the Institutional Sales Group based upon general comments by research analysts or other sources we believe to be reputable. This report should not be construed to be a research report, nor is this article investment advice and should not be relied on as such. The author of this report is NOT a Macquarie research analyst, salesperson or investment advisor. The views expressed herein are those of the author alone and are not necessarily those of Macquarie. Please refer to this link to our research reports for the most current research on any of the names discussed herein. Those Research Reports contain important disclosures regarding our research ratings and Capital Advisory relationships. The financial products and/or services referred to in this information may not be eligible for sale in all jurisdictions. This information is directed at institutional clients who have professional experience as defined by applicable law and/or regulation in the relevant jurisdiction. It is not for retail clients and it is not for distribution into any jurisdiction where this information is not permitted. For important country-specific disclosures regarding information from Macquarie Sales and Trading, please click on the region relevant to you at: www.macquarie.com/salesandtradingdisclaimer. © Macquarie Group
This publication was disseminated on 19 November 2019 at 06:41 UTC.