Embed Size (px)
Citation preview

Global Fish Production Data & Analysis
n PRESENTER DR. RAGNAR TVETERAS | UNIVERSITY OF STAVANGER
GLOBAL OUTLOOK FOR AQUACULTURE LEADERSHIP
GUANGZHOU, CHINA | DAY 1
HEALTHY FISH | HEALTHY PEOPLE | HEALTHY PLANET

Dr. Ragnar Tveteras • Professor Ragnar Tveteras is a business economist at the
University of Stavanger’s Department for Industrial Economics, Risk Management and Planning in Norway.
• His research focuses primarily on aquaculture and seafood markets.
• As a writer and lecturer, he maintains relationships with authorities and private decision makers at the regional, national and international levels.
• Tveteras received the 2006 Scana research prize for his many publications and ability to communicate research findings beyond a narrow academic circle.

Global Fish Production Estimates & Trends
RagnarTveteras–UniversityofStavangerRagnarNystoyl–KontaliDarrylJory–GlobalAquacultureAlliance

Acknowledgements
• Prices:NMFS,NorwegianSeafoodCouncil,Kontali,Eurostat,FAO.
• Produc4onvolumes:FAO,Kontali,andmanyindividualsandorganizaIonswhokindlyrespondedtotheGAAsurvey,sharingtheirImeandknowledge.

Scope of Analysis
• Most focus on internationally traded species: • Typically imported to USA, Europe & Japan.
• Production forecasts for 2015 and 2016 for all chosen species: • But for some species only major producer countries/regions.
• Production forecast for 2017 for some species.

FinfishSpeciesIncludedinAnalysis
Freshwater species: • Tilapia • Catfish
• Pangasius • Channel catfish, etc.
• Carps
Diadromous species: • Salmon & Trout
• Atlantic salmon • Coho salmon • Trout • Barramundi • Milkfish
Marine species: • Seabass & Sea Bream • Flatfishes
• Olive Flounder • Atlantic Halibut • Turbot
• Cobia • Atlantic cod • Bluefin tuna • Groupers

FreshwaterSpecies

TILAPIA

GlobalTilapiaAquacultureProduc4onUSimportpricesfrozenfillet
379
398
485
548
593
704
811
898
897
1037
11
90
1302
14
17
1,58
7 1,
795
1,99
2 2,
265
2,55
4 2,
826
3,10
9 3,
541
3,99
7 4,
564
4,88
6 5,
308
5,33
9 5,
550
5,79
8 5,
977
0
1
2
3
4
5
6
7
8
0
1000
2000
3000
4000
5000
6000
7000 19
90
1991
19
92
1993
19
94
1995
19
96
1997
19
98
1999
20
00
2001
20
02
2003
20
04
2005
20
06
2007
20
08
2009
20
10
2011
20
12
2013
20
14
2015
20
16
2017
20
18
REAL PRICE (USD/KG)
1000 METRIC TONNES
Sources:FAO:1990-2014.Miscellaneoussources:2015-2018.NMFS:PricesUSimportfrozenfillet.Note:Pricesareannualaverages,exceptfor2015(January-Julyaverage)

TilapiaCountriesproduc4onsortedby2015figures
AverageofesImatesfromseveralsources.
1,709,8521,046,667
665,300337,500303,520292,106288,760
144,68887,14370,71465,00062,80062,50058,950
0 500,000 1,000,000 1,500,000 2,000,000
ChinaIndonesia
EgyptThailand
BangladeshBrazil
PhilippinesVietnamMexicoTaiwanUganda
ColombiaIndia
Malaysia
2018
2017
2016
2015

Tilapiaproduc4ones4matesforChina
1,665
1,710
1,724
1,776
1,712
1,000 1,200 1,400 1,600 1,800 2,000 2,200
2014
2015
2016
2017
2018
Average Sergio Zimmermann Anonymous3 CAPPMA Kevin Fitzsimmons Anonymous2 Anonymous1 Liu Liping
X1000MT

PANGASIUS
CATFISHES

PangasiusProduc4oninselectedcountries
1,169,000 1,115,200 1,188,680 1,251,680 1,334,680
475,000 430,000 447,500 462,500640,000
383,846 403,409 422,182 435,666
454,312100,000 100,000
100,000 105,000
110,000
0
500,000
1,000,000
1,500,000
2,000,000
2,500,000
3,000,000
2014 2015 2016 2017 2018
Metric
Ton
nes Malaysia
Indonesia
Bangladesh
India
Vietnam
13 Sources:VASEPandmiscellaneousSources:N.Ahmed,S.Islam,P.E.VijayAnand,HồvănChiến,andseveralanonymous.

Pangasiusproduc4ones4matesforVietnam
1,169,000
1,115,200
1,188,680
1,251,680
1,334,680
0 200,000 400,000 600,000 800,000 1,000,000 1,200,000 1,400,000 1,600,000 1,800,000
2014
2015
2016
2017
2018
Average Anonymous4 Anonymous3 HồvănChiến Anonymous2 Anonymous1

40
60
87
100
114
135
163
255 37
6 520
850
1250
1050
1140
1151
1184
1148
1134
1115
1189
1252
1335
0
1
2
3
4
5
6
0
200
400
600
800
1000
1200
1400
1600
Rea
l pric
e U
S (b
lue)
and
EU
(red
) (U
SD/k
g)
1000
Met
ric to
nnes
Sources:FAO(1997-2014),HồvănChiếnandmiscellaneoussources(2015-2018).Prices:NorwegianSeafoodCouncil,EurostatandNMFS.
PangasiusProduc4oninVietnamandUS(blue)&EU(red)realimport
pricesfrozenfillet(USD/kg)
Totalproduc4onofCadishspeciesIncl.Pangasius
0
1,000,000
2,000,000
3,000,000
4,000,000
5,000,000
6,000,000
2003
2004
2005
2006
2007
2008
2009
2010
2011
2012
2013
2014
2015
2016
2017
2018
Prod
uc4o
ninm
etric
tonn
es
OthersBrazilEgyptCambodiaMyanmarUgandaBangladeshThailandMalaysiaNigeriaIndonesiaUSAIndia*ChinaVietnam
Sources:FAO,Kontaliandmiscellaneous.

Totalproduc4onofCadishspecies
886,900
1,059,902
1,302,521
1,578,010
2,077,969
2,676,220
2,834,305
3,056,400
3,154,589
3,658,713
3,883,296
4,155,103
4,228,000
4,370,000
4676000
4885000
0
1,000,000
2,000,000
3,000,000
4,000,000
5,000,000
6,000,000Prod
uc4o
ninm
etric
tonn
es
Produc4on
Sources:FAOandmiscellaneous.Prices:NMFS.

CarpsinChinaProduc4onbymajorspecies
Sources:2000-2014:FAO;2013-2017:Miscellaneous
0
5,000,000
10,000,000
15,000,000
20,000,000
25,000,000
1991
1992
1993
1994
1995
1996
1997
1998
1999
2000
2001
2002
2003
2004
2005
2006
2007
2008
2009
2010
2011
2012
2013
2014
2015
2016
2017
2018
Prod
uc4o
ninM
etric
Ton
nes
Silvercarp
Grasscarp
Cruciancarp
Commoncarp
Bigheadcarp

MajorCarpspeciesinGAAsurvey
Sources:2000-2012:FAO;2013-2017:Miscellaneous
0
5,000,000
10,000,000
15,000,000
20,000,000
25,000,000
30,000,000
35,000,000
2014
2015
2016
2017
2018
Prod
uc4o
ninM
etric
Ton
nes
Philippines,Carp
Brazil,Carp
India,Commoncarp
Bangladesh,Silvercarp
Egypt,Carp
Indonesia,Carp
Bangladesh,Carp
China,Cruciancarp
China,Commoncarp
China,Bigheadcarp
China,Silvercarp
India,Indiancarps
China,Grasscarp

DiadromousSpecies

SALMONIDS

Atlan4cSalmonProduc4onRealEU27importpricefreshwholegufedandrealUSimportpricefreshfillet
646,
516
68
8,17
6
803,
837
89
3,70
4
1,03
2,71
2
1,08
0,89
7
1,13
2,99
4
1,24
4,63
7
1,25
0,70
0
1,27
0,90
0
1,39
8,00
0
1,49
6,00
0
1,47
4,80
0
1,45
5,20
0
1,63
3,40
0
1,99
8,90
0
2,04
1,40
0
2,22
7,60
0
2,31
4,60
0
2,16
8,00
0
2,26
9,50
0
0
2
4
6
8
10
12
14
0
500000
1000000
1500000
2000000
2500000 19
90
1991
19
92
1993
19
94
1995
19
96
1997
19
98
1999
20
00
2001
20
02
2003
20
04
2005
20
06
2007
20
08
2009
20
10
2011
20
12
2013
20
14
2015
20
16
2017
Real prices EU27 import (red) and US
import (blue) in USD/kg
Production in metric tonnes
Sources:FAO,Kontali,NSC/Eurostat(prices).Note:PricesunIl2013areannualaverages.Pricein2015isJanuary-Augustaverage.

Atlan4cSalmonProduc4onbycountry
0
200000
400000
600000
800000
1000000
1200000
1400000
20052006200720082009201020112012201320142015201620172018
Prod
uc4o
ninM
etric
Ton
nes Norway
Chile
UK
Canada
FaroeIslands
Australia
Ireland
USA
Others
Source:Kontali

CohoSalmonTotalProduc4onandRealExportPriceforChileanCohoFrozen,Headoff
39,1
64
44,3
85
48,5
13
49,1
54
58,7
00
58,3
60
76,1
97
84,8
67
88,3
02
89,4
75
108,
626
150,
986
112,
745
105,
869
100,
967
121,
200
119,
500
138,
600
138,
000
108,
400
125,
200
144,
200 17
0,90
0 18
0300
13
4100
1621
00
1468
00
1353
00
1296
00
0
1
2
3
4
5
6
7
8
0
20,000
40,000
60,000
80,000
100,000
120,000
140,000
160,000
180,000
200,000
1990
19
91
1992
19
93
1994
19
95
1996
19
97
1998
19
99
2000
20
01
2002
20
03
2004
20
05
2006
20
07
2008
20
09
2010
20
11
2012
20
13
2014
20
15
2016
20
17
2018
Pric
e in
Rea
l US
D p
er K
ilo
Pro
duct
ion
in M
etric
Ton
nes Production
Real price
Sources:FAO,Kontali.

CohoSalmonProduc4onbycountry
0
20000
40000
60000
80000
100000
120000
140000
160000
180000Prod
uc4o
ninM
etric
Ton
nes
Chile
Japan
Others
Source:Kontali

LargeRainbowTroutTotalMarineProduc4on,realChileanfrozenexportprice(blue)and
realEUfreshimportpriceEUR/kg(red)
Sources:FAO,Kontaliandmiscellaneous,NSC.Note:Pricesareannualaveragesexcept2015(January-Augustaverage).
33,5
67
34,3
21
47,5
12
57,1
75
69,7
48
80,5
93
103,
090
125,
730
145,
128
121,
862
153,
303
206,
508
222,
433
205,
550
214,
869
237,
900
254,
100
307,
100
332,
300
301,
300
310,
000
3243
00
3700
00
3019
00
2851
00
2563
00
2406
00
2405
00
2625
00
0
1
2
3
4
5
6
7
8
0
50,000
100,000
150,000
200,000
250,000
300,000
350,000
400,000
Rea
l e p
rice
(USD
/kg)
Met
ric to
nnes

LargeRainbowTroutProduc4onbycountry
0
50000
100000
150000
200000
250000
2005
2006
2007
2008
2009
2010
2011
2012
2013
2014
2015
2016
2017
2018
Prod
uc4o
ninM
etric
Ton
nes
Chile
Norway
Finland
Russia
FaroeIsland
Australia
Others
Source:Kontali

SmallRainbowTroutGlobalProduc4onandEU27realimportpricefrozenwholetrout<1.2kg
Sources:FAO,Kontali,NSC.Note:Pricesareannualaveragesexcept2015(January-Augustaverage).
348,
500
369,
300
387,
800
401,
900
427,
400
453,
200
496,
100
534,
700
576,
200
565,
300
603,
900
620,
500
639,
000
0
0.5
1
1.5
2
2.5
3
3.5
4
4.5
5
0
100,000
200,000
300,000
400,000
500,000
600,000
700,000
Rea
l im
port
pric
e in
USD
/kg
Met
ric to
nnes

SmallRainbowTroutProduc4onbyCountry
0
100000
200000
300000
400000
500000
600000
700000
2005200620072008200920102011201220132014201520162017
Prod
uc4o
ninM
etric
Ton
nes Others
France
Denmark
Peru
China
USA
Italy
Turkey
Iran
Sources:FAO(1999-2012);Kontaliandmiscellaneous(2013-2016).

AsianSeabass,Barramundi

BarramundiTotalproduc4onbymajorproducingcountries
0
10,000
20,000
30,000
40,000
50,000
60,000
70,000
80,000
90,000
100,000
1991
19
92
1993
19
94
1995
19
96
1997
19
98
1999
20
00
2001
20
02
2003
20
04
2005
20
06
2007
20
08
2009
20
10
2011
20
12
2013
20
14
2015
20
16
2017
20
18
Met
ric T
onne
s
Australia Indonesia Thailand
Malaysia Taiwan
Source:FAO

BarramundiProduc4onforecastsforselectedcountries
Sources:FAO(2002-2012)andmiscellaneous(2013-2017)
0
5,000
10,000
15,000
20,000
25,000
30,000
35,000
40,000
2005 2006 2007 2008 2009 2010 2011 2012 2013 2014 2015 2016 2017 2018
Prod
uc4o
ninM
etric
Ton
nes
Taiwan
Malaysia
Thailand
Indonesia
Australia

MarineSpecies

Seabass&SeaBreamMediterraneanProduc4on
4595
7
5781
1
5616
2
6109
3
6206
0
6867
9
8270
6
113,
200
123,
500
120,
700
124,
700
127,
700
129,
700
142,
800
146,
500
151,
400
150,
900
146,
700
160,
100
5883
1
7323
2
7700
3
7976
7
8834
0
8892
2
9926
5 141,
500
160,
700
169,
200
170,
300
166,
200
161,
100
177,
400
173,
300
175,
500
158,
200
154,
700
169,
900
0
50000
100000
150000
200000
250000
300000
350000
Production in metric tonnes
Sea Breams Sea Basses
Source:Kontali

Seabass&SeaBreamMediterraneanProduc4on&RealItalianImportPrice
104,
788
131,
043
133,
165
140,
860
150,
400
157,
601
181,
971
254,
700
284,
200
289,
900
295,
000
293,
900
290,
800
320,
200
319,
800
326,
900
309,
100
301,
400
330,
000
0 1 2 3 4 5 6 7 8 9 10
0
50,000
100,000
150,000
200,000
250,000
300,000
350,000
1999
2000
2001
2002
2003
2004
2005
2006
2007
2008
2009
2010
2011
2012
2013
2014
2015
2016
2017
Real Price (USD per kilo)
Production (metric tonnes)
Production Sea Basses and Breams Real price fresh whole seabass Real price fresh Gilthead seabream
Source:Kontali,NSC/Eurostat

COBIA
SNAPPERFARMS

FarmedCobiaEs4matesforChina,Taiwan,PanamaandVietnam
0
10,000
20,000
30,000
40,000
50,000
60,000 20
03
2004
2005
2006
2007
2008
2009
2010
2011
2012
2013
2014
2015
2016
2017
2018
Metric Tonnes
Vietnam
Panama
Taiwan
China
Source:Varioussources

0
5,000
10,000
15,000
20,000
25,000
30,000
35,000
40,000
45,000 20
03
2004
2005
2006
2007
2008
2009
2010
2011
2012
2013
2014
2015
2016
2017
2018
Metric Tonnes
China
Taiwan
Panama
Vietnam
Source:Varioussources
FarmedCobiaEs4matesforChina,Taiwan,PanamaandVietnam

BluefinTuna

BluefinTunaTotalProduc4onandUSrealimportpricefresh
2380
0 3070
0
2970
0
3430
0 4380
0
3450
0
3350
0
2910
0
2900
0
2650
0
3030
0
3105
0
4256
3
4518
1
4990
0
5370
0
0
5
10
15
20
25
30
35
0
10000
20000
30000
40000
50000
60000
Rea
l pric
e (U
SD/k
g)
Met
ric to
nnes
Production US import price fresh
Sources:ProducIon-ApostolosTzoumas;importprice-NMFS.Note:Pricesareannualaverages,exceptpricein2015isJanuary-Augustaverage.
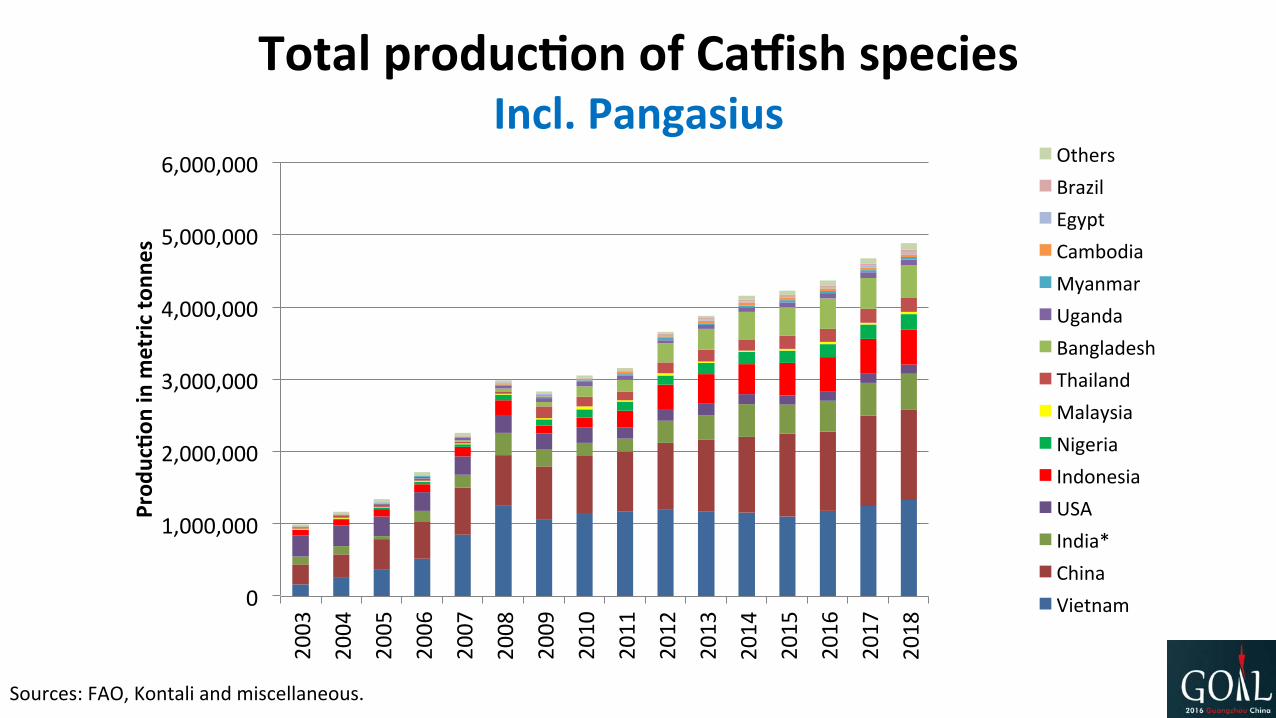
Grouperproduc4onincountriessurveyedbyGAA
0
20000
40000
60000
80000
100000
120000
2003200420052006200720082009201020112012201320142015201620172018
Prod
uc4o
ninM
etric
Ton
nes
China
Taiwan
Indonesia
Malaysia
Vietnam
Philippines
Sources:FAO(1999-2012);miscellaneous(2013-2017).

Grouperproduc4onincountriessurveyedbyGAA
0
20000
40000
60000
80000
100000
120000
140000
160000
180000
2003200420052006200720082009201020112012201320142015201620172018
Prod
uc4o
ninM
etric
Ton
nes
Philippines
Vietnam
Malaysia
Indonesia
Taiwan
China
Sources:FAO(1999-2012);miscellaneous(2013-2017).Note:DatanotavailableforChina2016-18.AssumeproducIonof100,000MTtheseyears.

SummaryFinfish

AquacultureProduc4onofFishSpeciesand10-yeargrowthrate1990-2014
8.7
9.0 9.9
11.2
13.1
15.0
16.9
17.9
18.5
19.9
20.8
22.2
23.5
24.2
26.3
28.0
29.8
31.6
34.3
36.1
38.5
40.7
44.5
47.3
49.8618915
0
50
100
150
200
250
0.0
10.0
20.0
30.0
40.0
50.0
60.0
1990
1991
1992
1993
1994
1995
1996
1997
1998
1999
2000
2001
2002
2003
2004
2005
2006
2007
2008
2009
2010
2011
2012
2013
2014
%te
nyeargrowthra
te
Prod
uc4o
ninM
ill.m
etric
tonn
es ProducIon %growth
Source:FAO
Doubleinadecade

AquacultureProduc4onofFishSpeciesandSeafoodPriceIndices1990-2013
60
70
80
90
100
110
120
130
140
150
160
0
5
10
15
20
25
30
35
40
45
50
1990
1991
1992
1993
1994
1995
1996
1997
1998
1999
2000
2001
2002
2003
2004
2005
2006
2007
2008
2009
2010
2011
2012
2013
Seafoo
dpriceinde
x
(200
2-20
04=100
)
Prod
uc4o
ninM
ill.m
etric
tonn
es ProducIon
Totalpriceindex
Aquaculturepriceindex
Source:FAO

DiadromousSpeciesAnnualPercentGrowthRates
9
-26
-6-2 -1
-7
4
21
-10
7 6
21
-6-9
-6
3 255
-8
0
3 4 5
-30.0
-20.0
-10.0
0.0
10.0
20.0
30.0
AtlanIcsalmon
Cohosalmon LargeRainbowtrout
Smalltrout Milkfish,selectedcountries
Barramundi
2014
2015
2016
2017

FreshwaterSpeciesAnnualPercentGrowthRates
-3
9
10
-1
7
1
4
-2
6
4
2
7
4.6 4.5
7.4
5
-4.0
-2.0
0.0
2.0
4.0
6.0
8.0
10.0
12.0
Carp,selectedcountries
Tilapia Cajishes,selectedcountries
Pangasius,Vietnam
2014
2015
2016
2017

MarineSpeciesAnnualPercentGrowthRates
2 5
37
-10
8
-5
-61
-5
7 6 4
2213
50
-2
110 6
-6
26
52
92
8 4 011
20
-80.0
-60.0
-40.0
-20.0
0.0
20.0
40.0
60.0
Seabass&bream,Medit.
Grouper,selectedcountries
Bluefintuna Cobia,selectedcountries
Turbot,excl.China
AtlanIchalibut
AtlanIccod
2014
2015
2016
2017

Produc4onofSurveyedSpeciesIncl.Carp,2003-2017
19.2 20.5 21.823.1 25.5
27.4 29.031.4 32.3
35.4 38.5 38.640.6 42.3 44.3
0
5
10
15
20
25
30
35
40
45
50
2003
2004
2005
2006
2007
2008
2009
2010
2011
2012
2013
2014
2015
2016
2017
Prod
uc4o
ninM
ill.m
etric
tonn
es

Produc4onofSurveyedSpeciesIncl.Carp,2003-2017
7.26.2 5.9
10.3
7.6
6.0
8.0
3.1
9.58.8
0.3
5.04.2
4.7
0.0
2.0
4.0
6.0
8.0
10.0
12.0
0
5
10
15
20
25
30
35
40
45
50
2003
2004
2005
2006
2007
2008
2009
2010
2011
2012
2013
2014
2015
2016
2017
%growth
Prod
uc4o
ninM
ill.m
etric
tonn
es ProducIon %growth

Produc4onofSurveyedSpeciesExcl.Carp,2003-2017
5.1 5.6 6.2 6.9 8.0 9.0 9.5 10.3 11.212.8 13.5
14.3 14.7 14.915.6
0
2
4
6
8
10
12
14
16
18
2003
2004
2005
2006
2007
2008
2009
2010
2011
2012
2013
2014
2015
2016
2017
Prod
uc4o
ninM
ill.m
etric
tonn
es

Produc4onofSurveyedSpeciesExcl.Carp,2003-2017
10.59.8
11.2
16.4
12.9
4.8
8.5 8.6
15.0
5.36.0
2.41.4
5.0
0.0
2.0
4.0
6.0
8.0
10.0
12.0
14.0
16.0
18.0
0.0
2.0
4.0
6.0
8.0
10.0
12.0
14.0
16.0
18.0
2003 2004 2005 2006 2007 2008 2009 2010 2011 2012 2013 2014 2015 2016 2017
%growth
Prod
uc4o
ninM
ill.m
etric
tonn
es
ProducIon %growth

Produc4onofSurveyedSpeciesByspeciesgroup2003-2017
16.5 17.8 18.9 20.1 22.1 23.9 25.5 27.7 28.3 30.8 33.8 33.8 35.5 37.3 39.12.4 2.5 2.6 2.62.9
3.1 3.13.2 3.6
4.14.2 4.3 4.5 4.4
4.5
0.3 0.3 0.3 0.40.4
0.5 0.50.5 0.5
0.50.5 0.6
0.6 0.60.6
0
20
40
60
80
100
120
140
160
180
0.0
5.0
10.0
15.0
20.0
25.0
30.0
35.0
40.0
45.0
50.0
2003 2004 2005 2006 2007 2008 2009 2010 2011 2012 2013 2014 2015 2016 2017
Aqua
cultu
repric
einde
x
Mill.M
etric
Ton
nes
MarineDiadromousFreshwaterAquaculturepriceindex
Sourcepriceindex:FAO,Univ.ofStavanger,NorwegianSeafoodCouncil

Produc4onofSurveyedSpeciesExcl.Carp2003-2017
2.5 2.9 3.3 3.8 4.6 5.5 5.9 6.6 7.1 8.2 8.7 9.4 9.6 9.9 10.52.4 2.5 2.6 2.6
2.93.1 3.1
3.23.6
4.1 4.24.3 4.5 4.4 4.5
0.3 0.3 0.3 0.40.4
0.5 0.50.5
0.50.5 0.5
0.6 0.6 0.60.6
0
20
40
60
80
100
120
140
160
180
0.0
2.0
4.0
6.0
8.0
10.0
12.0
14.0
16.0
18.0
2003 2004 2005 2006 2007 2008 2009 2010 2011 2012 2013 2014 2015 2016 2017
Aqua
cultu
rePric
eInde
x
Mill.M
etric
Ton
nes
Marine
Diadromous
Freshwater
Aquaculturepriceindex

GrowthRatesbySpeciesGroups-Incl.Carps2004-2016averagegrowthrate(inparenthesis)
-5.0
0.0
5.0
10.0
15.0
20.0
25.0
30.0
35.0
2004 2005 2006 2007 2008 2009 2010 2011 2012 2013 2014 2015 2016 2017
%growth
Freshwater(6.5%)
Diadromous(4.9%)
Marine(6.7%)

GrowthRatesbySpeciesGroups-Excl.Carp(2004-2016averagegrowthrateinparenthesis)
-5.0
0.0
5.0
10.0
15.0
20.0
25.0
30.0
35.0
2004 2005 2006 2007 2008 2009 2010 2011 2012 2013 2014 2015 2016 2017
%growth
Freshwater(11.4%)
Diadromous4.9%)
Marine(6.7%)

Produc4onofSurveyedWhitefishSpeciesExcludingCarp(2003-2017)
3.3 3.7 4.2 4.8 5.7 6.6 7.1 7.9 8.59.7 10.4 11.1 11.3
11.7 12.3
0.0
2.0
4.0
6.0
8.0
10.0
12.0
14.0
2003
2004
2005
2006
2007
2008
2009
2010
2011
2012
2013
2014
2015
2016
2017
Prod
uc4o
ninM
ill.m
etric
tonn
es

12.7 13.614.9
19.1
15.6
7.5
10.9
8.0
13.9
6.7 6.6
1.93.3
5.4
0.0
5.0
10.0
15.0
20.0
25.0
0.0
2.0
4.0
6.0
8.0
10.0
12.0
14.0
2003
2004
2005
2006
2007
2008
2009
2010
2011
2012
2013
2014
2015
2016
2017
%growth
Prod
uc4o
ninM
ill.m
etric
tonn
es
ProducIon %growth
Produc4onofSurveyedWhitefishSpeciesExcludingCarp(2003-2017)

Produc4onofSurveyedWhitefishSpeciesandPriceIndexAquaculture&Whitefish
ExcludingCarp,2003-2017
0
20
40
60
80
100
120
140
160
180
0
2
4
6
8
10
12
14
200320042005200620072008200920102011201220132014201520162017
Whitefishpriceinde
x
Prod
uc4o
ninM
ill.m
etric
tonn
es
ProducIonAquaculturepriceindexWhitefishpriceindex
Sourceprices:FAO,NorwegianSeafoodCouncil

60
Didtheydoubleinadecade?Percentagegrowth,2006-2016
-5.3 2.0
13.9 18.3 22.8
50.1 68.0 69.0 70.6
90.2 91.9
128.6 145.0
165.8 170.6
201.5
-100 0 100 200 300
Large Rainbow trout Atlantic halibut
Bluefin tuna Sea bass & bream, Medit.
Coho salmon Turbot, excl. China
Small trout Carp*
Atlantic salmon Cobia*
Milkfish* Pangasius, Vietnam
Tilapia Grouper*
Barramundi* Catfishes*
Percent *Selectedcountries

61
Didtheydoubleinadecade?Percentagegrowth2006-2016
83.1
116.4
86.1
158.4
66.7
40.6
0 100 200
TOTAL
TOTAL EX. CARP
Freshwater
Freshwater ex. Carp
Diadromous
Marine
Percent

Thank You!


![005014906 00378 - National Archives of Ireland · 2013-06-18 · O'CALLAGHAN Jeremiah, Effects £5. O'CALLAGHAN Jeremiah. Effects £1,992 8B. 9ð. 1121] O'CALLAG Thomas James. £38](https://img.dokumen.tips/doc/110x75/5f5124ae4429876a3b766126/005014906-00378-national-archives-of-2013-06-18-ocallaghan-jeremiah-effects.jpg)