Embed Size (px)
Citation preview

Global Financial Market

Private Financial Intermediaries (FIs)
• Private FIs: profit-seeking firms whose assets are predominantly financial.
• Financial Intermediaries (FIs) are the professionals that guide us through our risk shifting and cash flow timing transactions in financial markets.

Broker/Dealer Operations• Broker:
FI that brings together buyers and sellers without acting as a principle in the transaction.
• Dealer: FI that makes a market in a financial security, thereby participating as a principal in the financial transaction.
• Market Maker or Specialists: Dealers that make a market in one or more number of securities and who maintain a “fair and orderly” market by dealing personally in the market.

Other Operations of Private FIs
• Underwriting: the process whereby the FI brings to market a newly issued financial security.
• Asset Transformation: the FI’s creation of new financial securities by selling financial securities that are different from the financial securities it buys.
• Securitization: the packaging of non-traded financial securities into a newly created tradable financial security.

The Structure of Financial Markets
• Two settings: 1. Formal Financial Exchanges 2. Over-the-counter (OTC) Markets• Financial Exchanges are formalized Trading
Institutions. Only members have the right to trade in Fin. Exchanges. Each Financial Exchange has detailed and explicit rules governing the conduct of the trade of securities.
Examples:NYSE: New York Stock ExchangeCBOT: Chicago Board of TradeCME: Chicago Mercantile ExchangeLIFFE: London International Financial Futures ExchangeLSE: London Stock Exchange

The Structure of Financial Markets (cont.)
• Over The Counter (OTC) covers all other financial market transactions. In an OTC trade buyer or seller are free to negotiate all contractual details. Modern OTC markets rely on telephone and computer screens to link buyers and sellers with market dealers. Dealers quote both bid and ask prices to prospective buyers and sellers.
• Examples: NASDAQ, FX Market
NASDAQ: National Association of Securities Trader Automated QuotationFX Market: Foreign Exchange Inter-bank Market

The Structure of Financial Markets (cont.)
• Drivers of Liquidity: Manual vs. Automated trading systems
Example 1: Trade in German Govt. Bond futures moved from LIFFE derivatives market to Swiss-German derivatives exchange EUREXExample 2: Flight from BBB to AA bonds in 1998 after Russian Default
• Liquidity can also be created through the removal of credit (counterparty) risk. In the money market use of “Sale and Repurchase of Agreement’ or REPO is such an example.
• Repo is a short-term contract when one party agrees to sell a security to another party (the lender) and then repurchase subsequently at a higher price.

Clearing & Settlement Service
• Process: Each party (say A&B) keeps cash in a Bank Account, known as Clearing Bank) and keeps his/her own securities in “securities accounts”. To settle a trade, the securities are taking out of party A’s account and deposited into party B’s account, while the cash is taking out of party B’s account and deposited into party A’s account.
• Oldest method – messengers sent for confirmation (up to 50’s).

Clearing & Settlement Service (cont.)
• Depository Trust Company (DTC) in 60’s.• All parties have securities accounts with DTC and DTC
keeps records of all transfers.• Other than the recording a trade, a trade confirmation is
also required. In last 30 years, all clearing houses are consolidated as:
• For equity trades: National Security Clearing Corporation (NSCC)
• For all Fixed Income: Fixed Income Clearing Corporation (FICC)
• Both NSCC and FICC, as well as DTC are subsidiaries of Depository Trust & Clearing Corporation (DTCC).
• Today most trades are handled in an automated fashion from organization to settlement (called Straight through Processing, STP).

Clearing & Settlement Service (cont.)
• Regulations: • There are two types of regulation in securities market,
one by legislation (through US government) and the other is self governing. After Great Depression and 1929 market crash, the Security Act helped to create SEC or Security Exchange Commission and Commodity Futures Trading Commission (CFTC in 1972) which are government agencies.
• Non-government agencies/ self regulatory organizations:
National Association of Security Dealers (NASC)National Futures Association (NFA)Bond Markets Association ( BMA)
• Regulation and Compliance:• Whether self regulated or regulated by government,
compliance is an important issue in every firm.

Clearing & Settlement Service (cont.)
Type of PFI
1. Buy-side companies:Professional Asset Management Companies (invest
client’s money): Blackrock, PIMCO, BGI, Deutsche Asset Mgmt
Mutual Fund Co.2. Flagship Sell-side companies are: Goldman Sachs Morgan Stanley Lehman Bros Bear Sterns3. Mutual Fund or Asset management companies. Fidelity Vanguard

Clearing & Settlement Service (cont.)
Commercial Bank and Investment Bank
• 1930’s Glass Steagal Act d separated the Commercial Banking activity and Investment Banking activity. In 1990’s it changed and
• Citibank bought Salomon Brothers• Chase bought JP Morgan• UBS• HSBC• Deutsche Bank• Credit Swiss

Clearing & Settlement Service (cont.)
Money is made in Private Financial Intermediaries• Investment Banking fees• Asset Management fees• Brokerage fees• Market making revenues• Proprietary trading revenues• Hedge Funds make money from asset management and
proprietary trading• Dealers make money from Market making revenues and
Proprietary trading revenues• Brokers make money from Brokerage fees.

Global Financial Markets• 1700’s: London, Amsterdam, Paris, Antwerp• Mid-1800’s: London, Amsterdam, Paris and New York• Mid-1900’s: mainly New York• 1990: London is back with New York, Tokyo• 1990’s: PIMCO, BAI – west coast Florida, California
USA Europe Asia AustraliaNew York London Tokyo SydneyChicago Paris Singapore
Frankfort Hong Kong+California Amsterdam Shanghai+Florida Bombay

Global Financial Markets (cont.)
• Investment Banking Underwriting Bringing new securities
to market Advising on Mergers &
Acquisitions
• Retail Brokerage – buy/sell securities for clients Maintain accounts for individual
investments• Prime Brokerage – buy & sell to other brokers/ dealers• Asset Management – buy side activity• Equities / Fixed Income / Securities – Trading

Global Financial Markets (cont.)
• Trading groups are organized by type of customers.• Hedge Funds, Banks, Asset Managers, Corporations• Trading group include a Trader, Trading Assistants, Interns +
some Quants And Technology people for support.• Trade Solicitation vs. Pricing securities vs. Closing Trade• Trading Books and manage p&L of the trading Desk• Bank Office or operations - reconciliation/clearing
- netting - settling trades
• Traders are supported by research group 1. Understand the existing Pricing Model2. Develop programs that traders could run on their
computers• All have Market Data Platforms (Bloomberg or Reuters)• Recent trend is Quantitative Risk Management

Global Financial Markets (cont.)
• Other Market Players1. Portfolio Managers data mining task2. Hedge Funds Use models and take risks (smaller operations) typically hires – quant traders
• Quant traders need expertise in Excel modeling but knowledge of quantitative modeling and the knowledge of particular products are necessary.
• Desk Quants creates and maintains quantitative models that are used in day to day trading activity. Desk Quants are an intermediary between trader and technology units.
• Sales and Market Research• They provide research support to the sales people. Broader
analysis of economic / political / and issues driving market.

Global Financial Markets (cont.)
Positions of hiring:
• Analysts vs. Associates
• VP vs. Directors
• Managing director

Sell Side Financial Intermediaries: Participants in Secondary Markets
Dealer Dealer Dealer
Inter BrokerDealer

ExchangesNYSE
ExchangesNASDAQ
ExchangesFCN
Broker Broker Broker
I N V E S T O R S

TOP MANAGEMENT
Legal / Compliance
Revenue / Producing
Technology Risk Management
Investment Banking
Asset Management
Retail / Prime Brokarage
Equity
Fixed Income
Organization Structure of a Sell Side Financial Intermediaries:
Foreign Exchange
Rates Credit Risk Management
Mortgages
Munis
Treasuries Int. Rate Derivatives
Swaps Structured Products

Market Participants:Firms Government Agencies Other FIs
General Motors
US Treasury FNMA World Banks
Goldman Sachs Lehman Bros. Citi Group
I
N V E S T O R S

Global Financial Markets
Size of Different Global Financial Markets
(Source: RPM Handbook)

Table 1. Key Statistics for the Principle Global Equity Market
2002 Market Cap (End Yr) $ Trillion
Average Daily Turnover
$ Billion
Average Transaction Value
$ Thousand
NYSE 9.0 40.9 19
NASDAQ 2.0 28.8 12
London Stock Exchange
1.8 15.9 105
Euronext 1.5 7.8 31
Tokyo 2.1 6.4 n/a
Deutsche Borse 0.7 4.8 17
Other N. America 0.6 6.3
Other Europe 2.1 10.1
Emerging Markets 3.0 13.1
Total 22.8 134.0

Table 2. Stock of International and Domestic Market Debt, Sept. 2003 (US$ Trillion)
All Maturities Remaining Maturities < 12M
Domestic Internat’l Total Domestic Internat’l Total
Government 18.1 1.1 19.2 4.1 0.1 4.2
Financial Institutions 15.5 7.8 23.2 4.0 1.4 5.4
Corporate Sector 4.9 1.4 6.3 0.6 0.2 0.8
Total 38.5 10.2 48.7 8.7 1.7 10.4

Table 3. Market Capitalization of Bonds Listed on Principal Exchanges (US $ Trillion)
Luxembourg London Osaka NYSE Italy
Domestic Public Sector
0.0 0.0 3.6 1.1 1.1
Domestic Private Sector
0.1 0.1 0.1 0.2 0.1
Foreign 4.8 0.6 0.0 0.1 0.0
Total 4.9 0.7 3.7 1.4 1.2

Table 4. Daily Foreign Exchange Turnover April 2001 (US$ Billion)
Different Foreign Exchange Markets
Turnover Volume (US$ Billion)
Spot 387
Forward 131
Foreign Exchange Swap 656
Total 1173

Table 5. Major OTC Derivatives June 2003
Notional Amounts
(US$ Trillion)
Gross Market Values
(US$ Billion)
Interest Rate Swaps 94.6 1126
Interest Rate Options 16.9 434
Forward Rate Agreements 10.3 20
Currency Forwards and
Currency Swaps
12.3 476
Currency Swaps 5.2 419
Currency Options 4.6 101
Equity Derivatives 2.8 260
Commodity Derivatives 1.0 110
Other Including Credit
Derivatives
22.0 1083
Total 169.7 4029

Table 6. Principal Exchanges for Equity Derivatives
Notes: EUREX was formed joining DTB and SOFEX Euornext is a combination of Dutch and Paris exchanges
DTB: Deutsche TerminBorse
SOFEX: Swiss Options and Financial Futures Exchanges
Millions of Contracts Traded 2002
Individual Stock Equity Index
Options Futures Options Futures
AMEX 150.7 32.7
BOVESPA (Sao Paolo Stock Exchange)
89.7 1.1
Chicago Board Options Exchange
173.2 94.4
Chicago Mercantile Exchange
5.4 212.2
International Securities Exchange
152.3
EUREX 143.3 0.1 90.3 120.4
Euronext 323.6 7.6 108.3 51.9
Pacific SE 72.7 12.7
Philadelphia SE/BOT 84.9 3.6
World-Wide 1300.0 57.1 420.2 531.3
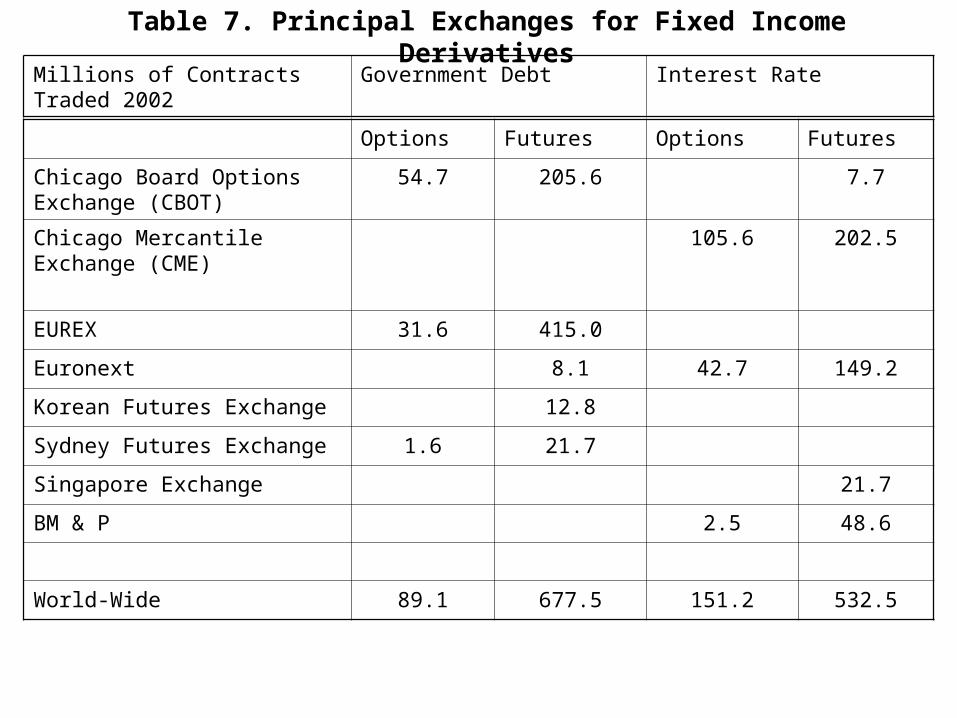
Table 7. Principal Exchanges for Fixed Income DerivativesMillions of Contracts Traded 2002
Government Debt Interest Rate
Options Futures Options Futures
Chicago Board Options Exchange (CBOT)
54.7 205.6 7.7
Chicago Mercantile Exchange (CME)
105.6 202.5
EUREX 31.6 415.0
Euronext 8.1 42.7 149.2
Korean Futures Exchange 12.8
Sydney Futures Exchange 1.6 21.7
Singapore Exchange 21.7
BM & P 2.5 48.6
World-Wide 89.1 677.5 151.2 532.5

Table 8. Principal Exchanges for Currency and Commodity Derivatives
Millions of Contracts Traded 2002
Currency Commodity
Options Futures Options Futures
Chicago Board Options Exchange (CBOT)
12.6 54.1
Chicago Mercantile Exchange (CME)
2.2 22.1 0.8 6.8
New York Mercantile Exchange
26.4 107.3
London Metal Exchange 2.3 56.3
Zhenzhou Commodity Exchange
14.6
Tel Aviv SE 12.0
BM & P 2.0 16.1
World-Wide 16.7 41.1 47.8 265.2

Brokers
Dealers
UnderwritersInvestment bankers
Mutual funds Pension funds
Banks
Insurance comp
Non-intermediatedTransactions(direct financing)
Funds SurplusUnits
Funds DeficitUnits
Transparent FIs
Opaque FIs
Financial Securities
FinancialSecurities
Financial Securities
Financial Securities
FinancialSecurities
Financial Securities
Shares
Financial Securities
DepositsLoans
PoliciesFinancial Securities
IOUs IOUs
Figure 2.1 Private Financial Intermediaries (FIs)


![Financial Services Agency · (. fsa. go. jp/menkyo/menkyo. html)] QI IOO 20 —fis —fis . Created Date: 3/12/2010 7:13:26 PM](https://img.dokumen.tips/doc/110x75/60ac82686b31c74af112dcf9/financial-services-agency-fsa-go-jpmenkyomenkyo-html-qi-ioo-20-afis.jpg)