Embed Size (px)
Citation preview

GLOBAL ESTIMATES OF INFORMAL CARE
Global estimates of informal care
Alzheimer’s Disease International and Karolinska Institutet

ALZHEIMER’S DISEASE INTERNATIONAL
Authors
Anders Wimo1,2,3, Serge Gauthier4, Martin Prince5, on behalf of ADI’s Medical Scientific Advisory Panel, and the Alzheimer’s Disease International publications team
1Aging Research Center, Department of Neurobiology, Care Sciences and Society (NVS), Karolinska Institutet and Stockholm University, Stockholm, Sweden
2Division of Neurogeriatrics, Department of Neurobiology, Care Sciences and Society (NVS), Karolinska Institutet, Stockholm, Sweden
3Centre for Research & Development, Uppsala University/County Council of Gävleborg, Gävle, Sweden
4McGill Center for Studies in Aging, Douglas Mental Health Research Institute, Montreal, Canada
5The Global Observatory for Ageing and Dementia Care, Institute of Psychiatry, Psychology and Neuroscience, Health Service and Population Research Department, King’s College London, UK
Corresponding author:
Anders Wimo MD, PhD, Adjunct Professor Division of Neurogeriatrics Department of Neurobiology, Care Sciences and Society Novum 5th floor Karolinska Institutet SE-14157 Huddinge Sweden
e-mail: [email protected] phone: +46 70 5795383 fax: +46 650 36614
This report was independently researched by the authors named. The evidence reported, and the inferences drawn, are the responsibility of the authors alone.
Cover image ©Leah Beach 2018
Published by Alzheimer’s Disease International (ADI), London, July 2018 © Alzheimer’s Disease International

GLOBAL ESTIMATES OF INFORMAL CARE
ForewordWith this report we have set out to answer some of the questions raised in the 2015 World Alzheimer Report. All of us who have had a personal experience of dementia sense that the cost of informal care to society is huge. Ascertaining how huge exactly, however, is not an easy task. Yet that figure is crucial to empower civil society in their advocacy with governments.
In the 2015 World Alzheimer Report, we presented estimates of the global societal economic impact of dementia. The global costs then were estimated to be US$ 818 billion, a figure now (2018) surpassing US$ one trillion per year. Of these costs:
• 40% were related to informal care,
• 40% to the social care sector and
• 20% to the medical sector.
However, these costs were distributed in an uneven way: 87% occurred in high income countries and in low income countries, costs of informal care constituted 69% of the costs, while the corresponding cost for high income countries were 38%.
The primary aim of this new report is to:
• present global estimates of informal care hours, based on an extract from the database that was used in the 2010 and 2015 World Alzheimer Reports
• compare the global distribution of caregiver time estimates with that of costs
• highlight gender patterns.
Cost of care for informal caregivers is undoubtedly a complex area but regardless of how the costs are expressed and calculated, it is obvious that the contribution of informal caregivers is substantial. Most informal caregivers are family members and many caregivers express positive experiences in this situation. However, being an informal caregiver can also be stressful in terms of coping, depression, impact on social networks and work patterns and morbidity.
In this report we estimate that the annual global number of informal care hours provided to people with dementia living at home was about 82 billion hours in 2015, equating to 2,089 hours per year or 6 hours per day. This is the equivalent of more than 40 million full time workers in 2015, a figure that will increase to 65 million full time workers by 2030.
As 60% of people with dementia live in lower and middle income countries (a proportion that continues to increase), and as almost all (96%) of people with dementia in lower and middle income countries live at home, this has a significant impact on the global distribution of caregiver time.
The report also reveals the continued disproportionate impact of dementia on women. Women contribute to 71% of the global hours of informal care, with the highest proportion in low income countries.
Societal changes already in progress all over the world – shifting family structures, generational split, migration and the increasing participation of women in the workforce – will, for dementia care, result in a shift from informal care to a greater need for different kinds of formal care (home support, day care, long term care). This scenario presents a great challenge for society in terms of financing, staff recruitment and training. Employers will also need to be aware of the growing number of employees that will be affected by caregiving and recognize that the caregiving role may need further formal recognition in labour legislation.
In essence, this is a complex report which tries to answer complex questions, but it is also a key milestone in our dialogue with governments and multilateral organisations. Dementia is a multifaceted disease which impacts society on very many levels and we need to understand this impact if we are to advocate for a better life for people with dementia and their families and care partners all over the globe.
Paola Barbarino Chief Executive Officer
3

ALZHEIMER’S DISEASE INTERNATIONAL
List of abbreviations
ADI Alzheimer’s Disease International
ADL Activities of daily living
COI Cost of illness
IADL Instrumental activities of daily living
GBD WHO Global Burden of Disease measurement
HIC / HI High income country
UM Upper middle income
LM Lower middle income
LO Low income
ILO International Labour Organization
LMIC Low and middle income country
WAR World Alzheimer Report
WB World Bank
WHO World Health Organization
4

GLOBAL ESTIMATES OF INFORMAL CARE
Introduction In 2015 Alzheimer’s Disease International (ADI) presented estimates of the global societal economic impact of dementia1,2. The global costs were estimated to be US$ 818 billion in 2015. Of these costs, 40% were related to informal care, 40% to the social care sector and 20% to the medical sector. These costs were distributed in an uneven way; with 87% of the total costs occurring in high income countries. However, when broken down, informal care constitutes a greater percentage of costs in low income countries (69%) than in high income countries (38%).
Regardless of how the costs are expressed and calculated, it is obvious that the contribution of informal caregivers for dementia is substantial. It is also clear that cost of illness estimates are a rough way to describe the contributions of informal carers. Furthermore, the situation of informal carers and the interaction between a person with dementia and the informal carers is very complex3.
Most informal carers are family members of the person living with dementia and most express that their caring experience is positive. However, being an informal carer can also be stressful, and can be described in terms of coping, burden, stress, depression, social network and morbidity4-8.
This report seeks to describe the contribution of informal carers by quantifying it in terms of hours. In ADI’s 2015 cost estimates1,2, the cost estimates of informal care were based on an update of a comprehensive and systematic review of the literature that was used in the 2010 global cost estimates9,10. The primary aim of the this report is to present global estimates of informal care hours, based on an extract from the database that was used in the 2010 and 2015 World Alzheimer Reports (WAR). A second aim is to compare the global distribution of carer time estimates with that of costs. A third aim is to highlight gender patterns and the contribution of women in informal care.
Methods This study is based on extracts from the database that resulted in World Alzheimer Reports 20109,10 and 20151,2, but now with a focus on informal carer time.
Informal care and carer timeFamily members and friends, or others close to people living with dementia, have a great impact on the societal costs of dementia, since they undertake an extensive amount of unpaid informal care11-16. However, it is complicated to translate this contribution into volumes and economic terms.
First, measuring carer time is problematic. Support in basic personal activities of daily living (ADL) such as eating, dressing, bathing, toileting, grooming and getting around; and instrumental activities of daily living (IADL) such as shopping, preparing food, using transport, managing personal finances, etc. are well-defined concepts in care research. Basic ADLs are relatively easy to assess and interpret across countries and cultures, but IADLs are much more culture specific. Another aspect of the quantification of IADLs is ‘joint production’ activities that can serve multiple purposes when the person with dementia and the carer are doing things together, for example shopping. Finally, a substantial part of activities can be described in terms of supervision or surveillance to manage behavioural symptoms or to prevent dangerous events12.
Based on a review of international literature we identified for the 2010 WAR; 10 appropriate studies where basic ADLs are quantified in 25 countries15,17-25 (representing countries with 63% of the worldwide population with dementia); 42 papers or reports with combined ADLs from 30 countries (representing 73% of the worldwide population with dementia)13-54; and 13 papers or reports with figures of supervision from 25 countries (representing 63% of the worldwide population with dementia)15,18,19,21,23-25,31,42,44-47. An important input has been the data from eight countries participating in the 10/66 Dementia Research Group, providing data from low and middle income countries.
For certain countries, where available, country specific data sources were used. For other countries, imputation was, when possible, carried out. The imputation was when possible based on the WHO region classification. This means that if there were data available from one or more countries in the same region, these data were used for imputation for countries in the same WHO region where data were missing. Otherwise, data from nearby WHO regions were used. When data were missing in the new regional classification, and there were data available according to the old WHO classification for similar regions, data were imputed according to mapping principles developed by ADI. For all African regions, global figures were used. This global estimate was based on time studies from all over the world where the time estimates were weighted versus the size of the dementia population from where the time studies came from.
5

ALZHEIMER’S DISEASE INTERNATIONAL
Table 1 WHO GBD region specific figures of informal care (hours per day). Source: WAR 2010
WHO GBD region Combined ADL
Supervision
Australasia 3.3 2.6
Asia Pacific High Income 3.6 2.6
Oceania 4.6 1.2
Asia Central 2.7 3.3
Asia East 4.7 1.2
Asia South 2.7 2.6
Asia Southeast 2.7 2.6
Europe Western 3.5 3.3
Europe Central 4.4 3.4
Europe Eastern 4.4 3.4
North America High Income 4.0 2.8
Caribbean 3.0 2.1
Latin America Andean 2.9 2.6
Latin America Central 1.9 3.1
Latin America Southern 4.4 2.6
Latin America Tropical 2.9 2.6
North Africa / Middle East 1.4 2.6
Sub-Saharan Africa Central 3.6 2.6
Sub-Saharan Africa East 3.6 2.6
Sub-Saharan Africa Southern 3.6 2.6
Sub-Saharan Africa West 3.6 2.6
Table 2 Female proportion of informal carers in different WHO GBD regions. Source: WAR 2010
WHO GBD region Proportion of female carers
Australasia 72%
Asia Pacific High Income 81%
Oceania 55%
Asia Central 71%
Asia East 55%
Asia South 77%
Asia Southeast 86%
Europe Western 66%
Europe Central 74%
Europe Eastern 82%
North America High Income 71%
Caribbean 80%
Latin America Andean 85%
Latin America Central 82%
Latin America Southern 74%
Latin America Tropical 91%
North Africa / Middle East 71%
Sub-Saharan Africa Central 81%
Sub-Saharan Africa East 81%
Sub-Saharan Africa Southern 81%
Sub-Saharan Africa West 81%
The WHO region specific data for informal care inputs are summarised in Table 1.
In our review of the literature regarding care arrangements for people with dementia (25 studies representing countries with 78% of the global dementia population) we found that a woman was identified as the main informal carer for 55-91% of people with dementia (Table 2)21,24,35,39,55-63,22,23,50,64-68.
From the carer literature6,14,16,21,22,24,35,39,45-47,50,55,58-64,66,69-73 spouses are the main carers for around 40% of people with dementia, but with great regional differences as seen in Table 3.
6

GLOBAL ESTIMATES OF INFORMAL CARE
To get an appreciation of what the informal care hours represent, we also present the figures of informal care hours in terms of “annual number of full time workers” globally and in relation to regions. According to the International Labour Organization (ILO) statistics74 the average weekly working time in 2015 (average of 87 countries without weighting for population size) was 40.1 hours. However, to calculate annual working time is a bit more complicated since absence from work (vacation, ‘red letter days’, etc.) varies a lot. Thus we use one low option (1800 hours per year) and one high option (2000 hours per year).
Costing informal care is a complex issue. For details about costing informal care, see the WARs 2010 and 2015. The costing of informal care in WAR 2010 and 2015 was based on the opportunity cost approach, valuing informal care by the average wage by country75 and derived from ILO/Laborsta databases.
Classification of countriesResults will be presented in two ways: the World Bank (WB) classification and the WHO Global Burden of Disease (GBD) classification used in WAR 2010 and 2015.
The WB income groups classify countries in four levels, depending on GDP income per person: low income, lower middle income, upper middle income and high income. We also aggregate low income, lower middle income and upper middle income, to low and middle income countries (LMIC). This classification is dynamic as WB reclassifies countries following a change in economic situation (in most cases an “upgrade”). Here we rely on the classification used in WAR 2015.
In WHO’s GBD classification, the countries in the world are divided into 21 regions76.
Numbers of people with dementiaIn the 2015 WAR2 a new systematic review of age specific prevalence was conducted, with 273 studies identified. Compared to the 2009 estimates, age specific prevalence estimates were higher in Asia and Africa, but somewhat lower in Europe and the Americas. Due to global aging, the absolute numbers of people with dementia have increased considerably.
Proportions living at homeMost people with dementia live at home but some live in care homes. Care homes vary according to numbers of staff, training, medical and nursing care resources, etc. from residential care homes (providing low intensity care, with few trained staff); to nursing homes (providing high intensity care with trained nursing and medical staff); to specialist facilities for dementia care (such as group home concepts and similar). There are few reliable estimates of the proportion of people with dementia living in these facilities, as opposed to their own homes in the community. In LMIC, relatively few such facilities exist. The literature in this field is sparse from many countries. However, for the 2010 WAR report, ADI sent out a questionnaire on these issues to 86 key informants in 51 countries. Imputation was used for nearby countries with a similar care structure. From the United Nations (UN), figures of rural-urban proportions of the countries were gathered77, which, combined with the results from the ADI questionnaire, gave a weighted proportion of each country’s assumed home staying proportion of people with dementia.
WHO GBD region Per cent spouse
Australasia 43%
Asia Pacific High Income 36%
Oceania 41%
Asia Central 38%
Asia East 40%
Asia South 24%
Asia Southeast 8%
Europe Western 48%
Europe Central 36%
Europe Eastern 36%
North America High Income 52%
Caribbean 18%
Latin America Andean 15%
Latin America Central 8%
Latin America Southern 46%
Latin America Tropical 54%
North Africa / Middle East 38%
Sub-Saharan Africa Central 41%
Sub-Saharan Africa East 41%
Sub-Saharan Africa Southern 41%
Sub-Saharan Africa West 41%
Table 3 Spouse proportion of informal carers in different WHO GBD regions. Source: WAR 2010
7

ALZHEIMER’S DISEASE INTERNATIONAL
ResultsIn 2015, we estimated that the annual global number of informal care hours provided to home staying people with dementia in terms of ADL support (basic ADLs and instrumental ADLs) and supervision was about 82 billion (Table 4) where about 60% was related to ADL. These figures correspond to about 6 hours per day per person with dementia.
Table 4 Global amounts of informal care to people with dementia in 2015
Billion hours/year of ADL support 50.6
Billion hours/year of supervision 31.5
Billion hours of ADL + supervision/year 82.1
Annual hours per person with dementia 2089
Daily hours per person with dementia 5.7
In the following sections, we present detailed results based on the World Bank and WHO Global Burden of Disease classifications.
1. Results based on the World Bank classificationIn 2015, it was estimated that there were 46.8 million people with dementia worldwide, distributed as seen in Table 5.
Table 5 People with dementia as a proportion of the global total according to the WB classification (derived from WAR 2015)
WB classification Numbers of people with dementia
Proportion of people with dementia
Low income 1 171 429 2.5%
Lower middle income 9 779 758 20.9%
Upper middle income 16 326 611 34.9%
LMIC 27 277 798 58.3%
High Income 19 502 392 41.7%
All 46 780 190 100.0%
Almost 60% of people with dementia live in LMIC.
Most people with dementia live at home but there is a substantial difference between LMIC and HIC (Table 6). In LMIC, almost all people with dementia live at home in contrast to about two thirds in HIC.
Table 6 Numbers of people with dementia estimated to live at home and in care homes respectively
WB classification Proportion estimated to live at home
Numbers of people with dementia estimated to live at home
Proportion estimated to live in care homes
Numbers of people with dementia estimated to live in care homes
Low income 96% 1 124 694 4% 46 735
Lower middle income 98% 9 589 447 2% 190 287
Upper middle income 93% 15 153 374 7% 1 173 236
LMIC 95% 25 867 515 5% 1 410 283
High Income 69% 13 427 182 31% 6 075 210
All 84% 39 294 697 16% 7 485 469
8

GLOBAL ESTIMATES OF INFORMAL CARE
Informal care hours About 60% of the global informal care hours occur in LMIC (Table 7), and the figures correspond well with how the numbers of people with dementia are distributed worldwide.
Table 7 Global amounts of informal care (billion hours/year) to people with dementia in 2015, (WB classification)
WB classification ADL Supervision Total hours Proportion of total hours
Proportion of numbers of people with dementia
Low income 1.47 0.82 2.30 2.8% 2.5%
Lower middle income
9.62 5.87 15.49 18.9% 20.9%
Upper middle income
20.95 11.21 32.17 39.2% 34.9%
LMIC 32.04 17.92 49,96 60.9% 58.3%
High income 18.54 13.57 32.11 39.1% 41.7%
All 50.58 31.49 82.07 100.0% 100.0%
Women contribute around 71% of the global hours of informal care (Table 8) with the highest proportion in low income countries.
Table 8 Female proportion of the global amounts of informal care (billion hours/year) to people with dementia in 2015, (WB classification)
WB classification Total hours Female care hours, ADL
Female care hours (supervision)
Female care hours (total)
Proportion of female contribution (total)
Low income 2.30 1.18 0.66 1.84 80.3%
Lower middle income 15.49 7.68 4.65 12.33 79.6%
Upper middle income 32.17 13.07 7.73 20.80 64.7%
LMIC 49.96 21.93 13.04 34.97 70.0%
High income 32.11 13.46 9.72 23.18 72.2%
All 82.07 35.39 22.76 58.15 70.9%
Given the high assumption for a full time worker (2000 hours/year), the number of hours corresponds to about 41 million full time workers, mostly occurring in LMIC (Table 9).
Table 9 Numbers of full time workers corresponding to the caregiving hours; assuming 2000 hours of annual working time (WB classification)
WB classification Number of full time workers for ADL support (millions).
Number of full time workers for supervision (millions).
Number of full time workers (all) (millions).
Low income 0.74 0.41 1.15
Lower middle income 4.81 2.94 7.75
Upper middle income 10.47 5.61 16.08
LMIC 16.02 8.96 24.98
High income 9.27 6.79 16.05
All 25.29 15.74 41.03
9

ALZHEIMER’S DISEASE INTERNATIONAL
Given the low assumption for a full time worker (1800 hours/year), the total hours of care globally corresponds to somewhat more full time workers, 45.6 million (Table 10).
Table 10 Numbers of full time workers corresponding to the caregiving hours; assuming 1800 hours of annual working time
WB classification Number of full time workers for ADL support (millions)
All
Number of full time workers for supervision (millions)
All
Number of full time workers (all) (millions)
All
Low income 0.82 0.46 1.28
Lower middle income 5.34 3.26 8.61
Upper middle income 11.64 6.23 17.87
LMIC 17.80 9.95 27.76
High income 10.30 7.54 17.84
All 28.10 17.49 45.59
CostsThe worldwide costs of dementia in 2015 were estimated to be US$ 818 (Table 8). These costs are predominately in high income countries.
Table 11 Worldwide costs of dementia in 2015 (billion US$). Costs in cost categories derived from WAR 2015
WB classification Direct medical costs Social sector costs Informal care costs Total costs
bUS$ Prop. bUS$ Prop. bUS$ Prop. bUS$ Prop.
Low income 0.2 0.2% 0.1 0.04% 0.8 0.2% 1.2 0.1%
Lower middle income 3.7 2.3% 2.0 0.6% 9.6 2.9% 15.3 1.9%
Upper middle income 19.3 12.1% 17.7 5.4% 49.3 14.9% 86.3 10.5%
LMIC 23.2 14.6% 19.8 6.0% 59.7 18.0% 102.8 12.6%
High income 136.0 85.4% 308.1 94.0% 271.1 82.0% 715.1 87.4%
Total 159.2 100% 327.9 100% 330.8 100% 817.9 100%
10

GLOBAL ESTIMATES OF INFORMAL CARE
Caregiving time and costs comparedIn Figure 1, we compare the distribution (by WB region) of informal care hours, numbers of people with dementia, costs of informal care and total costs of dementia. There is clearly a discrepancy in the distribution of hours of care and numbers of people with dementia on the one hand, and the costs of care on the other.
0% 10% 20% 30% 40% 50% 60% 70% 80% 90%
100%
Hours of informal care
Numbers of people with dementia
Informal care costs Total costs
LO LM UM HI
Figure 1 Proportions of informal care hours, numbers of people with dementia, costs of informal care and total costs in different WB regions (low income countries proportions of costs are very small (<1%) and thus not clearly visible in the diagram. LO= low income, LM=lower middle income, UM=upper middle income, HI=high income).
11

ALZHEIMER’S DISEASE INTERNATIONAL
2. Results based on WHO GBD classificationMost people with dementia live in the region Asia East, including China, which has the largest number of people with dementia in the world (Table 12).
Table 12 People with dementia as a proportion of global total
WHO GBD region Numbers of people with dementia
Proportion of people with dementia
Australasia 387 448 0.8%
Asia Pacific High Income 3 638 339 7.8%
Oceania 22 648 0.0%
Asia Central 310 984 0.7%
Asia East 9 765 310 20.9%
Asia South 5 128 347 11.0%
Asia Southeast 3 598 669 7.7%
Europe Western 7 449 322 15.9%
Europe Central 1 067 749 2.3%
Europe Eastern 1 941 032 4.1%
North America High Income 4 783 456 10.2%
Caribbean 377 677 0.8%
Latin America Andean 338 760 0.7%
Latin America Central 1 535 863 3.3%
Latin America Southern 753 411 1.6%
Latin America Tropical 1 655 515 3.5%
North Africa / Middle East 2 398 576 5.1%
Sub-Saharan Africa Central 158 787 0.3%
Sub-Saharan Africa East 693 203 1.5%
Sub-Saharan Africa Southern 237 275 0.5%
Sub-Saharan Africa West 537 818 1.1%
ALL 46 780 190 100.0%
12

GLOBAL ESTIMATES OF INFORMAL CARE
There is great variability in the proportion of people with dementia who live at home (Table 13), with a range from 55% (Western Europe) to 100% (Oceania).
Table 13 Numbers of people with dementia estimated to live at home and in care homes respectively
WHO GBD region Proportion estimated to live at home
Numbers of people with dementia estimated to live at home
Proportion estimated to live in care homes
Numbers of people with dementia estimated to live in care homes
Australasia 56% 217 553 44% 169 895
Asia Pacific High Income 74% 2 690 997 26% 947 342
Oceania 100% 22 623 0% 0
Asia Central 95% 2 96 464 5% 14 520
Asia East 95% 9 245 696 5% 519 615
Asia South 99% 5 086 455 1% 41 893
Asia Southeast 98% 3 516 747 2% 81 922
Europe Western 55% 4 092 818 45% 3 356 504
Europe Central 90% 964 726 10% 103 023
Europe Eastern 87% 1 683 131 13% 257 901
North America High Income 76% 3 623 541 24% 1 159 915
Caribbean 92% 348 193 8% 29 484
Latin America Andean 93% 313 893 7% 24 867
Latin America Central 93% 1 431 063 7% 104 800
Latin America Southern 77% 578 670 23% 174 741
Latin America Tropical 91% 1 502 266 9% 153 249
North Africa / Middle East 89% 2 137 621 11% 260 956
Sub-Saharan Africa Central 94% 149 259 6% 9 528
Sub-Saharan Africa East 96% 665 162 4% 28 041
Sub-Saharan Africa Southern 94% 223 225 6% 14 050
Sub-Saharan Africa West 94% 504 594 6% 33 224
ALL 84% 39 294 697 16% 7 485 469
13

ALZHEIMER’S DISEASE INTERNATIONAL
Informal care hoursAbout one quarter of the global hours of informal care occur in the region Asia East (including China) (Table 14), followed by the regions Europe Western and North America High Income. In Asia East the proportion of hours is higher than the proportion of the dementia population, while the situation is opposite in the regions Australasia and Europe Western, perhaps reflecting the higher proportion of institutionalised people with dementia in these two regions.
Table 14 Total hours of informal care (billion hours/year) as a proportion of global total in 2015
WHO GBD region ADL Supervision Total hours Proportion of total hours
Proportion of numbers of people with dementia
Australasia 0.26 0.10 0.36 0.4% 0.8%
Asia Pacific High Income 3.46 1.18 4.64 5.7% 7.8%
Oceania 0.04 0.01 0.05 0.1% 0.0%
Asia Central 0.29 0.38 0.68 0.8% 0.7%
Asia East 15.81 5.34 21.14 25.8% 20.9%
Asia South 5.01 2.81 7.82 9.5% 11.0%
Asia Southeast 3.47 1.54 5.01 6.1% 7.7%
Europe Western 5.23 4.87 10.10 12.3% 15.9%
Europe Central 1.63 1.26 2.89 3.5% 2.3%
Europe Eastern 2.70 2.21 4.92 6.0% 4.1%
North America High Income 5.29 3.81 9.11 11.1% 10.2%
Caribbean 0.37 0.29 0.66 0.8% 0.8%
Latin America Andean 0.34 0.30 0.63 0.8% 0.7%
Latin America Central 0.97 1.58 2.55 3.1% 3.3%
Latin America Southern 0.93 0.63 1.57 1.9% 1.6%
Latin America Tropical 1.61 1.65 3.26 4.0% 3.5%
North Africa / Middle East 1.10 2.23 3.34 4.1% 5.1%
Sub-Saharan Africa Central 0.20 0.13 0.32 0.4% 0.3%
Sub-Saharan Africa East 0.89 0.56 1.44 1.8% 1.5%
Sub-Saharan Africa Southern 0.30 0.19 0.48 0.6% 0.5%
Sub-Saharan Africa West 0.67 0.42 1.10 1.3% 1.1%
All 50.6 31.5 82.1 100% 100.0%
14
GLOBAL ESTIMATES OF INFORMAL CARE
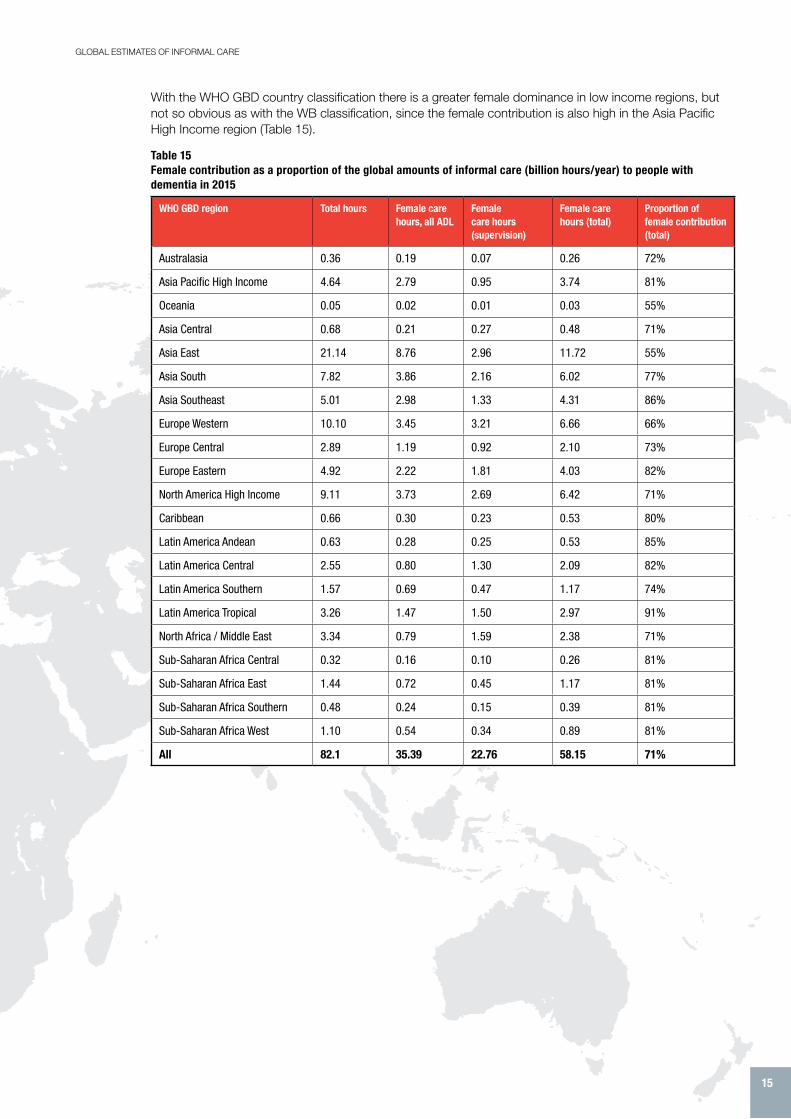
With the WHO GBD country classification there is a greater female dominance in low income regions, but not so obvious as with the WB classification, since the female contribution is also high in the Asia Pacific High Income region (Table 15).
Table 15 Female contribution as a proportion of the global amounts of informal care (billion hours/year) to people with dementia in 2015
WHO GBD region Total hours Female care hours, all ADL
Female care hours (supervision)
Female care hours (total)
Proportion of female contribution (total)
Australasia 0.36 0.19 0.07 0.26 72%
Asia Pacific High Income 4.64 2.79 0.95 3.74 81%
Oceania 0.05 0.02 0.01 0.03 55%
Asia Central 0.68 0.21 0.27 0.48 71%
Asia East 21.14 8.76 2.96 11.72 55%
Asia South 7.82 3.86 2.16 6.02 77%
Asia Southeast 5.01 2.98 1.33 4.31 86%
Europe Western 10.10 3.45 3.21 6.66 66%
Europe Central 2.89 1.19 0.92 2.10 73%
Europe Eastern 4.92 2.22 1.81 4.03 82%
North America High Income 9.11 3.73 2.69 6.42 71%
Caribbean 0.66 0.30 0.23 0.53 80%
Latin America Andean 0.63 0.28 0.25 0.53 85%
Latin America Central 2.55 0.80 1.30 2.09 82%
Latin America Southern 1.57 0.69 0.47 1.17 74%
Latin America Tropical 3.26 1.47 1.50 2.97 91%
North Africa / Middle East 3.34 0.79 1.59 2.38 71%
Sub-Saharan Africa Central 0.32 0.16 0.10 0.26 81%
Sub-Saharan Africa East 1.44 0.72 0.45 1.17 81%
Sub-Saharan Africa Southern 0.48 0.24 0.15 0.39 81%
Sub-Saharan Africa West 1.10 0.54 0.34 0.89 81%
All 82.1 35.39 22.76 58.15 71%
15

ALZHEIMER’S DISEASE INTERNATIONAL
In the region Asia East, the amounts of informal care corresponds to about 10.6 million full time workers (Table 16), followed by 5.1 and 4.6 million in Europe Western and North America High Income respectively (assuming 2000 hours of annual working time).
Table 16 Numbers of full time workers corresponding to carers hours; assuming 2000 hours of annual working time
WHO GBD region Number of full time workers for ADL support (millions)
Number of full time workers for supervision (millions)
Number of full time workers (all) (millions)
Australasia 0.13 0.05 0.18
Asia Pacific. High income 1.73 0.59 2.32
Oceania 0.02 0.00 0.02
Asia, Central 0.15 0.19 0.34
Asia, East 7.90 2.67 10.57
Asia, South 2.51 1.40 3.91
Asia, Southeast 1.73 0.77 2.51
Europe, Western 2.62 2.43 5.05
Europe, Central 0.82 0.63 1.45
Europe, Eastern 1.35 1.11 2.46
North America, High Income 2.65 1.91 4.55
Caribbean 0.18 0.14 0.33
Latin America, Andean 0.17 0.15 0.32
Latin America, Central 0.49 0.79 1.28
Latin America, Southern 0.47 0.32 0.78
Latin America, Tropical 0.81 0.82 1.63
North Africa/Middle East 0.55 1.12 1.67
Sub-Saharan Africa, Central 0.10 0.06 0.16
Sub-Saharan Africa, East 0.44 0.28 0.72
Sub-Saharan Africa, Southern 0.15 0.09 0.24
Sub-Saharan Africa, West 0.34 0.21 0.55
Total 25.29 15.74 41.03
16

GLOBAL ESTIMATES OF INFORMAL CARE
With the lower assumption for annual working time (1800 hours), the corresponding number of full time workers is somewhat higher, 45.6 million people (Table 17).
Table 17 Numbers of full time workers corresponding to carers hours; assuming 1800 hours of annual working time
WHO GBD region Number of full time workers for ADL support (millions)
Number of full time workers for supervision (millions)
Number of full time workers (all) (millions)
Australasia 0.15 0.05 0.20
Asia Pacific. High income 1.92 0.66 2.58
Oceania 0.02 0.01 0.03
Asia, Central 0.16 0.21 0.38
Asia, East 8.78 2.97 11.75
Asia, South 2.78 1.56 4.35
Asia, Southeast 1.93 0.86 2.78
Europe, Western 2.91 2.71 5.61
Europe, Central 0.91 0.70 1.61
Europe, Eastern 1.50 1.23 2.73
North America, High Income 2.94 2.12 5.06
Caribbean 0.21 0.16 0.37
Latin America, Andean 0.19 0.16 0.35
Latin America, Central 0.54 0.88 1.42
Latin America, Southern 0.52 0.35 0.87
Latin America, Tropical 0.90 0.91 1.81
North Africa/Middle East 0.61 1.24 1.85
Sub-Saharan Africa, Central 0.11 0.07 0.18
Sub-Saharan Africa, East 0.49 0.31 0.80
Sub-Saharan Africa, Southern 0.17 0.10 0.27
Sub-Saharan Africa, West 0.37 0.24 0.61
Total 28.10 17.49 45.59
17

ALZHEIMER’S DISEASE INTERNATIONAL
CostsThe highest annual costs (Table 18) occur in the regions North America High Income and Europe Western, about 260-270 billions US$.
Table 18 Worldwide costs of dementia in 2015 (billion US$), (WHO GBD classification). Derived from WAR 2015
WHO GBD region Direct medical costs Social sector costs Informal care costs Total costs
bUS$ Prop. bUS$ Prop. bUS$ Prop. bUS$ Prop.
Australasia 0.98 0.6% 7.10 2.2% 6.03 1.8% 14.10 1.7%
Asia Pacific High Income 6.98 4.4% 56.38 17.2% 46.55 14.1% 109.90 13.4%
Oceania 0.03 0.0% 0.01 0.0% 0.12 0.0% 0.16 0.0%
Asia Central 0.34 0.2% 0.29 0.1% 0.52 0.2% 1.16 0.1%
Asia East 2.24 1.4% 10.20 3.1% 30.50 9.2% 42.93 5.2%
Asia South 0.48 0.3% 0.15 0.0% 3.84 1.2% 4.47 0.5%
Asia Southeast 2.68 1.7% 1.33 0.4% 3.27 1.0% 7.27 0.9%
Europe Western 50.78 31.9% 112.97 34.5% 98.87 29.9% 262.62 32.1%
Europe Central 2.82 1.8% 3.06 0.9% 9.13 2.8% 15.01 1.8%
Europe Eastern 5.66 3.6% 4.86 1.5% 12.98 3.9% 23.49 2.9%
North America High Income 61.08 38.4% 115.52 35.2% 92.32 27.9% 268.92 32.9%
Caribbean 0.76 0.5% 0.77 0.2% 2.02 0.6% 3.55 0.4%
Latin America Andean 0.20 0.1% 0.37 0.1% 0.57 0.2% 1.14 0.1%
Latin America Central 6.23 3.9% 5.46 1.7% 4.21 1.3% 15.89 1.9%
Latin America Southern 2.81 1.8% 2.55 0.8% 4.76 1.4% 10.13 1.2%
Latin America Tropical 5.74 3.6% 5.21 1.6% 4.66 1.4% 15.61 1.9%
North Africa/Middle East 8.46 5.3% 1.21 0.4% 7.01 2.1% 16.68 2.0%
Sub-Saharan Africa Central 0.09 0.1% 0.04 0.0% 0.17 0.1% 0.30 0.0%
Sub-Saharan Africa East 0.31 0.2% 0.15 0.0% 1.01 0.3% 1.47 0.2%
Sub-Saharan Africa Southern 0.37 0.2% 0.18 0.1% 1.70 0.5% 2.25 0.3%
Sub-Saharan Africa West 0.18 0.1% 0.09 0.0% 0.53 0.2% 0.80 0.1%
All 159.19 100% 327.90 100% 330.77 100% 817.86 100%
18

GLOBAL ESTIMATES OF INFORMAL CARE
Caregiving time and costs comparedWhen we integrate proportions of informal care hours and costs of informal care (Table 19), the most obvious discrepancy is between the high income regions (Australasia, Asia Pacific High Income, Europe Western and North America High Income), where proportions of costs are much higher than proportions of hours, in contrast to low income countries.
DiscussionAs discussed in WAR 2010 and 2015, global estimates of resource use and costs are difficult to make due to uncertainty of data and lack of data from many countries. Thus the results in this report must be regarded as estimates and not exact figures. Despite the uncertainty, we think that some results stand out and are of great interest.
First, the amounts of informal care are enormous, more than 80 billion hours per year, corresponding to more than 40 million full time workers.
Second, when the distribution of costs and the distribution of informal care hours in different regions of the world are compared, the patterns are completely different. While costs are extremely concentrated in high income countries, the number of hours are higher in LMIC.
Third, women produce by far most hours of informal care. The increasing participation of women in the workforce, which is a positive trend, will consequently reduce their availability as informal carers. This shift from the availability of informal care to the need for increased formal care in dementia will be a big challenge.
Dementia care is complex and an approach by asking about the “main carer” may result in answers reflecting gender roles (“female” care activities such as basic ADLs and IADLs such as food preparation; “male” including some IADL activities). Nevertheless, there is no doubt that women are the main providers of informal care worldwide78.
Cost of illness (COI) studies are of great interest for identifying how resource use and costs are distributed amongst different payers and also in different parts of the world. However, COI studies say nothing about the quality of care or the burden of a disorder. Thus it is of importance to use a palette of various approaches to get a comprehensive view of how a particular disorder influences different sectors of society, from the personal-individual level to the societal level. In that regard, a presentation of the amounts of informal care hours, is an important contribution.
A high amount of carer time does not necessarily imply a high burden. Most carers regard every hour of informal care as an important part of their, and the family member with dementia’s lives. However, being an informal carer is also related to a problematic situation that affects their life in many ways. Thus, we regard amounts of informal care as an important piece in the discussions of the situation for people living with dementia and their family members.
The estimates in this paper, an average of about 6 hours per day including supervision time, may perhaps be regarded as a rather low figure, since higher figures have been found previously79. However, as much as possible, we have tried to have a population based view, indicating that people with dementia, with
WHO GBD region Proportion of hours of informal care
Proportion of costs of informal care
Australasia 0.4% 1.8%
Asia Pacific High Income 5.7% 14.1%
Oceania 0.1% 0.0%
Asia Central 0.8% 0.2%
Asia East 25.8% 9.2%
Asia South 9.5% 1.2%
Asia Southeast 6.1% 1.0%
Europé Western 12.3% 29.9%
Europe Central 3.5% 2.8%
Europe Eastern 6.0% 3.9%
North America High Income 11.1% 27.9%
Caribbean 0.8% 0.6%
Latin America Andean 0.8% 0.2%
Latin America Central 3.1% 1.3%
Latin America Southern 1.9% 1.4%
Latin America Tropical 4.0% 1.4%
North Africa / Middle East 4.1% 2.1%
Sub-Saharan Africa Central 0.4% 0.1%
Sub-Saharan Africa East 1.8% 0.3%
Sub-Saharan Africa Southern 0.6% 0.5%
Sub-Saharan Africa West 1.3% 0.2%
Total 100% 100%
Table 19 Proportions of informal care hours and costs of informal care in different WHO GBD regions
19

ALZHEIMER’S DISEASE INTERNATIONAL
very low or no need of informal care (such as very mild dementia, which constitute a significant proportion of the numbers of people with dementia) are included. Such people can be identified in population based studies. It is very common, however, to use clinical or convenience samples when amounts of informal care and other resource use items in dementia are analyzed. Such samples are by definition known to the care systems (“users”). However, as shown in a recent Swedish paper, there are great risks of overestimates of both formal and informal care time if a “user” viewpoint is applied80.
The figures in this paper are based on WAR 2010 and WAR 2015. No new systematic review has been accomplished. This is a limitation, but we regard that carer time figures are quite stable over time.
Most people with dementia are old and also have other conditions that influence their functional capacity and need of support. Thus it may be difficult to separate the carer time that is related to the dementia solely. One option is to compare people with and without dementia. In a Swedish population based study42, people with dementia received 6 times more informal care than those without dementia.
Implications for the futureThe number of people living with dementia is expected to increase from almost 50 million today (2018) to about 82 million in 2030. The majority live in LMICs and this trend will be even stronger in the future (Figure 2). It is also in LMIC where the contribution of informal carers, mainly women, is greatest.
Figure 2 The growth in numbers of people with dementia (millions) in high and low and middle income countries (source: World Alzheimer Report 2015)
Although the comparison between the numbers of informal care hours and the corresponding numbers of full time workers is a simplification, it highlights the future challenges we face. Everything else unchanged, 40 million full time workers in 2015 correspond to almost 65 million full time workers in 2030. Great societal changes in family structures (such as generational split, migration, women in the workforce) will, for dementia care, probably result in a shift from informal care to a greater need for different kinds of formal care (home support, day care, long term care). This scenario presents a great challenge for society in terms of financing, staff recruitment and training. Employers will also need to be aware of the growing number of employees that will be affected by care giving and recognize that the carer role may be split between various different members of a family.
Equally, governments and policy makers will need to plan ahead to ensure that clear dementia policy exists to enable the health and social care economy to cope with increased numbers of people living with dementia and their support needs. Dementia not only affects whole families – it also impacts entire economies. It will require a whole-systems approach to tackle the challenges outlined in this report through joined-up, cohesive, and financed national dementia plans that will enable governments to best meet the needs of people living with dementia and their families.
20

GLOBAL ESTIMATES OF INFORMAL CARE
References
1. Wimo A, Guerchet M, Ali GC, et al. The worldwide costs of dementia 2015 and comparisons with 2010. Alzheimers Dement 2016; 13: 1-7.
2. Prince M, Wimo A, Guerchet M, Ali GC, Wu Y-T, Prina M. World Alzheimer Report 2015 . The Global Impact of Dementia. An analysis of prevalence, incidence, costs and trends. London: Alzheimer’s Disease International, 2015.
3. Winblad B, Amouyel P, Andrieu S, et al. Defeating Alzheimer’s disease and other dementias: a priority for European science and society. Lancet Neurol 2016; 15(5): 455-532.
4. Almberg B, Grafstrom M, Krichbaum K, Winblad B. The interplay of institution and family caregiving: relations between patient hassles, nursing home hassles and carers’ burnout. Int J Geriatr Psychiatry 2000; 15(10): 931-9.
5. Jansson W, Almberg B, Grafstrom M, Winblad B. The Circle Model--support for relatives of people with dementia. Int J Geriatr Psychiatry 1998; 13(10): 674-81.
6. Max W, Webber P, Fox P. Alzheimer’s disease. The unpaid burden of caring. J Aging Health 1995; 7(2): 179-99.
7. Wimo A, Winblad B, Grafstrom M. The social consequences for families with Alzheimer’s disease patients: potential impact of new drug treatment. Int J Geriatr Psychiatry 1999; 14(5): 338-47.
8. Schulz R, Beach SR. Caregiving as a risk factor for mortality: the Carer Health Effects Study. Jama 1999; 282(23): 2215-9.
9. Wimo A, Jonsson L, Bond J, Prince M, Winblad B. The worldwide economic impact of dementia 2010. Alzheimers Dement 2013; 9(1): 1-11 e3.
10. ADI. World Alzheimer Report 2010: The global economic impact of dementia. London, 2010.
11. Nordberg G, von Strauss E, Kareholt I, Johansson L, Wimo A. The amount of informal and formal care among non-demented and demented elderly persons-results from a Swedish population-based study. Int J Geriatr Psychiatry 2005; 20(9): 862-71.
12. Wimo A, von Strauss E, Nordberg G, Sassi F, Johansson L. Time spent on informal and formal care giving for persons with dementia in Sweden. Health Policy 2002; 61(3): 255-68.
13. Langa KM, Chernew ME, Kabeto MU, et al. National estimates of the quantity and cost of informal caregiving for the elderly with dementia. J Gen Intern Med 2001; 16(11): 770-8.
14. Moore MJ, Zhu CW, Clipp EC. Informal costs of dementia care: estimates from the National Longitudinal Carer Study. J Gerontol B Psychol Sci Soc Sci 2001; 56(4): S219-28.
15. Rice DP, Fox PJ, Max W, et al. The economic burden of Alzheimer’s disease care. Health Aff (Millwood) 1993; 12(2): 164-76.
16. Stommel M, Collins CE, Given BA. The costs of family contributions to the care of persons with dementia. Gerontologist 1994; 34(2): 199-205.
17. Feldman H, Gauthier S, Hecker J, et al. Efficacy of donepezil on maintenance of activities of daily living in patients with moderate to severe Alzheimer’s disease and the effect on carer burden. J Am Geriatr Soc 2003; 51(6): 737-44.
18. Mesterton J, Wimo A, By A, Langworth S, Winblad B, Jonsson L. Cross Sectional Observational Study on the Societal Costs of Alzheimer’s Disease. Curr Alzheimer Res 2009.
19. Gustavsson A, L J, Rapp T, et al. Differences in resource use and costs of dementia care between European countries: baseline data from the ICTUS study J Nutr Health Aging (in press) 2010.
20. Lopez-Bastida J, Serrano-Aguilar P, Perestelo-Perez L, Oliva-Moreno J. Social-economic costs and quality of life of Alzheimer disease in the Canary Islands, Spain. Neurology 2006; 67(12): 2186-91.
21. Neubauer S, Holle R, Menn P, Grossfeld-Schmitz M, Graesel E. Measurement of informal care time in a study of patients with dementia. Int Psychogeriatr 2008; 20(6): 1160-76.
22. Zencir M, Kuzu N, Beser NG, Ergin A, Catak B, Sahiner T. Cost of Alzheimer’s disease in a developing country setting. Int J Geriatr Psychiatry 2005; 20(7): 616-22.
23. Ersek K, Kovacs A, Wimo A, et al. Costs of dementia in Hungary Journal of Nutrition, Health and Aging 2010: (in press).
24. ADI. World Alzheimer Report 2009. London: ADI, 2009.
25. Wang H, Gao T, Wimo A, Yu X. Carer time and cost of home care for Alzheimer’s disease: a clinic-based observational study in Beijing, China. Ageing Int (in press) 2010.
26. Leon J, Cheng CK, Neumann PJ. Alzheimer’s disease care: costs and potential savings. Health Aff (Millwood) 1998; 17(6): 206-16.
27. Albert SM, Sano M, Bell K, Merchant C, Small S, Stern Y. Hourly care received by people with Alzheimer’s disease: results from an urban, community survey. Gerontologist 1998; 38(6): 704-14.
28. Manton KG, Corder LS, Clark R. Estimates and projections of dementia-related service expenditures. In: Suzman R, Singer B, Manton KG, eds. Forecasting the health of the oldest old. New York: Springer; 1993: 207-38.
29. Zhu CW, Scarmeas N, Torgan R, et al. Clinical characteristics and longitudinal changes of informal cost of Alzheimer’s disease in the community. J Am Geriatr Soc 2006; 54(10): 1596-602.
30. Feldman HH, Van Baelen B, Kavanagh SM, Torfs KE. Cognition, function, and caregiving time patterns in patients with mild-to-moderate Alzheimer disease: a 12-month analysis. Alzheimer Dis Assoc Disord 2005; 19(1): 29-36.
31. Hux MJ, O’Brien BJ, Iskedjian M, Goeree R, Gagnon M, Gauthier S. Relation between severity of Alzheimer’s disease and costs of caring. Cmaj 1998; 159(5): 457-65.
32. Zhu CW, Scarmeas N, Torgan R, et al. Clinical features associated with costs in early AD: baseline data from the Predictors Study. Neurology 2006; 66(7): 1021-8.
33. Nichols LO, Chang C, Lummus A, et al. The cost-effectiveness of a behavior intervention with carers of patients with Alzheimer’s disease. J Am Geriatr Soc 2008; 56(3): 413-20.
34. Zhu CW, Torgan R, Scarmeas N, et al. Home health and informal care utilization and costs over time in Alzheimer’s disease. Home Health Care Serv Q 2008; 27(1): 1-20.
35. Allegri RF, Butman J, Arizaga RL, et al. Economic impact of dementia in developing countries: an evaluation of costs of Alzheimer-type dementia in Argentina. Int Psychogeriatr 2007; 19(4): 705-18.
36. Lowin A, Knapp M, McCrone P. Alzheimer’s disease in the UK: comparative evidence on cost of illness and volume of health services research funding. Int J Geriatr Psychiatry 2001; 16(12): 1143-8.
37. Luengo-Fernandez R, Leal J, Gray A. Dementia 2010. Oxford: The Health Economics Research Centre, University of Oxford, 2010.
38. Knapp M, Prince M. Dementia UK. London: Alzheimer’s Society, 2007.
39. Moraes SR, Silva LS. An evaluation of the burden of Alzheimer patients on family carers. Cad Saude Publica 2009; 25(8): 1807-15.
40. Souetre EJ, Qing W, Vigoureux I, et al. Economic analysis of Alzheimer’s disease in outpatients: impact of symptom severity. Int Psychogeriatr 1995; 7(1): 115-22.
41. Wimo A, von Strauss E, Nordberg G, Johannsson L. Time spent on informal and formal care giving for persons with dementia in Sweden. Health Policy 2002; 61: 255-68.
42. Nordberg G, von Strauss E, Kåreholt I, Johansson L, Wimo A. The amount of informal and formal care among non-demented and demented elderly persons - results from a Swedish population based study. in press 2005.
43. Wimo A, Winblad B, Shah SN, Chin W, Zhang R, McRae T. Impact of donepezil treatment for Alzheimer’s disease on carer time. Curr Med Res Opin 2004; 20(8): 1221-5.
44. Wimo A, Nordberg G, Jansson W, Grafstrom M. Assessment of informal services to demented people with the RUD instrument. Int J Geriatr Psychiatry 2000; 15(10): 969-71.
45. Cavallo MC, Fattore G. The economic and social burden of Alzheimer disease on families in the Lombardy region of Italy. Alzheimer Dis Assoc Disord 1997; 11(4): 184-90.
46. Coduras A, Rabasa I, Frank A, et al. Prospective one-year cost-of-illness study in a cohort of patients with dementia of Alzheimer’s disease type in Spain: the ECO study. J Alzheimers Dis; 19(2): 601-15.
47. Beeri MS, Werner P, Adar Z, Davidson M, Noy S. Economic cost of Alzheimer disease in Israel. Alzheimer Dis Assoc Disord 2002; 16(2): 73-80.
48. Dias A, Samuel R, Patel V, Prince M, Parameshwaran R, Krishnamoorthy ES. The impact associated with caring for a person with dementia: a report from the 10/66 Dementia Research Group’s Indian network. Int J Geriatr Psychiatry 2004; 19(2): 182-4.
21

ALZHEIMER’S DISEASE INTERNATIONAL
49. Bruce DG, Paley GA, Nichols P, Roberts D, Underwood PJ, Schaper F. Physical disability contributes to carer stress in dementia carers. J Gerontol A Biol Sci Med Sci 2005; 60(3): 345-9.
50. Kumamoto K, Arai Y, Zarit SH. Use of home care services effectively reduces feelings of burden among family carers of disabled elderly in Japan: preliminary results. Int J Geriatr Psychiatry 2006; 21(2): 163-70.
51. Anonymous. The Dementia Epidemic: Economic Impact and Positive Solutions for Australia. Canberra: Access Economics PTY Limited, 2003.
52. Anonymous. Dementia Economic Impact Report 2008: Access Economics PTY Limited, 2008.
53. Suh GH, Knapp M, Kang CJ. The economic costs of dementia in Korea, 2002. Int J Geriatr Psychiatry 2006; 21(8): 722-8.
54. Wang G, Cheng Q, Zhang S, et al. Economic impact of dementia in developing countries: an evaluation of Alzheimer-type dementia in Shanghai, China. J Alzheimers Dis 2008; 15(1): 109-15.
55. Papastavrou E, Kalokerinou A, Papacostas SS, Tsangari H, Sourtzi P. Caring for a relative with dementia: family carer burden. J Adv Nurs 2007; 58(5): 446-57.
56. Prince M. Care arrangements for people with dementia in developing countries. Int J Geriatr Psychiatry 2004; 19(2): 170-7.
57. Uwakwe R. Satisfaction with dementia care--giving in Nigeria--a pilot investigation. Int J Geriatr Psychiatry 2006; 21(3): 296-7.
58. Moise P, Schwarzinger M, Um M-Y, al. e. Dementia care in 9 OECD countries. A comparative analysis. Paris: OECD, 2004.
59. Anonymous. Caregiving in the U.S. Executive summary: National Alliance for Caregiving, 2009.
60. Raccichini A, Castellani S, Civerchia P, Fioravanti P, Scarpino O. The carer’s burden of Alzheimer patients: differences between live-in and non-live-in. Am J Alzheimers Dis Other Demen 2009; 24(5): 377-83.
61. Germain S, Adam S, Olivier C, et al. Does cognitive impairment influence burden in carers of patients with Alzheimer’s disease? J Alzheimers Dis 2009; 17(1): 105-14.
62. Serrano-Aguilar PG, Lopez-Bastida J, Yanes-Lopez V. Impact on Health-Related Quality of Life and Perceived Burden of Informal Carers of Individuals with Alzheimer’s Disease. Neuroepidemiology 2006; 27: 136–42.
63. Rigaud AS, Fagnani F, Bayle C, Latour F, Traykov L, Forette F. Patients with Alzheimer’s disease living at home in France: costs and consequences of the disease. J Geriatr Psychiatry Neurol 2003; 16(3): 140-5.
64. Thomas P, Lalloue F, Preux PM, et al. Dementia patients carers quality of life: the PIXEL study. Int J Geriatr Psychiatry 2006; 21(1): 50-6.
65. Muangpaisan W, Praditsuwan R, Assanasen W, et al. Carer Burden and Needs of Dementia Carers in Thailand: A Cross-Sectional Study. J Med Assoc Thai 2010; 93(5): 601-7.
66. AIHW. Dementia in Australia National data analysis and development. Canberra: Australian Institute of Health and Welfare., 2007.
67. Patterson TL, Semple SJ, Shaw WS, et al. The cultural context of caregiving: a comparison of Alzheimer’s carers in Shanghai, China and San Diego, California. Psychol Med 1998; 28(5): 1071-84.
68. Liu Z, Albanese E, Li S, et al. Chronic disease prevalence and care among the elderly in urban and rural Beijing, China - a 10/66 Dementia Research Group cross-sectional survey. BMC Public Health 2009; 9: 394.
69. Demensförbundet Sammanställning av Demensförbundets anhörigenkät (The Swedish dementia association’s carer survey). Stockholm: Demensförbundet, 2003.
70. Souetre E, Thwaites RM, Yeardley HL. Economic impact of Alzheimer’s disease in the United Kingdom. Cost of care and disease severity for non-institutionalised patients with Alzheimer’s disease. Br J Psychiatry 1999; 174: 51-5.
71. Campbell P, Wright J, Oyebode J, et al. Determinants of burden in those who care for someone with dementia. Int J Geriatr Psychiatry 2008; 23(10): 1078-85.
72. Chiu L, Tang KY, Liu YH, Shyu WC, Chang TP. Cost comparisons between family-based care and nursing home care for dementia. J Adv Nurs 1999; 29(4): 1005-12.
73. Kang IO, Lee SY, Kim SY, Park CY. Economic cost of dementia patients according to the limitation of the activities of daily living in Korea. Int J Geriatr Psychiatry 2007; 22(7): 675-81.
74. ILO. International Labour Organization; 2018.
75. ILO. Laborsta Internet. ILO; 2010.
76. WHO. GBD Region Codelist. 2016. http://apps.who.int/gho/data/node.metadata.GBDREGION?lang=en (accessed 2017-05-01 2017).
77. UN. World Urbanization Prospects The 2009 Revision UN; 2009.
78. Wimo A, Prince M. World Alzheimer Report 2010. The global economic impact of dementia. London, 2010.
79. McDaid D. Estimating the costs of informal care for people with Alzheimer’s disease: methodological and practical challenges. Int J Geriatr Psychiatry 2001; 16(4): 400-5.
80. Wimo A, Elmstahl S, Fratiglioni L, et al. Formal and Informal Care of Community-Living Older People: A Population-Based Study from the Swedish National Study on Aging and Care. J Nutr Health Aging 2017; 21(1): 17-24.
22

About ADI
Alzheimer’s Disease International (ADI) is the international federation of Alzheimer associations throughout the world. Each of our 90 members is a non-profit Alzheimer association supporting people with dementia and their families. ADI’s mission is to strengthen and support Alzheimer associations, to raise awareness about dementia worldwide, to make dementia a global health priority, to empower people with dementia and their care partners, and to increase investment in dementia research.
What we do• Support the development and activities of our member associations around the world.
• Encourage the creation of new Alzheimer associations in countries where there is no organisation.
• Bring Alzheimer organisations together to share and learn from each other.
• Raise public and political awareness of dementia.
• Stimulate research into the prevalence and impact of Alzheimer’s disease and dementia around the world.
• Represent people with dementia and families on international platforms at the UN and WHO.
Key activities• Raising global awareness through World Alzheimer’s Month™ (September every year).
• Providing Alzheimer associations with training in running a non-profit organisation through our Alzheimer University programme.
• Hosting an international conference where staff and volunteers from Alzheimer associations meet each other as well as medical and care professionals, researchers, people with dementia and their carers.
• Disseminating reliable and accurate information through our website and publications.
• Supporting the 10/66 Dementia Research Group’s work on the prevalence and impact of dementia in developing countries.
• Supporting global advocacy by providing facts and figures about dementia, and monitoring as well as influencing dementia policies.
ADI is based in London and is registered as a non-profit organisation in the USA. ADI was founded in 1984, has been in official relations with the World Health Organization since 1996 and has had consultative status with the United Nations since 2012. ADI is partnered with Dementia Alliance International (DAI), a collaboration of individuals diagnosed with dementia providing a unified voice of strength, advocacy and support in the fight for individual autonomy for people with dementia.
You can find out more about ADI at www.alz.co.uk/adi

Alzheimer’s Disease International: The International Federation of Alzheimer’s Disease and Related Disorders Societies, Inc. is incorporated in Illinois, USA, and is a 501(c)(3) not-for-profit organization
Alzheimer’s Disease International64 Great Suffolk StreetLondon SE1 0BLUKTel: +44 20 79810880www.alz.co.uk