Embed Size (px)
Citation preview

For Professional Investors or Advisors OnlySchroder International Selection Fund is referred to as Schroder ISF throughout this presentation
June 2012
Virginie Maisonneuve
Head of Global and International Equities, Global and International Portfolio Manager
Global Equities“Fragmentation in the Global Village"

Framing Our Investment Decisions:World Shaping Trends
Super Cycle
Climate Change
Demographics
Fragmentation In The Global Village
Demographics

Fragmentation in the Global Village:
A Structural Rise in Volatility?

Investing in an Increasingly Volatile World:
• Global village:
– ‘The widening, deepening and speeding up of worldwide interconnectedness in all aspects of contemporary life’
– Facilitated by technology
– Increasing trade and capital flows
• Fragmentations
– Adds complexity to the dynamics of globalisation and investment analysis
– May materialize in conflicts, drive economic divergence or add confusion to decision-making processes
– May create unpredictable patterns of volatility contrary to the usual “sector / region / country” lines?
Growing fragmentation within the ““““global village””””

0
5
10
15
20
25
19
48
19
50
19
52
19
54
19
56
19
58
19
60
19
62
19
64
19
66
19
68
19
70
19
72
19
74
19
76
19
78
19
80
19
82
19
84
19
86
19
88
19
90
19
92
19
94
19
96
19
98
20
00
20
02
20
04
20
06
20
08
20
10
Services Goods
Global Village:
• Multinational co. earnings vs listing (half of S&P 500 revenue now from overseas)
Global exports 1948-2010, USD Insert - Leading economies by trade in goods
Source: World Trade Organization
Growing trade and capital flows
Trillions
0
200
400
600
800
1000
1200
1400
1600
1800
80 280 480 680 880 1080 1280Exports
(Billion USD)
United States
China
Germany
JapanFrance
Netherlands
Imports
(Billion USD)

*Estimates do not total 100% due to roundingSource: Rassweiler
Sum of Its Parts
Value of iPhone 3Gcomponents and labor*
$178.96
Global Village: the iPhone, a Symbol
Countries are mentioned for illustrative purposes only and should not be viewed as a recommendation to buy/sell.Source: Image Courtesy of Apple
Growing trade and capital flows : designed in California, assembled in China…

• International media: CNN now available to >2bn people in >200 countries
• Communications technology: mobile penetration almost 80%, >4000 tweets per second
• Rise of the global community: shared culture and values
Global Village:
Global Mobile and Internet Penetration
“The widening, deepening and
speeding up of worldwide
interconnectedness in all
aspects of contemporary life.”
Source: World Bank, World development indicators 2009
Social/cultural dimension
0
10
20
30
40
50
60
70
80
90
199019911992199319941995199619971998199920002001200220032004200520062007200820092010
Internet - World Mobile - World

Fragmentation in the Global Village: Emergence of new fragmentations
Social Fragmentation
AttentionFragmentation
Economic fragmentation
Political fragmentation

0
2
4
6
8
10
12
World Advanced economies Emerging marketeconomies
United states G-7 China, India and Brazil
1973-1985 1986-2007 2008-2009
Contribution to Global Growth
Contribution to global growth by group and region, 1973-2009
Source: Brookings Institution, Emerging Markets, p 34-35Notes: Share contributions are derived by dividing world GDP growth by group/region growth. Growth is calculated suing PPP exchange rates
(in percent)
Economic growth: 20 year Perspective, the Birth of a New World

Economic Fragmentation:
• Economic divergence in highly connected and relatively homogenous units
• New phase for Europe?
1 Source: Thompson Datastream, Schroders. Updated May 15, 20112 Source: Thompson Datastream, Schroders. Updated May 22,, 2011
Convergence becomes divergence
10
0
5
10
15
20
25
30
35
40
45
50
Jan 09 Sep 09 May 10 Jan 11 Sep 11 May 12
10-year Govt. bond yield spreads over Bunds, %
Italy Greece Ireland Spain Portugal
Greece debt swap completed
Unemployment rates1
0
5
10
15
20
25
2005 2006 2007 2008 2009 2010 2011 2012
Spain Ireland Greece Germany Portugal
10-year Govt. bond yield spreads over Bunds, %

Economic Fragmentation:
Source: Economisthttp://www.economist.com/blogs/dailychart/2010/12/europes_economies
Convergence becomes divergence
11

Salary versus productivity in manufacturing - % change 2005-2009
0%
10%
20%
30%
40%
-20.00% -10.00% 0.00% 10.00% 20.00% 30.00% 40.00% 50.00%
Output per unit labour input
Sa
lary
pe
r u
nit
la
bo
ur
inp
ut
HIGHER UNITLABOUR COST
LOWER UNITLABOUR COST
UK
Spain
Greece
Korea Poland
GermanyItaly
US
Source: OECD Statistics, extracted 1/6/2012. N.B. Unit labour input in most cases equals hours worked, but equals persons employed for somecountries including the United States, United Kingdom and Poland. Japan is excluded because the most recent data points are for 2007.
Economic Fragmentation and Competitiveness:

Global Competitiveness: Europe, China and the USA.
Source: Oxford Economics, OECD.
Unit Labour Costs: 2008 = 100
China: still competitive but decreasingly
Europe: currency issue?Exchange rate adjusted unit labour costs
0
50
100
150
200
250
300
350
198
0
198
5
199
0
199
5
200
0
200
5
201
0
201
5
202
0
202
5
203
0
US Germany China
0.2
0.3
0.4
0.5
0.6
0.7
0.8
0.9
1
1.1
1993 1998 2003 2008
Greece Italy Portugal Spain
Euro adopted
Is Tennessee the new Guangdong?

52%
53%
54%
55%
56%
57%
58%
59%
60%
61%
4%
5%
6%
7%
8%
9%
10%
11%
12%
13%
14%
Fe
b 1
95
0
Aug
19
53
Fe
b 1
95
7
Aug
19
60
Fe
b 1
96
4
Aug
19
67
Fe
b 1
97
1
Aug
19
74
Fe
b 1
97
8
Aug
19
81
Fe
b 1
98
5
Aug
19
88
Fe
b 1
99
2
Aug
19
95
Fe
b 1
99
9
Aug
20
02
Fe
b 2
00
6
Aug
20
09
Corporate profit Employee compensation
Global Competitiveness: The US Adjustment
Source: GaveKal, US Bureau of Economic Analysis
QoQ annualised growth rate, 12 month centred moving avg
US profits versus wagesPrivate wages and unit labour costs decelerate
% of GDP
Falling US labour costs boost corporate profits…

15
16
17
18
19
20
21
20
22
24
26
28
30
32
34
2002 2003 2004 2005 2006 2007 2008 2009 2010 2011
MSCI China (LHS) S&P 500 (RHS)
Operating profit margin
Source: Bloomberg
Global Competitiveness:… while Chinese corporates adapt to higher costs

Economic Fragmentation: Working Towards a New Equilibrium?
Source: IMF
-8
-6
-4
-2
0
2
4
6
8
10
12
198
0
198
1
198
2
198
3
198
4
198
5
198
6
198
7
198
8
198
9
199
0
199
1
199
2
199
3
199
4
199
5
199
6
199
7
199
8
199
9
200
0
200
1
200
2
200
3
200
4
200
5
200
6
200
7
200
8
200
9
201
0
201
1
Current account balance % of GDP
China United States
Deleveraging the developed world and growing EM domestic consumption

France: 2012 presidential election Far-right candidate Marine Le Pen wins 18% of first round vote, beating previous record for Front National. Election dominated by anti-immigrant rhetoric.
UK: 2010 general election First hung parliament since 1974.
Italy: Nov 2011 Silvio Berlusconi forced to resign; technocratic government of entirely unelected officials formed by economist Mario Monti. Will remain in office until next elections in 2013.
Greece: 2012 parliamentary election Failure to form a government to replace technocratic “caretaker” government. Far-right Golden Dawn wins 7% of the vote, entering parliament for the first time with 21 seats.
Spain: 2011 general election Stable majority government formed but remaining voters polarised with separatist parties gaining ground.
Hungary: Jan 2012 New constitution enshrines anti-democratic principles, endangers EU/IMF bailout.
Netherlands: April 2012 Government collapses during budget talks.
Belgium Political instability with multiple government changes 2007-11.
Finland: 2011 parliamentary election Populist/nationalist True Finns win 19% of vote to become third largest party in parliament.
Political Fragmentation:Recent elections in Europe

Rising extremism- Marine Le Pen support rate in France
Source: Guardian
Rising tension among EU countries
Political Fragmentation:The rise of extremists’ movements in Europe: expression of social grievance?

Political Fragmentation:

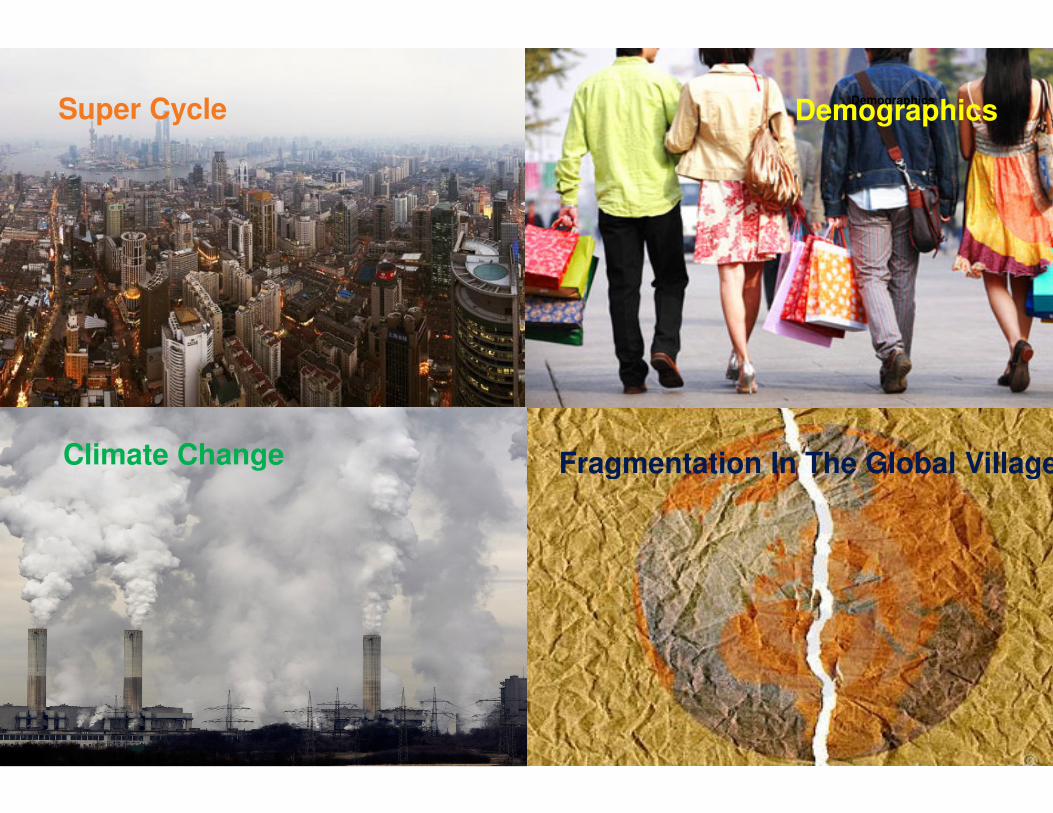
Social Fragmentation:
• Rising income inequality due to ‘‘‘‘skill premium’’’’ in the global labor market
• Richest 1% in the US earn 25% of all income (up from 13% in the early 1980s)
• Emerging markets remain highly unequal; China has seen the biggest increase in Gini coefficient
• Financial crisis has aggravated problem: low-skilled workers far more likely to be unemployed
Gini coefficient in the developed world2The ‘skill premium’ in the US1
Income inequality and the skill premium
1 Source: Bureau of Labor Statistics, Current Population Survey2 Source: IMF (2008), Rising Income Inequality: Technology, or Trade and Financial Globalisation?Countries are mentioned for illustrative purposes only and should not be viewed as a recommendation to buy/sell.
1.9
2.4
4.0
5.4
7.0
9.2
10.3
14.9
Unemployment rate in 2010 (%) Median weekly earnings in 2010($)
444
626
712
767
1,038
1,272
1,610
1,550Doctoral degree
Professional degree
Master’s degree
Bachelor’s degree
Associate’s degree
Some college, no degree
High school diploma
Less than a high school degree
Average : 8.2% Average : $782
25
35
45
1980 1985 1990 1995 2000 2005
United States
United Kingdom
Italy
Germany
Japan
France
20
Source: G. William Domhoff, Wealth, Income and Power
Top 1 percent43% of financial wealth
Bottom 88 percent7% of financial wealth
Social Fragmentation:Distribution of financial wealth in the United States, 2009

Source: CBPP calculations from congressional budget office data. www.mybudget360.com
Social Fragmentation:Income gains at the top dwarf those of the low-and middle-line households, 1979-2007
Percentage change in after-tax income since 1979
+281%
+95%
+25%+16%

New Dimensions of Loyalty and Conflict:
• Traditional religious, ethnic and tribal divides remain salient
• Now overlaid by new dimensions of group identity and notions of community
• Technology provides the means to bypass and challenge established structures e.g. Middle East
Number of ethnic conflicts starting in a given year
Source: Cederman et al (2008), “Ethnic Armed Conflict dataset”.
Belonging to a community – but which one?
0
2
4
6
8
10
12
14
19
46
19
47
19
48
19
49
19
50
19
51
19
52
19
53
19
54
19
55
19
56
19
57
19
58
19
59
19
60
19
61
19
62
19
63
19
64
19
65
19
66
19
67
19
68
19
69
19
70
19
71
19
72
19
73
19
74
19
75
19
76
19
77
19
78
19
79
19
80
19
81
19
82
19
83
19
84
19
85
19
86
19
87
19
88
19
89
19
90
19
91
19
92
19
93
19
94
19
95
19
96
19
97
19
98
19
99
20
00
20
01
20
02
20
03
20
04
20
05
Fall of the Soviet Union and Yugoslavia

Attention Fragmentation:
• Many professionals now own 5 – 6 connected devices, meaning constant distractions
• Studies suggest there is an optimal amount of information, beyond which we make worse decisions
• Overloaded investors lose sight of long-term trends: average holding period has fallen from 7 years to 7 months since 1970s
• Short-termism causes excessive volatility and poor performance
Information overload
Netbook owners
Portable media
player owners
Portable game
player owners
eBooks owners
Tablet owners
Average # of Connected Devices Owned
6
5
5
5
4
Source: The Nielsen Company

Fragmentation Leads to Higher Equity Market Volatility
Source: CBOE, Morgan Stanley Research, as at 31th May 2012
Volatility remains high
0
10
20
30
40
50
60
70
80
00 01 02 03 04 05 06 08 09 10 11
VIX Index 3 Week Average
Earnings risk at a 70-year high
0%
50%
100%
150%
200%
250%
300%
40 44 47 51 55 59 62 66 70 74 77 81 85 89 92 96 00 04 07 11
Rolling 5-Yr Std Deviation of Y/Y EPS Growth for SP 500
Source: BofA ML US Equity & Quant Strategy, as at 30 September 2011

Fragmentation Leads to Higher Equity Market Volatility
Source: CBOE, Morgan Stanley Research, as at 31th May 2012
Volatility remains high
0
10
20
30
40
50
60
70
80
00 01 02 03 04 05 06 08 09 10 11
VIX Index 3 Week Average
Source: BofA ML US Equity & Quant Strategy, as at 30 September 2011
31-Dec-1017-Mar-11
17-Mar-112-May-11
2-May-114-0ct-11
4-Oct-1128-Oct-11
28-Oct-1121-Nov-11
Materials (4.97)% 12.75% (32.24)% 25.01% (13.63)%
Financials 1.36% 7.01% (30.96)% 21.45% (15.20)%
Energy 8.67% 6.58% (27.76)% 25.20% (8.93)%
Industrials 0.93% 10.20% (27.59)% 19.54% (9.65)%
Consumer Discretionary (1.71)% 9.86% (19.43)% 16.35% (9.75)%
Information Technology (2.02)% 7.68% (14.31)% 14.50% (7.47)%
Telecommunication Services 1.30% 9.11% (14.05)% 10.22% (6.94)%
Utilities (1.58)% 7.92% (12.66)% 7.75% (6.50)%
Health Care 0.78% 12.28% (12.47)% 9.91% (6.96)%
Consumer Staples (2.45)% 11.45% (8.65)% 9.01% (4.92)%
MSCI World 0.32% 9.17% (21.98)% 16.81% (9.65)%
The last two periods of rotation were especially short: 4 weeks each
Best performing sectors
2011 – Sector Performance has rotated violently
26

Conclusion
• The new “Fragmentations in the global village” are on going, long term themes
• They contribute to rising macro risk as the world attempts to find a new equilibrium in a shifting economic growth environment
• …And makes fundamental investing into quality growth companies more compelling

For Professional Investors only. Not Suitable for Retail Clients
This presentation contains indicative terms for discussion purposes only and is not intended to provide the sole basis for evaluation of the instruments described. It is not intended as promotional material in any respect. The material is not intended as an offer or solicitation for the purchase or sale of any financial instrument. The material is not intended to provide, and should not be relied on for, accounting, legal or tax advice, or investment recommendations. Information herein is believed to be reliable but Schroder Investment Management Ltd (Schroders) does not warrant its completeness or accuracy. No responsibility can be accepted for error of fact or opinion. This does not exclude or restrict any duty or liability that Schroders has to its customers under the Financial Services and Markets Act 2000 (as amended from time to time) or any other regulatory system.
Past Performance is not a guide to future performance and may not be repeated. The value of investments and the income from them may go down as well as up and investors may not get back the amounts originally invested. Exchange rates may cause the value of overseas investments and the income from them to rise or fall.
The forecasts stated in the presentation are the result of statistical modelling, based on a number of assumptions. Forecasts are subject to a high level of uncertainty regarding future economic and market factors that may affect actual future performance. The forecasts are provided to you for information purposes as at today's date. Our assumptions may change materially with changes in underlying assumptions that may occur, among other things, as economic and market conditions change. We assume no obligation to provide you with updates or changes to this data as assumptions, economic and market conditions, models or other matters change.
This document does not purport to describe the business or affairs of any issuer and is not being provided for delivery to or review by any prospective purchaser so as to assist the prospective purchaser to make an investment decision in respect of securities being sold in a distribution. Schroder Investment Management Limited is not engaging in or holding itself out as engaging in the business of advising others as to the investing in or the buying or selling of securities in any jurisdiction in which it is not authorized to do so.
For the purposes of the Data Protection Act 1998, the data controller in respect of any personal data you supply is Schroder Investment Management Limited. Personal information you supply may be processed for the purposes of investment administration by any company within the Schroders Group and by third parties who provide services and such processing and which may include the transfer of data outside of the European Economic Area. Schroder Investment Management Limited may also use such information to advise you of other services or products offered by the Schroder Group unless you notify it otherwise in writing.
Issued in June 2011 by Schroder Investment Management Limited, 31 Gresham Street, London EC2V 7QA
Registered in England and Wales Registration No 1893220
Authorised and regulated by the Financial Services Authority
Telephone: 020 7658 6000 Fax: 020 7658 6965
For your security, communications may be taped or monitored.
Disclosure statementImportant Information