Embed Size (px)
Citation preview

Global EmployeeBenefits Watch 2017/18The next wave of globalization and digitization

2 | Global Employee Benefits Watch 2017/18

Global Employee Benefits Watch 2017/18 | 3
ContentsForeword 5
Executive summary 6
Introduction 8
Evolution of the global benefits blueprint 11 More organizations look to the future The importance of strategy alignment The value of focusing your impact on the employee The balancing-act between ambition and reality Embracing a lean HR approach for benefits More people are adopting an HR shared service model Globally consistent technology is proving its worth The benchmark set by those following the blueprint
Benefits shift from reward to experience 35The voice of the employee The new-found prominence of wellbeing The emergence of the marketing mindset The role of technology in engagement The marketing mindset and success
Analytics: Hope is not a strategy 47From foresight to insight for early adopters With new data comes fresh thinking The mantra that remains true today – to measure is to manage
Conclusion 63
Methodology 65
Appendix 66
About Thomsons Online Benefits 67

4 | Global Employee Benefits Watch 2017/18

Global Employee Benefits Watch 2017/18 | 5
ForewordMichael Whitfield and I set up Thomsons Online Benefits in 2000 and, within a few years, set our ambitions beyond the success we were building in the UK benefits market. We had one clear vision: for organizations to automate their administration, create an engaging experience for their employees and have visibility into their benefits spend and trend data. In 2002 a large multinational organization seized this opportunity and went live in eight countries simultaneously in March 2003. With that, the global benefits Darwin market was born.
Some 17 years later, I am delighted to see that this 2017/18 Global Benefits Watch report shows that now, global benefits management is far from being something adopted only by young high-growth technology companies with simplified benefit structures. Rather, it has become the naturally chosen approach for the majority of global multinationals as they look at a way to deliver on their strategic vision for benefits and use technology to implement benefit strategies that help create healthier, happier and more engaged employees.
This has meant that we have witnessed an exciting change in the role of the global reward function as part of an increasingly lean and digitized HR team, and an evolution of our business as a result.
A decade ago, global benefits maturity looked like closely associated global principles, with little consistency on the ground in local markets.
Then, as Thomsons helped fuel the adoption of global benefits technology, organizations were primarily focused on reducing administration. The next wave of change we initiated through Darwin brought with it great employee experience, and in the last couple of years, analytics has brought the most significant wave yet.
Most recently – in December 2016 – our time as a privately owned company came to an end and we were acquired by Mercer. One year in and we have seen incredible advantages of this acquisition, as well as the funding to support our growth and ability to further develop the global benefits market. Providers around the world have queued up to strengthen their integration with us. And we are working closely with the Mercer teams to localize Darwin further, as well as encourage the next wave of change in benefits digitization and globalization
I hope you find this report helpful and insightful, wherever you may be on your own global benefits journey.
Chris Bruce Managing Director
Chris was a benefit consultant when he co–founded Thomsons. His role spans every aspect of the business, from engaging with clients to the development of DarwinTM software. This means he is in close contact with HR and reward professionals globally, understanding the changing benefit landscape.

6 | Global Employee Benefits Watch 2017/18
Executive SummaryThe next wave of benefits globalization and digitalization is here.The evidence is clear; the pace and scale of change in global benefits has been rapid. The number of organizations with a mature, technology-enabled approach is up again this year, with nearly 60% of multinationals having a defined approach to global benefits. This means those now leaving it to local markets to define their approach have become a minority.
There is a clear trend for greater alignment as organizations form new benefits strategies that support their changing business objectives and culture (85% of respondents now align their benefits program to business and people strategies). And organizations already doing this are having far greater success in the running of and engagement with their benefits. For example, those with a global benefits strategy in place for three-plus years are seven times more likely to rate themselves as very effective at achieving their objectives.
The other major trend is the adoption of a clear HR and technology infrastructure to deliver global benefits. The increase in adoption of global or regional shared service centers, global human capital management (HCM) and global benefits technology to run benefits and provide better experience for employees are all on the rise too. And, as with those with a more globally-driven and better aligned strategy, the increase in engagement, governance and administration outcomes are clear. They are:
• Three times more likely to see a reduction in administration errors;• Twice as likely to see a reduction in overcharges; and• An increase in operational efficiency.
The report findings are clear - benefits now truly sit in the global and digital domains. This increase in a global approach to benefits management is no surprise given the top objectives for benefits professionals remain attraction, engagement and wellbeing – all contributing to a better employee experience and a more consistent culture around the world.
The findings in the first chapter report on the latest in the global benefits best practice blueprint, which gained prominence in the 2016/17 report. It is good to see its continued development, adoption and business impact, and organizations at the cutting edge have now evolved the blueprint further. These employers are bringing in the next wave of global benefits transformation and our research shows this is driving two key outcomes: the benefits shift from reward to experience, and the focus on analytics and a data-driven approach.
Global Employee Benefits Watch 2017/18 | 7
Benefits shift from reward to experienceFindings from both our latest employer and employee surveys has shown real momentum for changing the emphasis of benefits away from reward, to wellbeing and experience that focus on shorter-term needs as well as help promote a culture and working environment within which people thrive.
Those organizations with a more mature strategy, powered by technology, are 60% more likely to have wellbeing strategies in place and have greater success in driving employee satisfaction.
Analytics: hope is not a strategyThe second is in the area of analytics where, once again, the early adopters of the technology-enabled approach to global benefits are now reaping the rewards of having globally consistent data available to them.
These HR teams are much more likely to have good data available quickly and, as a result, are able to harness it to drive better measurement of their programs and influence key outcomes, such as budgeting, vendor management and, ultimately, employee engagement. By laying the foundations of the blueprint a few years ago, they have gained further competitive advantage over those employers with a localized and technology-light approach.
In fact, the ability to measure different components of a global benefits program is having the biggest impact on effectiveness in governance and outcomes. These HR teams are:
• Twice as likely to budget and predict global costs;• Twice as likely to be offering benefits employees want;• 95% more likely to be offering benefits that impact and drive strategic business
objectives.
The findings in this year’s report consistently support that it is only the early adopters – who have ridden all three waves – that are heralded as the market leaders in global benefits and employee experience. However, technology is no longer the reserve of the HR functions of the world’s top employers as more and more organizations catch up. For the next wave of benefits management it is clear that benefits globalization and digitization is becoming a must have for all. Our latest research has firmly established that the next wave of benefits globalization and digitalization is here.

8 | Global Employee Benefits Watch 2017/18
IntroductionNow in its fourth year, our Global Employee Benefits Watch continues to track the major trends in global benefits management, helping HR and reward professionals learn from the best and provide clear insights for those looking to follow in their footsteps.Last year, we adopted the term ‘global benefits blueprint’ to describe the set of attributes the leading employers consistently demonstrated that contributed to their success. This year, our research set out to challenge this blueprint further to ascertain whether it really represents a best practice approach, to discover if more organizations are adopting it, and to measure what impact its adoption continues to have on their business.
To do this, we asked questions covering both the inputs to and outputs of success, including objectives and initiatives, use of different technologies and communications, together with administration, risk, governance and engagement metrics to see where respondents ranked against their peer group.
In total, we had over 400 responses from HR and benefits professionals from organizations across all regions, of many sizes and all major industry sectors. In addition, we surveyed over 2,000 employees from multinational employers to get an insight into their view of the benefits they receive, what they value and how well they are delivered. Their responses were released in our recent whitepaper and are also woven into our findings here to give as complete a picture as possible of global benefits in 2017.
These findings have been distilled into three sections, which provide a complete picture of how to deliver great global benefits:
• The evolution of the global benefits blueprint – identifying which of the core initiatives in global benefits delivery contribute most directly to success and how they have shifted and changed in the last 12 months;
• The shift from reward to experience – how both employers and their people are placing less emphasis on the traditional, big-ticket items and now improving day-to-day experience and wellbeing are the new focus;
• Analytics, and how hope is not a strategy – discovering how those with a technology-enabled approach to global benefits are already making headway in the use of analytics to drive decision-making and how it is helping them significantly out-perform others in terms of benefits management and business impact.
In building as complete a picture as possible, this fourth edition of Global Employee Benefits Watch is the largest and most robust yet – something we believe our readers can rely on to help shape strategy and next steps in this space.

10 | Global Employee Benefits Watch 2017/18

Global Employee Benefits Watch 2017/18 | 11
Evolution of the global benefits blueprintWhen Thomsons Online Benefits set out on the mission to transform the global benefits market, it seemed that there was a very set and traditional way multinationals were going about creating a globally consistent approach to benefits. It seemed, at the time, to be heavily focused on trying to achieve consistency in benefits design, together with a common approach to how the benefits, mainly insurances, were financed and risk was managed.
Then the market started to see the early signs of adoption of a very different approach to global benefits. The appetite for consistency of design started to diminish as benefits professionals recognized the increasing disparity in local market practice, legislation and taxation of benefits. And though cost and risk management were seen as good practice, they weren’t seen to be delivering any differentiation or value to the organization for the sizable investment in benefits.
The most forward-thinking organizations started to look at the use of technology in this space with a new focus, on creating a great experience for the employee to enrol into and engage with their benefits, whilst providing the infrastructure for the HR or benefits team to follow the broad trend to be as lean as possible in running benefits. This is where Global Employee Benefits Watch established the blueprint for success:
• A global benefit’s strategy that is aligned to the organization’s people strategy• An HR shared service centre all benefits administration• A global HCM and benefits technology platform that automates • Consumer-grade benefits communications and access for employees through
mobile devices• Measurement of all areas of the global benefits program and analytics to
inform decision making
Below, we explore how that blueprint is evolving, together with how its adoption is increasing, to see where we can validate this new approach to global benefits. As well as understand where it is evolving and what else might be influencing success amongst multinational employers and their approach to benefits.

12 | Global Employee Benefits Watch 2017/18
More organizations look to the futureHR professionals are under great pressure as they rally to drive and support business change. Challenges such as more diverse workforces with different needs, unprecedented, disruptive technological change and a growing productivity challenge, have all put HR teams at center stage.
Market momentum as well as research suggests that benefits are rising up both the employee and global business agenda2,3. There has never been a more pressing time for HR and reward professionals to put employee benefits at the heart of the employee experience that their organizations are seeking to shape. HR teams are recognizing that they need to focus on agile employee benefits, integrated to their HR approach to properly support their people strategy in serving the business. With HR now actively building very different organizational ecosystems and networks from the past4, they need global benefits with the systems and technology to support new approaches, not stand in the way.
Through Global Employee Benefits Watch, Thomsons has tracked organizations’ increasingly global approach to managing their benefits and has demonstrated that there are clear advantages of devising, articulating and rolling out a globally consistent strategy5 with the processes, systems and technology in place to support it.
To do this, plans and principles for global benefits are imperative. We see a step change in the proportion of organizations putting in place a global strategy this year. As shown in Figure 1, the proportion of employers with a robust strategy has gone up by around a third (from 25% to 34%). The proportion of employers who don’t yet have a strategy in place but are planning one has also risen, from 22% to 28%.
Evolution of the global benefits blueprint
2. Thomsons Online Benefits, Expectations vs reality: the widening gap in global benefits 20173. Mercer ‘Global Talent Trends Report’, 2017.4. Deloitte, ‘Rewriting the rules for the digital age’, 2017.5. Thomsons Online Benefits, ‘Global Employee Benefits Watch Report 2016/17’ 2016.
The group of employers with a robust strategy has gone up by around a third, from 25% to 34%.

Figure 1. Employers with a defined global benefits strategy, 2016 vs. 2017 The below graph gives us insight into where organizations think they are in their own global benefits strategy evolution. There is a clear fall in organizations that have no plans to develop a global strategy and an increase in those who are implementing strategies for three years or more, in the past year.
Don’t know No, no plans Yes for three years or more
Yes, for less than three years
No, but planning
8.2%4.8%
22.3%
27.7%24.9% 23.2%
2017 2016
25.3%
33.6%
19.3%
10.7%
The number of organizations who are not considering a global benefits strategy has almost halved – from 28% to 16% in just one year (Figure 1) – as more recognize the importance of keeping up with the market in order to ensure a competitive people and talent retention strategy.
As a result of adopting and implementing global benefits strategies, these organizations are becoming more successful in achieving their objectives. Putting a global strategy into place appears to lead to a big leap in effectiveness (Figure 2). Organizations are four times more likely to be effective or very effective by simply establishing a global approach.
The number of organizations who are not considering a global benefits strategy has almost halved – from 28% to 16% in just one year.
14 | Global Employee Benefits Watch 2017/18
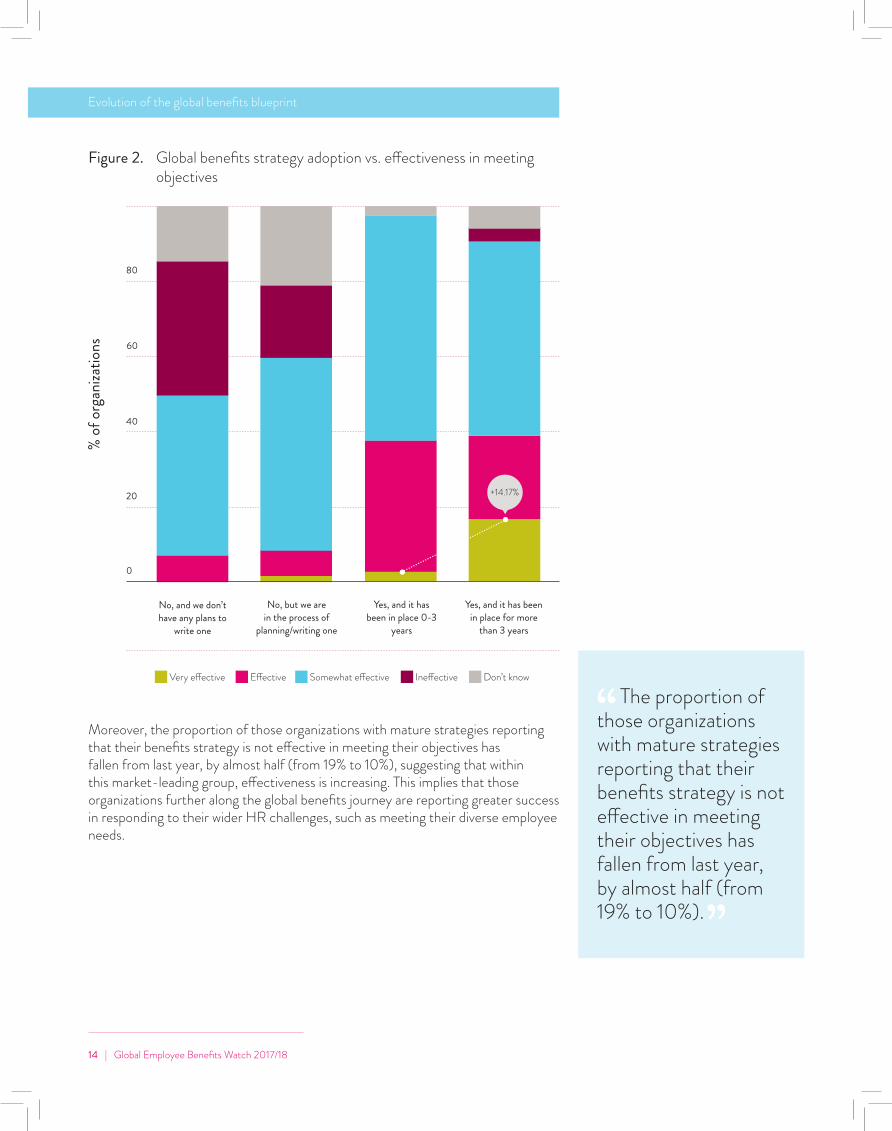
Figure 2. Global benefits strategy adoption vs. effectiveness in meeting objectives
Moreover, the proportion of those organizations with mature strategies reporting that their benefits strategy is not effective in meeting their objectives has fallen from last year, by almost half (from 19% to 10%), suggesting that within this market-leading group, effectiveness is increasing. This implies that those organizations further along the global benefits journey are reporting greater success in responding to their wider HR challenges, such as meeting their diverse employee needs.
Evolution of the global benefits blueprint
The proportion of those organizations with mature strategies reporting that their benefits strategy is not effective in meeting their objectives has fallen from last year, by almost half (from 19% to 10%).
% of
org
aniza
tions
20
40
60
80
0
Very effective Ineffective Effective Don’t know Somewhat effective
No, and we don’t have any plans to
write one
No, but we are in the process of
planning/writing one
Yes, and it has been in place 0-3
years
Yes, and it has been in place for more
than 3 years
+14.17%

Global Employee Benefits Watch 2017/18 | 15
The importance of strategy alignmentOur research shows a clear correlation between implementing a global benefits strategy and improved outcomes. However, working in a ‘benefits silo’ will not help any organization gain traction and really lever the value of its employee benefits; it needs to align and support the wider people strategy to create a distinct employee experience.
Fitness benefits in one country, for example, are unlikely to bear fruit unless part of a considered, holistic approach to employee wellbeing across the whole organization. Other examples of successful alignment include introducing innovative new benefits in support of an organization-wide talent acquisition strategy, or introducing a workplace savings vehicle that supports employee mental wellbeing.
It seems HR and reward professionals are seeking greater impact through alignment and in Figure 3 we can see that the proportion stating that their benefits and people strategies are very much aligned has grown by more than a third on last year. Those reporting a lack of alignment – plus those who don’t know if they have alignment – has almost halved (from 26% to 14%).
Figure 3. Degree of alignment of an organizations’ global benefits strategy to their people strategy compared to 2016
Don’t know Not Aligned Very much alignedSomewhat aligned
13.8%
5.2%
53.2% 52.8%
2017 2016
33.2%
20.8%
12.2%8.7%

16 | Global Employee Benefits Watch 2017/18
This is unsurprising when we see that strategic alignment is tied to achieving successful business outcomes. Figure 4 shows that none of the organizations reporting a lack of alignment state that their benefits strategy is very effective. On the other hand, more than one fifth of those with a very-much aligned strategy do. Those organizations reporting that their strategies are at least somewhat aligned are at least 50% more likely to report effectiveness than those with no alignment.
Figure 4. Alignment of global benefits strategy vs. effectiveness in meeting objectives
Evolution of the global benefits blueprint
These results should not come as too much of a surprise, they back up years of HR research on the importance of alignment in delivering corporate objectives. However, it is interesting to examine the relative impact on effectiveness of both alignment with people strategy and the maturity of an organization’s approach to global benefits.
Figure 4 shows that it is alignment that makes the biggest impact on effectiveness, even where an organization has only just started to put an explicit strategy in place.
% of
org
aniza
tions
20
40
60
80
0
Very effective Ineffective Effective Don’t know Somewhat effective
Don’t know Not aligned Somewhat aligned Very much aligned
+20.6%
+33%
Global Employee Benefits Watch 2017/18 | 17
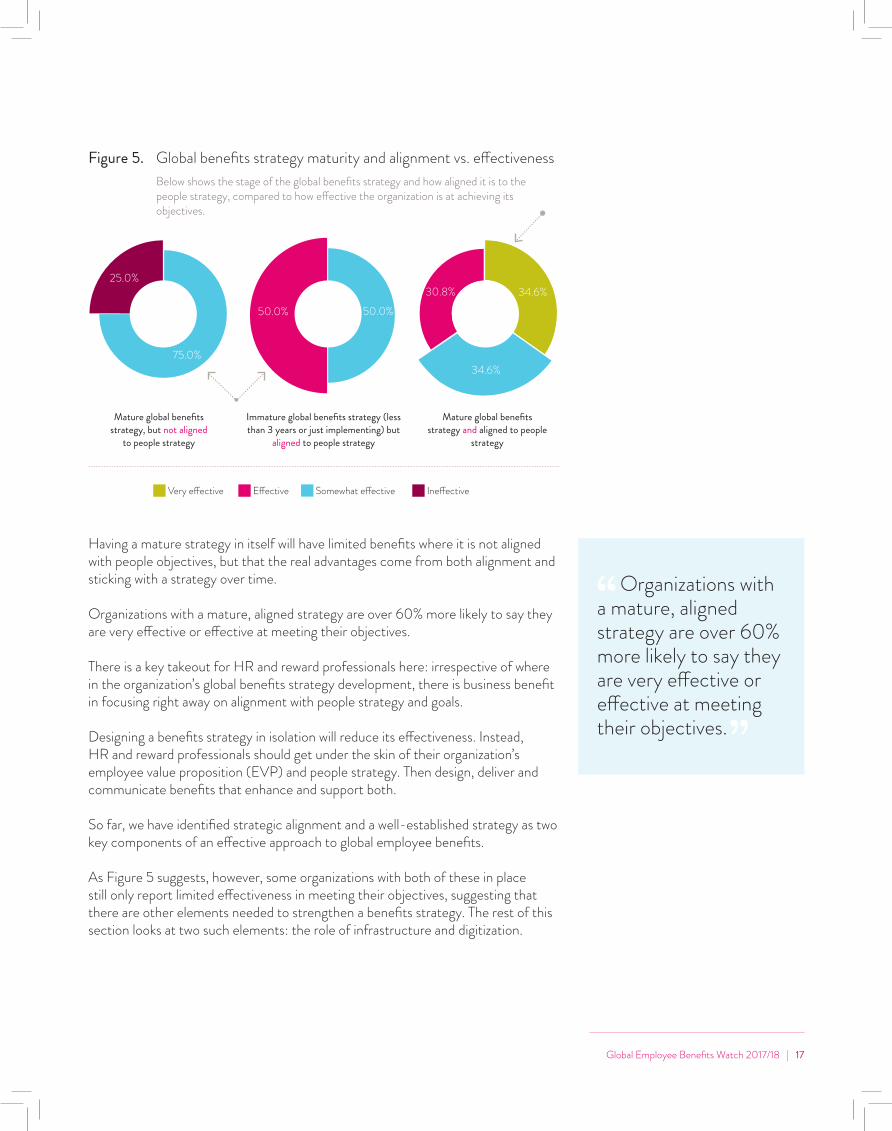
Having a mature strategy in itself will have limited benefits where it is not aligned with people objectives, but that the real advantages come from both alignment and sticking with a strategy over time.
Organizations with a mature, aligned strategy are over 60% more likely to say they are very effective or effective at meeting their objectives.
There is a key takeout for HR and reward professionals here: irrespective of where in the organization’s global benefits strategy development, there is business benefit in focusing right away on alignment with people strategy and goals.
Designing a benefits strategy in isolation will reduce its effectiveness. Instead, HR and reward professionals should get under the skin of their organization’s employee value proposition (EVP) and people strategy. Then design, deliver and communicate benefits that enhance and support both.
So far, we have identified strategic alignment and a well-established strategy as two key components of an effective approach to global employee benefits.
As Figure 5 suggests, however, some organizations with both of these in place still only report limited effectiveness in meeting their objectives, suggesting that there are other elements needed to strengthen a benefits strategy. The rest of this section looks at two such elements: the role of infrastructure and digitization.
Figure 5. Global benefits strategy maturity and alignment vs. effectiveness Below shows the stage of the global benefits strategy and how aligned it is to the people strategy, compared to how effective the organization is at achieving its objectives.
Organizations with a mature, aligned strategy are over 60% more likely to say they are very effective or effective at meeting their objectives.
Very effective Ineffective Effective Somewhat effective
Mature global benefits strategy, but not aligned
to people strategy
Immature global benefits strategy (less than 3 years or just implementing) but
aligned to people strategy
Mature global benefits strategy and aligned to people
strategy
50.0%50.0%
25.0%
75.0%34.6%
34.6%30.8%

18 | Global Employee Benefits Watch 2017/18
6. Thomsons Online Benefits, ‘Expectations vs. reality: the widening gap in global benefits’, 2017.
Evolution of the global benefits blueprint
The value of focusing your impact on the employee
Our research indicates that while employee attraction and engagement remain top benefits priorities (Figure 6), wellbeing has appeared in the top three for the first time. This result is also reflected in our recent global employee survey6 where more than 80% stated their workplace had a negative impact on their wellbeing, with a significant employee demand for wellbeing programs coming through.
Findings showed that those employers with a global benefits strategy that has been in place for more than three years are more likely to focus on objectives that really add value to their EVP – such as enhancing employee engagement and promoting employee wellbeing.
For example, three times as many respondents with a mature strategy in place put ‘promote employee health and wellbeing’ as their number one objective.
Figure 6. Global benefits objectives
20 40 60 80 0
Support global maturity
Drive individual performance
Reinforce corporate culture
Drive business performance
Promote employee health and wellbeing
Enhance employee engagement
Attract and retain talent
% of organizations who have this as a global benefits objective
Our research indicates that while employee attraction and engagement remain top benefits priorities (Figure 6), wellbeing has appeared in the top three for the first time.

Attracting and retaining talent remains important across the board but, those with a mature strategy, having invested in articulating and implementing a global strategy, are delivering against other objectives such as ‘enhancing employee engagement’ and ‘promoting employee wellbeing globally’.
It appears that organizations with a mature strategy, which have essentially gone through the transformation phase of implementing global benefits by putting infrastructure and goals on a global footing, are taking advantage of this momentum and focusing on the types of initiative that enable them to really differentiate their employee proposition.
They appear to be shifting the focus from benefits to experience, something we will explore further in the next chapter of this report.
The balancing-act between ambition and realityAlthough the objectives of most respondents have focused on the employee, and the role of benefits in attracting them, engaging them and promoting their wellbeing, employers are still in a very different place when it comes to the initiatives they are running which focus on:
• Tighter control of global costs• Reducing data and operational risk• Consistent global governance
Given that attracting and engaging employees is such a focus of HR and reward professionals’ objectives, there is a disconnect in the actual initiatives in place. Figure 7 shows that the focus is more around how organizations administer benefits, rather than how they are creating or delivering benefits that can transform the employee experience.
Those with a mature strategy, having invested in articulating and implementing a global strategy, are delivering against other objectives such as ‘enhancing employee engagement’ and ‘promoting employee wellbeing globally’.

20 | Global Employee Benefits Watch 2017/18
However, over half (55%) of organizations who have a mature global benefits strategy in place are prioritizing benefits that can impact employee experience, such as global wellbeing programs, compared to only a third (32%) of those who have no strategy or a less mature one in place. Our findings lead us to conclude that this is because these organizations are still at the start of their journey and are therefore focusing most of their effort on getting robust global benefits governance in place before they can invest in and implement value-add initiatives.
Figure 7. Key initiatives within organizations’ global benefits strategy The below graph shows the key initiatives that HR and reward professionals said were within their global benefits strategy. It is evident that the majority of organizations are on the journey to implementing robust global benefits governance as the top initiatives are all around cost, risk and decision-making processes.
Evolution of the global benefits blueprint
Over half (55%) of organizations who have a mature global benefits strategy in place are prioritizing benefits that can impact employee experience, such as global wellbeing programs
% of organizations
20 40 60 80 0
Globally consistent employee experience
Automating administration
processes
Consistent global governance (i.e. one view of benefits data
Reducing data and operational risk
Tighter control of global costs
Lower priority initative Not an initiative Higher priority initative

Global Employee Benefits Watch 2017/18 | 21
Americas APAC EMEA
Figure 8. Key initiatives within organizations’ global benefits strategy, by region The below graph shows the key initiatives that HR and reward professionals said were within their global benefits strategy, broken down by region. Securing robust global governance is a top priority across all regions, nudged underneath by process automation and HR Shared Service (HRSS) alignment in the APAC region.
Consistent global governance (i.e. one views of benefits data)
Alignment to global shared service model
Global employee wellbeing programs
Tighter control of global costs
Automating administration processes
Reducing global insurance risk
Tighter management of vendors
56.6%63.3% 54.6%
39.6%53.3% 31.5%
43.4%43.3% 41.7%
41.5%73.3% 47.2%
47.2%36.7% 37.9%
67.9%63.3% 53.7%
45.3%50.0% 36.1%
71.7%76.7% 63.9%
Rducing data and operational risk
Globally consistent employee experience 43.4%50.0% 49.1%

22 | Global Employee Benefits Watch 2017/18
Evolution of the global benefits blueprint
As shown in Figure 8, the region in which organizations are headquartered also has an impact on the initiatives within their strategy. Automating administrative processes is a key initiative for organizations headquartered in APAC, alongside complementary initiatives on consistent global governance and aligning to a shared service model globally. In the Americas, there is a greater focus on reducing data and operational risk; and in EMEA, HR teams are more likely to focus on employee experience, rather than governance.
Embracing a lean HR approach for benefitsLast year we found that when organizations implement both an HR shared service (HRSS) center and a technology solution to run their benefits programs, they were more likely to achieve success against their global benefits objectives. The results show that the combination of HRSS and global technology is allowing benefits teams to be much leaner, by reducing the administration burden without sacrificing the employee experience.
Wider HR studies confirm the continued rise in use of HRSS centers. Moving support functions to shared services has been identified as the biggest area of planned organizational change over the next two years according to Mercer’s 2017 Talent Report7.
While the benefits of this streamlined approach to HR administration are far-reaching, they are particularly strong for global benefits because they provide the opportunity for HR and benefits programs to mutually support each other, saving time and money as well as increasing responsiveness to employees along the way.
More people are adopting an HR shared service modelFigure 9 suggests that there has been an increase year-on-year in the amount of organizations with an HR shared service model in place.
As the move to HRSS models increases, Figure 10 also shows that so does the adoption of a global approach to benefits. Likewise, the more mature an organization’s global benefits strategy, the more likely they are to have shared services in place.
7. Mercer ‘Global Talent Trends Report’, 2017.
There has been an increase year-on-year in the amount of organizations with an HR shared service model in place.

Figure 9. HR shared service center global implementation stage, year-on-year comparison
The amount of organizations that have adopted an HR shared service model is increasing year-on-year. Additionally, the chart shows the group of HR and reward professionals who say that they are not considering this approach is reducing and has halved in two years.
Yes, globally or in some regions
No plans to introduce it in the near future No, but planning on introducing it in the next 12 months
% of
org
aniza
tions
20
40
60
80
0
2015 2016 2017 2018?

24 | Global Employee Benefits Watch 2017/18
Figure 10. HR shared service center global implementation stage vs. global benefits strategy maturity
The graph shows how established organizations’ global benefits strategy is compared to their adoption of an HR shared service model.
No, and we don’t have any plans to
write one
No, but we are in the process of and/or
planning on writing one
Yes, and it has been in place for 0 to 3
years
Yes, and it has been in place for more
than 3 years
Don’t know Yes, it’s live globally or in some regions
No, and no plans to introduce it in the near future No, but planning on introducing in the near future
Global strategy adoption
Evolution of the global benefits blueprintEvolution of the global benefits blueprint
As Figure 11 shows, organizations with a global benefits strategy that has been in place for over 3 years:
• Are four times more likely to have globally implemented HR shared services (8.3% of organizations without a global benefits strategy have an HR shared service model, compared to 41.4% with a mature global benefits strategy).
• 32.7% of organizations are very effective or effective at meeting their global benefits objectives when they have HR shared services in place, compared to 4.8% where they don’t.
• 33.3% of organizations with no plans to implement a shared services model are ineffective at meeting their global benefits objectives, compared to 5.3% of those with one in place.
% of
org
aniza
tions
20
40
60
80
0

Global Employee Benefits Watch 2017/18 | 25
Figure 11. HR shared service center global implementation stage vs. how effective organization is at meeting their global benefits objectives
Very effective Effective Somewhat effective Ineffective Don’t know
This illustrates a mutual reinforcement between having a global benefits strategy and the HR infrastructure to deliver it. An HRSS model seems to provide the most efficient practical way to lever the value employers need from their benefits on a global basis.
% of
org
aniza
tions
20
40
60
80
0
HR shared service centre in place
No plans to intoduce
Introducing

26 | Global Employee Benefits Watch 2017/18
Globally consistent technology is proving its worth
Given the complexity and diversity of benefits around the world, they have traditionally been considered difficult, if not impossible, to manage globally. As a result, they have been left behind and are now the last wave of the HR digital revolution.
Businesses cannot afford to continue processing benefits manually while digitizing the rest of HR, neglecting the savings and employee engagement opportunities that technology can bring. The impetus around employee engagement as well as rapidly advancing new technology solutions now gives HR and reward leaders the tools that enable them to put benefits at the heart of their employee relationship.
As more embrace this change, those organizations who do not are falling behind. And this chasm between the haves and have nots - and the difference in benefit strategy outcomes - will just get bigger.
Evolution of the global benefits blueprint
These organizations who are leading the way are also taking the advantage offered through global technology, such as a reduction in HR admin times of 30%
Global Employee Benefits Watch 2017/18 | 27
% of
org
aniza
tions
20
40
60
80
0
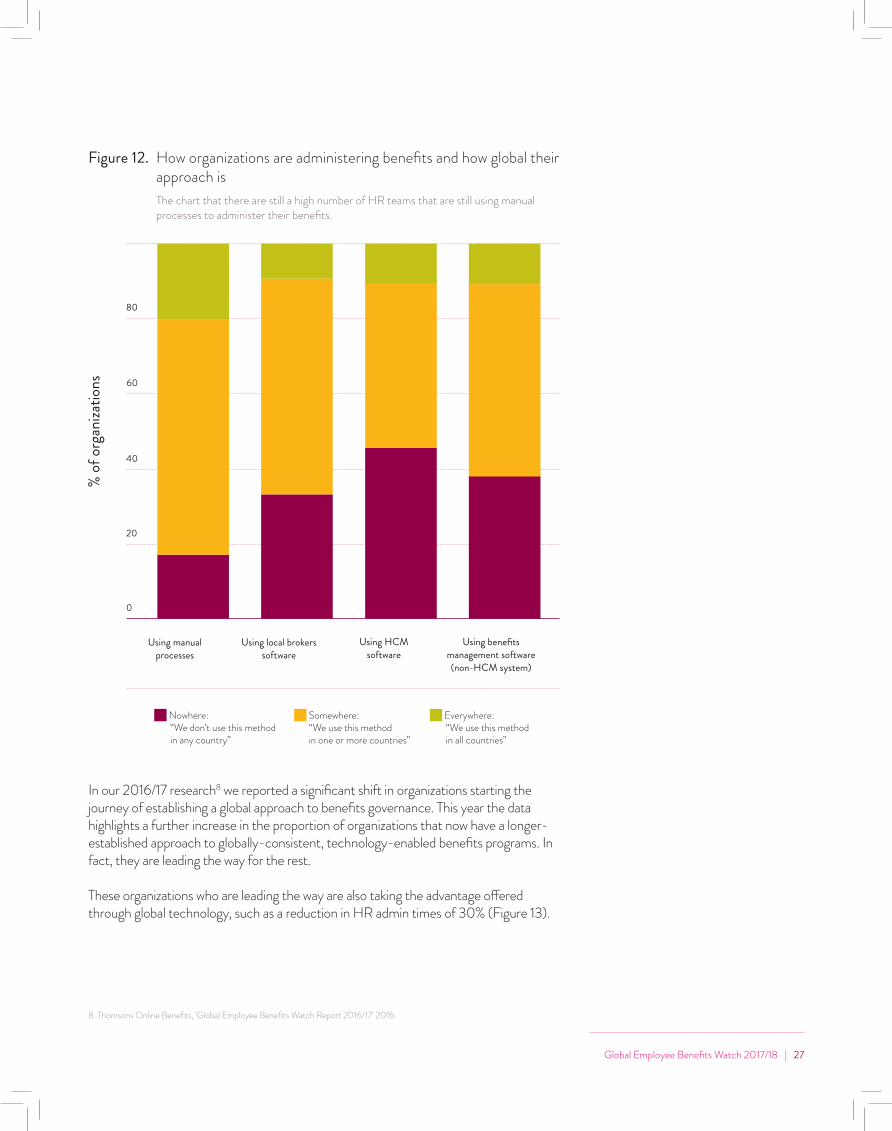
In our 2016/17 research8 we reported a significant shift in organizations starting the journey of establishing a global approach to benefits governance. This year the data highlights a further increase in the proportion of organizations that now have a longer-established approach to globally-consistent, technology-enabled benefits programs. In fact, they are leading the way for the rest.
These organizations who are leading the way are also taking the advantage offered through global technology, such as a reduction in HR admin times of 30% (Figure 13).
Figure 12. How organizations are administering benefits and how global their approach is
The chart that there are still a high number of HR teams that are still using manual processes to administer their benefits.
Using manual processes
Using local brokers software
Using HCM software
Everywhere: “We use this method in all countries”
Somewhere: “We use this method in one or more countries”
Nowhere: “We don’t use this method in any country”
Using benefits management software (non-HCM system)
8. Thomsons Online Benefits, ‘Global Employee Benefits Watch Report 2016/17’ 2016.

28 | Global Employee Benefits Watch 2017/18
Figure 13. Benefits administration model used vs. how long it takes benefits team to administer the offering each month (per country)
The graph below shows the average time it takes the benefits team to administer the benefits offering each month per country, broken down by the way benefits are administered and whether this is used everywhere, somewhere or nowhere. It is clear the globally rolled out benefits technology has the biggest impact on reducing administration times.
Evolution of the global benefits blueprint
9. Thomsons Online Benefits, ‘Global Employee Benefits Watch Report 2016/17’ 2016.
Using manual processes
Using local brokers software
Using HCM software
Using benefits management software (non-HCM system)
14
18
22
10
12
16
20
24
Everywhere: “We use this method in all countries”
Somewhere: “We use this method in one or more countries”
Nowhere: “We don’t use this method in any country”
Aver
age n
umbe
r of d
ays p
er m
onth
per
coun
try
Additionally, in our 2016/17 research9, only 14% of organizations reported using global benefits management software. In this year’s research, 62% of organizations report using benefits management somewhere in their business, with one in six of these saying they are using the technology globally.
The most interesting findings show how different approaches impact an organization’s ability to deliver their programs. Our research looked at this from the point of view of the time taken to administer benefits and the effectiveness in delivering administration and compliance objectives.
It takes the benefits team on average 16 days per month per country to administer their benefits when benefits technology is used globally, compared to an average of 21.3 days without automation

The results in Figure 13 clearly suggest that using benefits software globally significantly reduces the time spent administering benefits and increases effectiveness. For example, it takes the benefits team on average 16 days per month per country to administer their benefits when benefits technology is used globally, compared to an average of 21.3 days without automation.
Global consistency of use seems to be the common factor in achieving success. It is the combination of a global strategy and the technology to underpin it that appears to result in the greatest efficiency gains.
This approach gives both the consistency and data needed to ensure full control and measurement. Our findings also showed that those with an established global strategy plus technology are nearly three times more likely to see a reduction in admin errors and nearly twice as likely to see a reduction in overcharges and an increase in operational efficiency.
As technology enables organizations to bring consistency to their benefits globally, the findings show just how much of an impact it can have on a global basis to lever greater effectiveness.
The benchmark set by those following the blueprintSo, can we really prove that organizations are more successful when they have a mature global strategy closely aligned to people objectives, with HRSS centers in all geographical regions of their business and use benefits management software across all of their jurisdictions?
Figure 14 shows the approach to global benefits management of two different organizations, grouped by the areas of best practice that we have discussed so far in this report. The blueprint refers to those who have a mature, very aligned global strategy, HRSS centers live globally and use benefits management software across all of their locations. The findings reveal that:
• Those organizations adopting best practice are having significantly more success and 100% consider that they were effective or very effective in meeting their objectives
• Ratings fall dramatically to just 16.4% where no aspects of the blueprint are followed.
Those with an established global strategy plus technology are nearly three times more likely to see a reduction in admin errors and nearly twice as likely to see a reduction in overcharges and an increase in operational efficiency.

30 | Global Employee Benefits Watch 2017/18
Figure 14. Approach to global benefits management vs. employers who said they were very effective or effective at global benefits management.
Organizations following the blueprint
Benefits tech and nothing else from blueprint
Blueprint minus benefits technology
100%
58.8%
50%
16.4%
Organizations not following the blueprint
Evolution of the global benefits blueprint

Figure 15. Organizations who have/have not adopted the global benefits blueprint vs. how effective they are in areas of benefits administration and risk management
We are successful at this in some or all countries
This is neither a success nor challenge for us
This is a challenge for us in some or all countries
20 40 60 80 0
Accurate and timely vendor invoicing
Accurate and timely payroll reporting
Benefit eligibility management
Handling employee queries
Securely storing and transferring data
Access to auditable records
Complying with local regulations and laws
(including data protection)
Not following blueprint
Following best practice blueprint
Not following blueprint
Following best practice blueprint
Not following blueprint
Following best practice blueprint
Not following blueprint
Following best practice blueprint
Not following blueprint
Following best practice blueprint
Not following blueprint
Following best practice blueprint
Not following blueprint
Following best practice blueprint

32 | Global Employee Benefits Watch 2017/18
We broke down the feedback employers gave us to determine what effectiveness really meant in benefits management. The results show a clear increase in employer’s confidence and success when they had an established mature strategy, global technology and have the processes in place to support their global benefits management.
As Figure 15 shows: Across all areas of benefits management, organizations are more than twice as likely to be successful in some countries if their best practice blueprint is adopted.
Challenges around benefits admin and risk management arise a lot more frequently in all or some countries for those who are not adopting the blueprint (average twice as likely) Figures 16 and 17 show how organizations adopting the global benefits blueprint are demonstrating far more positive results through its adoption. For example, 100% said they had noted positive impacts to their business (as opposed to only 80% of those not adopting best practice). And they were almost twice as likely to report an increase in operational efficiency as a result of their benefits administration. They are also seeing higher employee engagement scores through effective global benefits management, as shown in Figure 17.
Best practice group Non-best practice group
Positive impact on your profit loss 25.0% 20.5%
Increase in operational efficiency 56.3% 30.3%
Reduction in administrative errors 62.5% 23.6%
Reduction in overcharges 25.0% 14.9%
None of the above 0% 20.5%
Figure 16. Blueprint adoption vs. percentage of employers who have noticed these positive effects to their business
Evolution of the global benefits blueprint
Across all areas of benefits management, organizations are more than twice as likely to be successful in some countries if the best practice blueprint is adopted.

Global Employee Benefits Watch 2017/18 | 33
Figure 17. Effectiveness of global benefits management vs. employee engagement scores
The below bar chart shows how the degree to which an organization is successful at global benefits management has an impact on their employee engagement scores. For example, it has an average engagement impact of over 20% by being very effective at achieving global benefits objectives.
Very effective
Effective
Somewhat effective
Ineffective
77.7%
69.1%
66.0%
56.3%
Throughout this chapter the results have shown that the adoption of a technology-enabled, defined approach to global benefits continues at pace and that, as that strategy continues to develop and be refined, it is delivering powerful results for those that have followed it.
Not all elements need to be adopted for either immediate or long-term success, but the right combination of these elements for any multinational organization is a significant improvement in the two major success areas for global HR and benefits teams – much higher global employee engagement scores and demonstrably better administration and management of benefits.
The evolution of global benefits best practice is a complex picture and a true balancing act for HR and reward professionals. It also requires strong alignment to the direction of the business and innovation in new approaches, as well as technological investment. It is at this point organizations can then look to transformational benefit programs that differentiate and deliver competitive edge.
Organizations adopting the global benefits blueprint are demonstrating far more positive results through its adoption. For example, 100% said they had noted positive impacts to their business (as opposed to only 80% of those not adopting best practice).

34 | Global Employee Benefits Watch 2017/18

Global Employee Benefits Watch 2017/18 | 35
Benefits shift from reward to experienceAs with many walks of life and business, first the foundations or infrastructure are built, and then the next phase of growth and transformation starts to present itself. And so it is with global benefits strategy.
Thomsons’ Global Employee Benefits Watch has historically focused on how to deliver great global benefits, rather than what those benefits should be. However, in last year’s research there was an emergence of some trends towards a more consistent approach to benefits design. These will be explored in this chapter, as well as a look into any early insights into the next wave of global benefits – because, sure enough, the early ripple is starting to emerge.
It is evident that once again it is those organizations that led the first wave of global benefits strategy through technology adoption, who now are showing the earliest results in focusing their attention on this new benefits philosophy.
The shift has moved away from reward, but it is important to note that traditional benefits are not being removed and replaced. There is still a role for healthcare, retirement and protection to play in effective benefits strategy – but what we are seeing is a new prioritization from both employers and employees. Focus has shifted onto wellbeing and the experience they receive, in utilizing their benefits day-to-day and supporting shorter-term needs than those traditional benefits sought to.
This trend was uncovered in Thomsons’ recent research of over 2,000 global employees that formed the whitepaper, ‘Expectations and reality: the widening gap in global benefits’10. Results showed that benefits that help employees stay physically and financially healthy, offer them advice, help them manage childcare or improve their career development are those that they are likely to interact with on a regular basis, creating both higher engagement and greater return on investment for the employer.
Put simply, the new money and thinking is being put into global wellbeing and experience programs for benefits.
10. Thomsons Online Benefits, ‘Global Employee Benefits Watch Report 2016/17’ 2016.

36 | Global Employee Benefits Watch 2017/18
The voice of the employeeIn our recent employee research11, we found that employees rated benefits higher than the nature of their job role, their colleagues or organization culture in influencing their loyalty. Those employees who said ‘my benefits meet my needs’ were twice as likely as those who disagreed with this to recommend their employer to a friend, be proud to work for their organization or report a positive working experience.
This strong link between employee benefits and engagement may be partly because of growing health and financial worries amongst employees. Health (61%), wealth (23%) and then career (16%) figured as the three top employee priorities regardless of geography or generation in the latest Mercer Talent Trends Global Report12.
Aligning benefits to employees’ life goals and short-term needs, which collectively represent their wellbeing, is critical to ensure they truly engage with what is on offer. For most employees whose lifestyles and aspirations have changed, our research has uncovered that the majority of employers haven’t evolved their benefits at the same pace in two key ways:
Firstly, the research uncovered that benefits programs are not supporting the short-term needs of younger generations. For example, 67% of 26–35 year olds have the goal to buy a home, whereas only 11% of benefits plans support this13. There is also a cross-generational need for support around physical and mental wellbeing, like the benefits that improve employees’ day-to-day experiences, such as office yoga classes and debt counselling.
Additionally, organizations who are supporting their employees as individuals through well-designed benefits are much more likely to be achieving high engagement with their program. For example, employees who were happy with their benefits program were 76% more likely to be making use of the wellbeing initiatives at work .
Secondly, employees rated communication as one of the biggest influences in whether their needs were met by their benefits offering. They were also 31% more likely to say that their benefits best met their needs when they were accessed through an online portal (regardless of the actual benefits being offered).
Benefits shift from reward to experience
11. Thomsons Online Benefits, ‘Expectations vs. reality: the widening gap in global benefits’, 2017.12. Thomsons Online Benefits, ‘Expectations vs. reality: the widening gap in global benefits’, 201713. http://www2.cipd.co.uk/pm/peoplemanagement/b/weblog/archive/2011/06/06/well-being-is-the-key-to-employee-engagement-2011-06.aspx
67% of 26–35 year olds have the goal to buy a home, whereas only 11% of benefits plans support this.

Global Employee Benefits Watch 2017/18 | 37
In order to meet employee needs, it is important for HR teams to recognize technology has a dual role in supporting engagement around benefits. Not only does it enable employers to provide choice, flexibility and benefits on-demand in a practical sense, it can hugely enhance the overall employee experience. Employers should also listen to their employees preferences and leverage technology to communicate (and give access to) benefits that actually support employees’ wellbeing, both inside and outside of the workplace.
The new-found prominence of wellbeingResults from our employee research showed the negative impact work and the workplace generally has on employees’ wellbeing (Figure 18).
Only 1 in 10 employees said that their workplace had a positive impact, meaning organizations are sending 9 out of 10 people home every day with a worse disposition than they started the day with. Yet, the relationship between fostering wellbeing and workforce productivity and performance has been clear for a long time now14.
Figure 18. Employees’ wellbeing at work The below graph shows the significant negative impact that the workplace is having on employees’ wellbeing. This was rated by over 2,200 employees from multinational organizations.
My workplace has a very negative impact on my wellbeing
My workplace has a very positive impact on my wellbeing
27% 28%
6% 4%
35%
21 3 4 5
14. http://www2.cipd.co.uk/pm/peoplemanagement/b/weblog/archive/2011/06/06/well-being-is-the-key-to-employee-engagement-2011-06.aspx
Employees who said ‘my benefits meet my needs’ are 31% more likely to be accessing their benefits through an online portal.

38 | Global Employee Benefits Watch 2017/18
Given that our employer research shows that only 40% of employers have wellbeing as a priority initiative in their benefits strategy, there is clearly a disconnect here between the employer offering and employee expectation, which employers need to grasp. Those employers who have transformed their strategy, systems and governance are already putting a greater emphasis on wellbeing.
As discussed at the start of this chapter, those organizations who have adopted the blueprint have the foundations in place to evolve and develop their benefit strategies and they are doing just that. As Figures 19 and 20 show, they are twice as likely to have already implemented wellbeing programs globally and close to 80% of them have rolled it out in at least some regions.
And, due to the technology-enabled approach they have adopted in the blueprint, not only are they more likely to have implemented global wellbeing initiatives, they are also significantly more likely to be measuring them as well, versus those who still don’t have a mature global strategy in place.
20 40 60 80 0
Employees’ physical and mental wellbeing
Considered, but decided not to implement Not considering implementation Implemented in all countries
Considering implementation Implemented in some countries In the process of implementing
Immature/No strategy
Mature
Figure 19. Following the blueprint versus adoption of wellbeing initiatives The below graph shows where wellbeing initiatives have been implemented compared to how long the global benefits strategy has been in place. Those with a global benefits strategy that has been in place for 3+ years with the tech to support it are significantly more likely to have wellbeing initiatives in place. This is important to meet employees’ demands for more support from their employer around wellbeing.
Benefits shift from reward to experience

Global Employee Benefits Watch 2017/18 | 39
Figure 20. Following the blueprint vs. measurement of wellbeing impact The below bar chart shows that when an organization is measuring all elements of their global benefits program they are significantly more likely to be rolling out global wellbeing programs. We will explore why this is in chapter 3, however it is important to note here that it is those organizations who have the tech in place to measure the impact of their benefits program who are more likely to be responding to the employee need for wellbeing.
Lower priority initative Not an initiative Higher priority initative
20 40 60 80 0
Global employee wellbeing programs
In terms of what those employers are doing consistently, it is great to see in Figure 21 the focus on financial wellbeing beyond retirement, rather than just the traditional focus on physical wellbeing, as most initiatives have directed their attention to in the past. Financial concerns have a large impact on mental health and supports the top employee priorities regardless of geography or generation health (61%) and wealth (23%)15.
Not following blueprint and measuring some
Following best practice blueprint and measuring all
Figure 21. Global wellbeing initiatives adopted by employers Here we can see all the global wellbeing benefits programs on offer and the percentage of employers offering them. There is a clear prominence of financial wellbeing campaigns, which is promising to see considering the impact of financial stress on mental health. Which will be impacting employees’ ability to carry out their job.
Financial support (outside of pensions) 34.8%
Flexible wellness allowance 31.8%
Counselling services 30.4%
27.8%Gym membership
21.0%Fitness classes
Sports teams 17.3%
15. Mercer ‘Global Talent Trends Report’, 2017.
40 | Global Employee Benefits Watch 2017/18
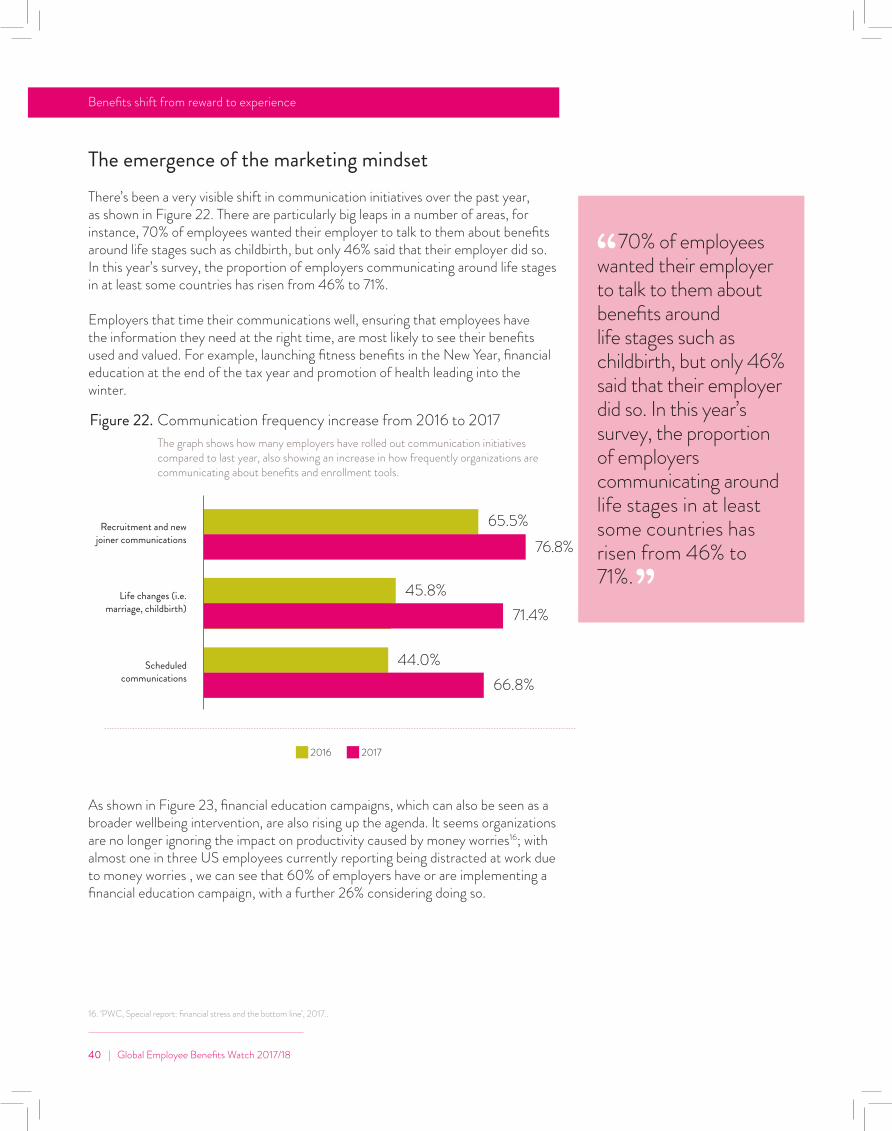
The emergence of the marketing mindsetThere’s been a very visible shift in communication initiatives over the past year, as shown in Figure 22. There are particularly big leaps in a number of areas, for instance, 70% of employees wanted their employer to talk to them about benefits around life stages such as childbirth, but only 46% said that their employer did so. In this year’s survey, the proportion of employers communicating around life stages in at least some countries has risen from 46% to 71%.
Employers that time their communications well, ensuring that employees have the information they need at the right time, are most likely to see their benefits used and valued. For example, launching fitness benefits in the New Year, financial education at the end of the tax year and promotion of health leading into the winter.
Figure 22. Communication frequency increase from 2016 to 2017 The graph shows how many employers have rolled out communication initiatives compared to last year, also showing an increase in how frequently organizations are communicating about benefits and enrollment tools.
Scheduled communications
Life changes (i.e. marriage, childbirth)
Recruitment and new joiner communications
65.5%76.8%
45.8%71.4%
44.0%66.8%
2017 2016
As shown in Figure 23, financial education campaigns, which can also be seen as a broader wellbeing intervention, are also rising up the agenda. It seems organizations are no longer ignoring the impact on productivity caused by money worries16; with almost one in three US employees currently reporting being distracted at work due to money worries , we can see that 60% of employers have or are implementing a financial education campaign, with a further 26% considering doing so.
Benefits shift from reward to experience
16. ‘PWC, Special report: financial stress and the bottom line’, 2017..
70% of employees wanted their employer to talk to them about benefits around life stages such as childbirth, but only 46% said that their employer did so. In this year’s survey, the proportion of employers communicating around life stages in at least some countries has risen from 46% to 71%.
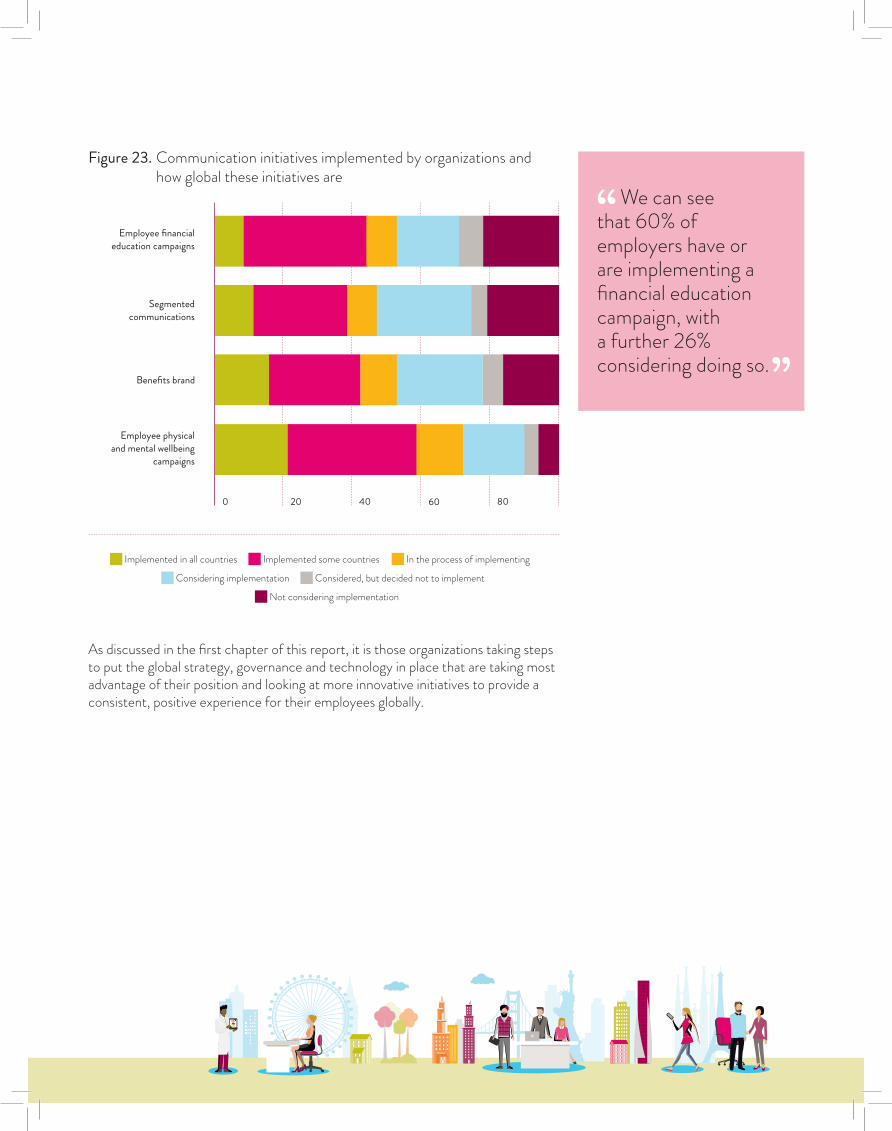
Figure 23. Communication initiatives implemented by organizations and how global these initiatives are
As discussed in the first chapter of this report, it is those organizations taking steps to put the global strategy, governance and technology in place that are taking most advantage of their position and looking at more innovative initiatives to provide a consistent, positive experience for their employees globally.
20 40 60 80 0
Employee physical and mental wellbeing
campaigns
Benefits brand
Segmented communications
Employee financial education campaigns
Implemented in all countries In the process of implementing Implemented some countries
Considering implementation Considered, but decided not to implement
Not considering implementation
We can see that 60% of employers have or are implementing a financial education campaign, with a further 26% considering doing so.

42 | Global Employee Benefits Watch 2017/18
The role of technology in engagementPeoples’ habits have changed and technology now touches every part of their lives at work and on the move - there are now 6.4 billion connected devices in use worldwide. This trend is referred to as ‘the device mesh’, and in their 2016 technology predictions Gartner stated it has the potential to ‘profoundly impact an organization’s long-term plans, programs and initiatives’.
Creating a consumer experience – mirroring the technology-enabled, responsive experience employees are increasingly accustomed to outside of the workplace – is now not just a nice-to-have but a core driver of a positive workplace experience. So to what extent have employers adopted the new communication tools available to them to maximize their investment on benefits, and how much they are doing so on a globally-consistent basis?
While we can see in Figure 24 that there is healthy uptake across a range of modern communication tools (with 56% using or in the process of implementing total reward statements, for example), only a minority of employers are using these tools consistently on a global basis (Figure 25). In the 2016/17 report, 70% of employees said they would like access via their mobile devices compared to 51% who currently had this option.
As we have already seen, although mobile access is requested from employees, Figure 24 shows no change in mobile phone access to benefits since 2016/17.
As many organizations are currently still either administering a lot of their benefits manually (see Figure 11) or don’t have a global strategy in place (Figure 1) it appears they are also still lagging behind on technology-enabled benefits communication. Nevertheless, the importance of mobile access is being recognized, with almost a third considering offering mobile access, as seen in Figure 25.
Benefits shift from reward to experience
There is healthy uptake across a range of modern communication tools (with 56% using or in the process of implementing total reward statements, for example), only a minority of employers are using these tools consistently on a global basis

Global Employee Benefits Watch 2017/18 | 43
Figure 24. Communication tools – a year-on-year comparison The below graph shows how many employers have rolled out these communication tools compared to last year. There has certainly been an increase in those using enrollment tools and single sign-on log ins.
2017 2016
Mobile apps
Access from mobile devices
Single sign-on logins
Benefit enrollment tool
Totlal reward statements
51.0%68.7%
45.3%61.8%
50.5%50.2%
37.2%37.1%
56.5%56.3%
Those employers who have a mature benefits strategy are 42% more likely to be enabling mobile access. Meaning they have the opportunity to embrace digitization and truly deliver a consumer-grade, on-demand benefits experience that meets their employee expectations if they harness integrated technology.
As the latest Global Human Capital Trends report from Deloitte17 notes, an explosion of digital and mobile tools can help HR and benefits professionals design and deliver a great employee experience, but the lack of integration between them suggests that the focus on end-to-end employee experience is still new. If employers are to move benefits from reward to experience, they need to ensure they have more than just individual tools; they need to have the global governance and processes in place to deliver an end-to-end seamless experience.
Those employers who have a mature benefits strategy are 42% more likely to be already enabling mobile access.
17. Deloitte, ‘Rewriting the rules for the digital age’, 2017.

44 | Global Employee Benefits Watch 2017/18
Figure 25. Communication tools employers are implementing and how global their approach is
The chart below shows what communication tools HR and reward teams are using to communicate their benefits and how global their approach is. Benefits enrollment tools and single sign-on logins are the most widely used communication tools globally or locally.
20 40 60 80 0
Single sign-on logins
Total reward statements
Benefit enrollment
Access from mobile devices
Mobile apps
Implemented in all countries In the process of implementing Implemented some countries
Considering implementation Considered, but decided not to implement
Not considering implementation
The marketing mindset and successOur 2016/17 research18 concluded that those organizations who are adopting a marketing mindset to benefits communications were moving the needle on success.
By adopting a marketing mindset, and: continuously communicating (at life changes and at scheduled intervals), using a variety of digital tools (TRS, mobile apps, single sign-on, access from mobile, benefits enrolment tool) and a variety of initiatives (wellbeing campaigns, benefits brand, segmented communications) organizations significantly improved their employees’ awareness of the benefits on offer and experienced greater engagement as a result.
Benefits shift from reward to experience
18. Thomsons Online Benefits, ‘Global Employee Benefits Watch Report 2016/17’ 2016.

Figure 26. Adoption of marketing mindset vs. how successful employers are at benefits communications
The graph shows the comparison between two approaches to benefits communications: those following a marketing mindset and those who are only implementing some areas. This is then compared to how effective organizations are in different areas of benefits communications.
We are successful at this in some or all countries This is neither a success or challenge for us
This is a challenge for us in some or all countries
20 40 60 80 0
Not following marketing mindset
Following marketing mindset
Enabling employees to
make good benefits decisions
Improving employee
understanding of the value of
benefits
Making employees aware
of the benefits on offer
Encouraging employees to
take up benefits on offer
Not following marketing mindset
Following marketing mindset
Not following marketing mindset
Following marketing mindset
Not following marketing mindset
Following marketing mindset
It is clear from Figure 26 that those organizations who have adopted a marketing approach to benefits communications are now seeing real tangible results in evolving their benefit strategy and design even further.

46 | Global Employee Benefits Watch 2017/18

Global Employee Benefits Watch 2017/18 | 47
For too long, a myriad of complex factors and influences has dictated benefits professionals’ approach to benefits management, resulting in more time spent on tactical rather than strategic activities based on insight from hard data. In ‘the balancing act between ambition and reality’ our research evidenced the disconnect between benefits teams’ aspirations and the realities of how their time is actually spent.
Lack of benefits data proves problematic in many ways. Especially when health and protection benefits are due for their annual renewal, as HR teams are frequently unable to prove that they can predict or intervene in spiraling benefit costs. As a result, compromises have to be made – either the credibility of the HR team or the benefit plan design and employee satisfaction along with it.
In last year’s report we evidenced the advances that HR teams with a mature, global approach to benefits were making in the way they are using data to their advantage. However, considering the infrastructure needed to enable this level of maturity, it was only the minority who were embracing the ripple of change.
An emerging theme from this year’s research is that the ripple has become a wave. The progress being made with data and analytics is happening at a far quicker rate than previous waves, almost like Moore’s Law. Market-leading organizations who caught the previous waves in digitization are leading the way as they have the infrastructure required to build upon. They are fully utilizing the technology they have in place as a tool to measure all elements of their benefits program.
It is clearly no coincidence that this wave is happening at a time when those leading organizations are fundamentally changing their approach to benefits design from reward to experience. These HR and reward teams are able to take a consumer-like approach – taking the data from their benefits program to understand employee journeys and outcomes, whilst focusing on wellbeing. This is enabling them to be far more personal in the benefits they offer, than simply aiming for positive health outcomes. None of this can exist without data and analytics.
Analytics: Hope is not a strategy

48 | Global Employee Benefits Watch 2017/18
From foresight to insight for the early adoptersSo what distinguishes those organizations better able to measure the impact of their global benefits from the rest? Having explored the extent to which employers measure benefits globally and how greater access to data enables them to focus more on the employee experience, we now examine the approach taken to technology and infrastructure by data leaders.
Figure 27. Benefits administration approach and ability to report globally on benefits trends
The graph shows what systems the best practice group – those measuring all elements of their benefits program as outlined in the previous section – are using compared to those organizations who are not measuring in all areas.
20 40 60 80 0
Using HCM software
Using local brokers
software
Using manual processes
Using Benefits management
software (non-HCM system)
Everywhere: “We use this method in all countries”
Somewhere: “We use this method in one or more countries”
Nowhere: “We don’t use this method in any country”
Not following blueprint and measuring some
Following best practice blueprint and measuring all
Not following blueprint and measuring some
Following best practice blueprint and measuring all
Not following blueprint and measuring some
Following best practice blueprint and measuring all
Not following blueprint and measuring some
Following best practice blueprint and measuring all
Analytics: Hope is not a strategy
The best practice group (those measuring all areas of their benefits programs) are much more likely to be using digital systems, but the key differentiator is that they are using it on a global, rather than country, level.

As Figure 27 shows, the best practice group (those measuring all areas of their benefits programs) are much more likely to be using digital systems, but the key differentiator is that they are using it on a global, rather than country, level. While the proportion using global benefits technology is the same across both groups, almost half (47%) of the best practice group use this method globally – more than eight times the rest. A similar pattern is found for HCM software.
Not only does systems approach play its part, location does too. As Figure 28 shows, APAC-headquartered organizations are most likely to report against all the measures listed. This isn’t surprising, when organizations in APAC are also the most likely to be demonstrating a high proportion of the best practices that make up the blueprint – including having a mature, very aligned global strategy, global HRSS centers and benefits management software across all of their locations.
The chart also shows that while they fall behind significantly in the areas of engagement and retention, organizations headquartered in the Americas are the most likely to be measuring and analyzing costs today. This suggests a different emphasis in approach, one that leans more towards cost control and administration efficiencies.
It is interesting to see in Figure 28 that EMEA continues to lag behind both the Americas and APAC in terms of measurement. Again, considering differences in culture, employment practices and benefits philosophy, this could be expected. However, those organizations who are not measuring the impact of their benefits programs (particularly those in EMEA), are well behind those who are driving results.
It is interesting to see in Figure 28 that EMEA continues to lag behind both the Americas and APAC in terms of measurement.

50 | Global Employee Benefits Watch 2017/18
Americas APAC EMEA
Figure 28. Organizations’ approach to measuring the impact of their global benefits program by region The chart shows how organizations in the APAC region are much more likely to measure the impact on employee engagement, while in the Americas the impact on HR overhead spend is seen as the most important measure.
Employee satisfaction with benefits programs
Benefits programs’ takeup levels
Impact on business performance
Impact on wellbeing
Impact on recruitment
Impact on HR overhead spend
Impact on employee retention
Impact on employee engagement
75.5%76.0% 70.6%
77.4%80.0% 73.4%
43.4%56.0% 47.7%
60.4%68.0% 55.9%
54.7%64.0% 50.5%
41.5%68.0% 57.8%
56.6%80.0 66.9%
84.9%80.0% 61.5%
Analytics: Hope is not a strategy

Figure 29. Year-on-year comparison of how long it takes organizations to report on global benefits
The graph shows that more organizations can report in under two hours compared to last year – this number has doubled.
Currently I can’t report on global benefits costs
More than a month
More than a week
3-7 days
1-2 days
2 to 7 hours
In less than 2 hours 5.3%10.7%
14.0%11.9%
15.9%14.1%
14.0%15.8%
18.8%16.9%
5.3%5.1%
2017 2016
54.4%26.6%
It is promising to see that there has been progress since last year, with a doubling of employers with access to real-time global benefits data and a reduction in the number of HR teams that take over a week to get access to their global costs.

52 | Global Employee Benefits Watch 2017/18
Although technology is clearly having an impact on organization’s ability to measure the impact of their benefits program, Figure 29 shows that 26.6% of organizations still cannot report on global benefits costs, while it takes another 16.9% more than a week to do so. So not only are organizations unable to report on these costs, but those that can, do it inefficiently and use up significant resources on administration in the process. The majority of HR and reward professionals appear to still make decisions without the information to help inform them.
However it is promising to see that there has been progress since last year, with a doubling of employers that have access to real-time global benefits data and a reduction in the number of HR teams that take over a week to get access to their global costs. A great improvement, but it is still only doubling from 5% to 10% of all organizations. As identified consistently in this report, it is only employers in this small minority who caught the previous waves of benefits digitization early on that are now reaping the benefits – only those with a mature approach to global benefits management have the capability to get access to accurate global benefits cost data.
HR and reward professionals clearly have appetite to measure and analyze, but the capability to implement the required tools and process is lagging behind. This is further evidenced in Mercer’s latest study19, which demonstrates the capability gap in ‘data analytics and predictive modeling’: where both HR and employees rate it in the top three in-demand skills in short supply for the coming 12 months.
Analytics: Hope is not a strategy
19. Mercer ‘Global Talent Trends Report’, 2017
As identified consistently in this report, it is only employers in this small minority who caught the previous waves of benefits digitization early on that are now reaping the benefits – only those with a mature approach to global benefits management have the capability to get access to accurate global benefits cost data.

Global Employee Benefits Watch 2017/18 | 53
With new data comes fresh thinkingWhen looking at how measuring different elements of a global benefits program impacts the success of its delivery there are two key trends:
Firstly, as Figure 30 shows, the simpler elements of a global benefits program are being measured by the majority – 70% of organizations are tracking take-up, spend, satisfaction and engagement on at least a local level. This gives clear indicators for those organizations at the start of their journey on where to start in order to get access to a full suite of benefits data.
Figure 30. Global breadth of approach to benefits program measurement The chart shows how employers are measuring the effect of their global benefits. Most are measuring in some countries, rather than across all office locations.
20 40 60 80 0
Employee satisfaction with benefits programs
Impact on employee engagement
Benefit programs’ take-up levels
Impact on business performance
Impact on wellbeing
Impact on employee retention
Impact on recruitment
Impact on overhead spend
Everywhere: “We measure this in all countries”
Somewhere: “We measure this in one or more countries”
Nowhere: “We don’t measure this in any country”

54 | Global Employee Benefits Watch 2017/18
Secondly, as shown in Figure 31, those employers who are measuring all areas of their benefits program listed in Figure 30 on a global scale are those who have adopted all, or most of, the blueprint, in terms of HRSS, global HR and benefits technology and the other enablers of success. No one without these hallmarks for success is measuring in a globally consistent way today, suggesting you cannot have a mature data and analytics strategy without having adopted the systems and technology first.
Figure 31 provides further evidence that those following the blueprint are outperforming organizations that are not when it comes to their approach to measuring benefits. They are not only better at areas of benefits management, such as reducing the administration burden for their teams (nearly 40% more likely to prioritize this initiative), they have also made the biggest leaps in the prioritization and measurement of:
• Wellbeing programs – more than double (over 90%) of those following the blueprint cite it as a top priority; and
• Employee experience – nearly 40% more of the organizations following the blueprint are focused on this initiative above other, more traditional areas.
The scale of transformation that those organizations are achieving is impressive – they are not making incremental improvements, they are fundamentally changing their approach to global benefits. This is meeting the employee needs and expectations for more wellbeing and experiential benefits that we explored in chapter two. This is a blueprint that others starting their journey can follow.
Analytics: Hope is not a strategy
Those measuring all areas of their benefits program are reducing the administration burden for their teams. They are nearly 40% more likely to prioritize this initiative. They have also made the biggest leaps in the prioritization and measurement of wellbeing programs – (over 90%) cite it as a top priority.
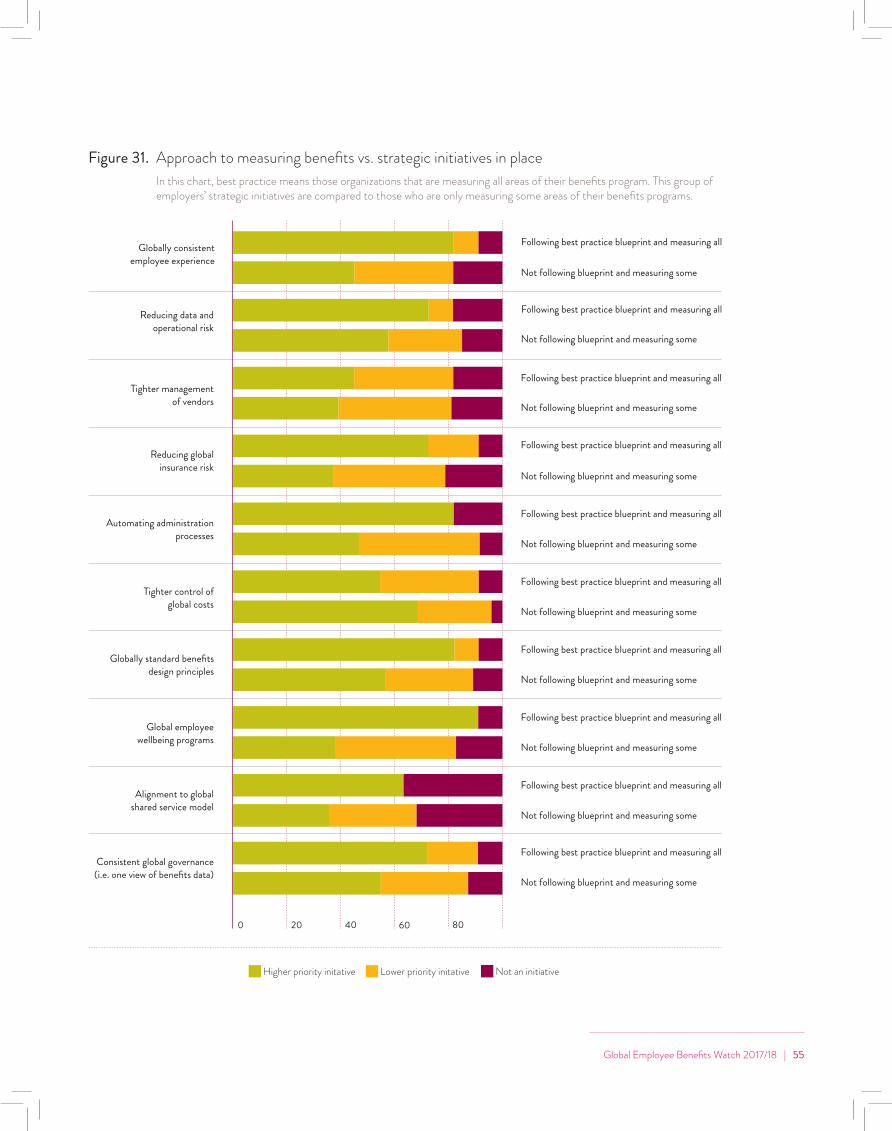
Global Employee Benefits Watch 2017/18 | 55
Figure 31. Approach to measuring benefits vs. strategic initiatives in place In this chart, best practice means those organizations that are measuring all areas of their benefits program. This group of
employers’ strategic initiatives are compared to those who are only measuring some areas of their benefits programs.
Lower priority initative Not an initiative Higher priority initative
20 40 60 80 0
Reducing global insurance risk
Reducing data and operational risk
Globally consistent employee experience
Not following blueprint and measuring some
Following best practice blueprint and measuring all
Tighter management of vendors
Automating administration processes
Tighter control of global costs
Globally standard benefits design principles
Global employee wellbeing programs
Alignment to global shared service model
Consistent global governance (i.e. one view of benefits data)
Not following blueprint and measuring some
Following best practice blueprint and measuring all
Not following blueprint and measuring some
Following best practice blueprint and measuring all
Not following blueprint and measuring some
Following best practice blueprint and measuring all
Not following blueprint and measuring some
Following best practice blueprint and measuring all
Not following blueprint and measuring some
Following best practice blueprint and measuring all
Not following blueprint and measuring some
Following best practice blueprint and measuring all
Not following blueprint and measuring some
Following best practice blueprint and measuring all
Not following blueprint and measuring some
Following best practice blueprint and measuring all
Not following blueprint and measuring some
Following best practice blueprint and measuring all

56 | Global Employee Benefits Watch 2017/18
Figure 32. How organizations measure the effect of their benefits program: year-on-year comparison
The graph shows what areas organizations are quantitatively measuring. It is promising to see that the increase this year in organizations measuring the impact of benefits has come in areas that are notoriously more difficult to measure. So they have certainly matured in their global benefits governance.
Benefit programs take-up levels
Employee satisfaction with benefits programs
Impact on HR overhead spend
Impact on employee retention
Impact on wellbeing
Impact on business performance
Impact on recruitment
3.4%18.0%
9.4%19.6%
11.6%18.8%
21.0%18.8%
22.7%31.2%
27.5%26.4%
34.8%22.4%
2017 2016
Impact on employee engagement
36.9%24.0%
Analytics: Hope is not a strategy
This suggests that some organizations are finding that with improved infrastructure and technology – the evolution of the blueprint we explored in chapter one – they are able to move into areas of reporting that few were implementing a year ago. For example, the impact on recruitment, where the proportion of organizations measuring data has increased from 3% to 18%.

It is also interesting to note how the measures employers report on have changed since last year. Figure 32 shows that while standard measures such as employee engagement and the take-up of benefits continue to be most widely used, the growth in measurement focus and capabilities isn’t found here. Instead, growth is in more impactful measures that prove ROI, such as impact on recruitment, wellbeing and business performance.
This suggests that some organizations are finding that with improved infrastructure and technology – the evolution of the blueprint we explored in chapter one – they are able to move into areas of reporting that few were implementing a year ago. For example, the impact on recruitment, where the proportion of organizations measuring data has increased from 3% to 18%.
Building to this level of reporting may seem daunting, and it is important for organizations to focus initially on what can be measured (and what can be delivered), for example administration and enrolment. Starting with the basics that are immediately available, such as take-up and satisfaction ratings, will make accelerating analytics into experience and wellbeing much easier and quicker when measurement capability and capacity has advanced.

58 | Global Employee Benefits Watch 2017/18
Figure 33. Effectiveness of each objective vs. approach to measurement The graph shows a comparison of those organizations who measure all areas outlined in the chart above and those who don’t. Showing how effective they are overall in meeting their objectives.
Benefit programs’ take-up levels
Impact on business performance
Impact on wellbeing
Impact on recruitment
Impact on HR overhead spend
Impact on employee retention
Impact on employee engagement
88.0%76.6%
Employees satisfaction with
benefits programs
68.1%
88.6%77.7%
71.0%
88.4%77.0%
61.4%
85.7%82.9%
67.7%
86.4%81.2%
68.1%
87.8%87.3%
66.1%
82.2%81.4%
60.0%
83.0%78.3%
66.7%
Everywhere: “We measure this in all countries”
Somewhere: “We measure this in one or more countries”
Nowhere: “We don’t measure this in any country”
Analytics: Hope is not a strategy
The mantra that remains true today – to measure is to manageOrganizations that were the first to adopt technology to effectively administer their global benefits program are firstly more likely to measure their objectives and impact, and secondly more likely to do so consistently globally, but are these organizations really getting anything back for their investment?
To find out, we examined their approach to measurement versus the ratings they gave us around how well their program is performing today.
In Figure 33 we can see that those organizations who are effectively measuring against each of their objectives, such as impact on employee engagement, retention and wellbeing are significantly more effective in achieving them. Most noticeably, those who are measuring their success against objectives by taking benefits data on a global scale. For example, those measuring the impact of their benefits program on employee engagement on a global scale are 20% more effective than those who are not measuring their success at all.
This backs up our earlier findings that confirmed global consistency has a big impact on outcomes so we reviewed organizations’ self-rated effectiveness against whether they measured specific impacts of their benefits programs across all countries, some countries or none.
Figure 34 shows how organizations felt they were performing against more detailed objectives and initiatives, such as benefits design and vendor management. We then compared this to their approach to measuring all aspects of their benefits program using the technology available to them. Once again, in all areas, those with a technology-enabled approach are leading the way.
There is a 20–30% increase across all KPIs which is a highly impactful way of demonstrating to the business the value of global benefits with consistent technology enabling it, but most importantly the ability to measure all areas of a benefits program.
Those who are measuring their success against objectives by taking benefits data on a global scale. For example, those measuring the impact of their benefits program on employee engagement on a global scale are 20% more effective than those who are not measuring their success at all.

60 | Global Employee Benefits Watch 2017/18
Figure 34. Ways organizations measure their global benefits program vs. how effective they are in different areas of global benefits governance
This graph breaks down how effective organizations are in different areas of global benefits governance and compares this to their approach to measurement. Those following best practice are a lot more likely to be successful in their global benefits governance.
20 40 60 80 0
Ability to scale for organizational growth
Consistent delivery of global benefits
Access to accurate data in one place (including cost and
take-up of benefits)
Demonstrating ROI to key stakeholders
Ensuring your vendors are delivering
Ability to budget and project future costs
Correct team size to manage global benefits
Offering benefits your employees want
Offering benefits that impact and/or drive your strategic
business objectives
Offering benefits that support your employees wellbeing
Not following blueprint and measuring some
Following best practice blueprint and measuring all
We are successful at this in some or all countries This is neither a success or challenge for us This is a challenge for us in some or all countries
Not following blueprint and measuring some
Following best practice blueprint and measuring all
Not following blueprint and measuring some
Following best practice blueprint and measuring all
Not following blueprint and measuring some
Following best practice blueprint and measuring all
Not following blueprint and measuring some
Following best practice blueprint and measuring all
Not following blueprint and measuring some
Following best practice blueprint and measuring all
Not following blueprint and measuring some
Following best practice blueprint and measuring all
Not following blueprint and measuring some
Following best practice blueprint and measuring all
Not following blueprint and measuring some
Following best practice blueprint and measuring all
Not following blueprint and measuring some
Following best practice blueprint and measuring all

Global Employee Benefits Watch 2017/18 | 61
Benefit programs’ take-up levels
Impact on business performance
Impact on wellbeing
Impact on recruitment
Impact on HR overhead spend
Impact on employee retention
Impact on employee engagement
0.51.2
Employees satisfaction with benefits programs
0.9
0.31.0
1.2
0.81.1
0.8
0.31.0
1.3
0.41.11.2
0.40.8
1.4
0.51.5
0.6
0.61.3
0.8
Everywhere: “We measure this in all countries”
Somewhere: “We measure this in one or more countries”
Nowhere: “We don’t measure this in any country”
Figure 35. Ways organizations measure their global benefits program vs. average number of negative impacts to their business
The graph shows respondents’ approach to measuring global benefits (from not at all to globally consistently) and the number of negative impacts they experience as a result of running their benefits program.
We asked respondents about the negative impacts they experience in running global benefits and, once again, those organizations who are much better at measurement are experiencing significantly fewer issues than the rest.

62 | Global Employee Benefits Watch 2017/18
As shown in Figure 33, the extent to which market-leading employers are measuring their approach and impact, correlates with much higher effectiveness and outcomes.
However, it is interesting to note the other side of the equation too. We asked respondents about the negative impacts they experience running global benefits and, once again, those organizations who are much better at measurement are experiencing significantly fewer issues than the rest (Figure 35).
The ability to measure impacts globally is an essential aspect of the best practice blueprint tested in this year’s report. Whether it is administration, costs, engagement or even business performance, those who measure are evidently the most effective at running global benefits.
These market-leading organizations are realizing the benefits of evolving their infrastructure and technology in a way that can provide them with access to the accurate, timely data they need. This means that they can leverage this data to both improve efficiency and governance, whilst also refining and improving the part that benefits play in shaping their employee’s experience (doing more to promote wellbeing, for example).
To reiterate the findings in chapter one, those who are measuring are doing so because they have the technology, approach and infrastructure to allow it.
Hope is not a strategy. Nor is employee experience just a ‘nice to have’. And technology doesn’t exist solely to improve administration. Technology brings together a modern, transformative approach to global benefits that aligns to a lean global approach to HR.

Global Employee Benefits Watch 2017/18 | 63
There you have it – the global benefits market is in its third wave of maturity, with the blueprint for success continuing to evolve and benefit technology/blueprint adoption showing no signs of slowing down.
Going back to where this all started, this year’s research shows that those who have adopted the first wave of change or our best practice global benefits blueprint are continuing to have the greatest success in running their benefit programs.
The evidence shows that nearly 60% of multinationals now have a defined, technology-enabled approach to global benefits. As a result, they are seeing improvements in engagement, governance and administration, namely they are:
• Three times more likely to see a reduction in administration errors;• Twice as likely to see a reduction in overcharges from carriers for cover and an
increase in employee engagement scores of nearly 20%.
In our 2016/17 Report, we had seen a much greater focus on employee experience, which has now established itself as the second major wave of global benefits best practice. This year, those leading the way (those quickest to adopt the first wave) have demonstrated a significant shift from benefits as a reward function to benefits as an experience and wellbeing function. This has been demonstrated by:
• The rise of wellbeing up the benefits team and the employee agenda, for example those following the blueprint are twice as likely to have implemented global wellbeing programs;
• The continued adoption of a more marketing-led approach to communications.
It is clear that administration and experience are now very well established attributes of a well-run global benefits program. What has also become apparent this year is the emergence of a third wave of change – the use of analytics for benefits.
The research has consistently proven that the early adopters have made great strides in this area and are able to better measure, adapt and, importantly, prove to the board the success of their benefits program all over the world. These HR teams are:
• Twice as likely to budget and predict global costs• Twice as likely to be offering benefits employees want • 95% more likely to be offering benefits that impact and drive strategic business
objectives.
Conclusion

64 | Global Employee Benefits Watch 2017/18
The message within this report for those employers who missed the last wave, is to be encouraged that market-leading organizations have given us all the global benefits blueprint for success to follow. This blueprint is no longer a nice to have, but now a necessity to attract and retain talent. For those who are riding the current wave of change, we look forward to seeing the further transformation of your approach. And finally for the market-leaders already thinking of the next one, let’s hope that’s what we can share in next year’s report.

Global Employee Benefits Watch 2017/18 | 65
MethologyA total of 441 global HR and reward professionals from multinational organizations took part in the Global Employee Benefits Watch survey in Q3 of 2017. Respondents completed an online questionnaire on the employee benefits they offer and their reward strategy and approach. Alongside the employer survey, Thomsons Online Benefits commissioned an employee survey which was completed by 2,265 employees working for multinational organizations of over 4,000 employees from around the globe.

66 | Global Employee Benefits Watch 2017/18
AppendixThomsons Online Benefits, ‘Global Employee Benefits Watch Report 2016/17’ 2016. 1, 2, 5, 6, 8, 9, 10. & 17.
Mercer ‘Global Talent Trends Report’, 2017. 3, 7, 15. & 18.
Deloitte, ‘Rewriting the rules for the digital age’, 2017. 4.
Thomsons Online Benefits, ‘Expectations vs. reality: the widening gap in global benefits’, 2017. 11. & 12.
http://www2.cipd.co.uk/pm/peoplemanagement/b/weblog/archive/2011/06/06/well-being-is-the-key-to-employee-engagement-2011-06.aspx 13. & 14.
‘PWC, Special report: financial stress and the bottom line’, 2017. 16.

Global Employee Benefits Watch 2017/18 | 67
About Thomsons Online BenefitsThomsons Online Benefits is a SaaS provider of global employee benefits and employee engagement software. It is a wholly owned subsidiary of Mercer, a global consulting leader in advancing health, wealth and career. Mercer is a wholly owned subsidiary of Marsh & McLennan Companies (NYSE: MMC).
Thomsons’ award-winning platform, Darwin™, is the global market leader for automated employee benefits administration. With over 1 million worldwide users, Darwin™ connects employees with their benefits in over 86 countries and 24 languages. By using the right combination of editions, Darwin™ provides a tailored solution to meet a variety of employee benefit and reward needs, including employee engagement, managing risk, controlling costs and streamlining benefits administration. Its ability to constantly evolve and cater for shifting workforce needs has made it the provider of choice for seven of the world’s top ten technology companies.
Thomsons has received 105 industry awards, including the prestigious Brandon Hall Group gold award for Best Advance in Rewards and Recognition Technology in 2015. Mercer and Thomsons combine world-class consulting and broking with innovative technology that is driving transformation in the way that benefits are designed, communicated and administered.
Matthew Gregson SVP Data & Analytics [email protected]
Matthew is responsible for driving global data and analytics strategy for Thomsons’ clients, partners and providers. Having worked at Thomsons for nearly 15 years, Matthew leads Thomsons’ thought leadership and proposition development, bringing insights from around the business, technology and benefits worlds to the fore for clients. In addition to leading our thinking, Matthew still works closely with many clients to help realize the benefits of our leading approach for them.

Global EmployeeBenefits Watch 2017/18Catching the next wave of globalization and digitization
[email protected]: thomsons.com
@ThomsonsOnline thomsons–online–benefits